Embed Size (px)
Citation preview

Photosynthesis
Learning Goals After completing this laboratory exercise you will be able to:
1. Observe the absorption spectrum of the pigment Chlorophyll using a spectroscope.
2. Describe the relationship between photosynthetic rate and light intensity.
3. Discuss the effectiveness of various colors of light for photosynthesis.
Introduction Photosynthesis is the process whereby the radiant energy of the sun is converted
into chemical potential energy of organic molecules. This process is responsible for
present life on this planet - it provides food, and therefore the energy source for nearly
all living things. The utilization of light energy as an energy source is found only in
certain photosynthetic organisms; a few bacteria, some protists, and, of course, plants.
Plants, in addition to their formation of high-energy foodstuffs from light energy, water,
and carbon dioxide, also produce oxygen, a gas essential for our life. In today's
experiments you will measure the formation of this "waste product" of plants using a
metabolism chamber with gas sensors. The equation :
CO2 + H2O + energy (CH2O)n + O2
can be used to represent the equation for photosynthesis when read from left to right or
for respiration when read from right to left. The two processes have many similarities
in their details but differ fundamentally in that respiration is a way of getting useful
energy out of organic molecules (CH2O)n while photosynthesis is a way of putting
energy into organic molecules for storage. Respiration occurs mainly in mitochondria in
the cell, photosynthesis in chloroplasts. Plant cells may be respiring and
photosynthesizing at the same time. Animals are dependent upon the photosynthetic
activity of plants and only respire.
At least three factors limit the rate of photosynthesis: temperature, light intensity
and CO2 concentration. At the biochemical level, water ordinarily does not limit the
rate of photosynthesis. Why? For light to be used, it must be absorbed by a pigment.
A pigment reflects some colors of light and absorbs other wavelengths of light. It is the
energy that is absorbed by the pigment, which is useful biologically. Chlorophyll is the
photosynthesis
respiration

pigment involved directly in photosynthesis. It reflects green light, which is why it
looks green, and absorbs at the red and blue ends of the spectrum. Other pigments in
plants absorb other wavelengths of light and, though they don't participate directly in
the photosynthetic reaction, they can apparently pass on the energy gained to
chlorophyll molecules. Thus these accessory pigments are also important in
photosynthesis.
Demonstration of Light Absorption by Pigments. (Demonstration by Laboratory Instructor) Light that is a mixture of all the
wavelengths we can see, appears white to us. A spectroscope separates light of
different wavelengths into a spectrum. View the white light of a tungsten lamp through
the spectroscope. Make a sketch of the spectrum. Solutions of leaf pigments which
have been extracted and separated are available next to the spectroscope. Now place
the solution containing the pigment between light source and spectroscope. Hold the
tube in place, view and make a sketch of the new spectrum. Are there any bands of
color missing from the original spectrum? These are absorption bands. Where are
these bands located? What conclusions can you make regarding the visible color of a
pigment and the color of light it absorbs?
The light absorbed by chlorophyll in an intact leaf is used to drive the chemical
reaction shown previously. That is, light energy is converted to chemical energy. This
conversion requires an assemblage of enzymes and other substances built into the
chloroplast. When chlorophyll has been extracted into solution, it still absorbs light, but
the energy cannot be captured as chemical energy. The light absorbed by the
chlorophyll is re-emitted as light of a longer wavelength. This is called fluorescence.
Hold a tube of chlorophyll extract so that bright light enters from its side with respect to
you, and you will see its fluorescence. What color is the re-emitted light?
You may use this property of fluorescence to determine the absorption spectrum
of a particular pigment molecule. Note that before a molecule that fluoresces can
fluoresce light, it must first absorb light.
1. Place a colored filter between the light source and the pigment sample. Does
the sample still fluoresce? If so, give it a relative rating such as +5 .
2. Now try another color and record its relative fluorescence response on the
illuminated sample.
3. Continue with your measurements of "relative" fluorescence emission and the
color of light illuminating the sample until you have tried and "rated" every
color filter available.
4. Draw a graph of your data with the relative fluorescence as the dependent
variable and the color of light (Red, Orange, Yellow, Green, Blue, Violet,
(ROYGBV) as the independent variable. This type of plot is called an

absorption spectrum. (You should be aware that the concentration of
pigment in this sample was carefully controlled. Too little pigment, no
visible fluorescence. Too much pigment, no fluorescence because of self
absorption).
Experimentation: Measurement of Oxygen Evolution. You will determine the effects of light intensity and light color on the photosynthetic
rate of plants.
Materials and Methods. You will observe respiration of a plant sample by placing it in the dark,
photosynthesis in the presence of light, and the effect of specific ranges of wavelength
(blue, green and red) on the rate of photosynthesis. You will use a light source and color
filters (plastic) for selecting the color of illumination light and a metabolic chamber with
gas sensors.
The metabolic chamber has both oxygen and carbon dioxide sensors to measure
any change in the concentration of those gases in the presence of a plant specimen. The
sensors are connected to a hub called Lab Quest Mini that connects to a computer and
allows you to see and record in real time the measurement of oxygen in the chamber.
This apparatus is sensitive and expensive, so please use caution when experimenting.
The software you will use with this set up is called Logger Liter/Logger Pro; it will
record data and create a graph while you experiment.
The oxygen sensor continually measures the oxygen concentration using a lead
anode, a gold cathode, and an electrolytic solution which carries a current produced in
proportion to the oxygen concentration, by the reduction of the oxygen molecules. The
oxygen sensor must be kept upright or it will not work properly and could be damaged.
It is the vertical sensor seen in the photo of your apparatus.
The carbon dioxide sensor is the horizontal sensor and uses infra-red emission to
measure the gas concentration in the tube between one end of the sensor tube where the
beam is generated and the other end where it is measured. The amount of infra-red
reaching the sensor at the end of the tube is inversely proportional to the concentration
of carbon dioxide because it is absorbed by carbon dioxide.
Respiration chamber, sensors and hub.

Part I. Light intensity and Photosynthesis
Experimental Procedure
A. Respiration rate measurement. (Plant samples ought to be in the dark respiring until
a steady state is reached before recording respiration.)
1. The respiration chamber system should be turned on, attached to a computer and
working properly. To set up the chamber and sensors:
We will be using leaves of Japanese Knotweed, Fallopia japonica, from the UMB
greenhouses. Examine a leaf and learn to distinguish the upper and lower
surfaces. The upper surface is shown in the image below.
Use scissors or a razor blade to cut a 5 x 5 cm square of leaf blade, moisten the
upper surface with water, and insert it into the chamber (you will have to roll it
into a cylinder to get it through the neck of the chamber). Using long forceps,
arrange it so that it adheres to the side wall of the chamber (the water will help
it stick). You want the piece of leaf to lie in a plane so you can measure the
Image courtesy of Dr. Jenn Forman Orth
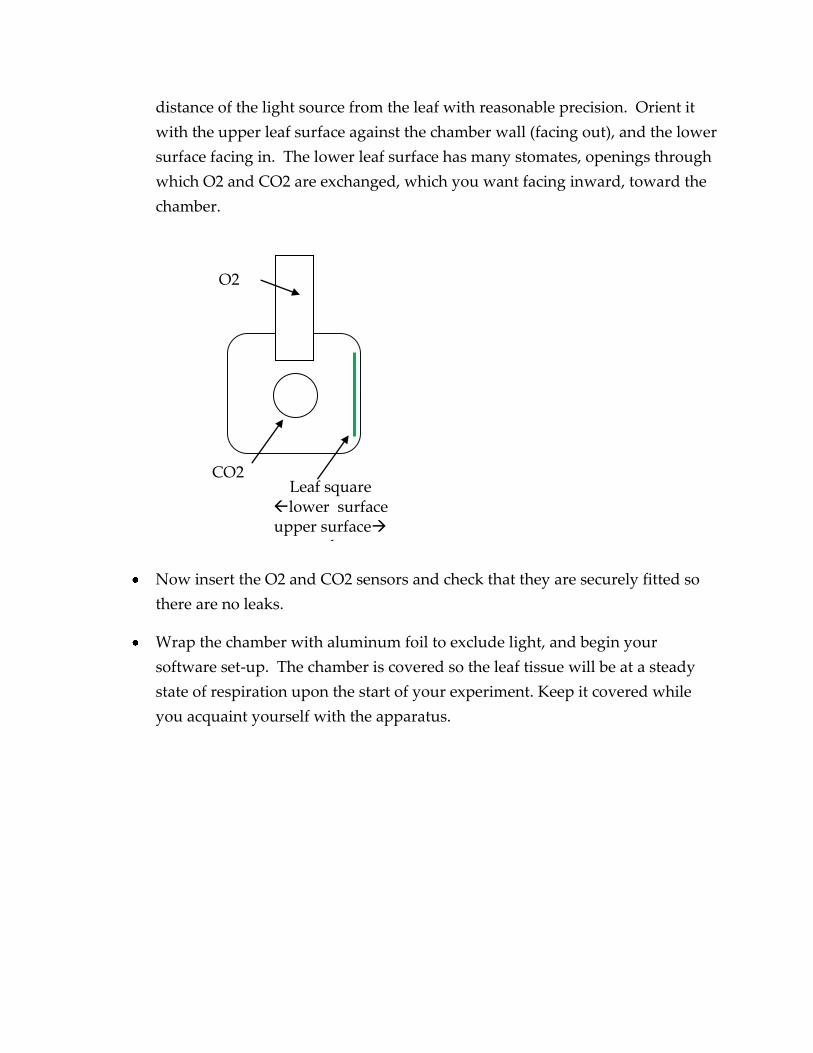
distance of the light source from the leaf with reasonable precision. Orient it
with the upper leaf surface against the chamber wall (facing out), and the lower
surface facing in. The lower leaf surface has many stomates, openings through
which O2 and CO2 are exchanged, which you want facing inward, toward the
chamber.
Now insert the O2 and CO2 sensors and check that they are securely fitted so
there are no leaks.
Wrap the chamber with aluminum foil to exclude light, and begin your
software set-up. The chamber is covered so the leaf tissue will be at a steady
state of respiration upon the start of your experiment. Keep it covered while
you acquaint yourself with the apparatus.
Leaf square lower surface upper surface
surface
O2 Sensor
CO2 Sensor
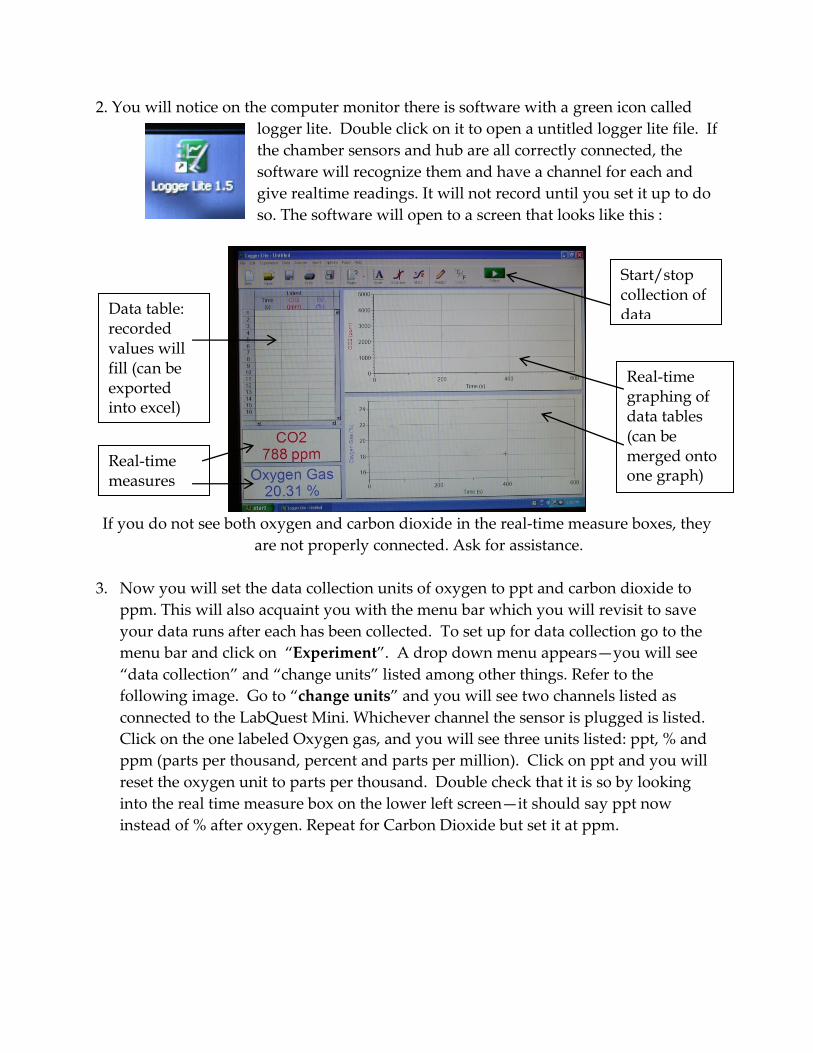
2. You will notice on the computer monitor there is software with a green icon called
logger lite. Double click on it to open a untitled logger lite file. If
the chamber sensors and hub are all correctly connected, the
software will recognize them and have a channel for each and
give realtime readings. It will not record until you set it up to do
so. The software will open to a screen that looks like this :
If you do not see both oxygen and carbon dioxide in the real-time measure boxes, they
are not properly connected. Ask for assistance.
3. Now you will set the data collection units of oxygen to ppt and carbon dioxide to
ppm. This will also acquaint you with the menu bar which you will revisit to save
your data runs after each has been collected. To set up for data collection go to the
menu bar and click on “Experiment”. A drop down menu appears—you will see
“data collection” and “change units” listed among other things. Refer to the
following image. Go to “change units” and you will see two channels listed as
connected to the LabQuest Mini. Whichever channel the sensor is plugged is listed.
Click on the one labeled Oxygen gas, and you will see three units listed: ppt, % and
ppm (parts per thousand, percent and parts per million). Click on ppt and you will
reset the oxygen unit to parts per thousand. Double check that it is so by looking
into the real time measure box on the lower left screen—it should say ppt now
instead of % after oxygen. Repeat for Carbon Dioxide but set it at ppm.
Real-time measures
Data table: recorded values will fill (can be exported into excel)
Real-time graphing of data tables (can be merged onto one graph)
Start/stop collection of data
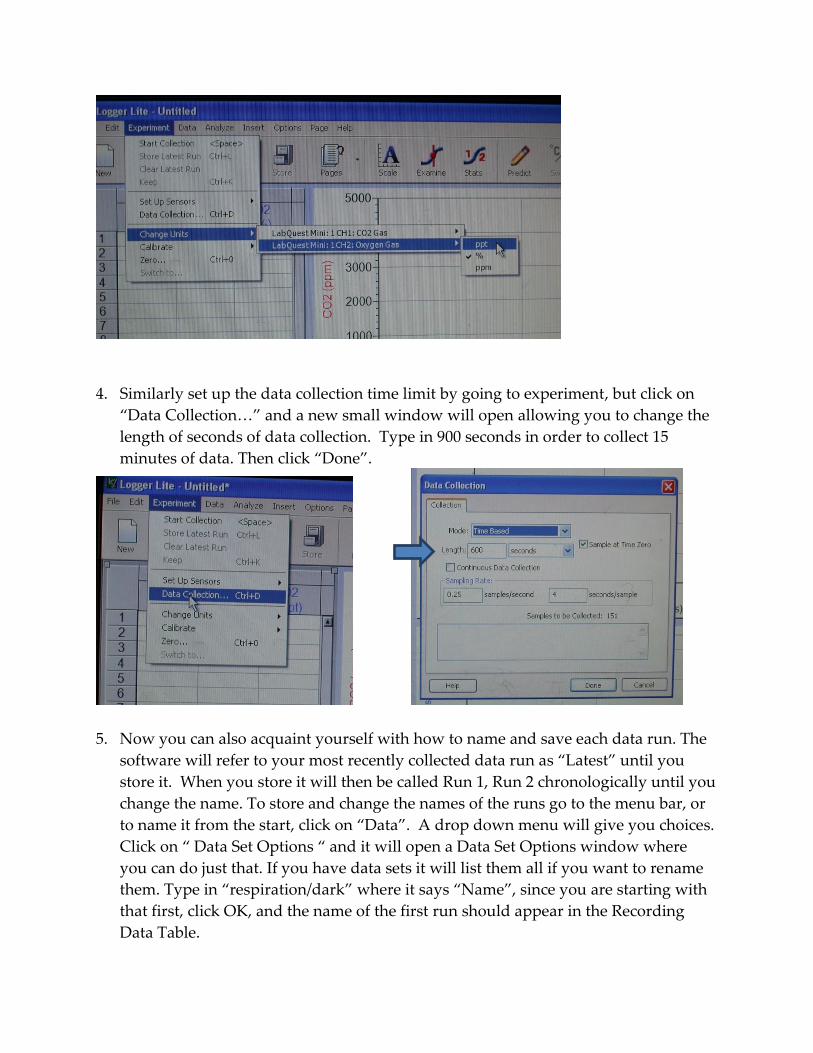
4. Similarly set up the data collection time limit by going to experiment, but click on
“Data Collection…” and a new small window will open allowing you to change the
length of seconds of data collection. Type in 900 seconds in order to collect 15
minutes of data. Then click “Done”.
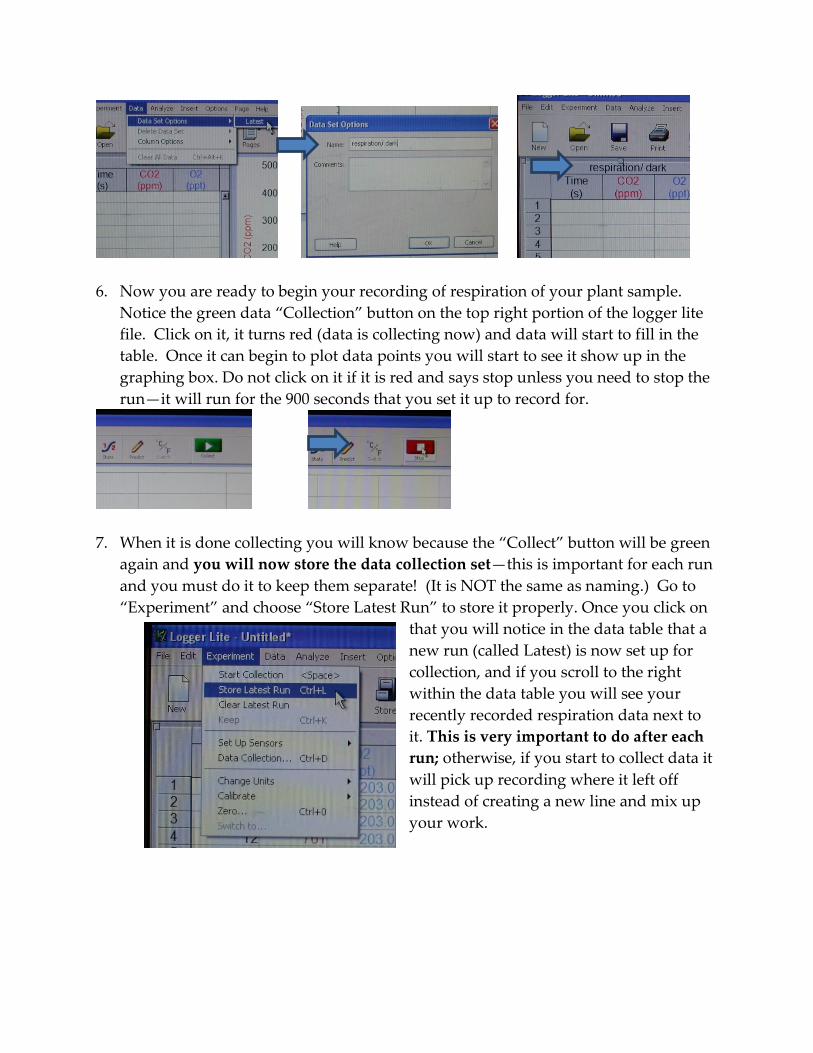
5. Now you can also acquaint yourself with how to name and save each data run. The
software will refer to your most recently collected data run as “Latest” until you
store it. When you store it will then be called Run 1, Run 2 chronologically until you
change the name. To store and change the names of the runs go to the menu bar, or
to name it from the start, click on “Data”. A drop down menu will give you choices.
Click on “ Data Set Options “ and it will open a Data Set Options window where
you can do just that. If you have data sets it will list them all if you want to rename
them. Type in “respiration/dark” where it says “Name”, since you are starting with
that first, click OK, and the name of the first run should appear in the Recording
Data Table.
6. Now you are ready to begin your recording of respiration of your plant sample.
Notice the green data “Collection” button on the top right portion of the logger lite
file. Click on it, it turns red (data is collecting now) and data will start to fill in the
table. Once it can begin to plot data points you will start to see it show up in the
graphing box. Do not click on it if it is red and says stop unless you need to stop the
run—it will run for the 900 seconds that you set it up to record for.
7. When it is done collecting you will know because the “Collect” button will be green
again and you will now store the data collection set—this is important for each run
and you must do it to keep them separate! (It is NOT the same as naming.) Go to
“Experiment” and choose “Store Latest Run” to store it properly. Once you click on
that you will notice in the data table that a
new run (called Latest) is now set up for
collection, and if you scroll to the right
within the data table you will see your
recently recorded respiration data next to
it. This is very important to do after each
run; otherwise, if you start to collect data it
will pick up recording where it left off
instead of creating a new line and mix up
your work.

8. Now gently tear a 5 x 5 cm “window” in the foil to expose your leaf piece. Try to
avoid scratching the plastic walls of the chamber. We will be using 50-60 watt
incandescent bulbs as the illumination source. They produce good bright light, but
they also produce a lot of heat, which might harm the leaf cells. Place a square 250
mL bottle filled with deionized water directly in front of the “window”, then place
the light on the other side, so the bottle acts as a heat sink between the light and the
leaf. Now start the data collection by clicking the green “Collect “ button. Measure
the distance between the light source and the leaf as precisely as possible.
9. As the data collects, you should see a second line form on the same graph that the
first run is on. Ask yourself if the respiration graph is what you expect and if the
photosynthesis data is in the trend expected. Do you think the photosynthetic rate
will be immediately apparent? Watch and determine what the steady rate of oxygen
evolution is and if it is steady the entire time.
10. When the full illumination collection is over cover the “window” so the leaf is reset
to the dark/respiration state, so any photosynthesis activity can be cleared (do this
between each run).
11. While resetting to the dark/respiration state takes place, store the full illumination
data. Note that it is currently called “Latest” and once stored it will be called “Run
1” by the software (refer to step 7 for directions).
Leaf square lower upper surface
O2 Sensor
CO2 Sensor
Heat Sink
Light

12. Once stored, rename “Run 1” full illumination (refer to step 5 for directions).
13. At this point you are ready for the next run. All runs in fact at this point will include
repetition of the last steps (8-12) only with different light treatments. Refer to those
steps for directions if you need them but basically each run will entail:
1-uncover
2-set up experimental treatment
3-collect data
4-cover apparatus after collection is over to reset to near respiration
5-store latest run
6-name stored run
7-set up for the experimental treatment
8-Repeat 1-7
It is the particulars of the remaining experimental treatment that we will now get
into. When the entire experiment is over you must save the file, name it by day, lab
time, and a name you will remember. Look it over and record the data you will need
to put in your notebook and/or report. You may also want to transfer the file to
your thumb drive or email it to yourself.
Treatments:
Collect oxygen and carbon dioxide data for the following treatments:
Distances/light intensities of 10cm, 5cm, 1cm
Red, green, blue filtered light
Part II. Light intensity and Photosynthesis The inverse square law for light intensity expresses the relationship between light
intensity and distance--intensity decreases as you move the source of light further
away. The intensity is inversely proportional to the square of the distance from the
source of the light. (Relative intensity = 1/d2.) You will observe this by simply
measuring the intensity of light as it reaches a light sensor. It will record onto the same
program.
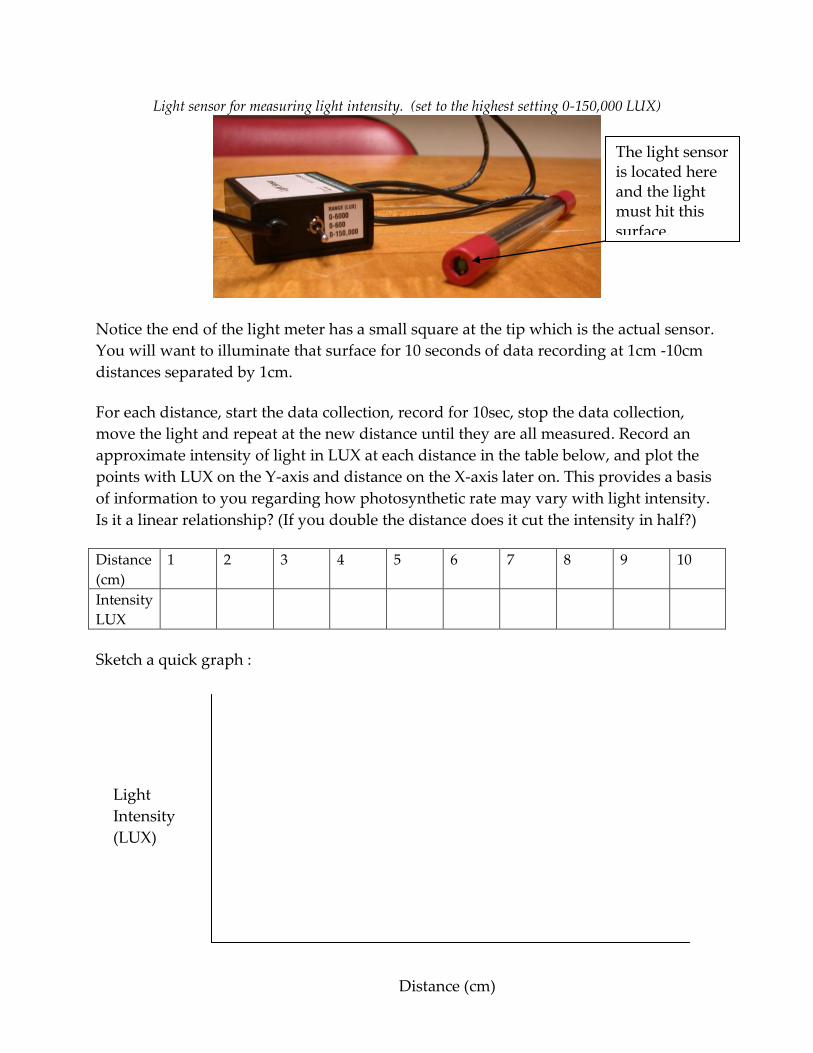
Light sensor for measuring light intensity. (set to the highest setting 0-150,000 LUX)
Notice the end of the light meter has a small square at the tip which is the actual sensor.
You will want to illuminate that surface for 10 seconds of data recording at 1cm -10cm
distances separated by 1cm.
For each distance, start the data collection, record for 10sec, stop the data collection,
move the light and repeat at the new distance until they are all measured. Record an
approximate intensity of light in LUX at each distance in the table below, and plot the
points with LUX on the Y-axis and distance on the X-axis later on. This provides a basis
of information to you regarding how photosynthetic rate may vary with light intensity.
Is it a linear relationship? (If you double the distance does it cut the intensity in half?)
Distance
(cm)
1 2 3 4 5 6 7 8 9 10
Intensity
LUX
Sketch a quick graph :
The light sensor is located here and the light must hit this surface.
Distance (cm)
Light
Intensity
(LUX)

Now, measure the photosynthetic rate for at least three different light intensities.
Begin with the light source as close as possible to your leaf sample (the light source right up against the 250 mL heat sink bottle).
Then experiment with longer distances. As a suggestion, try 2 and 3 times the width of the bottle, and further away if there is time.
In between each light intensity treatment, it may be helpful to cover the
“window” for a few minutes to reset the leaf cells to the dark rate.
For each distance, measure the actual light intensity using the light meter, and
collect O2 and CO2 data from the sensors.
Monitor at each distance for a sufficient time to obtain steady rates of change in
gas concentration.
Be sure to save and name each run.
Part III. Wavelength and Photosynthesis
(1) Measure the rate of photosynthesis using the colored filters. The actual light
intensity transmitted to the sample should be the same for each filter and the one
intensity with the most effect on photosynthetic rate. Color filters are used to
provide uniform illumination of specific wavelengths (colors) of light in the light
quality experiments (crude action spectrum).
(2) Start with the red filter. Place it over the “window” and use the heat sink bottle to
hold it in place so that the light path passes through the filter.
(3) In between each filter treatment, cover the “window” so the leaf square is in the
dark for 6 minutes. This is to reduce any effect from the previous filter on the
photosynthetic rate you are recording.
(3) Repeat with the blue filter and finally with the green.
Determine Rates of Change in Gas Concentration
The data logger will have recorded the concentrations of oxygen and carbon
dioxide at different time points over the course of your experiment. You now need to
calculate rates of change—the changes in O2 or CO2 concentration per unit time. These
rates can be calculated as follows:
Change in O2 = (O2-O1) ppt
Change in Time = ( T2-T1 ) seconds
Thus RATE will equal O/ T = ppt of oxygen per second
Change in CO2 = ((CO2) 2 -(CO2) 1) ppm
Change in Time = ( T2-T1 ) seconds
Thus RATE will equal O/ T = ppm of carbon dioxide per second
Since the sensor readings will “wobble” a bit from time point to time point, it is
best to use start and end points as widely spaced as possible—time points that bracket a
steady, approximately linear region of the plot. (Note how the short term rate
fluctuates from one time segment to the next in the sample spreadsheet shown below.
Ask your TA to clarify this if needed.)
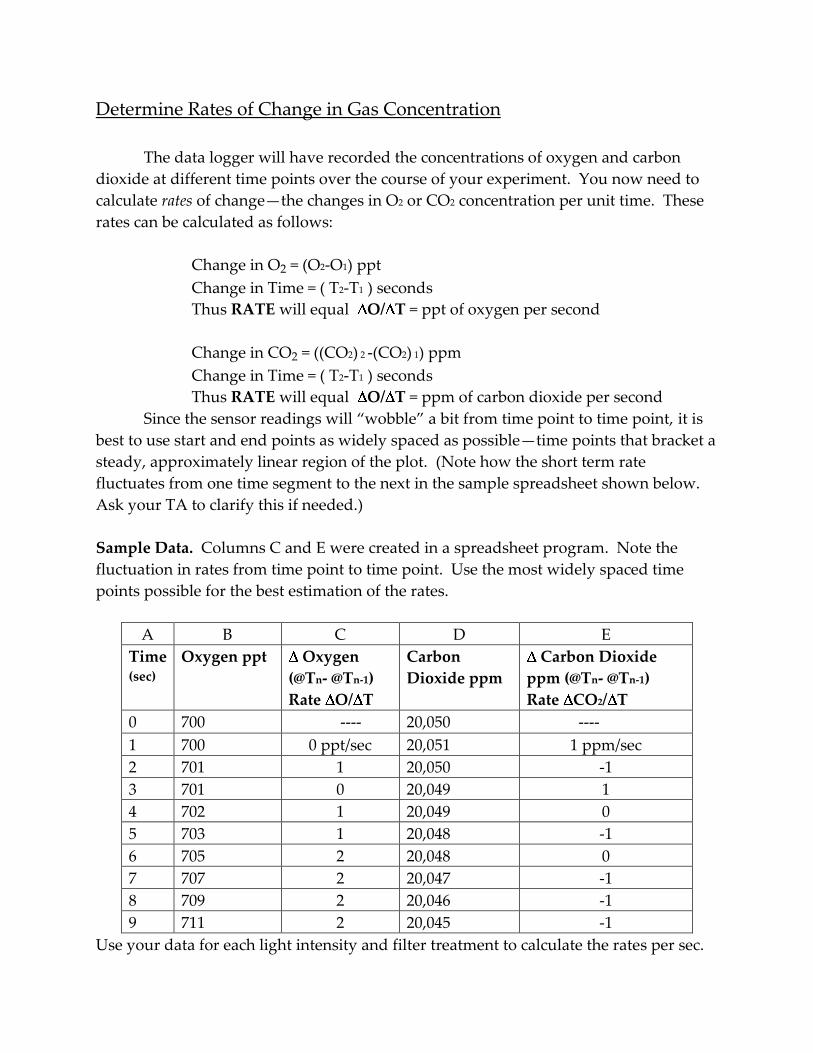
Sample Data. Columns C and E were created in a spreadsheet program. Note the
fluctuation in rates from time point to time point. Use the most widely spaced time
points possible for the best estimation of the rates.
A B C D E
Time (sec)
Oxygen ppt Oxygen
(@Tn- @Tn-1)
Rate O/ T
Carbon
Dioxide ppm
Carbon Dioxide
ppm (@Tn- @Tn-1)
Rate CO2/ T
0 700 ---- 20,050 ----
1 700 0 ppt/sec 20,051 1 ppm/sec
2 701 1 20,050 -1
3 701 0 20,049 1
4 702 1 20,049 0
5 703 1 20,048 -1
6 705 2 20,048 0
7 707 2 20,047 -1
8 709 2 20,046 -1
9 711 2 20,045 -1
Use your data for each light intensity and filter treatment to calculate the rates per sec.

Notes on data collection and analysis:
The data logger records the raw data from each of your experimental
treatments. If you want to keep your raw data, you will need to export the
file in a format readable by Excel or other spreadsheet software. Save it to the
desktop, then either email it to yourself or take home on a USB drive.
BUT, you do not necessarily need to take your raw data home. You will not
present the raw data in your report—you’ll present calculated rates of change
in O2 concentration. The raw data plots generated by the data logger allow
you to visually identify starting and ending points that bracket regions of
steady change—regions of approximately linear slope. All you really need to
take home are the values for these starting and ending points for each
treatment.
When your runs are complete, you can use the “Examine” button in the menu
bar to select the start and end points that you will use in your calculations.
Your TA will show you how to do this.
Obtaining the true rate of photosynthesis
Since plant cells can respire and photosynthesize at the same time, the measured rates
of change in O2 or in CO2 represent the net result of these two processes combined. To
obtain accurate rates of photosynthesis, the respiration rate must be used to correct the
measured rate of oxygen evolution in the light. Add the absolute value of the
respiration rate to the measured rate of oxygen evolution in the light. (We will make
the assumption that respiration is occurring at the same rate in the light as it does in the
dark.)
Another way to say the same thing is that the steady state rate (consistent rate) of
oxygen evolution with the light on minus the separately measured negative respiration
rate (sample was in the dark and should have a negative rate of oxygen evolution) is the
"true" rate of photosynthesis. (Subtracting a negative gives a positive = you are adding
the absolute value of the respiration rate to the measured photosynthetic rate; your
measured photosynthetic rate is lower than the true rate).

If this is not clear, you may want to discuss it as a class before the end of the period.
You will need to report “true” or “corrected” rates of photosynthesis in your lab
reports.
Follow-Up Questions, Notebook Entries
Include the following :
1. Produce 2 different graphs:
Plot the results from Part I as the true rate of photosynthesis (Y axis) versus
relative light intensity (X axis).
Plot the results from Part II, Wavelength and Photosynthesis. This plot will
show a crude "action spectrum": the true rate of photosynthesis (Y axis) versus
wavelength (X axis). The approximate wavelengths to use for each broad band
filter (which transmit more than one wavelength) are:
Red: 660-760nm Blue: 350-450nm Green: 460-560nm
2. Address these issues:
How light intensity and wavelength affect the rate of photosynthesis, as
supported by your data.
What conclusions can you make regarding the visible color of a pigment and the
color of light it absorbs?