Embed Size (px)
Citation preview
Vol. 26: 99-111, 1985 MARINE ECOLOGY - PROGRESS SERIES
Mar. Ecol. h o g . Ser. Published October 7
Photosynthesis patterns in Chesapeake Bay phytoplankton: short- and long-term responses of
P-I curve parameters to light
Lawrence W. Harding, Jr.', Blanche W. Meesonl & Thomas R. Fisher, Jr.2
Chesapeake Bay Institute, The Johns Hopkins University. Shade Side, Maryland 20764, USA Horn Point Laboratories. University of Maryland. Cambridge, Maryland 21613, USA
ABSTRACT: Pigment concentrations and photosynthetic rates of phytoplankton in Chesapeake Bay were examined to determine short- and long-term responses to light. Samples were collected horizon- tally along a turbidity gradient and vertically relative to the depths of the pycnocline and photic zone. This approach provided phytoplankton assemblages that were exposed to light differing in both ~ntensity and time-scale of change. Photosynthesis-irradiance (P-I) curves and the parameters aB and PmB were assayed at light intensities and wavelength bands that occur in situ. Short-term (minutes to hours) changes in light elicited responses in the distribution of aB and PmB coordinate pairs along a single line. Long-term (days to weeks) differences in light elicited a change in the relation of a* to PmB, manifested as a shifted slope of the linear correlation of these parameters. Photosynthetic efficiencies were similar in light sources of narrow ('blue-green' or 'orange') and broad spectra ('white'), indicating the successful harvesting of light of these spectral qualities by photosynthetic pigments in resident phytoplankton. This similarity in photosynthetic efficiency represents a long-term response that may depend on floral composition and differences In pigmentation. Concentrations and ratios of photo- synthetic pigments revealed seasonal and spatial differences in floral composition of phytoplankton in Chesapeake Bay. The presence of chrysophytes, diatoms, and dinoflagellates was indicated by low molar ratios of chl a and c during spring and summer, while the abundance of cyanobacteria (blue- green algae) was documented by high a:b and a:c ratios in autumn. These findings have implications for the use of P-I curve parameters in diagnosing photoadaptive responses by phytoplankton and for the seasonal abundance of cyanobacteria possibly associated with eutrophication of Chesapeake Bay.
INTRODUCTION
The response of phytoplankton to light has been a topic of much research in the last few years. Little attempt has been made, however, to integrate concep- tually the responses to light quality (i.e. spectral dis- tribution) and total photon flux for natural assemb- lages, despite the fact that a need to do so was recog- nized nearly 50 yr ago (Gabrielsen & Steemann Nielsen 1938, Baatz 1941). In estuarine environments, vertical and horizontal gradients in both the total amount of light available, and in the wavelength dis- tribution of that light, are apparent and potentially significant (cf. Jerlov 1976, Kirk 1976, 1979, 1983, Champ et al. 1980, Larkum & Barrett 1983). Sediment load, dissolved substances, and phytoplankton biomass are elevated in estuaries, producing shallow photic zones and a vertical spectral distribution that is
O Inter-Research/Printed in F. R. Germany
significantly different from that of coastal and oceanic waters. In Chesapeake Bay, for example, not only does turbidity restrict the amount of light available to phyto- plankton in photic zones of only several meters, but an 'orange shift' occurs wherein light of wavelengths from 515 to 600 nm penetrates relatively deeper than does light of other wavelength bands (Champ et al. 1980). This situation is distinct from oceanic regions where the photic zone can exceed 100 m in depth, 'blue- green' light penetrates deepest, and longer 'orange' to 'red' wavelengths are rapidly attenuated (Jerlov 1976, Kirk 1983).
Photosynthesis of estuarine phytoplankton is poten- tially influenced by both the reduced total amount of light available in the water column and by shifts in spectral quality. While adaptations to light of differ- ent intensities are well-described for phytoplankton (reviews: Falkowski 1980, Prezelin 1981), cells of vari-
100 Mar. Ecol. Prog. Ser. 26: 99-111, 1985
ous taxonomic groups possess distinct groups of photo- synthetic pigments with specific absorption properties that may also influence their ability to use light of different spectral qualities (Wallen & Geen 1971a, b, Qasim et al. 1972, Jeffrey & Vesk 1977, Vesk & Jeffrey 1977, Jeffrey 1980, Meeson & Faust 1985). As a conse- quence of this diversity in pigment content, phyto- plankton can, to some extent, match absorption of light to the available spectrum of photic energy. Achieving a match of availability and absorption may signific- antly enhance the rate of photosynthetic carbon as- similation.
In Chesapeake Bay, phytoplankton distributions are greatly affected by a seasonal transport of cells below the pycnocline, associated with 2-layered circulation and other physical processes. Annual bloom and decline sequences for certain species of diatoms and dinoflagellates that undergo such a transport are pro- minent features in the estuary (cf. Tyler & Seliger 1978, 1981, Seliger et al. 1981). For example, the dinoflagel- late Prorocentrum mariae-lebouriae experiences a lengthy, subpycnocline transport in saline, northward- flowing waters during winter and early spring. Con- centrations of this species can reach > 40,000 cells ml-' in environments with 'low light' (<< 1 % surface irradiance I,) of narrow spectral distribution. Thus, hydrographic regulation of the distribution of algal cells in Chesapeake Bay provides a combination of light cues that can impact survival of phytoplankton during transport and influence seasonal patterns of bloom development.
We examined the photosynthesis-irradiance (P-I) relation for natural phytoplankton assemblages in Chesapeake Bay. The hypothesis we tested was that phytoplankton show photosynthetic responses to differ- ent time-scales of exposure to low light, and that these responses are manifested in the magnitudes and dis- tributions of values for light-limited (aB) and light- saturated (PmB) photosynthesis. To that end, our main experimental goal was to distinguish short-term and long-term responses to the quantity and quality of light available to estuarine phytoplankton along horizontal and verbcal gradients in photic conditions. We mimicked in situ conditions using light sources that provided 3 distinct spectra over a range of intensities. Concentrations and molar ratios of photosynthetic pig- ments were measured to assess variations in phyto- plankton biomass and in accessory light-harvesting pigments as indicators of floral composition and light adaptation.
MATERIALS AND METHODS
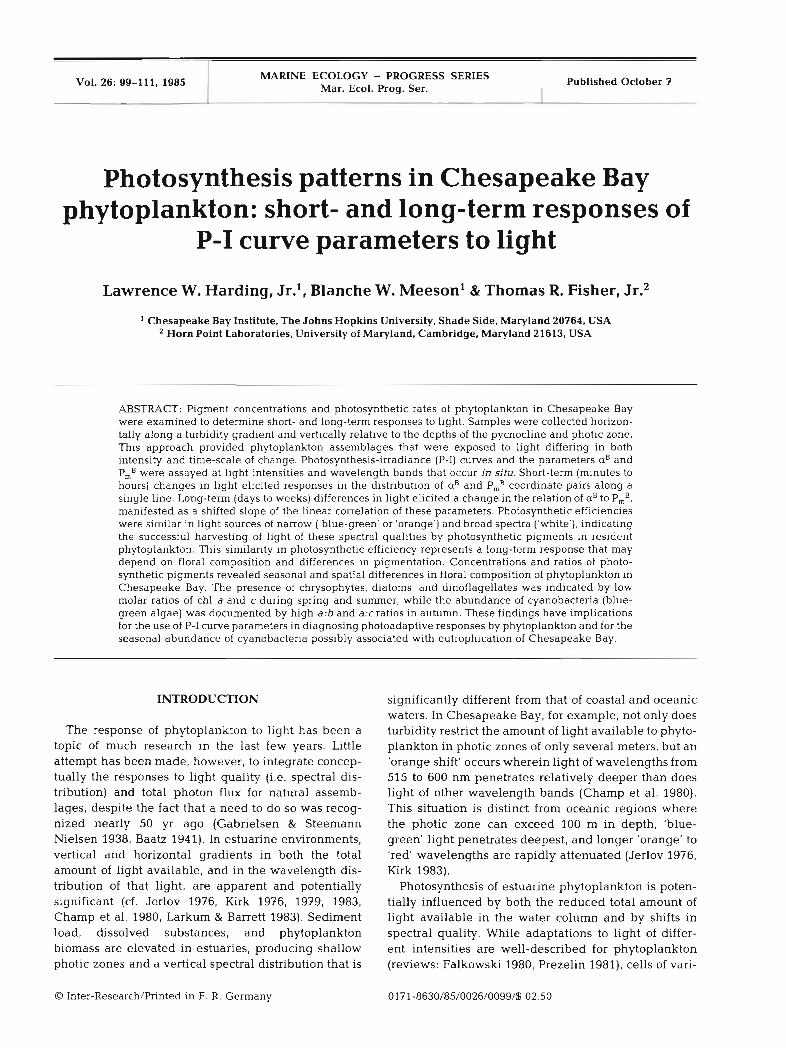
Three cruises were conducted aboard the R N Cape Hatteras in March, July, and October, 1982, in
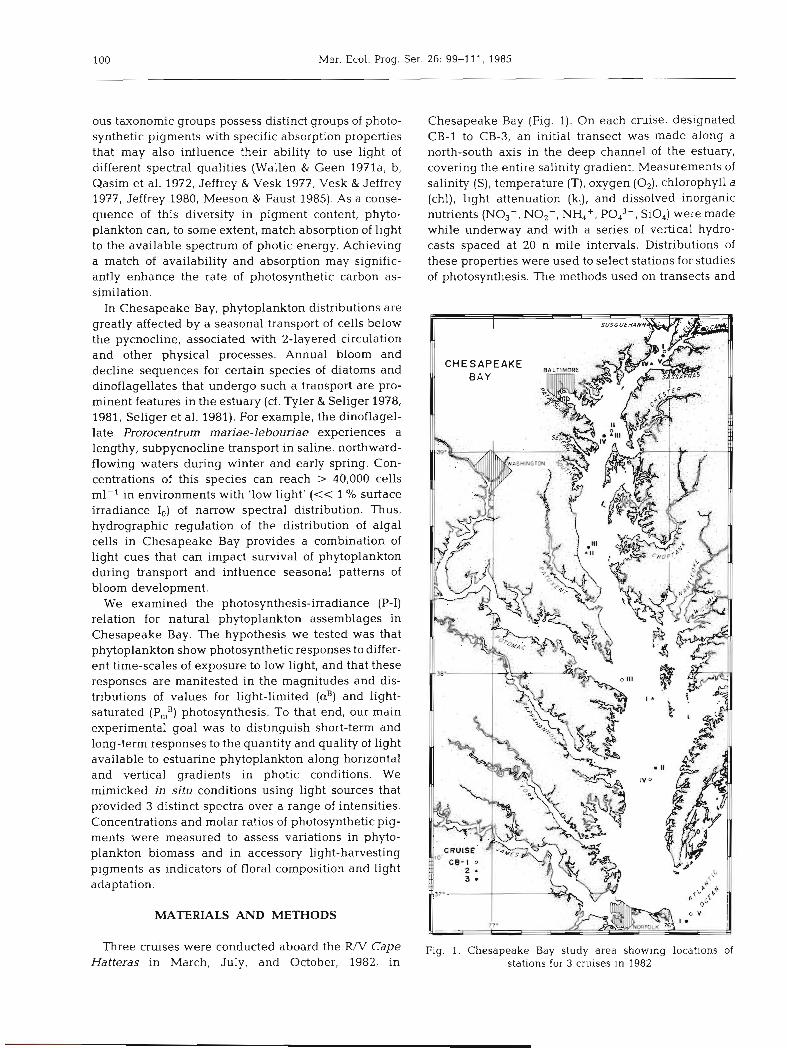
Chesapeake Bay (Fig. 1). On each cruise, designated CB-1 to CB-3, an initial transect was made along a north-south axis in the deep channel of the estuary, covering the entire salinity gradient. Measurements of salinity (S), temperature (T), oxygen (02), chlorophyll a (chl), light attenuation (k,), and dissolved inorganic nutrients (NO,-, NO1-, NH,+, Pod3-, SiO,) were made while underway and with a series of vertical hydro- casts spaced at 20 n mile intervals. Distributions of these properties were used to select stations for studies of photosynthesis. The methods used on transects and
Fig. 1. Chesapeake Bay study area showing locations of stations for 3 cruises in 1982

Harding et al.: Photosynthesis patterns in phytoplankton
detailed data on property distributions will be pre- sented elsewhere (Fisher et al. unpubl.).
On the cruises we occupied 4 or 5 stations for 24 h each and made measurements of phytoplankton photo- synthetic rates. Samples were collected from dawn to dusk at approximately 3 to 4 h intervals. At stations with well-mixed water columns, a single sample was taken from a depth of 1 m using a Niskin bottle or a diaphragm pump. Stations with stratified water col- umns were sampled in the surface mixed layer (l m), in the pycnocline (Z,), and at the base of the photic zone (Z,) (Table 1). Some variation in the depth of these features, particularly the surface mixed layer, occurred at each station due to tides.
Ambient irradiance at the surface (I,) was measured continuously with a Licor model 550 integrating quan- tum meter with a model 190s probe. The total light attenuation coefficient, k,, was calculated from vertical profiles of irradiance made with a Licor model 188B quantum meter equipped with a 192s sensor. Both meters measure photosynthetically active radiation (PAR) in the visible wavelengths from 400 to 700 nm. Depth of the photic zone (Z,) was estimated as the depth to which 1 % surface irradiance penetrated.
Photosynthesis was measured in 125 m1 glass-stop- pered bottles with 2 1Ci 14C-sodium bicarbonate (ICN Pharmaceutical, Inc.). The bottles were incubated for 2 h in .artificial light incubators using the light sources described below. Seawater from the ship's pumps maintained surface temperature in the incubators. Fol- lowing incubation, samples were filtered onto 25 mm Gelman A/E glass fiber filters, rinsed with filtered water from the Bay, and gently washed with filtered, slightly acidified (0.01N HC1) station water to remove inorganic label. Filters were placed in liquid scintilla- tion (LS) minivials with 4 m1 Aquasol (New England
Nuclear, Inc.), and counted on a Packard model 3320 LS Counter. Total CO, was measured by a gas-strip- ping technique on a Beckman model 864 infrared analyzer.
Published data on wavelength-specific light extinc- tion coefficients in Chesapeake Bay were used to select the light sources for our incubations (Fig. 2; Champ et al. 1980). We used combinations of specific lamps and colored filters to approximate the in situ photic environment. Three distinct qualities of light were used (Fig. 3). 'White' light was supplied to the shallowest (1 m) samples by combining very high out-
Fig. 2. Wavelength-specific extinction coefficients, k,, for 4 wavelength bands from 430 to 600 nm, vs the total light extinction coefficient, k,, demonstrating enhanced penetra- tion of 'green' to 'orange' light (540 to 600 nm) in Chesapeake
Bay (data adapted from Champ et al. 1980)
Table 1. Summary of station locations by coordinates, geographic location, and feature
Cruise Station Coordinates Location Feature N Latitude W Longitude
CB-1 I 39O26.8' 76"01.7' Turkey Point Freshwater/turbidity maximum Mar 82 I1 39'06.5' 76" 19.6' Chester R. Mouth Upper estuary
I11 37O57.2' 76'13.8' Potomac R. Mouth Mid-estuary N 37'31.0' 76'06.3' Rappahannock R. Mouth Chlorophyll/productivity maximum V 36'55.3' 76O52.8' Cape Henry Continental shelf
CB-2 I 37'53.8' 76O05.5' Potomac R. Mouth Mid-estuary Jul 82 I1 38'33.0' 76O29.0' Choptank R. Mouth Chlorophyll/productivity maximum
I11 39'05.8' 76O19.0' Chester R. Mouth Upper estuary W 39O23.0' 76"07.11 Turkey Point Turbidity maximum
CB-3 I 36O52.0' 75'54.0' Cape Henry Continental shelf Oct 82 I1 37'34.1' 76'06.7,' Rappahannock R. Mouth Lower estuary
111 38'33.7' 76'27.6' Choptank R. Mouth Productivity maximum IV 39'03.7' 76'22.3' Chester R. Mouth Productivity maximum V 39'25.7' 76"01.6' Turkey Point Turbidity/chlorophyll maximum
Mar Ecol. Prog. Ser. 26: 99-111, 1985
BLUE - GREEN
400 500 600 700
Wavelength (nm)
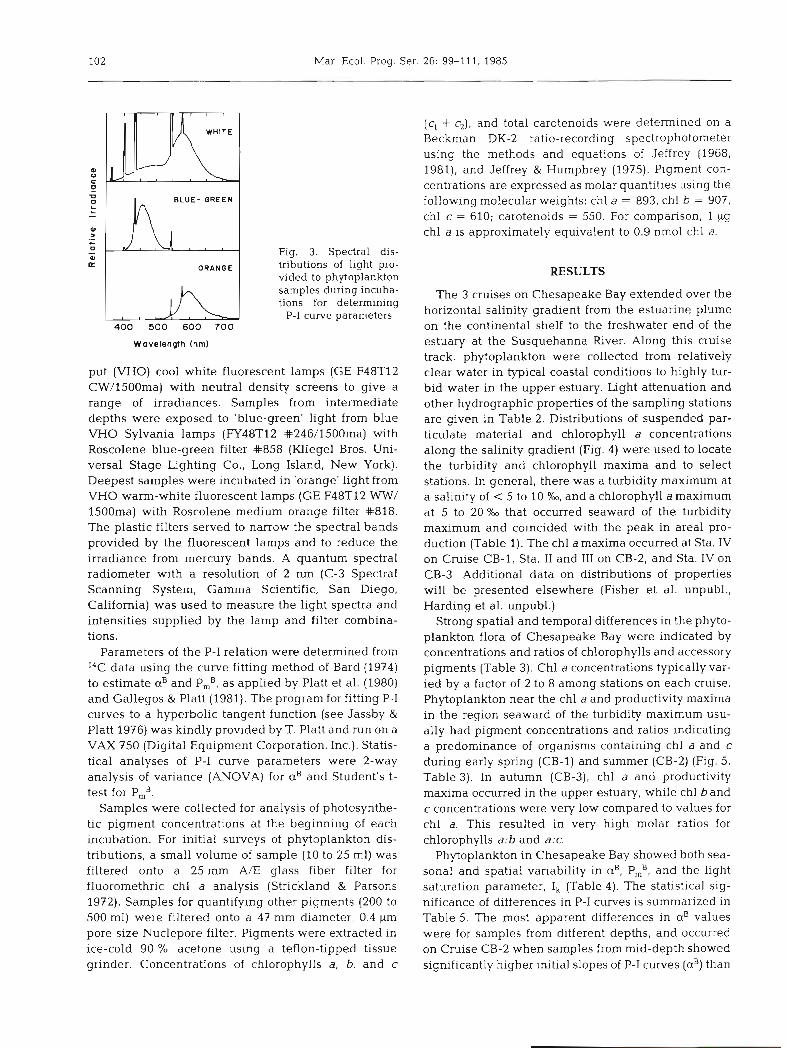
Fig. 3. Spectral dis- tributions of light pro- vided to phytoplankton samples during incuba- tions for determining
P-I curve parameters
put (VHO) cool white fluorescent lamps (GE F48T12 CW/1500ma) with neutral density screens to give a range of irradiances. Samples from intermediate depths were exposed to 'blue-green' light from blue VHO Sylvania lamps (FY48T12 #246/1500ma) with Roscolene blue-green filter #858 (Kliegel Bros. Uni- versal Stage Lighting Co., Long Island, New York). Deepest samples were incubated in 'orange' light from VHO warm-white fluorescent lamps (GE F48T12 WW/ 1500ma) with Roscolene medium orange filter #818. The plastic filters served to narrow the spectral bands provided by the fluorescent lamps and to reduce the irradiance from mercury bands. A quantum spectral radiometer with a resolution of 2 nm (C-3 Spectral Scanning System, Gamma Scientific, San Diego, California) was used to measure the light spectra and intensities supplied by the lamp and filter combina- tions.
Parameters of the P-I relation were determined from 14C data using the curve fitting method of Bard (1974) to estimate aB and PmB, as applied by Platt et al. (1980) and Gallegos & Platt (1981). The program for fitting P-I curves to a hyperbolic tangent function (see Jassby & Platt 1976) was kindly provided by T. Platt and run on a VAX 750 (Digital Equipment Corporation, Inc.). Statis- tical analyses of P-I curve parameters were 2-way analysis of variance (ANOVA) for aB and Student's t- test for PmB.
Samples were collected for analysis of photosynthe- tic pigment concentrations at the beginning of each incubation. For initial surveys of phytoplankton dis- tributions, a small volume of sample (10 to 25 ml) was filtered onto a 25 mm A/E glass fiber filter for fluoromethric chl a analysis (Strickland & Parsons 1972). Samples for quantifying other pigments (200 to 500 mI) were filtered onto a 47 mm diameter, 0.4 pm pore size Nuclepore filter. Pigments were extracted In ice-cold 90 % acetone using a teflon-tipped tissue grinder. Concentrations of chlorophylls a, b, and c
(c, + c2), and total carotenoids were determined on a Beckman DK-2 ratio-recording spectrophotometer using the methods and equations of Jeffrey (1968, 1981), and Jeffrey & Humphrey (1975). Pigment con- centrations are expressed as molar quantities using the following molecular weights: chl a = 893, chl b = 907, chl c = 610; carotenoids = 550. For comparison, l wg chl a is approximately equivalent to 0.9 nmol chl a.
RESULTS
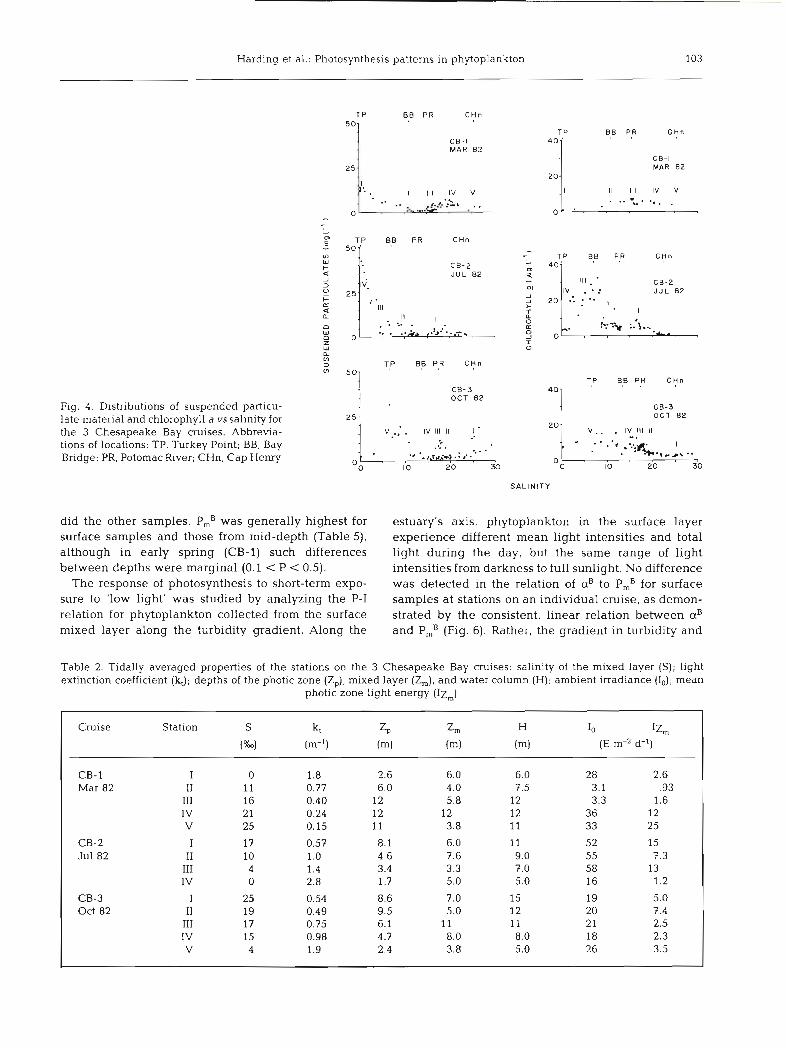
The 3 cruises on Chesapeake Bay extended over the horizontal salinity gradient from the estuarine plume on the continental shelf to the freshwater end of the estuary at the Susquehanna River. Along this cruise track, phytoplankton were collected from relatively clear water in typical coastal conditions to highly tur- bid water in the upper estuary. Light attenuation and other hydrographic properties of the sampling stations are given in Table 2. Distributions of suspended par- ticulate material and chlorophyll a concentrations along the salinity gradient (Fig. 4) were used to locate the turbidity and chlorophyll maxima and to select stations. In general, there was a turbidity maximum at a salinity of < 5 to 10 %o, and a chlorophyll a maximum at 5 to 20 Ym that occurred seaward of the turbidity maximum and coincided with the peak in area1 pro- duction (Table 1). The chl a maxima occurred at Sta. IV on Cruise CB-1, Sta. I1 and I11 on CB-2, and Sta. IV on CB-3. Additional data on distributions of properties will be presented elsewhere (Fisher et al. unpubl., Harding et al. unpubl.)
Strong spatial and temporal differences in the phyto- plankton flora of Chesapeake Bay were indicated by concentrations and ratios of chlorophylls and accessory pigments (Table 3). Chl a concentrations typically var- ied by a factor of 2 to 8 among stations on each cruise. Phytoplankton near the chl a and productivity maxima in the region seaward of the turbidity maximum usu- ally had pigment concentrations and ratios indicating a predominance of organisms containing chl a and c during early spring (CB-1) and summer (CB-2) (Fig. 5, Table 3). In autumn (CB-3), chl a and productivity maxima occurred in the upper estuary, while chl band c concentrations were very low compared to values for chl a. This resulted in very high molar ratios for chlorophylls a:b and a:c.
Phytoplankton in Chesapeake Bay showed both sea- sonal and spatial variability in aB, PmB, and the light saturation parameter, I, (Table 4). The statistical sig- nificance of differences in P-I curves is summarized in Table 5. The most apparent differences in aB values were for samples from different depths, and occurred on Cruise CB-2 when samples from mid-depth showed significantly higher initial slopes of P-I curves (aB) than
Harding et al.: Photosynthesis patterns in phytoplankton 103
BB PR C H n
C B - l MAR 82
MAR 82
CB-2 J U L 82
CB-2 J U L B2
T,P BB P,R C H n
CB-3 OCT 8 2
Fig. 4. Distributions of suspended particu- late material and chlorophyll a vssalinity for the 3 Chesapeake Bay cruises. Abbrevia- tions of locations: TP, Turkey Point; BB, Bay Bridge; PR, Potomac River; CHn, Cap Henry
CB-3 O C T 82
201 v . . . I" I l l I I
S A L I N I T Y
did the other samples. PmB was generally highest for surface samples and those from mid-depth (Table 5), although in early spring (CB-1) such differences between depths were marginal (0.1 < P < 0.5).
The response of photosynthesis to short-term expo- sure to 'low light' was studied by analyzing the P-I relation for phytoplankton collected from the surface mixed layer along the turbidity gradient. Along the
estuary's axis, phytoplankton in the surface layer experience different mean light intensities and total light during the day, but the same range of light intensities from darkness to full sunlight. No difference was detected in the relation of aB to PmB for surface samples at stations on an individual cruise, as demon- strated by the consistent, linear relation between aB and PmB (Fig. 6). Rather, the gradient in turbidity and
Table 2. Tidally averaged properties of the stations on the 3 Chesapeake Bay cruises: salinity of the mixed layer (S); light extinction coefficient (kJ; depths of the photic zone (Zp), mixed layer (Z,), and water column (H); ambient irradiance (Io); mean
photic zone light energy (Iz,)
Cruise Station S kt =p z m H 10 IZm
(%l (m-1) (m) (m) (m) (E m-2 d-' 1
CB-1 I 0 1.8 2.6 6.0 6.0 28 2.6 Mar 82 I1 11 0.77 6.0 4.0 7.5 3.1 .93
111 16 0.40 12 5.8 12 3.3 1.6 IV 2 1 0.24 12 12 12 36 12 V 25 0.15 11 3.8 11 33 25
CB-2 I 17 0.57 8.1 6.0 11 52 15 Jul 82 I1 10 1.0 4.6 7.6 9.0 55 7.3
I11 4 1.4 3.4 3.3 7.0 58 13 IV 0 2.8 1.7 5.0 5.0 16 1.2
CB-3 I 25 0.54 8.6 7.0 15 19 5.0 Oct 82 I1 19 0.49 9.5 5.0 12 20 7.4
111 17 0.75 6.1 11 11 2 1 2.5 IV 15 0.98 4.7 8.0 8.0 18 2.3 V 4 1.9 2.4 3.8 5.0 26 3.5
104 Mar. Ecol. Prog. Ser 26: 99-111, 1985
accompanying differences in mean light intensity and total light appeared to be reflected in the absolute magnitudes of aB and PmB values, and not in the ratio of these values. Coordinate pairs (PmB, aB) for each station tended to group together along the line, and the 4 or 5 P-I curve measurements made daily represented die1 periodicity of the P-I relation (see Harding et al. 1982, 1983).
The response of photosynthesis to long-term expo- sure to 'low light' was studied by analyzing P-I rela- tions for phytoplankton at different vertical positions in the water column. Phytoplankton from the surface mixed layer and from the pycnocline and below experienced both different mean light intensities and total light per day, as did phytoplankton from the
surface layer along the turbidity gradient. But samples collected from depth also experienced different ranges of light intensities, aB and pmB for phytoplankton from comparable vertical positions at stations on each cruise were, in general, correlated and linearly related (Fig. 6). Seasonal changes in the slopes of lines describing the aB to PmB relation were observed (i.e. between cruises), with higher slopes occurring in early spring (CB-1) for surface ('white'), mid-depth ('blue-green'), and deep ('orange') samples. The slopes declined in the higher irradiance and temperature conditions of summer (CB-2) for surface and deep samples, but remained elevated for samples that were collected from mid-depth (Table 4 , Fig. 6). Thus, unlike P-I patterns for phytoplankton from the surface mixed
Table 3. Concentrations of photosynthetic pigments (mean + SE) for 3 cruises in Chesapeake Bay, Mar to Oct 1982
Cruise Station Depth Chl a Chl b Chl c Carotenoids Pigment ratios (m) (nmoles I-') (nmoles 1-l) (nmoles I-') (nSPU 1-l) ' a : b a : c carot : a
CB-1 I 1 4.4 (.72) 2.5 (.28) 5.1 (1.2) 24 (nd) 1.7 .86 5.5 Mar 82 I1 1 9.0 (.58) 3.6 ( . S ) 7.1 (1.3) 22 (2.1) 2.5 1.3 2.4
3.5 9.5 (.83) 4.0 1.53) 7.4 (1.1) 24 (1.4) 2.4 1.3 2.5 5.5 8.4 (1.3) 3.0 (.66) 6.1 (1.6) 23 (3.6) 2.8 1.4 2.7
111 1 3.4 (.29) 1 5 ( 1 0 2.8 (.28) 8.5 (1.2) 2.2 1.2 2.5 5 4.1 (.38) 1.7 (.28) 3.4 (.48) l 0 (.98) 2.5 1.2 2.4
12 7.3 (1.4) 2.4 (.43) 4.8 (.80) 15 (3.0) 3.0 1.5 2.1 IV 1 3.5 (.86) 1.4 (.35) 3.0 (.61) 9.5 (2.2) 2.4 1.2 2.7 V l 2.9 (.54) .68 (.31) 1.2 (.52) 6.2 (3.4) 4.3 2.4 2.1
6 2.1 (SO) .46 (.14) 1.0 (.20) 6.2 (nd) 4.6 2.1 3.0 9 1.8 (.38) .42 (.22) 1.6 (.69) 9.8 (nd) 4.3 1.1 5.4
CB-2 1 4.8 (.59) 2.4 (.06) 3.9 (.82) 22 (1.3) 2.0 1.2 4.6 Jul 82 6 6.1 (.43) 1.8 (.37) 4.3 (.61) 22 (1.9) 3.4 1.4 3.6
10 4.3 (.19) 2.0 (.28) 4.1 (.38) l 8 (.42) 2.2 1.1 4.2 I1 1 13 (.go) 3.2 (.71) 3.9 (.80) 32 (2.6) 4.1 3.3 2.5
4 17 (.75) 2.0 1.51) 5.1 (.49) 30 (8.6) 8.6 3.3 1.8 8 13 (2.4) 2.0 (.18) 4.6 (1.0) 24 (6.8) 6.6 2.8 1.9
I11 1 9.7 (.67) 3.4 (.63) 3.4 (.23) 20 (1.7) 2.9 2.9 2.1 5 7.4 (.52) 2.0 (.52) 2.3 (.69) 17 (1.5) 3.7 3.2 2.3 7 6.3 (.34) 2.5 (.45) 2.8 (S?) 19 (.42) 2.5 2.3 3.0
IV 1 17 (.88) 1.4 (.46) 2.1 (.51) 28 (1.1) 12 8.1 1 .7
CB-3 I 1 4.3 (1.2) .64 (.14) .90 (.21) 7.5 (1.7) 6.7 4.8 1.7 Oct 82 5 2.9 (.30) .39 (.ll) .82 (.18) 6.4 (.58) 7.5 3.5 2.2
12 3.7 (.35) 11 (.08) .90 (.16) 9.1 (1.2) 34 4.1 2.5 I1 1 4.7 (.21) 17 ( . l?) .74 (.10) 9.6 (2.3) 28 6.4 2.0
6 4.3 (.59) .03 (.OO) .82 (.28) 9.5 (2.0) 142 5.2 2.2 11 4.0 (.26) .61 (.26) 2.0 (.39) l 0 (.78) 6.6 2.0 2.5
111 1 8.5 (1 , l ) 0 .74 (.28) 14 (1.4) m 12 1.7 5 9.5 (.71) 0 1.0 (.23) 16 (1.3) m 9.5 1.7 9 8.4 (1.2) 0 .33 (.20) 15 (2.7) m 25 1.8 1 9.7 (3.7) .06 (.06) 1.3 (.38) 2 0 ( 4 . 6 ) 162 7.5 2.1 2 15 (1.6) 0 2.1 (.56) 23 (2.8) m 7.1 1.5 7 13 (1.7) . l 1 (-11) 1.8 (.l51 20 (3.2) 117 7.2 1.5 1 34 (3.9) 4 . 4 ( 1 . 8 ) 11 (2.5) 53 (5.7) 7.7 3.1 1.6 2.5 25 (8.2) 4.4 (1.5) 12 (3.5) 48 (5.3) 5.5 2.1 1.9 5 23 (4.0) l (1.5 11 (2.7) 25 (8.3) 4.5 2.1 1.1
nSPU l-l = (pg SPU 1-')/(550 pg mole-') (see Strickland & Parsons 1972)

CB
- l M
AR
8
2
CB
- 2 J
UL
82
C
B-3
O
CT
82
Ch
loro
ph
yll 9
(nm
ole
e 1')
- '4
15.
m - 0
5 - 10.
U,
- - a C
0
', 6
.
- C
v
0
10 2
0
0
10 2
0
0
10 2 0
0 ,'
0
I
. O
,9
0
,
" "
,O
-. ,;: , . ,%g:%.m
"
,,-..*aA-
0
0
, .
. ..I . 0
0
,. ,.' .m
.
I.
,.o
,
@
0-
0
SY
MB
OL
S
TA
TIO
N
I I I Ill IV
v

106 Mar. Ecol. Prog Ser. 26: 99-1 11, 1985
Table 4. Means of P-I curve parameters aB and PmB ( f SE) and values of the light saturation parameter (Ik). Color designations are W (white), B (blue), and 0 (orange) and correspond to the light quality in simulated in situ incubations
Cruise Station Depth (m)-color aB pmB 1, (pg C [pg chll-l h-') (pg C [pg chll-I h-') (YE m-' S-')
(pE S-')- '
CB-l I l-W ,065 (.005) 3.1 (.68) 47.5 Mar 82 l -B ,082 (.037) 6.6 (3.6) 75.3
1 - 0 ,039 (.022) 4.2 (1.9) 107 I1 l-W ,190 (.061) 11 (3.1) 59.5
3.5-B ,159 (.021) 12 (1.4) 77.4 5.5-0 ,065 (.015) 6.8 (1.1) 104
111 l-W ,042 (.012) 2.7 (.51) 65.0 5-B ,067 (.016) 2.5 (.44) 37.5
12-0 ,018 (.006) 1.4 (.l91 79.4 IV l-W .032 (.006) 1.8 (.28) 56 6
l -B ,054 (.012) 1.7 (.lO) 32.2 1 - 0 ,013 (.002) 1.6 (,l61 124
V l-W ,024 (.003) 1.8 (.34) 73.3 6-B .046 (.016) 1.9 (.41) 42.0 9 - 0 ,024 (.007) 2.6 (.38) 109
CB-2 I l -W .012 (.001) 1.5 (.27) 122 J u l 8 2 6-B .034 (.007) 1.0 (.l31 30.0
10-0 ,016 (.001) 1.2 (.l11 72.5 I1 I-W ,046 (.009) 5.6 (2.0) 123
4-B ,119 (.039) 4.3 (1.2) 36.1 8 - 0 ,010 (.003) 1.1 (.19) 112
I11 l-W ,034 (.010) 6.6 (.85) 195 5-B .l00 (.014) 6.5 (1.6) 64.9 7 - 0 .029 (.003) 3.8 (.46) 133
IV l -W ,032 (.002) l 0 (1.8) 322 l -B ,055 (.016) 5.0 (.60) 90.0 1 - 0 ,037 (.004) 3.8 (.22) 103
CB-3 I l-W ,051 (.010) 6.2 (.12) 122 Oct 82 5-B .086 (.025) 4.1 (.23) 47.4
12-0 ,053 (.012) 3.0 (.49) 56.0 I1 l-W ,044 (.019) 4.8 (2.4) 108
6-B ,041 (.009) 5.4 (.97) 132 11-0 ,031 (.015) 3.2 (.42) 104
I11 l -W ,042 (.002) 4.3 (.60) 103 5-B ,077 (.011) 4.3 (.60) 56.2 9 - 0 ,022 (.002) 3.1 (.52) 140
IV l-W .063 (.014) 8.0 (1.0) 127 2-B .072 (.013) 6.4 (.47) 88.5 7 - 0 .038 (.002) 3.5 (.46) 91.8
V l -W ,043 (.004) 5.7 (.76) 133 2.5-B ,047 (.003) 4.2 (.91) 88.7
5 - 0 ,029 (.004) 4.6 (.40) 158
layer along the turbidity gradient, patterns for phyto- plankton collected in and below the strong pycnocline did show changes in the ratio of light-limited to light- saturated photosynthesis. In autumn (CB-3), the corre- lation of aB and PmB detected in earlier cruises was found for surface samples, with a slope intermediate between that of early spring and summer. P-I curve parameters for phytoplankton from mid-depth or deep were not linearly related in autumn.
Use of 3 distinct light sources in our incubations provided some limited data on chromatic adaptation.
The most apparent influence of light quality on photo- synthesis was observed for stratified stations during summer (CB-2). Phytoplankton samples collected from mid-depth and incubated in 'blue-green' light showed a higher photosynthetic efficiency expressed as aB than did samples from the other depths (Table 4 & 5). For samples collected in the surface mixed layer at well- mixed stations and incubated in each of the 3 light sources, we did not observe differences in P-I curve parameters associated with spectral differences in in- cubation~.

Harding et al.: Photosynthesis patterns in phytoplankton 107
Table 5. Summary of statistical comparisons of P-I curve parameters for samples from different depths. W, B, and 0 designations are as described in Table 4 legend. Levels of significance: > indicates Pe.10; >> indicates PC.05 for F-test and t-test
Cruise Station (condition) U* (2-Way ANOVA, PmB (Student's t-test, no replication) 2-tailed)
CB-1 I (mixed) W = B = O W = B = 0 11 (stratified) W = B > > O W = B , W = O , B > O
I11 (stratified) W = B = 0 W = B , W > O , B > O IV (mixed) ~ I = B = O W = B = O V (stratified) W = B = O W = B = O
CB-2 I (stratified) B > > W = O W = B = O I1 (stratified) B > > W = O W = B , W > O , B > > O
I11 (stratified) B > > W = O W = B , W > > O , B = O IV (mixed) W = B = O W > > B , W > > O , B = 0
CB-3 I (stratified) W = B = O W > > B , W > > O , B > O I1 (stratified) W = B = O W = B = O
111 (stratified) W = B > > O W = B = O IV (stratified) W = B = O W = B , W > > O , B > > O V (stratified) W =B >> 0 W = B = O
LAYER PYCNOCLINE DEEP
SYMBOL STATION 0.2 -aB- ~ 0 0 6 6 5 ) P$ ,00962
r2m.66 " - 2 0
0.1 1 . 0.1 A
:n
CB-3 o C B - 3 C B - 3 0
O
0 0
5 10 15 2 0 0 5 10 15 0 5 10 15
Fig. 6. Plots of aB vs PmB for Chesapeake Bay phytoplankton. P-I curves used to generate these data were determined in simulated in situ light conditions for samples collected at the vertical positions indicated. 'White' light was provided to samples from the surface layer, 'blue-green' light to samples from at or below the pycnocline, and 'orange' light to the deepest samples. Equations describe least-square fits; correlation coefficients (r2) and sample sizes (n) are given. Symbols correspond to samples
from distinct stations

108 Mar. Ecol. Prog. Ser. 26: 99-111, 1985
DISCUSSION
A correlation between aB and PmB has been observed before for laboratory cultures (Harding et al. 1981a, b, 1983, 1984), and natural assemblages of phytoplankton (MacCaull & Platt 1977, Harding et al. 1982, unpubl.). For example, it is known that aB and PmB remain highly correlated in the dinoflagellate, Prorocentrum mariae- lebouriae, during photoadaptive responses to short- term (i.e. several day) exposures to 'low light' (Harding et al. 1983). The distribution of a B and PmB coordinate pairs shifted along a line describing the correlation when light conditions changed, and the range of val- ues in a day corresponded to the amplitude of diel periodicity in photosynthesis. It is also known that seasonal changes in the relation of aB to PmB, whether quantified by Ik that equals PmB/aB, or by the slope of aB vs PmB, may occur in response to changed photoperiod, insolation, temperature, and species composition (cf. Cot6 & Platt 1983, Harding et al. unpubl.).
The data presented here for phytoplankton in Chesapeake Bay show both of these patterns, and demonstrate some interesting aspects of light adapta- tion in natural phytoplankton assemblages. P-I curve parameters were highly correlated on any 1 cruise, and thereby in a given season, provided that the source of samples (i.e. depth relative to the pycnocline or com- pensation depth) was comparable. Between cruises or seasons, changes in slope of the correlation were observed. For phytoplankton collected below the pyc- nocline or near the base of the photic zone, differences were observed in the ratio of aB to PmB as compared to the ratio for surface samples. Phytoplankton in these samples appear to have occupied a relatively stable 'low light' environment below the pycnocline for days to weeks, and the pattern of their P-I curve parameters apparently reflected long-term adaptation to reduced light. Notably, the timing of cruise CB-2 was coinci- dent with the seasonal occurrence of large-scale, sub- pycnocline transport of dinoflagellates and diatoms northward in the estuary (Tyler & Seliger 1978, 1981). In some species, this transport is lengthy and cells entrained in that layer experience 'low light' for days to weeks. Persistence of a steep slope for aB vs PmB in summer for samples from mid-depth probably reflects the relative stability of that 'low light' exposure and a disproportionate influence on aB and PmB.
Shifts in the relation of aB to PmB that occurred seasonally and vertically did not occur along the hori- zontal gradient of turbidity in the estuary on any single cruise. As already discussed, distributions of a B and PmB provided valid indicators of short-term photoadap- tive responses of Prorocentmm mariae-leboun'ae in laboratory experiments, but the ratio of the light- limited slope, aB, to the light-saturated rate of photo-
synthesis, PmB, did not. In contrast, earlier research with other dinoflagellate species (e.g. Gonyaulaxpoly- edra, Glenodinium sp.) documented the responsive- ness of this ratio and of derived light-saturation para- meters (I,, I,) to long-term (stable) changes in the photic environment (Prezelin & Sweeney 1978, Preze- lin & Matlick 1980, Prezelin 1981).
Together, these results suggest that the relation of aB to PmB, and parameters derived from that relation, may be poor measures of photoadaptation to short-term changes in light, but that these properties respond to long-term changes in light and reflect physiological trends associated with seasonal influences or relatively stable light conditions. Clearly, seasonal changes in the relation of aB to PmB could also have been associ- ated, in part, with gradients in temperature or species composition, rather than with light conditions alone. Based on data for pigment ratios, for instance, differ- ences in species composition with depth, location, and season occurred during our study, and these may have influenced the slope of aB vs PmB. However, the consis- tency of our findings using natural assemblages of phytoplankton with results of laboratory studies sug- gests light as the single most important variable pro- ducing the P-I curve patterns we observed.
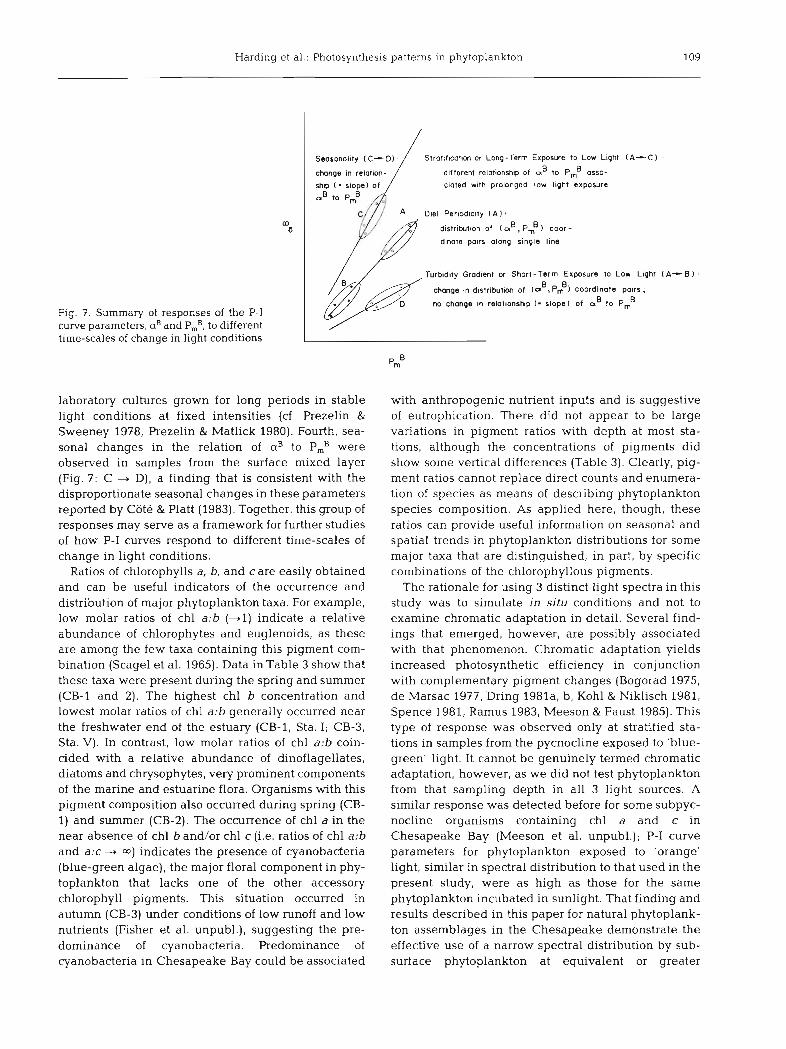
The several patterns that emerged from our data suggest a link between duration of exposure to 'low light' and adaptive shifts observed in aB and PmB. These patterns are summarized in Fig. 7. First, diel periodicity produced synchronous changes in aB and PmB for phytoplankton from a given station, such that the ratio of a B to PmB remained constant during the day (Fig. 7: A). This is consistent with a large body of data on periodicity of photosynthesis (cf. Prezelin et al. 1977, Harding et al. 1981a, 1982, 1983). Second, phyto- plankton collected at different stations along the estuarine turbidity gradient on a single cruise showed distinct groupings of aB and PmB coordinate pairs, with the range of values for each station corresponding to periodicity of photosynthesis. Different ranges of aB and PmB values occurred for phytoplankton from sta- tions along the turbidity gradient, but the relation of aB to PmB remained constant (Fig. 7: A + B). This response is comparable to that elicited by short-term light shifts in laboratory studies wherein distributions of aB and PmB coordinate pairs responded to a reduction in light, but the relation of aB to PmB was unchanged (Harding et al. 1983). Third, phytoplankton from the pycnocline and below showed grouping of aB and PmB coordinate pairs indicating periodicity, but the ratio of a B to PmB differed from that of phytoplankton in the surface mixed layer (Fig. 7: A + C). This response appears to reflect a response to relatively long-term exposure to 'low light' below the density discontinuity, and is con- sisent with results of photoadaptation studies using
Harding et al.: Photosynthesis patterns in phytoplankton 109
Fig. 7. Summary of responses of the P-I curve parameters, aB and PmB, to different time-scales of change in light conditions
Stratif~catlon or Long-Term Exposure to Low Light (A- C ) . change in relotion- different relationship of aB to P,' aaso-
ciated with prolonged low light exposure
Diel Periodlclty ( A l
distribut~on of ( a', pmB 1 coor - d~nate palm along single line
Turbidity Gradient or Short-Term Expasure to Low Llght (A- B m
change In distribution of (a', pmB) coordlnote polrs . no change in relal~onohip slope) of aB to pmB
laboratory cultures grown for long periods in stable light conditions at fixed intensities (cf. Rezelin & Sweeney 1978, Rezelin & Matlick 1980). Fourth, sea- sonal changes in the relation of aB to PmB were observed in samples from the surface mixed layer (Fig. 7: C + D), a finding that is consistent with the disproportionate seasonal changes in these parameters reported by Cote & Platt (1983). Together, this group of responses may serve as a framework for further studies of how P-I curves respond to different time-scales of change in light conditions.
Ratios of chlorophylls a, b, and care easily obtained and can be useful indicators of the occurrence and distribution of major phytoplankton taxa. For example, low molar ratios of chl a:b (+l) indicate a relative abundance of chlorophytes and euglenoids, as these are among the few taxa containing this pigment com- bination (Scagel et al. 1965). Data in Table 3 show that these taxa were present during the spring and summer (CB-1 and 2). The highest chl b concentration and lowest molar ratios of chl a:b generally occurred near the freshwater end of the estuary (CB-1, Sta. I; CB-3, Sta. V). In contrast, low molar ratios of chl a : b coin- cided with a relative abundance of dinoflagellates, diatoms and chrysophytes, very prominent components of the marine and estuarine flora. Organisms with this pigment composition also occurred during spring (CB- 1) and summer (CB-2). The occurrence of chl a in the near absence of chl b and/or chl c (i.e. ratios of chl a:b and a:c -+ 03) indicates the presence of cyanobacteria (blue-green algae), the major floral component in phy- toplankton that lacks one of the other accessory chlorophyll pigments. This situation occurred in autumn (CB-3) under conditions of low runoff and low nutrients (Fisher et al. unpubl.), suggesting the pre- dominance of cyanobacteria. Predominance of cyanobacteria in Chesapeake Bay could be.associated
with anthropogenic nutrient inputs and is suggestive of eutrophication. There did not appear to be large variations in pigment ratios with depth at most sta- tions, although the concentrations of pigments did show some vertical differences (Table 3). Clearly, pig- ment ratios cannot replace direct counts and enumera- tion of species as means of describing phytoplankton species composition. As applied here, though, these ratios can provide useful information on seasonal and spatial trends in phytoplankton distributions for some major taxa that are distinguished, in part, by specific combinations of the chlorophyllous pigments.
The rationale for using 3 distinct light spectra in this study was to simulate in si tu conditions and not to examine chromatic adaptation in detail. Several find- ings that emerged, however, are possibly associated with that phenomenon. Chromatic adaptation yields increased photosynthetic efficiency in conjunction with complementary pigment changes (Bogorad 1975, de Marsac 1977, Dring 1981a, b, Kohl & Niklisch 1981, Spence 1981, Ramus 1983, Meeson & Faust 1985). This type of response was observed only at stratified sta- tions in samples from the pycnocline exposed to 'blue- green' light. It cannot be genuinely termed chromatic adaptation, however, as we did not test phytoplankton from that sampling depth in all 3 light sources. A similar response was detected before for some subpyc- nocline organisms containing chl a and c in Chesapeake Bay (Meeson et al. unpubl.); P-I curve parameters for phytoplankton exposed to 'orange' light, similar in spectral distribution to that used in the present study, were as high as those for the same phytoplankton incubated in sunlight. That finding and results described in this paper for natural phytoplank- ton assemblages in the Chesapeake demonstrate the effective use of a narrow spectral distribution by sub- surface phytoplankton at equivalent or greater

110 Mar. Ecol. Prog. Ser. 26: 99-111, 1985
efficiencies as surface phytoplankton used 'white' light. The diversity of photosynthetic pigments present in phytoplankton from the estuary may have contri- buted to chromatic responses to ambient light condi- tions, and, in turn, promoted efficient photosynthesis in light of the narrowed in situ spectrum. That we did not observe a significant difference in the efficiency of light utilization for single samples collected from the surface mixed layer and incubated in each of the light sources suggests that photosynthetic pigments present in the resident phytoplankton compensated for nar- rowed in situ spectral regimes by effectively absorbing light of those wavelength bands.
SUMMARY
The light response of photosynthesis was studied for phytoplankton assemblages in Chesapeake Bay using P-I curve parameters measured in simulated in situ photic conditions. Short-term (minutes to hours) responses were studied in phytoplankton collected from the surface mixed layer along a horizontal gra- dient in turbidity. A high correlation of the light- limited slope, aB, with the light-saturated asymptote, PmB, occurred on each cruise in March, July, and October. The distributions of aB and PmB coordinate pairs, rather than the ratio of the parameters, showed between-station differences. Long-term responses (days to weeks) were studied with phytoplankton sam- ples spaced vertically in relation to the pycnocline. P-I curve parameters were linearly related in most cases, but the slope of the correlation and the relation (i.e. ratio) of aB to PmB differed for phytoplankton collected at distinct positions in the water column. These results suggest that photoadaptive responses manifested as changes in P-I functions are specific to the time-scale of exposure to low light.
Acknowledgements. We thank D. Fisher, M. Mallonee, K. Morrissey, J. Sager. D. Stanley, and the captain and crew of the RN Cape Hatteras for their contributions to the success of this work. Research support was provided by NSF Grants OCE 82-03962 (TRF) and OCE 83-10407 (LWH), and NOAA (Univ. Maryland Sea Grant College) Grant NA84AA-D-00014 ( L W ) .
LITERATURE CITED
Baatz, I. (1941). Die Bedeutung der hchtqualitat fiir Wachs- tum und Stoffproduktion planktontischer Meeres-diato- meen. Planta 3 1: 726-768
Bard, Y. (1974). Nonl~near parameter estimation. Academic Press, New York
Bogorad, L. (1975). Phycobiliproteins and complementary chromatic adaptation A. Rev. P1. Physiol. 26: 369401
Champ, M. A., Gould, G. A., Bozzo, W. A., Ackleson, S G., Vierra, K. C. (1980). Characterization of light extinction and attenuation in Chesapeake Bay, August, 1977. In:
Kemedy. V. S. (ed.) Estuarine perspectives. Academic Press. New York, p. 262-277
Cote, B., Platt, T. (1983). Day-to-day variations in the spring- summer photosynthetic parameters of coastal marine phy- toplankton. Limnol. Oceanogr. 28: 320-344
de Marsac. N. T. (1977). Occurrence and nature of chromatic adaptation in cyanobacteria. J. Bacterial. 30: 82-91
Dring, M. J . (1981a). Photosynthesis and development of manne macrophytes in natural light spectra. In: Smith, H. (ed.) Plants and the daylight spectrum. Academic Press, London, p. 297-314
Dring, M. J . (1981b). Chromatic adaptation of photosynthesis in benthic marine algae: an examinat~on of its ecological significance using a theoretical model. Limnol. Oceanogr 26: 271-284
Falkowski, P. G. (1980). Light-shade adaptation in marine phytoplankton. In: Falkowski, P. G. (ed.) Primary produc- tivity in the sea. Plenum Press, New York, p. 99-121
Gabrielsen, E. K., Steemann Nielsen, E. (1938). Kohlen- saureassimilation und Lichtqualitat bei den marinen Planktondiatomeen. Rapp. P,-v. Reun. Cons. Perm int. Explor. Mer 108: 19-21
Gallegos, C. L., Platt, T. (1981). Photosynthesis measurements on natural populations of phytoplankton: numerical analysis. In: Platt, T. (ed.) Physiological bases of phyto- plankton ecology. Can. Bull. Fish. Aquat. Sci. 210: 103-112
Harding, L. W., Jr., Heinbokel, J. F. (1984). Periodicities of photosynthesis and cell division: behavior of phase-lag- ged replicate cultures of Ditylum brightwellii in a diur- nally varylng photic regime. Mar. Ecol. h o g . Ser. 15: 225-232
Harding, L. W., Jr. , Meeson, B. W., Pr6zelin. B. B., Sweeney, B. M. (1981a). Diel periodicity of photosynthesis in marine phytoplankton. Mar. Biol. 61: 95-105
Harding, L. W., Jr., Meeson, B. W., Tyler, M. A. (1983). Photoadaptation and die1 periodicity of photosynthesis in the dinoflagellate Prorocentrum mariae-lebouriae. Mar. Ecol. Prog. Ser. 13: 73-85
Harding. L. W., Jr.. Prezelin, B. B., Sweeney, B. M., Cox, J. L. (1981b). Diel oscillations in the photosynthesis-irradiance relationship of a planktonic marine diatom. J . Phycol. 17: 389-394
Harding, L. W., Jr., Prkzelin, B. B., Sweeney, B. M., Cox, J. L. (1982). Die1 oscillations of the photosynthesis-irradiance (P-I) relationship in natural assemblages of phytoplank- ton. Mar. Biol. 67: 167-178
Jassby, A. D., Platt, T. (1976). Mathematical formulation of the relationship between photosynthesis and light for phyto- plankton. Limnol. Oceanogr. 21: 540-547
Jeffrey, S. W. (1968). Quantitative thin-layer chromatography of chlorophylls and carotenoids from marine algae. Biochim. biophys. Acta 162: 271-285
Jeffrey, S. W. (1980). Algal pigment systems. In: Falkowski, P. G. (ed.) Primary productivity in the sea. Plenum Press, New York, p. 33-58
Jeffrey, S. W. (1981). An improved thin-layer chrornatog- raphic technique for marine phytoplankton pigments. Limnol. Oceanogr. 26: 191-197
Jeffrey, S. W., Hurnphrey, G . F. (1975). New spectrophotomet- ric equations for determining chl a, b, c, and c, in higher plants, algae and natural phytoplankton. Biochem. Phy- siol. Pflanz. 167: 191-194
Jeffrey, S. W., Vesk, M. (1977). Effect of blue-green light on photosynthetic pigments and chloroplast structure in the marine diatom Stephanopyxis tumms5 J. Phycol. 13: 271-279
Harding et al.: Photosynthesis patterns in phytoplankton 11 1
Jerlov, N. G. (1976). Marine optics. Elsevier, Amsterdam Kirk, J. T 0 . (1976). Yellow substance (Gelbstoff) and its
contribution to the attenuation of photosynthetically active radiation in some inland and coastal southeastern Australian waters. Aust. J . mar. Freshwat. Res. 27: 61-71
Kirk, J. T. 0. (1979). Spectral distribution of photosyntheti- cally active radiation in some southeastern Australian waters. Aust. J. mar. Freshwat. Res. 30: 81-91
Kirk, J. T. 0. (1983). Light and photosynthesis in aquatic ecosystems. Cambridge Univ. Press, Cambridge
Kohl, J. G., Niklisch, A. (1981). Chromatic adaptation of the planktonic blue-green alga Oscillatoria redekei van Goor and its ecological significance. Int. Revue ges. Hydrobiol. 66: 83-94
Larkum, A. W. D., Barrett, J. (1983). hght-harvesting proces- ses in algae. Adv. bot. Res. 10: 1-219
MacCaull, W. A., Platt, T. (1977). Die1 variations in the photo- synthetic parameters of coastal marine phytoplankton. Limnol. Oceanogr. 22: 723-731
Meeson, B. W., Faust, M. A. (1985). Response of Prorocentrurn minimum (Pav.) Schiller (Dinophyceae) to different sped- ral qualities and irradiances: growth and photosynthesis. In: Gray, J. S., Christianson, M. E. (ed.) 18th European Mar. Biol. Symp. John Wiley and Sons, Chichester (in press)
Platt, T., Gallegos, C. L., Harrison, W. G. (1980). Photoinhibi- tion of photosynthesis in natural assemblages of marine phytoplankton. J. mar. Res. 38: 687-701
Prezelin, B. B. (1981). Light reactions in photosynthesis. In: Platt, T. (ed.) Physiological bases of phytoplankton ecol- ogy. Can. Bull. Fish. Aquat. Sci. 210: 1 4 3
Prkzelin, B. B., Matlick, H. A. (1980). Time-course of photo- adaptation in the photosynthesis-irradiance relationship of a dinoflagellate exhibiting photosynthetic periodicity. Mar. Biol. 58: 85-96
Prezelin, B. B., Sweeney, B. M. (1978). Photoadaptation of photosynthesis in Gonyaulax polyedra. Mar. Biol. 48: 27-35
PrBzelin, B. B., Meeson, B. W., Sweeney, B. M. (1977). Charac- terization of photosynthetic rhythms in marine dinoflagel-
lates. I. Pigmentation, photosynthetic capacity and respi- ration. P1. Physiol., Lancaster 60: 384-387
Qasim, S. Z., Bhattahiri, R., Devassy, M. (1972). The effect of intensity and quality of illumination on the photosynthesis of some tropical marine phytoplankton. Mar. Biol. 16: 22-31
Ramus, J . (1983). A physiological test of the theory of com- plementary chromatic adaptation. 11. Brown, green and red seaweeds. J. Phycol. 19: 173-178
Scagel, R. F., Rouse, G. E., Stein, J. R., Bandoni, R. J., Schofield. W. B., Taylor, T. M. C. (1965). An evolutionary survey of the plant kingdom. Wadsworth Publ. Co., Bel- mont, California
Seliger, H. H., McKinley, K. R., Biggley, W. H., Rivkin, R. B., Aspden, K. R. H. (1981). Phytoplankton patchiness and frontal regions. Mar. Biol. 61: 119-131
Spence, D. H. N. (1981). Light quality and plant responses underwater. In: Smith, H. (ed.) Plants and the daylight spectrum. Academic Press, London
Strickland, J . D. H., Parsons, T. R. (1972). A practical hand- book of seawater analysis, 2nd ed. Bull. Fish. Res. Bd Can. 167: 1-310
Tyler, M. A., Seliger, H. H. (1978). Annual subsurface trans- port of a red tide dinoflagellate to its bloom area: water circulation patterns and organism distributions in the Chesapeake Bay. Limnol. Oceanogr. 23: 227-246
Tyler, M. A., Seliger, H. H. (1981). Selection for a red tide organism: physiological responses to the physical envi- ronment. Limnol. Oceanogr. 26: 310-324
Vesk, M., Jeffrey, S. W. (1977). Effect of blue-green light on photosynthetic pigments and chloroplast structure in unicellular marine algae from six classes. J. Phycol. 13: 280-288
Wallen, D. G., Geen, G. H. (1971a). Light quality and concent- ration of proteins, RNA, DNA and photosynthetic pig- ments in two species of marine plankton algae. Mar. Biol. 10: 44-51
Wallen, D. G., Geen, G. H. (1971b). The nature of the photo- synthate in natural phytoplankton populations in relation to light quality. Mar. Biol. 10: 157-168
This paper was submitted to the editor; it was accepted for printing on July 5, 1985