Embed Size (px)
Citation preview
PHOTOSENSITIVITY, GRATING STRENGTH AND THERMAL ENDURANCE OF FIBRE BRAGG GRATINGS
DINUSHA SERANDI GUNAWARDENA
INSTITUTE OF GRADUATE STUDIES
UNIVERSITY OF MALAYA KUALA LUMPUR
2016
PHOTOSENSITIVITY, GRATING STRENGTH AND
THERMAL ENDURANCE OF FIBRE BRAGG
GRATINGS
DINUSHA SERANDI GUNAWARDENA
THESIS SUBMITTED IN FULFILMENT OF THE
REQUIREMENTS FOR THE DEGREE OF DOCTOR OF
PHILOSOPHY
INSTITUTE OF GRADUATE STUDIES
UNIVERSITY OF MALAYA
KUALA LUMPUR
2016
ii
UNIVERSITY OF MALAYA
ORIGINAL LITERARY WORK DECLARATION
Name of Candidate: DINUSHA SERANDI GUNAWARDENA
(I.C/Passport No: N6750731)
Registration/Matric No: HHE130004
Name of Degree: DOCTOR OF PHILOSOPHY
Title of Thesis: PHOTOSENSITIVITY, GRATING STRENGTH AND THERMAL
ENDURANCE OF FIBRE BRAGG GRATINGS
Field of Study: PHOTONICS ENGINEERING
I do solemnly and sincerely declare that:
(1) I am the sole author/writer of this Work;
(2) This Work is original;
(3) Any use of any work in which copyright exists was done by way of fair dealing
and for permitted purposes and any excerpt or extract from, or reference to or
reproduction of any copyright work has been disclosed expressly and
sufficiently and the title of the Work and its authorship have been
acknowledged in this Work;
(4) I do not have any actual knowledge nor do I ought reasonably to know that the
making of this work constitutes an infringement of any copyright work;
(5) I hereby assign all and every rights in the copyright to this Work to the
University of Malaya (“UM”), who henceforth shall be owner of the copyright
in this Work and that any reproduction or use in any form or by any means
whatsoever is prohibited without the written consent of UM having been first
had and obtained;
(6) I am fully aware that if in the course of making this Work I have infringed any
copyright whether intentionally or otherwise, I may be subject to legal action
or any other action as may be determined by UM.
Candidate’s Signature Date:
Subscribed and solemnly declared before,
Witness’s Signature Date:
Name:
Designation:
iii
ABSTRACT
Fibre Bragg gratings (FBGs) are wavelength selective fibre structures composed of
periodic refractive index changes which occur in the fibre core due to high intensity UV
irradiation. FBGs are considered to be the backbone of optical fibre technology. Thus, the
main goal of this thesis is to conduct a comprehensive investigation on the
photosensitivity, the grating strength and the thermal endurance of fibre Bragg gratings.
This thesis elaborates on the photosensitivity and thermal properties of a new type of
optical fibre known as gallosilicate fibre. Gallosilicate fibre provides enhanced
photosensitivity compared to the widely used germanosilicate fibre when exposed to 193
nm ArF excimer laser at low UV fluence levels. In addition, these fibres consisting of a
single dopant with a concentration as a low as 5 wt%, possess high temperature grating
regeneration characteristics, thereby making them potential candidates for high
temperature resistant gratings.
One of the prime intentions of this thesis is to propose a mathematical model in order
to explain the formation of the grating structure in photosensitive germanosilicate fibres
by using a combination of KrF excimer laser and phase-mask. The growth characteristics
of these two local refractive index changes are compared and represented by a single
characteristic function. Since grating and interference visibilities are the two key
parameters which influence the grating strength of an FBG, a new measurement technique
is introduced to estimate the interference visibility. Another technique, which is based on
the bent-spectral analysis method is also proposed for precise determination of the grating
visibility of an FBG. The grating visibility is estimated with the aid of a simple
mathematical expression by varying “ac” and “dc” coupling coefficients at different
bending radii. The effect of the decreasing bending radius on the Bragg Transmission
Depth (BTD), and both the “ac” and “dc” coupling coefficients are thoroughly explored.
iv
Moreover, the influence of the degradation of coupling coefficients on the centre
wavelength shift is investigated. The accuracy of the model proposed is verified with
experimental results.
The main contribution of this thesis is the investigation of thermally induced reversible
effect present in gratings inscribed in PS 1250/1500 fibre. The grating strength of a
grating with prolonged thermal endurance is characterised over a time period of a
thousand years over a temperature range of 200 °C to 400 °C. A noteworthy increment in
the grating reflectivity is observed during annealing at 425 °C, deviating from the general
thermal decay behaviour of an FBG. A comprehensive investigation is carried out on both
stepwise and continuous annealing procedures which indicate a similar trend in the
accelerated ageing characteristics when analysed with respect to the demarcation energy
(Ed) domain. Finally, the salient features of alteration in the temperature ramping rates,
on the grating strength is analysed in detail by performing thermal annealing procedures
on three different types of Bragg gratings where a comparative exploration is carried out.
v
ABSTRAK
Parutan Fibre Bragg (FBGs) iahlah struktur serat panjang gelombang terpilih di mana
teras gentiannya mempunyai indeks biasan berkala yang dihasilkan dengan penyinaran
UV berintensiti tinggi. FBGs dianggap sebagai tulang belakang kepada teknologi gentian
optik. Oleh itu, matlamat utama tesis ini adalah untuk menjalankan siasatan menyeluruh
mengenai kefotopekaan, kekuatan parutan dan ketahanan haba parutan serat Bragg.
Tesis ini menghuraikan kefotopekaan dan sifat haba jenis serat optik baru yang
dikenali sebagai gentian gallosilikat. Gentian gallosilikat menunjukkan peningkatan
dalam kefotopekaan berbanding gentian germanosilika yang lebih umum digunakan
apabila terdedah kepada 193 nm excimer laser ArF pada tahap fluence UV yang rendah.
Di samping itu, gentian ini mempunyai pendopan tunggal dengan kepekatan serendah
5wt% dan mempunyai suhu pertumbuhan semula yang tinggi. Ciri-ciri itu menjadikan
mereka calon-calon yang berpotensi untuk parutan tahan suhu tinggi.
Salah satu tujuan utama karya ini adalah untuk mencadangkan satu model matematik
untuk menerangkan pembentukan struktur parutan dalam gentian germanosilikat
fotopeka dengan menggunakan gabungan KrF excimer laser dan mask-fasa. Ciri-ciri
pertumbuhan kedua-dua perubahan indeks biasan tempatan dibandingkan dan diwakili
oleh satu fungsi cirian. Oleh sebab parutan dan visibility interferens adalah dua parameter
utama yang mempengaruhi kekuatan parutan FBG, teknik pengukuran baru untuk
menganggarkan jarak penglihatan gangguan diperkenalkan. Satu lagi teknik pengukuran,
yang berasaskan kaedah analisis bengkok spektrum juga dicadangkan untuk penentuan
tepat penglihatan parutan FBG. Visibility parutan dianggarkan dengan bantuan ungkapan
matematik yang mudah dengan mengubah “ac” dan “dc” pekali gandingan pada jejari
lenturan yang berbeza. Kesan radius lenturan yang semakin berkurangan pada Bragg
Transmission Depth (BTD), dan kedua-dua “ac” dan “dc” pekali gandingan diterokai
vi
dengan teliti. Selain itu, pengaruh degradasi pekali gandingan pada peralihan pusat
panjang gelombang disiasat. Ketepatan model yang dicadangkan itu telah disahkan
dengan keputusan eksperimen.
Sumbangan utama tesis ini adalah penyiasatan haba kesan berbalik disebabkan di
dalam parutan tertulis pada PS 1250/1500 serat. Ciri-ciri kekuatan parutan parutan dengan
ketahanan haba yang dilanjutkan sepanjang tempoh masa seribu tahun pada suhu di antara
200 °C hingga 400 °C juga dicirikan. Satu perubahan ketara dalam kenaikan pemantulan
parutan semasa penyepuhlindapan pada suhu 425 °C adalah diperhatikan menyeleweng
daripada ciri-ciri umum pereputan haba FBG. Satu penyiasatan secara menyeluruh
dengan kedua-dua prosedur penyepuhlindapan iaitu cara langkah demi langkah dan cara
berterusan telah dijalankan, keputusan mereka menunjukkan trend yang sama dalam ciri-
ciri penuaan dipercepatkan apabila dianalisis berkenaan dengan domain tenaga
penandaan (Ed). Akhir sekali, ciri-ciri utama perubahan dalam suhu yang ramping kadar,
kekuatan parutan dianalisis secara terperinci dengan menjalankan prosedur
penyepuhlindapan terma ke atas tiga jenis parutan Bragg di mana penerokaan
perbandingan dijalankan.
vii
ACKNOWLEDGEMENTS
First and foremost, I would like to express my sincere gratitude to my supervisor Dr.
Kok-Sing Lim for all his advices and for being a great source of guidance throughout my
Ph.D. studies. It has been a great pleasure to be his Ph.D. student. His perseverance,
enthusiasm and passion for research are truly inspirational. Also, I would like to extend
my gratitude and appreciation to Distinguished Professor Harith Ahmad for his
continuous assistance and remarkable skill of supervision. Being a part of his research
group was an absolute honour. Special thanks to my external supervisor Professor Amin
Malekmohammadi for his tireless support in refining and improving my research articles.
Furthermore, I acknowledge the dean and deputy dean of the Institute of Graduate
studies for their strategic direction in maintaining research excellence. I am ever grateful
to my colleagues, collaborators and members of the Photonics Research Centre who have
helped me in many ways throughout these years. Special thanks to Man-Hong Lai for all
the fruitful discussions and always sharing his outstanding physical intuition. My deepest
gratitude to Yen-Sian Lee for his amazing attitude and kind support in numerous ways in
the laboratory. I gratefully acknowledge the Bright Sparks Unit, Photonics Research
Centre, IGS and University of Malaya for the financial support, excellent research
facilities and the peaceful research atmosphere.
My sincere appreciation to my best friend, Ayeshath Iqbal for her incredible amount
of patience, for always lending a listening ear throughout these years and for her
tremendous moral support whenever I faced any difficulty. Finally, my heartfelt gratitude
goes to my parents, Gamini and Chitrangani Gunawardena and my sister, Neranja
Upeshika Gunawardena for their unconditional love, countless advices and continuous
encouragement in achieving my goals. Their blessings will always be a valuable asset to
me in my life.
May the force be with all of you!
viii
TABLE OF CONTENTS
Abstract ............................................................................................................................ iii
Abstrak .............................................................................................................................. v
Acknowledgements ......................................................................................................... vii
Table of Contents ........................................................................................................... viii
List of Figures ................................................................................................................ xiii
List of Tables................................................................................................................ xviii
List of Symbols and Abbreviations ................................................................................ xix
List of Appendices .......................................................................................................... xx
CHAPTER 1: INTRODUCTION .................................................................................. 1
1.1 Background .............................................................................................................. 1
1.2 Motivation................................................................................................................ 3
1.3 Research Objectives................................................................................................. 4
1.4 Evolution of the thesis ............................................................................................. 4
CHAPTER 2: THEORETICAL LITERATURE OF FIBRE BRAGG GRATINGS
…………………… ........................................................................................................... 6
2.1 Maxwell’s Equations ............................................................................................... 6
2.2 Fibre Bragg gratings ................................................................................................ 7
2.2.1 Resonant wavelength for grating diffraction .............................................. 9
2.2.2 Coupled-mode theory ............................................................................... 11
2.2.3 Apodisation of FBGs ................................................................................ 15
2.3 Types of fibre Bragg gratings ................................................................................ 16
2.3.1 Common Bragg Reflector......................................................................... 16
2.3.2 Long period gratings (LPGs) .................................................................... 17
ix
2.3.3 Tilted gratings ........................................................................................... 18
2.3.4 Chirped gratings ....................................................................................... 19
2.3.5 Phase-shifted gratings ............................................................................... 20
2.3.6 Classification by growth characteristics ................................................... 20
2.3.6.1 Type I gratings .......................................................................... 21
2.3.6.2 Type II gratings ......................................................................... 21
2.3.6.3 Type IIa gratings ....................................................................... 22
2.4 Grating inscription techniques ............................................................................... 23
2.4.1 Fabrication of the original Hill grating ..................................................... 23
2.4.2 Interferometric technique ......................................................................... 24
2.4.2.1 Amplitude-splitting interferometer ........................................... 24
2.4.2.2 Wave-front-splitting interferometer .......................................... 26
2.4.3 Mask image projection ............................................................................. 27
2.4.4 Point-by-point technique .......................................................................... 27
2.4.5 Phase-mask technique .............................................................................. 28
2.4.5.1 Sources for FBG inscription and their specifications ................ 32
2.5 Summary ................................................................................................................ 33
CHAPTER 3: PHOTOSENSITIVITY AND CHARACTERISATION OF
GRATING STRENGTH .............................................................................................. 34
3.1 Photosensitivity Mechanisms ................................................................................ 34
3.2 Techniques for photosensitivity enhancement....................................................... 36
3.2.1 Hydrogenation .......................................................................................... 36
3.2.2 Flame Brushing ........................................................................................ 38
3.2.3 Thermal Treatment using CO2 Laser ........................................................ 39
3.2.4 UV pre-exposure ...................................................................................... 40
3.2.5 Choice of dopant ...................................................................................... 42
x
3.2.5.1 Germanium (Ge) ....................................................................... 42
3.2.5.2 Boron (B) ................................................................................... 42
3.2.5.3 Aluminium (Al) ......................................................................... 43
3.2.5.4 Tin (Sn) ..................................................................................... 43
3.2.5.5 Nitrogen (N) .............................................................................. 44
3.2.5.6 Lead (Pb) ................................................................................... 44
3.2.5.7 Titanium (Ti) ............................................................................. 45
3.2.5.8 Fluorine (F) ............................................................................... 45
3.2.5.9 Phosphorus (P) .......................................................................... 46
3.3 Gallium as a photosensitive dopant ....................................................................... 47
3.3.1 Fabrication of gallosilicate fibre ............................................................... 47
3.3.2 Grating inscription and index growth ....................................................... 50
3.3.3 Structural analysis .................................................................................... 53
3.3.3.1 UV spectroscopy ....................................................................... 53
3.3.3.2 Photoluminescence spectroscopy .............................................. 54
3.4 Grating Characterisation ........................................................................................ 56
3.4.1 Interference and grating visibilities .......................................................... 56
3.4.2 Characterisation of phase-mask interference visibility and the evolution of
grating visibility during grating inscription .............................................. 58
3.4.3 Measurement of grating visibility via bent-spectral analysis ................... 64
3.4.3.1 Mathematical model for the bent-spectral analysis technique .. 65
3.4.3.2 Grating inscription and visibility analysis ................................. 68
3.4.3.3 Determination of grating visibility via bending ........................ 71
3.5 Summary ................................................................................................................ 77
CHAPTER 4: THERMAL STABILITY OF FIBRE BRAGG GRATINGS ........... 78
4.1 Decay Models ........................................................................................................ 78
xi
4.1.1 Types of accelerated ageing experiments ................................................. 84
4.1.2 Determination of thermal decay during accelerated ageing experiments 84
4.2 Shift of Bragg Wavelength .................................................................................... 85
4.3 Methods to Increase Thermal Stability .................................................................. 86
4.3.1 Pre or post exposure ................................................................................. 86
4.3.2 Thermal annealing using CO2 Laser......................................................... 87
4.3.3 Gratings with intrinsically high thermal stability ..................................... 92
4.3.4 Molecular water induced gratings ............................................................ 93
4.4 High temperature resistant gratings ....................................................................... 93
4.4.1 Chemical composition gratings (CCG) .................................................... 94
4.4.2 Regenerated fibre Bragg gratings (RFBG) ............................................... 95
4.5 Thermally activated gallosilicate fibre Bragg gratings .......................................... 99
4.6 Summary .............................................................................................................. 107
CHAPTER 5: THERMALLY ENDURING GRATINGS BASED ON
THERMALLY INDUCED REVERSIBLE EFFECT ............................................. 108
5.1 Thermally induced reversible effect .................................................................... 108
5.2 Origins of temperature reliance of grating reflectivity ........................................ 111
5.2.1 Reliance of residual stress on temperature ............................................. 111
5.2.2 Effect of structural changes .................................................................... 112
5.2.2.1 The relationship between structural changes and thermal
expansion coefficient ............................................................... 113
5.3 Characterisation of grating decay in the demarcation energy domain ................ 113
5.3.1 Effect of temperature ramping rate......................................................... 123
5.3.2 Thermal decay comparison of different gratings ................................... 124
5.4 Summary .............................................................................................................. 129
xii
CHAPTER 6: CONCLUSION AND FUTURE DIRECTION ............................... 131
6.1 Conclusion ........................................................................................................... 131
6.2 Future Direction ................................................................................................... 133
References ..................................................................................................................... 135
List of Publications and Papers Presented .................................................................... 154
Appendix ....................................................................................................................... 158
xiii
LIST OF FIGURES
Figure 2.1: Spectral response of fibre Bragg gratings....................................................... 8
Figure 2.2: Spectral response of a 20 mm long uniform FBG. ......................................... 9
Figure 2.3: Diffraction of a light wave by a grating (Erdogan, 1997). ........................... 10
Figure 2.4: Ray-optic illustration of reflection by an FBG (Erdogan, 1997). ................. 10
Figure 2.5: Schematic diagram of a tilted grating. .......................................................... 18
Figure 2.6: Schematic diagram of a chirped grating. ...................................................... 19
Figure 2.7: Experimental setup of the amplitude-splitting interferometer for grating
fabrication (Othonos, 1997). ........................................................................................... 26
Figure 2.8: Experimental setup for point-by-point fabrication technique (Othonos, 1997).
......................................................................................................................................... 28
Figure 2.9: Schematic representation of the FBG inscription setup. .............................. 31
Figure 2.10: Phase-mask technique for grating inscription. ........................................... 32
Figure 3.1: Index change of H2 loaded and non-loaded germanosilicate fibre during
grating inscription process. ............................................................................................. 38
Figure 3.2: Growth of index change of CO2 treated slow cooled fibre and non-treated fibre
during grating inscription with exposure to 193 nm ArF excimer laser. ........................ 39
Figure 3.3: Transmission spectra of the FBGs inscribed in treated and untreated
germanosilicate fibre using ArF excimer laser after a time duration of 3.5 min. ........... 41
Figure 3.4: Index change during grating inscription using 193 nm irradiation in UV pre-
exposed fibre with 50, 200, and 500 pulses and untreated germanosilicate optical fibre.
......................................................................................................................................... 41
Figure 3.5: Growth of index change of H2 loaded phosphorus doped fibre during grating
inscription with exposure to 193 nm ArF excimer laser irradiation. Inset, transmission
spectrum of a 15 mm long FBG inscribed in P-doped fibre. .......................................... 47
Figure 3.6: Ga content of the preform core at 40 different points with 36.2 µm distance
between each point including the micrograph of the Ga-doped optical fibre where the
arrow marks the position of the core. SiO2-95 wt% Ga-5 wt%. .................................... 48
Figure 3.7: Radial contour plot of fibre elemental analysis and Ga distribution profile
across the fibre core. ....................................................................................................... 49
xiv
Figure 3.8: Radial contour plot of fibre elemental analysis and Ge distribution profile
across the fibre core. ....................................................................................................... 49
Figure 3.9: Optical properties of Ga-doped and germanosilicate optical fibres. (a) Index
change at H2 free and H2 loaded conditions with ArF Excimer laser irradiation. (b) Index
growth at H2 loaded condition with KrF Excimer laser irradiation. (c) Centre wavelength
shift at H2 free and H2 loaded conditions with ArF excimer laser irradiation. (d) Centre
wavelength shift at H2 loaded condition with KrF excimer laser irradiation. ................. 52
Figure 3.10: Growth of absorption in Ga and Ge-doped core with respect to undoped glass
(cladding). ....................................................................................................................... 54
Figure 3.11: Photoluminescence spectra of Ga-doped and Ge-doped optical fibre
preforms excited by 193 nm laser. .................................................................................. 55
Figure 3.12: Dynamics of (a) Δnave and Δnmod, (b) Δnmax and Δnmin as a function of
cumulated fluence F. The dotted curves depict the phenomenological functions Δn [(1 +
νi)F] (blue) , Δn[(1 - νi)F] (red) and Δn[F] (grey). (c) The data points of Δnmax and Δnmin
are shifted to the new coordinates of [(1 + νi)F, Δnmax] and [(1 - νi)F, Δnmin] and they
overlap with the curve of Δn[F]. (d) Variation of vg during grating inscription process
(Lim et al., 2015). ............................................................................................................ 60
Figure 3.13: Variation of measured interference visibility at different fibre-phase-mask
distances (Lim et al., 2015). ............................................................................................ 61
Figure 3.14: Growth of Δnmax and Δnmin based on different single-pulse-fluences F = 13
J/cm² (Δ), 39 J/cm² (×) and 52 J/cm² (□). νi= ~0.85 (Lim et al., 2015). ......................... 62
Figure 3.15: Evolution of grating inscription with extended cumulated fluence. (a) Δnave
and Δnmod, (b) Δnmax and Δnmin and (c) grating visibility as a function of cumulated fluence
F (Lim et al., 2015). ........................................................................................................ 63
Figure 3.16: Schematic experimental setup for the proposed FBG bending technique.
OSA: Optical Spectrum Analyser, ASE: Amplified Spontaneous Emission Source...... 65
Figure 3.17: Transmission spectra of a 2 cm long grating written in FUD-2300 fibre. . 69
Figure 3.18: Overlaid graph of centre wavelength shift and variation of BTD with
increasing UV fluence. .................................................................................................... 69
Figure 3.19: (a) Growth of Δnave and Δnmod, (b) Δnmax and Δnmin represented as a function
of cumulated fluence F. (c) The points of Δnmax and Δnmin are moved to the new points
Δn[(1+vi)F] and Δn[(1-vi)F]. ........................................................................................... 70
Figure 3.20: Variation of the grating visibility during FBG inscription process. ........... 71
xv
Figure 3.21: Transmission spectra of an FBG inscribed in FUD-2300 at decreasing
bending radii.................................................................................................................... 72
Figure 3.22: The values of LHS and RHS calculated using data of centre wavelength shift
and BTD against the variation of bending radius based on Eq. (3.25). .......................... 74
Figure 3.23: (a), (b) and (c). The values of LHS and RHS calculated using data of centre
wavelength shift and BTD against the variation of bending radius based on Eq. (3.25).
......................................................................................................................................... 75
Figure 4.1: Schematic model for proposed decay of refractive index through thermal
excitation of trapped electrons (Erdogan et al., 1994). ................................................... 79
Figure 4.2: Measured integrated coupling constant (ICC) values normalised with respect
to the initial values for two gratings annealed until 350 and 550 ˚C as a function of decay
times. Solid lines represent the fits to Eq. 4.1 (Erdogan et al., 1994). ............................ 80
Figure 4.3: The power law factor A obtained from curve fits to Eq. (4.1) with α allowed
to vary freely (error bars), and α fixed by α =T/5250 K (open circles) (Erdogan et al.,
1994). .............................................................................................................................. 81
Figure 4.4: Normalised ICC in the demarcation energy, Ed domain. The solid line is
obtained using the fitting to Eq. (4.4) (Erdogan et al., 1994). ........................................ 82
Figure 4.5: Schematic diagram of the TEL system (Dong & Liu, 1997)........................ 83
Figure 4.6: The shift of Bragg wavelength during heating of a 15 mm long grating
inscribed in SM 1500. ..................................................................................................... 85
Figure 4.7: Transmission spectra indicating the red shift of the Bragg wavelength
inscribed in SM 1500 fibre during thermal annealing process. ...................................... 86
Figure 4.8: Schematic diagram of the CO2 laser annealing setup. .................................. 88
Figure 4.9: CO2 laser annealing setup. ............................................................................ 88
Figure 4.10: Schematic representation of the thermal annealing procedure conducted in
the tube furnace. .............................................................................................................. 90
Figure 4.11: The evolution of the Bragg transmission depth and centre wavelength of
treated and non-treated fibre at 100 °C, 200 °C and 300 °C. .......................................... 91
Figure 4.12: Accelerated ageing curves for gratings in CO2 treated slow cooled PS fibre
at 100 °C, 150 °C and 250 °C. ........................................................................................ 92
Figure 4.13: Evolution of the grating reflectivity of a 15 mm grating inscribed in SM 1500
fibre during thermal annealing. ....................................................................................... 96
xvi
Figure 4.14: The reflection spectra of the seed and regenerated gratings (SM 1500). ... 97
Figure 4.15: Progression of (a) grating reflectivity and shift of centre wavelength during
thermal regeneration at the temperature range from 25 °C to 720 °C (b) 3-dB bandwidth.
....................................................................................................................................... 101
Figure 4.16: Reflection spectra of formation and growth of gallosilicate RFBG. ........ 102
Figure 4.17: (a) Reflection spectra of the grating during the thermal annealing process at
50 °C, 200 °C, 400 °C and 600 °C (b) Reflection spectra of the seed and regenerated
gratings at 25 °C. ........................................................................................................... 103
Figure 4.18: First cycle of temperature calibration of the regenerated gallosilicate grating
in the range of 25-750 °C using a furnace with an increase rate of 2 °C/min. .............. 104
Figure 4.19: Centre wavelength shift of the RFBG with variation in temperature during
(a) heating process and (b) cooling process. ................................................................. 105
Figure 4.20: Wavelength stability performance over a time period of 8 hours at 720 ˚C.
....................................................................................................................................... 106
Figure 5.1: Rise of the refractive index change with increasing time during grating
fabrication. .................................................................................................................... 115
Figure 5.2: Transmission spectrum of the 10 mm long FBG inscribed in PS 1250/1500
fibre. .............................................................................................................................. 115
Figure 5.3: Accelerated ageing curves of continuous and stepwise thermal annealing
processes plotted on an overlaid graph. ........................................................................ 117
Figure 5.4: Progression of the centre wavelength during the continuous thermal annealing
process. .......................................................................................................................... 117
Figure 5.5: Progression of the centre wavelength during the stepwise thermal annealing
process. .......................................................................................................................... 118
Figure 5.6: Difference in grating reflectivity at 375 °C and 485 °C during continuous
annealing. ...................................................................................................................... 119
Figure 5.7: Thermal degradation of the grating with time in terms of NICC at different
temperatures of 125°C, 225°C, 325°C and 425°C. ....................................................... 120
Figure 5.8: Accelerated ageing curves at 200 °C, 300 °C and 400 °C for the treated
grating. .......................................................................................................................... 121
Figure 5.9: Predicted decay time for the treated FBG at 200 °C, 300 °C and 400 °C.
....................................................................................................................................... 122
xvii
Figure 5.10: Thermal decay characteristics of (a) PS 1250/1500 (b) SM 1500 and (c)
ZWPF at temperature ramping rates of 3 °C/min, 6 °C/min and 9 °C/min. ................. 126
Figure 5.11: Accelerated ageing curves of (a) PS 1250/1500 (b) SM 1500 and (c) OFS
ZWPF at temperature ramping rates of 3 °C/min, 6 °C/min and 9 °C/min. ................. 128
Figure 5.12: Segments of transmission spectra indicating the maximum grating
reflectivity of three regenerated gratings in PS 1250/1500, SM 1500 and ZWPF at 9
°C/min ramping rate. ..................................................................................................... 129
xviii
LIST OF TABLES
Table 2.1: Specifications of excimer laser sources ......................................................... 32
Table 2.2: Specifications of CO2 laser source ................................................................. 33
Table 3.1: Specification of Ga and Ge-doped optical fibres ........................................... 50
Table 3.2: The values of grating visibility obtained after FBG inscription and bending
comprising the respective cross correlation coefficients ................................................ 76
Table 5.1: Specifications of Ge/B co-doped photosensitive fibre................................. 113
xix
LIST OF SYMBOLS AND ABBREVIATIONS
ASE : Amplified Spontaneous Emission
BTD : Bragg Transmission Depth
CCG : Chemical Composition Grating
CW : Continuous Wave
DBR : Distributed Bragg Reflector
EDFA : Erbium Doped Fibre Amplifier
FBG : Fibre Bragg Grating
GODC : Germanium-Oxygen Defficiency Centre
ICC : Integrated Coupling Coefficient
LPG : Long Period Grating
MCVD : Modified Chemical Vapour Deposition
NA : Numerical Aperture
NBOHC : Non-Bridging Oxygen Hole Centres
NICC : Normalised Integrated Coupling Coefficient
NODV : Neutral Oxygen Di-vacancy
NOMV : Neutral Oxygen Monovacancy
OSA : Optical Spectrum Analyser
PS : Photosensitive
RFBG : Regenerated Fibre Bragg Grating
SG : Seed Grating
SMF : Single Mode Fibre
TFBG : Tilted Fibre Bragg Grating
UV : Ultra Violet
WDM : Wavelength Division Multiplexing
xx
LIST OF APPENDICES
Appendix A:
Figure A.1: Control panel of the LabVIEW program used to control the Optical
Spectrum Analyser (OSA) and the optical beam shutter.
158
Figure A.2: Segment of the block diagram of the LabVIEW program. 159
Figure A.3: Control panel of the excimer laser. 160
Figure A.4: Gas panel interface of the excimer laser. 160
1
CHAPTER 1: INTRODUCTION
This section intends to provide a general understanding about fibre Bragg gratings
(FBGs) to the readers who are less familiar with their structure, functionality and the
significance of photosensitivity, grating strength and thermal endurance of Bragg
gratings. It also emphasises the motivation behind the research conducted and presented
in this thesis. Furthermore, research objectives and the series of events leading to the
evolution of the thesis are outlined as well.
1.1 Background
The increased demand for communication capacity over the past three decades has
brought fibre optics into the limelight. One of the prime elements among both active and
passive components for optical communication are the fibre Bragg gratings. FBGs have
acquired prodigious technological advancements in terms of fabrication techniques, fibre
photosensitivity, grating structures and thermal endurance. Emerging as a strong
competitor for conventional electrical and electronic sensors, FBGs inherit immense
benefits including immunity to electro-magnetic interference, low fabrication cost, high
sensitivity and multiplexing capabilities (Kersey et al., 1997). These properties have led
to the wide use of FBGs particularly in the telecommunication and sensing industries.
FBGs are wavelength selective elements. Numerous FBG based components, tailored
to meet the stringent regulations of telecommunication systems exist. Among them, fibre
lasers, loss filters for gain equalisation, dispersion compensators, narrow band reflectors
for wavelength-division-multiplexing (WDM) and add-drop filters all of which play a
significant role (Kashyap, 1999). FBGs suitable for operations at temperatures well above
the standard telecommunication conditions are crucial in the development of fibre based
temperature sensors. Hence, the thermal characteristics of FBGs have been
2
comprehensively investigated in many research studies (Chen & Herman, 2003; Erdogan,
Mizrahi, Lemaire, & Monroe, 1994).
Bragg gratings are axially variable refractive index structures inscribed in the core of
an optical fibre through the usage of intense periodic ultraviolet irradiation.
Photosensitive dopants in the preform and hence the drawn fibres are the key factors
responsible for the formation of the grating structure by means of UV-induced index
change. The photosensitive response of an optical fibre may significantly vary based on
the type of dopant, prior treatment of the fibre, UV irradiation wavelength, UV laser
intensity and several other factors. Furthermore, implementation of effective grating
characterisation techniques at an early stage of research study is useful in obtaining
accurate measurements of the grating structure which also reflects on the stability and
repeatability of experimental procedures.
The type of the grating and the process of refractive index modification are vital when
employing FBGs as temperature sensors for high temperature applications. Different
approaches, for instance, tailoring the glass composition to improve the temperature
resistivity (Butov, Dianov, & Golant, 2006), process of hyper-sensitisation (Åslund &
Canning, 2000) and formation of type II and type IIa gratings using femtosecond lasers
(Archambault, Reekie, & Russell, 1993a; Groothoff & Canning, 2004) have been used to
accommodate FBGs in high temperature environments. In the recent years, a new type of
thermal resistant grating referred to as a regenerated fibre Bragg grating (RFBG) has been
reported (Bandyopadhyay, Canning, Stevenson, & Cook, 2008). Such gratings have
proven to be stable and robust for operations under extreme temperature conditions.
Prediction of grating life time is another important criteria which provides information
about the durability of a specific grating. This is useful when employing them in fibre
based devices for efficient functioning in the long run.
3
1.2 Motivation
A number of dopants have been used in optical fibres over the past few decades for
photosensitivity enhancement and efficient fabrication of FBGs. Nevertheless, it is
prudent to explore alternative materials to enhance fibre photosensitivity in terms of
simple fabrication with the incorporation of low dopant concentration and a single
absorption band that is compatible with the irradiation wavelength and photosensitive to
low UV fluence levels. In addition, grating and interference visibilities are two important
parameters which have a direct influence on the grating strength. The grating strength and
reflectivity of a particular FBG rely on the “ac” coupling coefficient, which is associated
with the grating visibility (Erdogan, 1997). Despite the high UV fluence applied in the
grating inscription process, the growth of grating reflectivity may be rather slow due to
the poor interference visibility (Huebner, Svalgaard, Gruener-Nielsen, & Kristensen,
1997). Thus, it would be beneficial to acquire details about the interference and grating
visibilities of a particular FBG, as it would provide accurate information about the grating
strength of the fibre.
The other factor that also motivated this research study was the need to provide the
visibility values for the users who employ commercial FBGs in various applications.
Awareness about these details allow optimisation of the grating inscription system,
resulting in the acquisition of efficient and quality FBGs with enhancing photosensitivity
capabilities. Moreover, it prevents excessive UV irradiation which would weaken the
fibre glass strength.
Many of the research studies often focus on RFBGs fabricated in Germanium-doped
(Ge) optical fibres, whereas only a few have revealed the existence of RFBGs in non-Ge-
doped optical fibres (Yang, Qiao, Das, & Paul, 2014). Hence, these RFBGs are attracting
the attention of the research community. Thus, the development of optical fibres with new
4
glass compositions which consist of a single dopant with high photosensitivity
characteristics together with high temperature sustainability is essential and provides the
opportunity to be used as alternatives to the existing RFBGs.
In a RFBG, the low reflectivity and the complete erasure of the seed grating are
considered as draw-backs when obtaining detailed information about the grating. Besides,
it is imperative to explore new types of enduring gratings with minimum decay in the
grating reflectivity and consisting of extended lifetimes which are produced by thermal
annealing at a temperature below the transition temperature of the glass, Tg.
1.3 Research Objectives
1. To investigate the photosensitivity of Gallium (Ga) doped optical fibres and the
thermal stability of Bragg gratings inscribed in them at elevated temperatures.
2. To study and analyse the grating and interference visibilities of a fibre Bragg
grating with increasing UV fluence through the development of a mathematical
model and to investigate the influence of them on the spectral properties and
grating strength of the FBG.
3. To demonstrate and characterise the grating strength of a thermal enduring grating
fabricated based on the thermally induced reversible effect.
1.4 Evolution of the thesis
The research contribution of this thesis is divided into 6 chapters.
Chapter 1 is a short introduction to the thesis which includes a brief background about
the significance of FBGs, motivation which led to the investigations carried out in this
research study, research objectives and evolution of the thesis.
5
Chapter 2 focuses on fundamentals and theoretical concepts of FBGs with particular
emphasis on coupled-mode theory. In addition, a general classification of different types
of grating structures and inscription techniques are outlined as well.
Chapter 3 is an overview of the fibre photosensitivity which describes the
photosensitivity mechanisms, currently existing techniques for photosensitivity
enhancement and material considerations for the fabrication of photosensitive fibres.
Gallium (Ga) is suggested as a new photosensitive dopant and the role of Ga-doped
optical fibre during grating inscription is demonstrated. The curve-matching technique
and bent-spectral analysis technique are proposed in this chapter for characterisation of
the grating strength in terms of interference and grating visibilities.
Chapter 4 is a discussion on the thermal stability and decay characteristics of FBGs.
A brief description about various decay models and methods to increase the thermal
stability of Bragg gratings is provided. The regeneration characteristics of Ga-doped fibre
suitable to withstand high temperature environments are explored and illustrated.
Chapter 5 describes the thermally induced reversible effect focusing on the
fabrication of thermal enduring gratings and the prediction of their lifetimes. The grating
decay is characterised in the demarcation energy domain. In addition, the effect of
different temperature ramping rates during thermal annealing on grating decay is
included.
Chapter 6 concludes the thesis with a discussion of different possible applications and
implications of the research results presented with possible suggestions for future work
based on the research findings of this thesis.
6
CHAPTER 2: THEORETICAL LITERATURE OF FIBRE BRAGG GRATINGS
This chapter is dedicated to the theory of fibre Bragg gratings (FBGs). Some of the
salient features of different types of Bragg gratings, which depend on their various
refractive index modulation profiles, are demonstrated. Particularly, a numerical
expression for reflectivity is shown as a function of wavelength for Bragg gratings with
the use of coupled-mode equations. This chapter also intends to provide a general
understanding of the various fabrication techniques involved in grating inscription with
specific emphasis on the phase-mask technique.
2.1 Maxwell’s Equations
Electromagnetic theory of optics initiates with the introduction of Maxwell’s
equations. It forms an entire theory of optical propagation phenomena, which explains
many known observations on light propagation. The Maxwell’s equations which describe
the electromagnetic field state:
B
Et
(2.1)
D
H Jt
(2.2)
D (2.3)
0B (2.4)
where E , H are the electric and magnetic field vectors respectively, D and B are the
electric and magnetic flux densities. J and ρ represent the displacement current and the
volume charge density respectively. In the dielectric media of the optical fibre in the
absence of free charges, the latter two parameters are null:
0
0
J
(2.5)
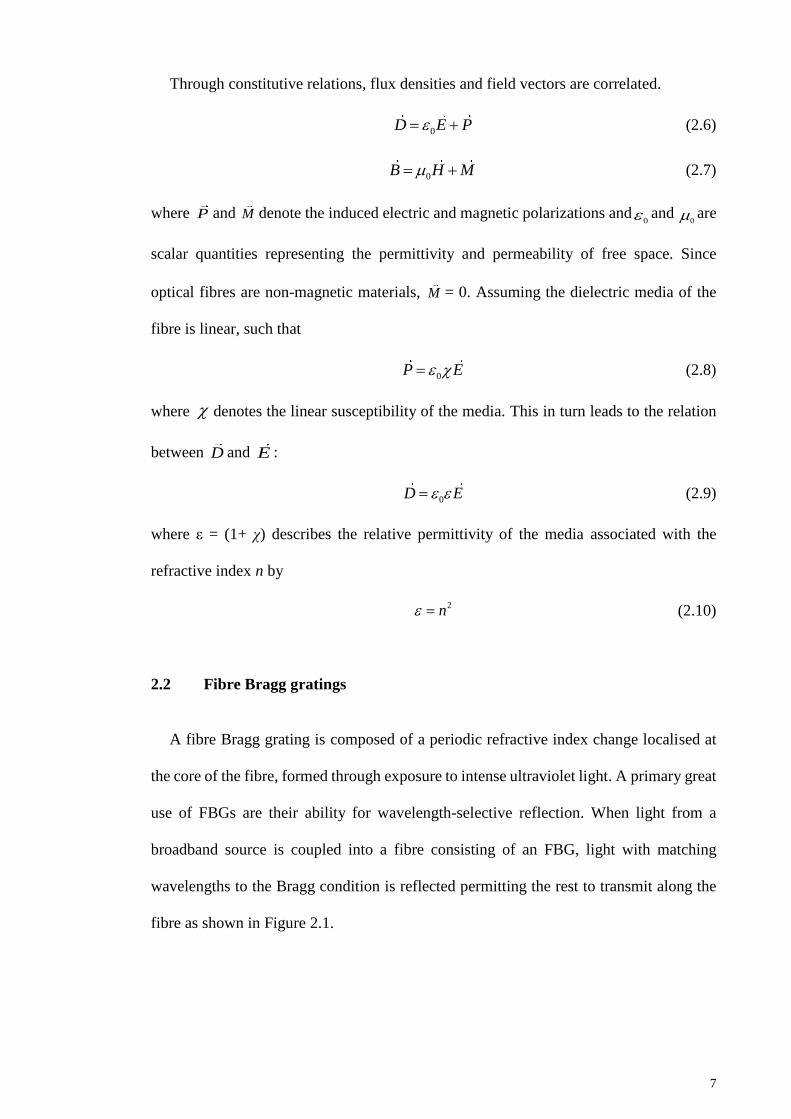
7
Through constitutive relations, flux densities and field vectors are correlated.
0D E P (2.6)
0B H M (2.7)
where P and M denote the induced electric and magnetic polarizations and0 and
0 are
scalar quantities representing the permittivity and permeability of free space. Since
optical fibres are non-magnetic materials, M = 0. Assuming the dielectric media of the
fibre is linear, such that
0P E (2.8)
where denotes the linear susceptibility of the media. This in turn leads to the relation
between D and E :
0D E (2.9)
where ε = (1+ χ) describes the relative permittivity of the media associated with the
refractive index n by
2n (2.10)
2.2 Fibre Bragg gratings
A fibre Bragg grating is composed of a periodic refractive index change localised at
the core of the fibre, formed through exposure to intense ultraviolet light. A primary great
use of FBGs are their ability for wavelength-selective reflection. When light from a
broadband source is coupled into a fibre consisting of an FBG, light with matching
wavelengths to the Bragg condition is reflected permitting the rest to transmit along the
fibre as shown in Figure 2.1.
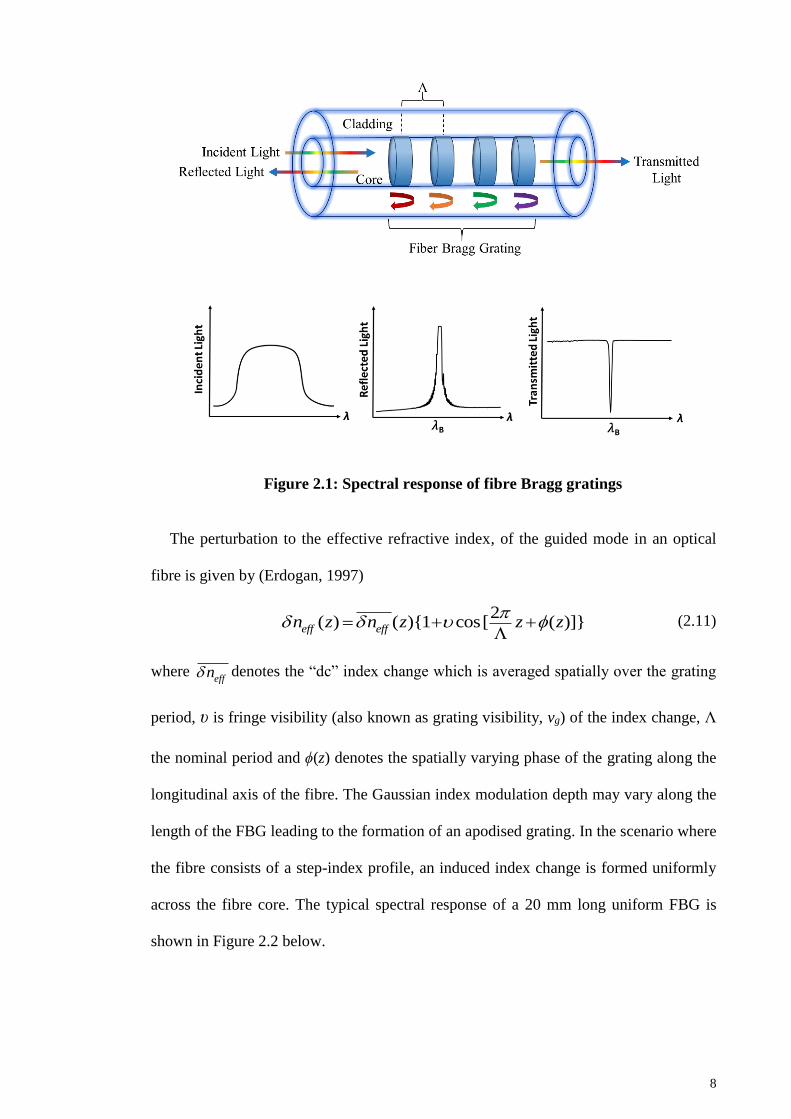
8
Figure 2.1: Spectral response of fibre Bragg gratings
The perturbation to the effective refractive index, of the guided mode in an optical
fibre is given by (Erdogan, 1997)
2
( ) ( ){1 cos[ ( )]}eff eff
n z n z z z
(2.11)
where eff
n denotes the “dc” index change which is averaged spatially over the grating
period, υ is fringe visibility (also known as grating visibility, vg) of the index change, Λ
the nominal period and ϕ(z) denotes the spatially varying phase of the grating along the
longitudinal axis of the fibre. The Gaussian index modulation depth may vary along the
length of the FBG leading to the formation of an apodised grating. In the scenario where
the fibre consists of a step-index profile, an induced index change is formed uniformly
across the fibre core. The typical spectral response of a 20 mm long uniform FBG is
shown in Figure 2.2 below.
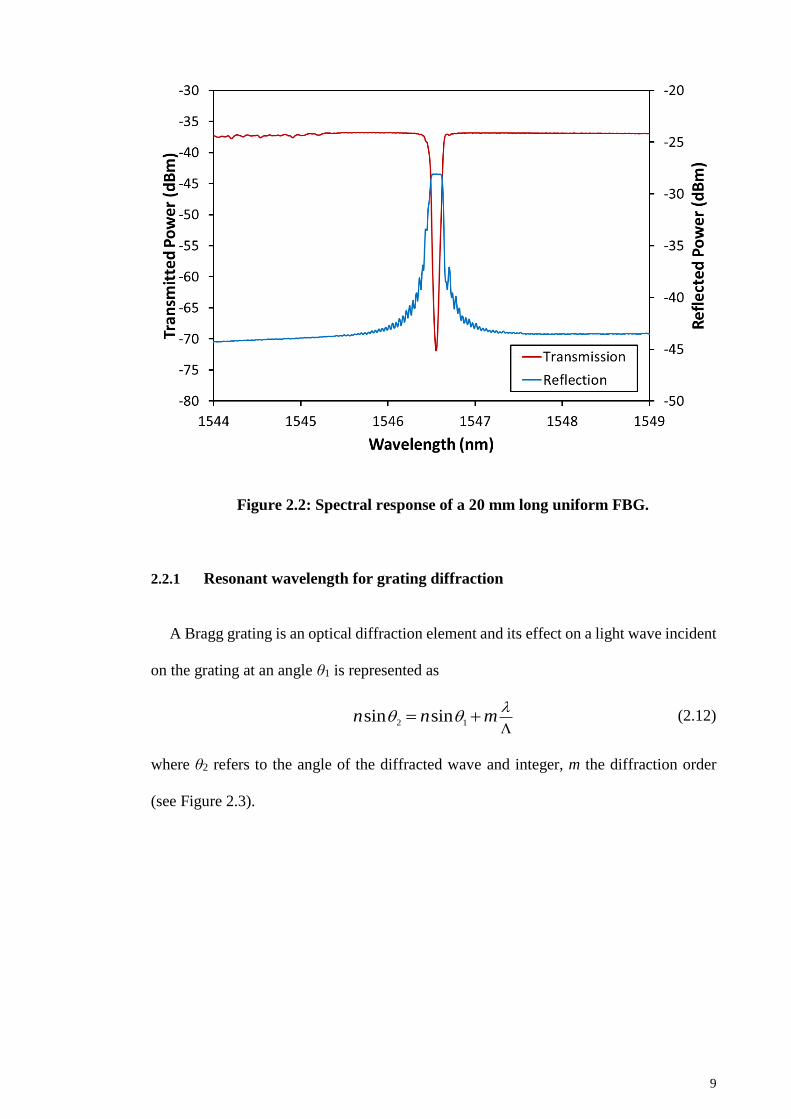
9
Figure 2.2: Spectral response of a 20 mm long uniform FBG.
2.2.1 Resonant wavelength for grating diffraction
A Bragg grating is an optical diffraction element and its effect on a light wave incident
on the grating at an angle θ1 is represented as
2 1sin sinn n m
(2.12)
where θ2 refers to the angle of the diffracted wave and integer, m the diffraction order
(see Figure 2.3).
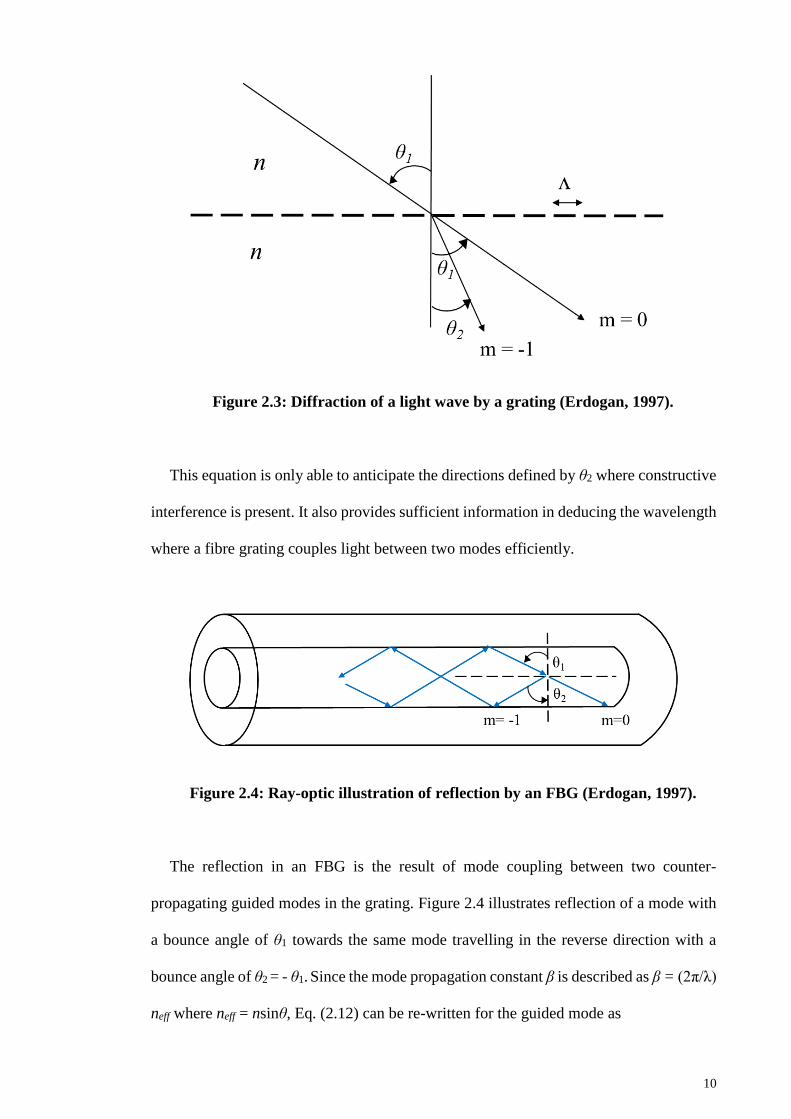
10
Figure 2.3: Diffraction of a light wave by a grating (Erdogan, 1997).
This equation is only able to anticipate the directions defined by θ2 where constructive
interference is present. It also provides sufficient information in deducing the wavelength
where a fibre grating couples light between two modes efficiently.
Figure 2.4: Ray-optic illustration of reflection by an FBG (Erdogan, 1997).
The reflection in an FBG is the result of mode coupling between two counter-
propagating guided modes in the grating. Figure 2.4 illustrates reflection of a mode with
a bounce angle of θ1 towards the same mode travelling in the reverse direction with a
bounce angle of θ2 = - θ1. Since the mode propagation constant β is described as β = (2π/λ)
neff where neff = nsinθ, Eq. (2.12) can be re-written for the guided mode as
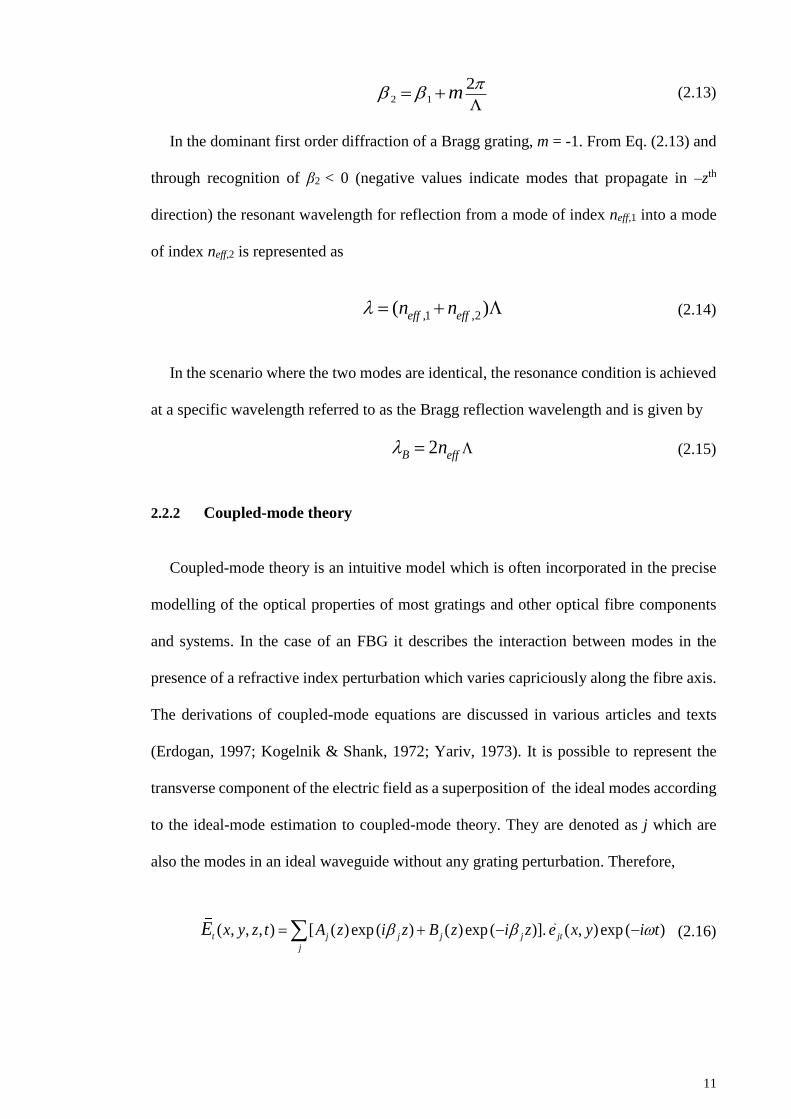
11
2 1
2m
(2.13)
In the dominant first order diffraction of a Bragg grating, m = -1. From Eq. (2.13) and
through recognition of β2 < 0 (negative values indicate modes that propagate in –zth
direction) the resonant wavelength for reflection from a mode of index neff,1 into a mode
of index neff,2 is represented as
,1 ,2( )
eff effn n (2.14)
In the scenario where the two modes are identical, the resonance condition is achieved
at a specific wavelength referred to as the Bragg reflection wavelength and is given by
2B effn (2.15)
2.2.2 Coupled-mode theory
Coupled-mode theory is an intuitive model which is often incorporated in the precise
modelling of the optical properties of most gratings and other optical fibre components
and systems. In the case of an FBG it describes the interaction between modes in the
presence of a refractive index perturbation which varies capriciously along the fibre axis.
The derivations of coupled-mode equations are discussed in various articles and texts
(Erdogan, 1997; Kogelnik & Shank, 1972; Yariv, 1973). It is possible to represent the
transverse component of the electric field as a superposition of the ideal modes according
to the ideal-mode estimation to coupled-mode theory. They are denoted as j which are
also the modes in an ideal waveguide without any grating perturbation. Therefore,
( , , , ) [ ( ) exp ( ) ( ) exp ( )]. ( , ) exp ( )t j j j j jt
j
x y z t A z i z B z i z e x y i tE (2.16)
12
where Aj (z) and Bj (z) denote the respective amplitudes of the j th mode propagating in
the +z and –z directions while being subjected to slow variation. The transverse mode
fields ( , )jte x y explain cladding modes. The modes are orthogonal in an ideal waveguide
and therefore, energy exchange does not take place. Hence, the dielectric perturbation
causes the modes to be coupled where the amplitudes Aj and Bj of mode j evolve along z
axis based on
( )exp[ ( ) ]
( )exp [ ( ) ]
j t zjk k j k j k
k
t zjk k j k j k
k
dAi A K K i z
dz
i B K K i z
(2.17)
( )exp[ ( ) ]
( )exp [ ( ) ]
j t zjk k j k j k
k
t zjk k j k j k
k
dBi A K K i z
dz
i B K K i z
(2.18)
t
k jK is the transverse coupling coefficient between the modes j and k in Eq. (2.17) and
Eq. (2.18). It is given by
*( ) ( , , ) ( , ) . ( , )
4
tj tk j k tK z dx dy x y z e x y e x y
(2.19)
where Δε is the perturbation to the permittivity and is approximately expressed as Δε ≈
2nδn when δn < n. The longitudinal coefficient ( )z
k jK z is analogous to ( )t
k jK z . However,
this coefficient is generally omitted since usually for fibre modes ( )z
k jK z ≪ ( )t
k jK z .
The induced index change of gratings is uniform across the fibre core and is absent
outside the core. Therefore, the core index change can be described by con (z). The
definition of the two new coefficients is
*( ) ( ) ( , ). ( , )
2co
co j tk j k t
core
nz n z dx dy e x y e x y
(2.20)
13
( ) ( )2
k j k jz z
(2.21)
where σ is the “dc” coupling coefficient and κ is the “ac” coupling coefficient which
results in a general coupling coefficient of
2
( ) ( ) 2 ( )cos ( )t
k j k j k jK z z z z z
(2.22)
In the case of FBGs, the dominant interaction is considered to be the reflection of a
mode of amplitude A(z) into an identical counter-propagating mode consisting of an
amplitude B(z). Eq. (2.17) and Eq. (2.18) can be further simplified by keeping the terms
which include amplitudes of the specific mode and then carrying out synchronus
approximation. Eq. (2.18) requires the negligence of terms on the right-hand side of the
differential equations since these terms have minimal contribution towards the growth
and decay of amplitudes and are dependent on the rapidly oscilating z. The resultant
equations are
ˆ ( ) ( )dR
i R z i S zdz
(2.23)
*ˆ ( ) ( )dS
i S z i R zdz
(2.24)
where the amplitudes R and S denote R(z) ≡ A(z) exp (iδz - ϕ/2) and S(z) ≡ B(z) exp (-iδz
+ ϕ/2). “κ” refers to the “ac” coupling coefficient defined in Eq. (2.21) and is the general
“dc” self-coupling coefficient expressed as
1
2ˆ
d
dz
(2.25)
The detuning δ, independent of z for all gratings is given by
D
1 1
2 ( )eff
D
n
(2.26)
14
where 𝜆D ≡ 2neffΛ is the design wavelength for a weak grating (δneff → 0) consisting of a
grating period, Λ. When δ = 0, the Bragg condition is met 𝜆 = 2neffΛ. The “dc” coupling
coefficient is introduced in Eq. (2.20). The derivative (1/2)dϕ/dz explains the chirp of the
grating period and ϕ(z) is defined through Eq. (2.11) and Eq. (2.22). An FBG inscribed in
single-mode fibre can be described using the relations below:
2
effn
(2.27)
*
effn
(2.28)
For a grating which is uniform along the z axis, effn is a constant and dϕ/dz = 0, and
therefore, κ, σ and are also constants. Hence, Eq. (2.23) and (2.24) are referred to as
coupled first-order differential equations which contain constant coefficients. The
reflectivity of a uniform FBG with length L can be analytically calculated through the
assumption of a forward propagating wave incident from z = -∞ [eg: R(-L/2) = 1] with the
absence of a backward propagating wave for z ≥ L/2 which is S(L/2) = 0. The amplitude
and power reflection coefficients are ρ = S(-L/2)/R(-L/2) and r = |ρ|2 respectively, and can
be expressed as
2 2
2 2 2 2 2 2
ˆsinh ( )
ˆ ˆ ˆ ˆsinh ( ) cosh ( )
L
L i L
(2.29)
and
2 2 2
22 2 2
2
ˆsinh ( )
ˆˆcosh ( )
Lr
L
(2.30)
The normalised wavelength is
max
1
ˆ1
L
N
(2.31)
15
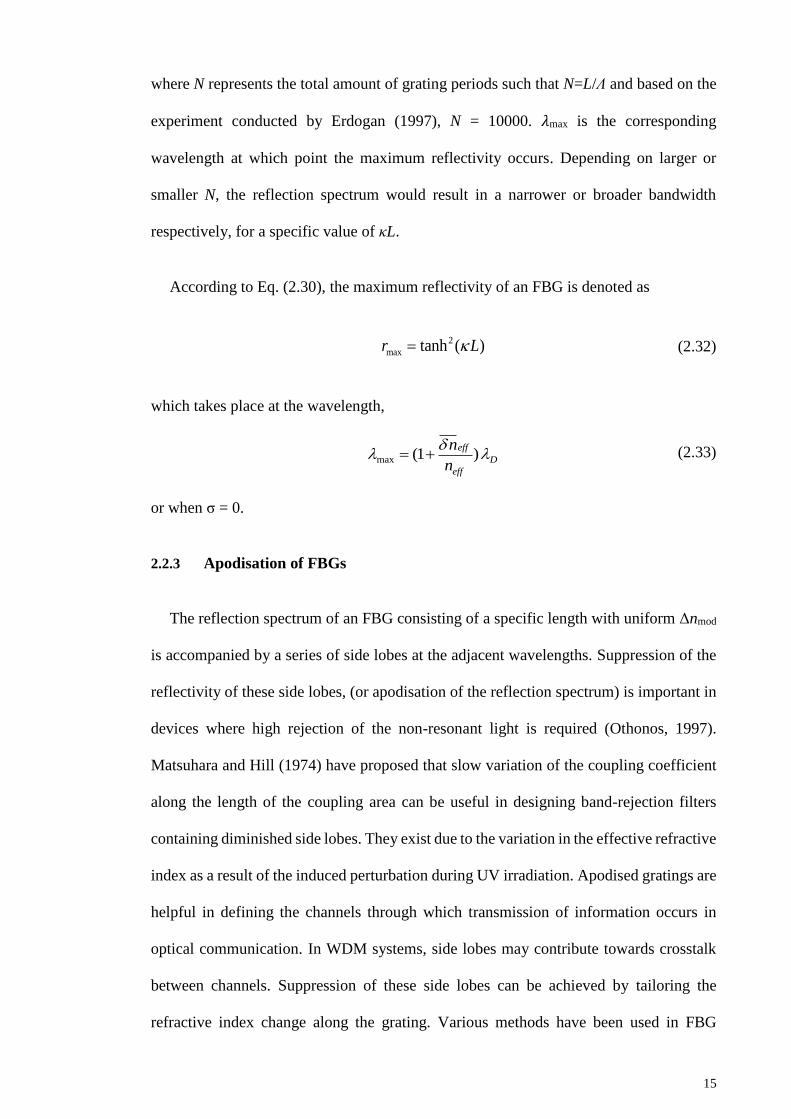
where N represents the total amount of grating periods such that N=L/Λ and based on the
experiment conducted by Erdogan (1997), N = 10000. 𝜆max is the corresponding
wavelength at which point the maximum reflectivity occurs. Depending on larger or
smaller N, the reflection spectrum would result in a narrower or broader bandwidth
respectively, for a specific value of κL.
According to Eq. (2.30), the maximum reflectivity of an FBG is denoted as
2
max tanh ( )r L (2.32)
which takes place at the wavelength,
max (1 )
eff
D
eff
n
n
(2.33)
or when σ = 0.
2.2.3 Apodisation of FBGs
The reflection spectrum of an FBG consisting of a specific length with uniform Δnmod
is accompanied by a series of side lobes at the adjacent wavelengths. Suppression of the
reflectivity of these side lobes, (or apodisation of the reflection spectrum) is important in
devices where high rejection of the non-resonant light is required (Othonos, 1997).
Matsuhara and Hill (1974) have proposed that slow variation of the coupling coefficient
along the length of the coupling area can be useful in designing band-rejection filters
containing diminished side lobes. They exist due to the variation in the effective refractive
index as a result of the induced perturbation during UV irradiation. Apodised gratings are
helpful in defining the channels through which transmission of information occurs in
optical communication. In WDM systems, side lobes may contribute towards crosstalk
between channels. Suppression of these side lobes can be achieved by tailoring the
refractive index change along the grating. Various methods have been used in FBG
16
apodisation including the amplitude mask technique (Albert, Hill, Johnson, Bilodeau, &
Rooks, 1996), variable diffraction efficiency phase-mask technique (Albert et al., 1995),
intrinsic apodisation using UV pulse interferometry (Cortes, Ouellette, & LaRochelle,
1998), moving fibre/phase-mask-scanning beam technique (Cole, Loh, Laming, Zervas,
& Barcelos, 1995) and multiple printing of in-fibre gratings (Storøy, Engan, Sahlgren, &
Stubbe, 1997). Cole et al. (1995) has demonstrated that grating apodisation can also be
obtained by applying dither to the fibre. Furthermore, the study by Stephens et al. (1996)
indicates that dithering the phase-mask is a much more relaible procedure compared to
that of the fibre and leads to an enhanced mechanical stability of the grating inscription
system. This method also allows the addition of a phase shift to the grating.
2.3 Types of fibre Bragg gratings
Several distinct types of FBGs exist and have been widely explored in the literature.
The forthcoming sections provide a brief overview on the various structures of Bragg
gratings together with some of their applications based on their coupling and growth
characteristics during grating inscription. The common Bragg reflector, long period
gratings, tilted gratings, chirped gratings, phase-shifted gratings, type I, type II and type
IIa gratings are some of them. Furthermore, the photosensitivity and thermal stability
characteristics of some of these gratings are discussed in Chapter 3, 4 and 5.
2.3.1 Common Bragg Reflector
The first intra-core fibre grating written with the aid of a “self-induced” writing
technique is referred to as the common Bragg reflector (Othonos, 1997). A Bragg reflector
can operate as a narrow-band transmission or reflection filter or as a broadband mirror
based on other parameters such as grating length and the extent of the induced index
change. When combined with other Bragg reflectors, they can be used as bandpass filters.
17
Bragg reflectors are considered to be outstanding candidates for strain and temperature
sensing devices due to their wavelength encoded detection which eliminates problems
caused by the fluctuations in the amplitude or intensity in other fibre sensors. As a result
of the specific wavelength-encoded signature, a sequence of Bragg reflectors can be
inscribed in the same fibre where each of them exhibit a separate Bragg resonance signal
(Othonos, 1997). This arrangement is useful in wavelength division multiplexing or quasi
distributed sensing applications (Morey, Dunphy, & Meltz, 1992) and can be further used
as components in semiconductor or tuneable lasers (Ball & Morey, 1991; Ball, Morey, &
Glenn, 1991; D’Amato & Dunphy, 1992). Ball and Morey (1992) has elaborated on a
continuously tuneable single-mode erbium fibre laser. The capability to continuously tune
with the exception of mode hopping has been obtained by uniformly stretching both the
gratings and the fibre enclosed. Fibre lasers based on Bragg gratings are also beneficial
as sensors. In this scenario, the Bragg reflector facilitates dual purposes, as the tuning
element and the sensor (Othonos, Alavie, Melle, & Karr, 1993).
2.3.2 Long period gratings (LPGs)
Long period gratings consist of a grating period typically in the order of 100 µm and
have been initially demonstrated by Vengsarkar et al. (1996) where the LPGs have been
fabricated using an amplitude mask. These gratings couple the guided core mode and the
cladding modes that are co-propagating in the fibre. In the process, light may be lost
owing to absorption and scattering. LPGs can serve as loss filters for gain equalisation in
Erbium-doped fibre amplifier (EDFA). Furthermore, a number of coatings exist for LPGs
which can improve or even initiate sensitivity to some external physical or chemical
influences (James & Tatum, 2003; Pilla et al., 2005; Smietana, Korwin-Pawlowski, Bock,
Pickrell, & Szmidt, 2008; Sun, Li & Liu, 2005). Due to the long period of the grating,
LPGs can be successfully created with the aid of point by point writing using heat or UV
18
exposure. In order to locally heat the fibre, a CO2 laser or an electric arc discharge can be
used (Dianov, Karpov et al., 1997).
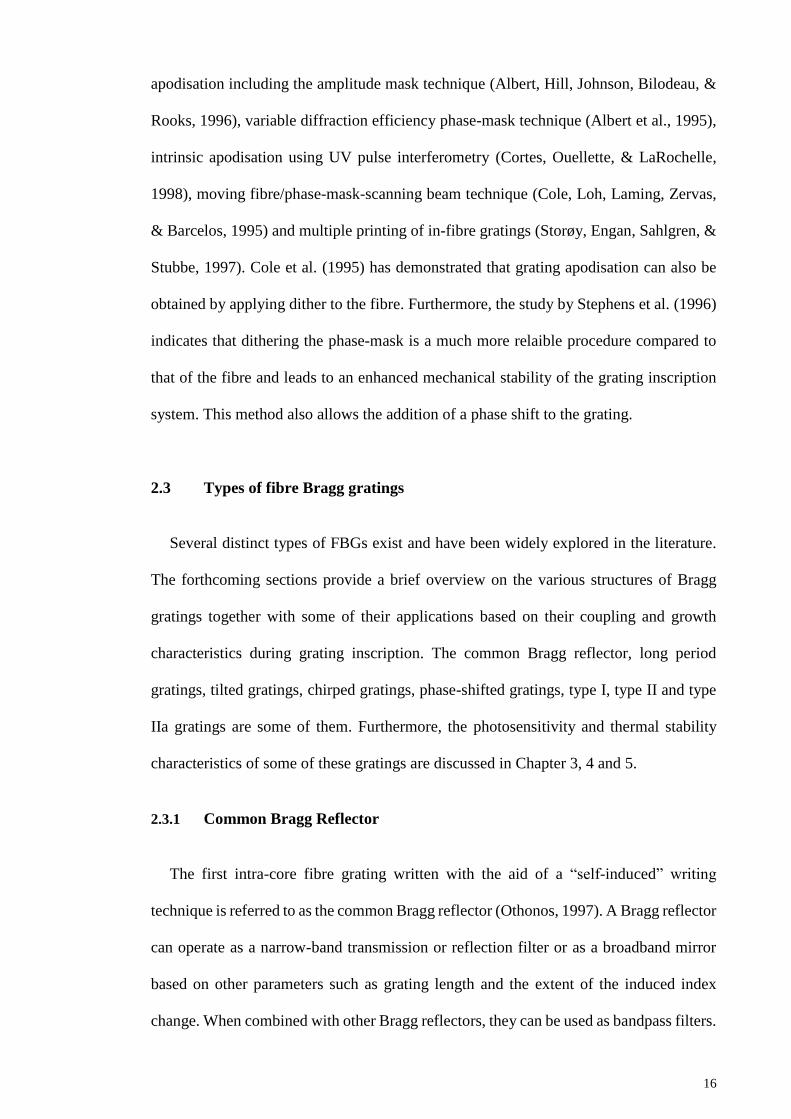
2.3.3 Tilted gratings
In standard FBGs, the change in the refractive index occurs uniformly across the width
of the fibre. By tilting fringes (or blazing) of Bragg gratings at an angle to the optical axis,
light can be coupled out from the fibre core to the backward propagating radiation modes.
These loss gratings are generally known as slanted gratings or tilted FBGs (TFBGs)
(Figure 2.5). The tilted angle of a TFBG affects the reflected wavelength as well as the
bandwidth (Kashyap, 1999). Such gratings are useful in refractive index measurements
(Caucheteur, Wuilpart, Chen, Megret, & Albert, 2009). Furthermore, they are useful for
gain equalisation of EDFAs (Riant, 2002). Another intriguing application of tilted
gratings is in mode conversion. The periodic refractive-index perturbation induced along
the fibre length consists of a periodicity which connects the mismatch in momentum
among the modes. This permits phase-matched coupling between selected modes,
resulting in the production of a mode converter. Various grating periods can be used for
mode conversion at various wavelengths (Othonos, 1997). A mode conversion efficiently
carried out between forward propagation modes, LP01 and LP11 has been studied by Hill,
Bilodeau, Malo, and Johnson (1991).
Figure 2.5: Schematic diagram of a tilted grating.
19
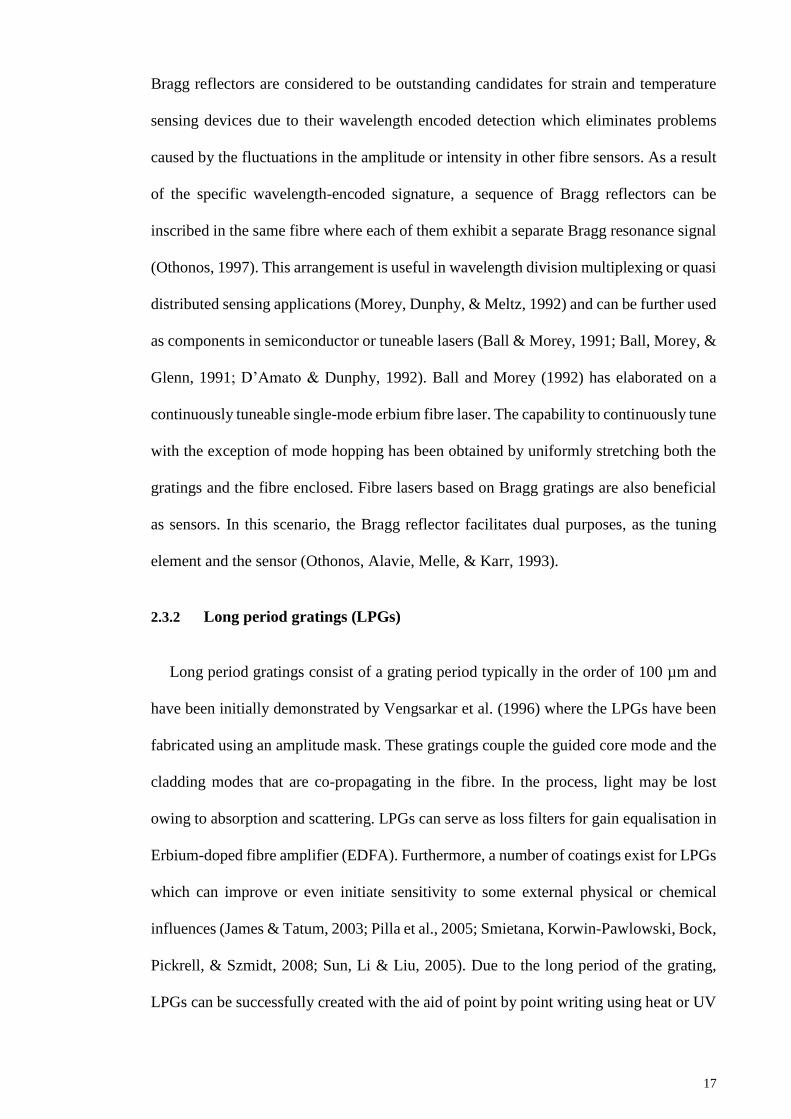
2.3.4 Chirped gratings
A chirped grating possesses a monotonically varying grating period along its length
(see Figure 2.6) and can be achieved by axially altering either the period of the grating or
the refractive index of the fibre core or both. Varying the amplitude of the Δnmod profile
or tapering the grating length region of the fibre leads to a change in the average refractive
index (Byron, Sugden, Bricheno, & Bennion, 1993). These type of gratings typically
exhibit a broad spectral response reflecting wavelengths associated with the range of
grating periods along the length of the grating. Various fabrication techniques are used in
the inscription of chirped gratings (Byron et al., 1993; Hill et al., 1994; Kashyap, McKee,
Campbell, & Williams, 1994; Martin, Lauzon, Thibault, & Ouellette, 1994; Sugden,
Bennion, Molony, & Copner, 1994). A simple and a repeatable method for chirped grating
fabrication relies on the phase-mask where a step chirp is used to approximate the linear
chirp (Othonos, 1997). These chirped gratings are used in compensation for the scattering
in communication networks and for intra-grating sensing (Nand, 2007). Furthermore,
broadband chirped FBGs are used for pump rejection and for recycling unabsorbed pump
light from an EDFA (Farries, Radgale, & Reid, 1992). A recent study has demonstrated
the fabrication of chirped broadband FBGs using ultrafast laser inscription process
(Antipov et al., 2016). In addition, Markowsky, Jedrzejewski, and Osuch (2016) have
conducted a theoretical analysis of double chirp effect in tapered and linearly chirped
FBGs.
Figure 2.6: Schematic diagram of a chirped grating.
20
2.3.5 Phase-shifted gratings
Phase-shifted gratings have a discontinuity in the phase along the periodic grating
structure. The phase shift separates the grating into two, which results in two Bragg
gratings. These gratings are out of phase with each other and act as a wavelength-selective
Fabry-Perot resonator. The phase shift results in the production of a narrow transmission
resonance at a specific wavelength inside the bandwidth of the grating which is verified
with reference to the amplitude and the position of the phase shift (Erdogan, 1997). There
are several different approaches for the production of phase-shifted gratings. Canning and
Sceats (1994) have fabricated phase-shifted gratings using a UV post processing
technique. Several other studies have demonstrated fabrication of phase-shifted gratings
by other means such as etching the centre of pre-fabricated FBGs (Iadicicco,
Campopiano, Paladino, Cutolo, & Cusano, 2007), phase-mask shift at half of its period
throughout FBG inscription procedure (Stepanov, Canning, & Brodzeli, 1999) or merely
by use of a phase-shifted phase-mask (Kashyap et al., 1994).
2.3.6 Classification by growth characteristics
Gratings can be categorised based on their growth characteristics during the inscription
process. Surface relief gratings based on surface corrugation or modification of the
cladding closer to the fibre core have been used in some applications even prior to the
finding of photosensitivity in optical fibres. These gratings can generally be produced
using etching or polishing processes (Rowe, Bennion, & Reid, 1987). In this section,
Bragg gratings are classified into three categories of type I, type II and type IIa gratings.
The type of the final grating relies on the initial grating inscription conditions and the
properties of the respective fibre.
21
2.3.6.1 Type I gratings
Type I gratings are the most widely employed gratings, formed under moderate
irradiation intensities and are characterised by their monotonous growth pattern. The
spectral response of a uniform type I FBG is previously indicated in Figure 2.2. The
reflection spectrum of the grating is corresponds to the transmission spectrum which
indicates a lossless or negligible loss system due to absorption or reflection into the fibre
cladding. Hence, this is an important feature of Type I FBGs. In addition, it is possible to
erase type I gratings at relatively low temperatures, around 200 °C. However, they can
effectively operate over a temperature range of -40 to +80 °C.
2.3.6.2 Type II gratings
Type II gratings, also referred to as optically damaged gratings have been initially
described in an experiment conducted to investigate the link between the pulse energy
and the grating strength where the refractive index change has been predicted from the
reflection spectrum with the aid of coupled mode theory (Archambault et al., 1993a).
These gratings are produced when the energy of the inscription beam is raised above 30
mJ (Archambault, Reekie, & Russell, 1993b). This causes physical damage to a particular
side of the fibre core. When examined under an optical microscope a damaged track has
been revealed in the core-cladding interface, a typical characteristic of this type of grating
(Islam et al., 2016). The fact that the damage is restricted to one side of the fibre core
indicates that the majority of the UV light has been absorbed locally.
Since the definite threshold is accompanied by a higher change in the Δnmod, gratings
with high reflectivity characteristics can be inscribed using a single laser pulse. Saturation
of the refractive index modulation at a value of 3×10⁻³ is observed when the pulse energy
exceeds 40-60 mJ (Kashyap, 1999). Energy in the range of 50-60 mJ is capable of
22
destroying the optical fibre. A type II grating generally possesses a broad reflection
spectrum where irregularity can be observed over the whole of the spectral profile owing
to non-uniformity in the laser beam profile that are magnified strongly by the highly
nonlinear response mechanism of the glass core (Grattan & Meggitt, 2000). Spatial
filtering of the beam allows generation of gratings with improved reflection profiles but
with a decreased grating reflectivity (Archambault, 1994). Type II gratings pass
wavelengths longer than 𝜆B. As in the case for etched or relief FBGs (Russell & Ulrich,
1985), shorter wavelengths are strongly coupled into the cladding.
Investigations regarding thermal stability of type II gratings indicate that they are
extremely stable at elevated temperatures (Archambault et al., 1993a). Decay of the
grating reflectivity is not visible at 800 °C over a time period of 24 hours. However, near
1000 °C most of the grating gradually extinguishes demonstrating that the localised fusion
has been thermally wiped away. This superior temperature stability of type II gratings is
beneficial for sensing applications in extreme temperature environments.
2.3.6.3 Type IIa gratings
Type IIa gratings possess similar spectral characteristics to those of Type I gratings
but have different thermal stability levels (Pal, 2006). Due to the various mechanisms
involved with the inscription of these gratings there are some significant characteristics
which can be observed under dynamic conditions during initial fabrication or thermal
annealing of the gratings. Type IIa gratings can be generated at low power densities or
after long exposure using pulsed lasers (Xie et al., 1993). They generally consist of a
characteristic rollover in the index growth during grating fabrication and can be tuned to
be thermally stable up to 800 °C for short term usage (Groothoff & Canning, 2004). Bragg
gratings of Type IIa are generally present in pristine fibres with a highly germanium-
doped core (≥ 20 mol. % GeO2) when exposed to UV irradiation. Here photosensitivity
23
is present due to the dilation of the glass network which results in a decrease in the index
in the irradiated regions (Ky, Limberger, Salathé, Cochet, & Dong, 2003). The reverse
shift of Bragg wavelength compared to the original starting point demonstrating a
decrease in the average refractive index, results in the formation of a negative index
grating.
The negative component as well as the fact that the grating is formed below the damage
threshold are important features of Type IIa gratings (Canning, 2008). Based on the
applied tension and other parameters, the magnitude of the negative component differs.
Even though full stress relief has not been noticed, it has been reported that type IIa
gratings are linked with the diminished axial stress (Ky et al., 2003). Poignant et al. (1997)
has demonstrated that the presence of H2 results in a significant variation in the inscription
properties of Type IIa gratings. Fabrication of Type IIa thermally regenerated gratings on
highly Ge-doped photosensitive fibre using 248 nm nano-second laser pulses has been
reported by Lindner et al. (2009). In addition, a recent study has reported about the
production of a type IIa RFBG using the thermal activation process at 600 °C in Ge/B co-
doped fibre (Cheong, Chong, Chong, Lim, & Ahmad, 2014). The improved thermal
stability of Type IIa gratings in comparison to the type I gratings is a valuable advantage
of these gratings especially when exposed to high ambient temperatures.
2.4 Grating inscription techniques
2.4.1 Fabrication of the original Hill grating
In 1978, Hill and co-workers from the Canadian Communication Research Centre
(CRC) revealed the first observation of photosensitivity of optical fibre and the generation
of permanent Bragg gratings in an optical fibre (Hill, Fujii, Johnson, & Kawasaki, 1978).
This was achieved through exposure of a segment of germanosilicate optical fibre to
intense coherent counter propagating light from an argon-ion laser at a wavelength of 488
24
nm. Afterwards, an increase in the intensity of the reflected light was observed where
majority of the probe light was reflected back from the optical fibre creating a narrow
Bragg grating across the 1 m long fibre. This grating is referred to as the “Hill Grating”
or “internally written grating”. The “photosensitivity” phenomenon was used to explain
the growth in intensity of the back reflected light which also enables the creation of an
index grating. The fabricated Bragg grating consisted of 90% grating reflectivity with a
bandwidth of less than 200 MHz at the argon-ion laser wavelength. Since the reflected
light from the gratings possess a wavelength the same as the wavelength used to inscribe
the grating, this method can be used for applications which use wavelengths at or near the
inscription wavelength.
2.4.2 Interferometric technique
The initial external writing method on FBGs, interferometric method was revealed by
Meltz, Morey, and Glenn (1989) in photosensitive fibre. During this process, an
interferometer was deployed which divided the incoming UV light into two beams, and a
subsequent recombination of them occurred which led to the creation of an interference
pattern. A photosensitive fibre was exposed to this fringe pattern in order to induce a
Δnmod in the fibre core. FBGs have been inscribed with the aid of both amplitude splitting
and wave-front-splitting interferometers (Hill & Meltz, 1997). Therefore, the following
sections are devoted to the examination of two different types of interferometers.
2.4.2.1 Amplitude-splitting interferometer
As shown in Figure 2.7, the amplitude-splitting interferometer goes through a process
in which the UV light is separated by a beam splitter into two beams with equivalent
intensity which are subsequently recombined after propagation over various optical
passages. This creates an interference pattern at the core of the optical fibre. The
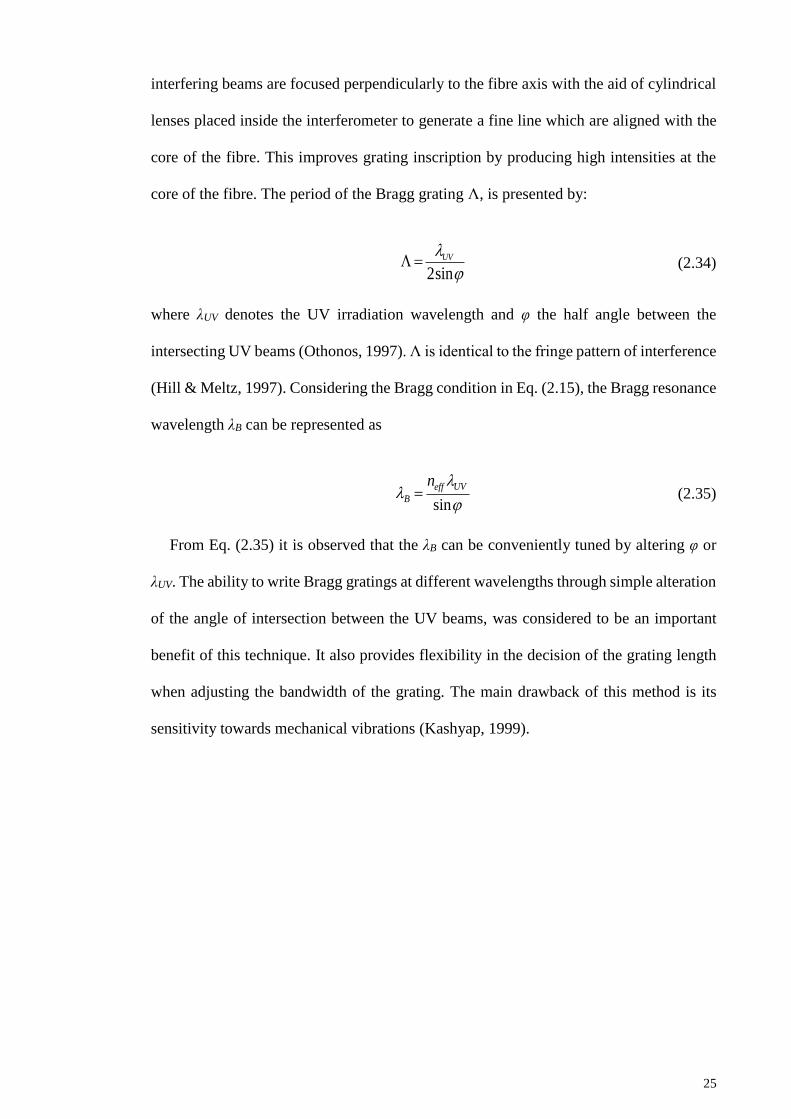
25
interfering beams are focused perpendicularly to the fibre axis with the aid of cylindrical
lenses placed inside the interferometer to generate a fine line which are aligned with the
core of the fibre. This improves grating inscription by producing high intensities at the
core of the fibre. The period of the Bragg grating Λ, is presented by:
2sin
UV
(2.34)
where λUV denotes the UV irradiation wavelength and φ the half angle between the
intersecting UV beams (Othonos, 1997). Λ is identical to the fringe pattern of interference
(Hill & Meltz, 1997). Considering the Bragg condition in Eq. (2.15), the Bragg resonance
wavelength λB can be represented as
sin
UVeff
B
n
(2.35)
From Eq. (2.35) it is observed that the λB can be conveniently tuned by altering φ or
λUV. The ability to write Bragg gratings at different wavelengths through simple alteration
of the angle of intersection between the UV beams, was considered to be an important
benefit of this technique. It also provides flexibility in the decision of the grating length
when adjusting the bandwidth of the grating. The main drawback of this method is its
sensitivity towards mechanical vibrations (Kashyap, 1999).
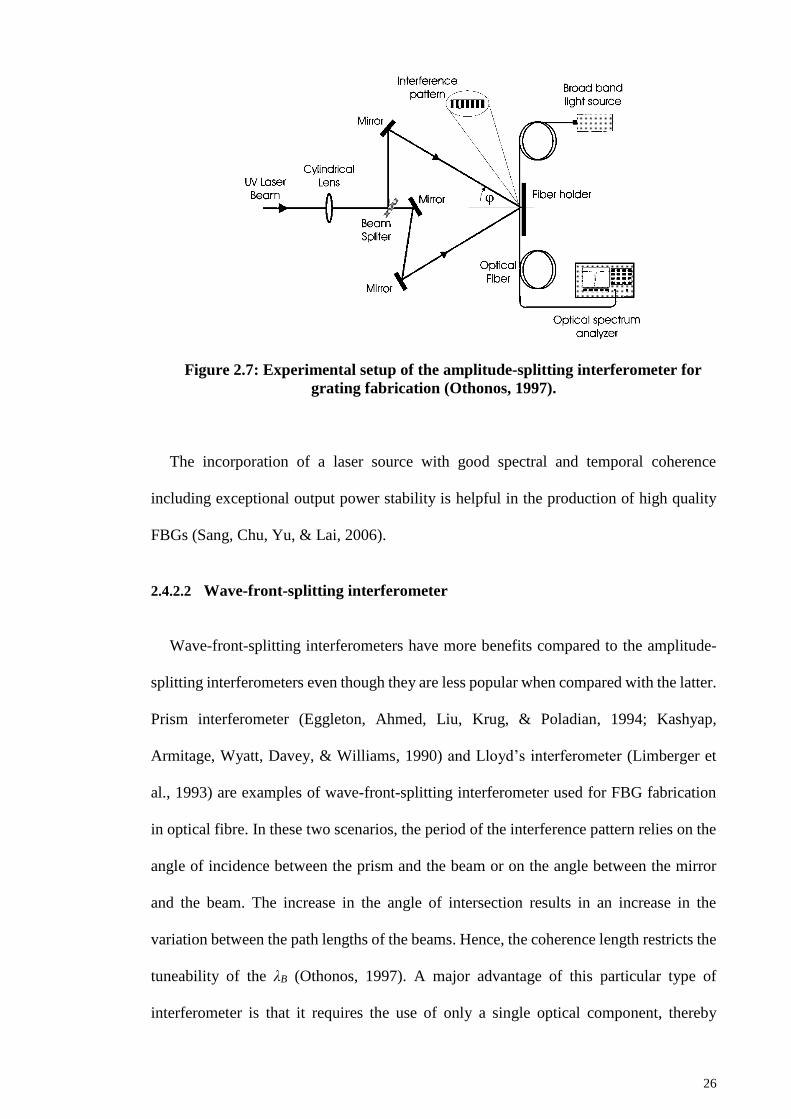
26
Figure 2.7: Experimental setup of the amplitude-splitting interferometer for
grating fabrication (Othonos, 1997).
The incorporation of a laser source with good spectral and temporal coherence
including exceptional output power stability is helpful in the production of high quality
FBGs (Sang, Chu, Yu, & Lai, 2006).
2.4.2.2 Wave-front-splitting interferometer
Wave-front-splitting interferometers have more benefits compared to the amplitude-
splitting interferometers even though they are less popular when compared with the latter.
Prism interferometer (Eggleton, Ahmed, Liu, Krug, & Poladian, 1994; Kashyap,
Armitage, Wyatt, Davey, & Williams, 1990) and Lloyd’s interferometer (Limberger et
al., 1993) are examples of wave-front-splitting interferometer used for FBG fabrication
in optical fibre. In these two scenarios, the period of the interference pattern relies on the
angle of incidence between the prism and the beam or on the angle between the mirror
and the beam. The increase in the angle of intersection results in an increase in the
variation between the path lengths of the beams. Hence, the coherence length restricts the
tuneability of the λB (Othonos, 1997). A major advantage of this particular type of
interferometer is that it requires the use of only a single optical component, thereby

27
considerably reducing the susceptibility to mechanical vibrations. The wave-front
distortion induced by air currents and temperature variation between the two interfering
beams is reduced by the limited distance, over which the UV beams separate (Othonos,
1997). Moreover, the angle of intersection can be changed through easy rotation of this
convention, in order to tune the Bragg wavelength.
2.4.3 Mask image projection
High-resolution mask projection has been introduced for FBG fabrication in optical
fibre using excimer laser irradiation (Mihailov & Gower, 1994). A transmission mask that
consists of a sequence of UV opaque line spaces is used to create a periodic beam for
grating inscription in optical fibres (Mihailov & Gower, 1994). A multi-component fused
silica high-resolution system with a demagnification of 10:1 is used to image the
transmitted beam onto the fibre core. The mask-imaging method has been useful in the
inscription of gratings having grating periods of 1, 2, 3, 4, 5 and 6 µm on Ge-doped single-
mode fibre. The simplicity of the system allows a flexible recording of the coarse period
gratings by mask-imaging exposures. A simple alteration of the mask provides the
possibility to fabricate more complex grating structures such as blazed, chirped, etc
(Ivanov, 2004).
2.4.4 Point-by-point technique
In the point-by-point inscription technique (Malo, Hill, Bilodeau, Johnson, & Albert,
1993) as shown in Figure 2.8, refractive index change is induced one step at a time along
the fibre core. A single pulse of the UV beam from an excimer laser is focused onto the
fibre at a specific point after passing through a narrow slit. This results in a local increase
in the refractive index in the exposed region. Then the fibre is translated along the fibre
axis by a particular distance Λ, which corresponds to the grating period. The procedure
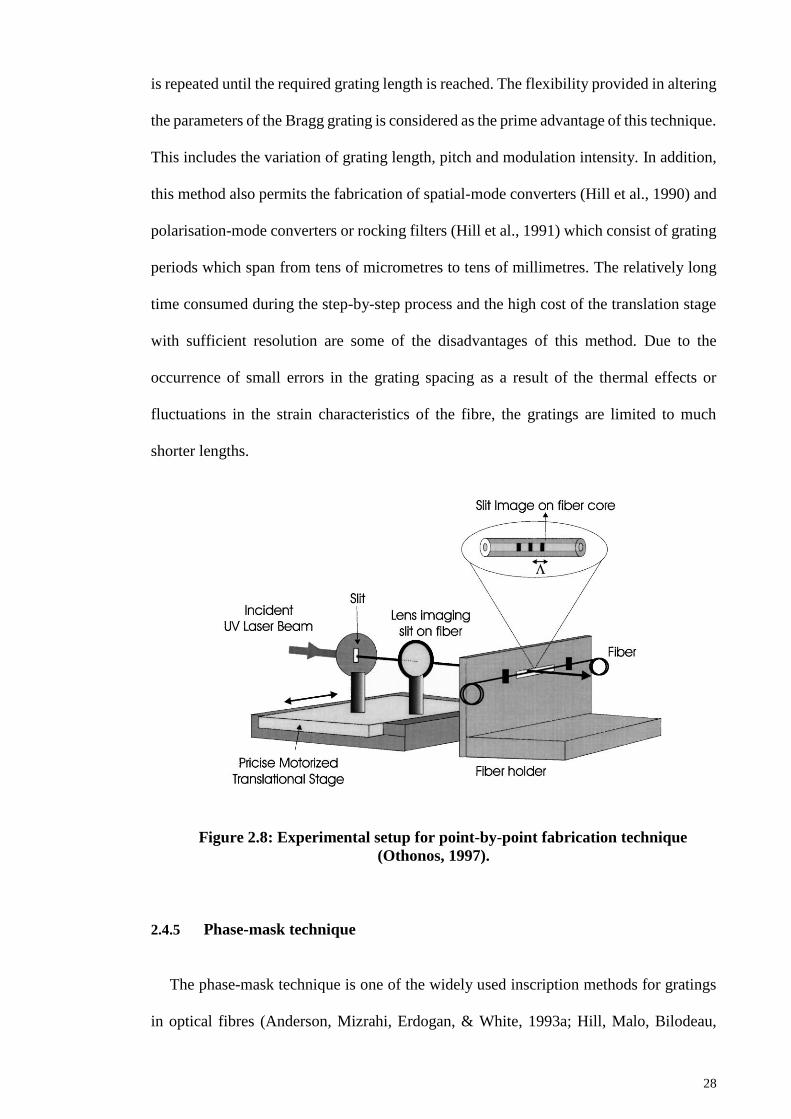
28
is repeated until the required grating length is reached. The flexibility provided in altering
the parameters of the Bragg grating is considered as the prime advantage of this technique.
This includes the variation of grating length, pitch and modulation intensity. In addition,
this method also permits the fabrication of spatial-mode converters (Hill et al., 1990) and
polarisation-mode converters or rocking filters (Hill et al., 1991) which consist of grating
periods which span from tens of micrometres to tens of millimetres. The relatively long
time consumed during the step-by-step process and the high cost of the translation stage
with sufficient resolution are some of the disadvantages of this method. Due to the
occurrence of small errors in the grating spacing as a result of the thermal effects or
fluctuations in the strain characteristics of the fibre, the gratings are limited to much
shorter lengths.
Figure 2.8: Experimental setup for point-by-point fabrication technique
(Othonos, 1997).
2.4.5 Phase-mask technique
The phase-mask technique is one of the widely used inscription methods for gratings
in optical fibres (Anderson, Mizrahi, Erdogan, & White, 1993a; Hill, Malo, Bilodeau,
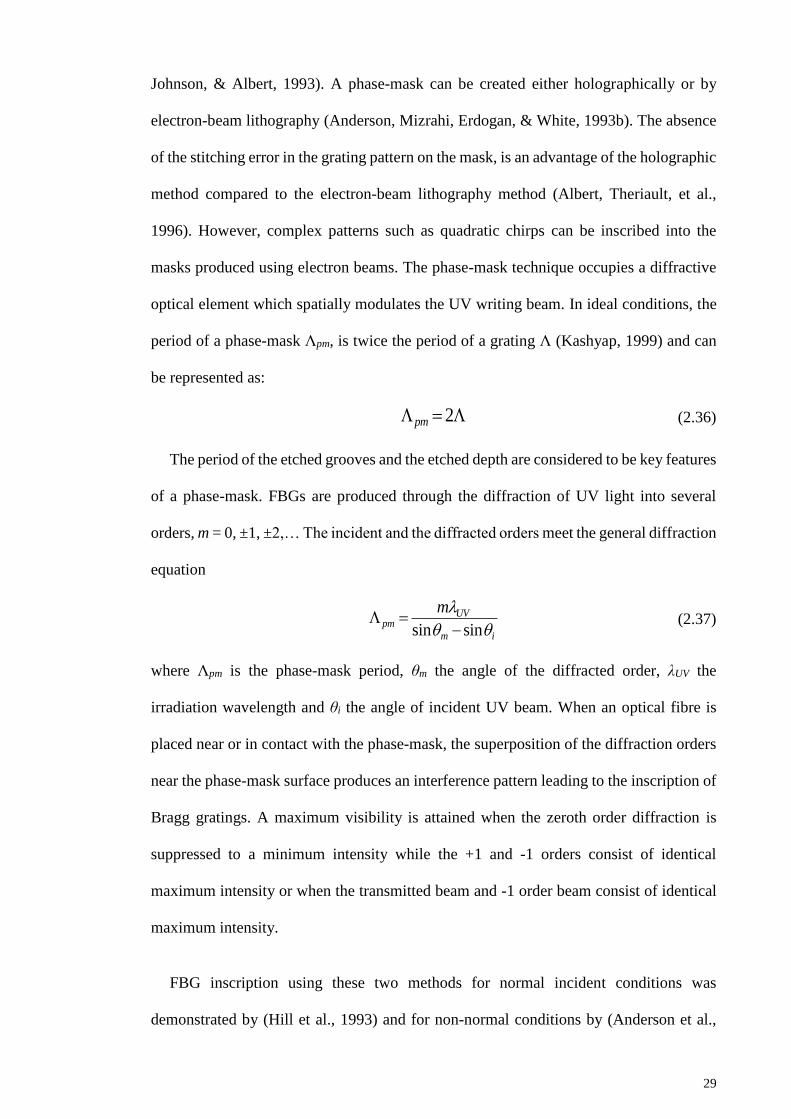
29
Johnson, & Albert, 1993). A phase-mask can be created either holographically or by
electron-beam lithography (Anderson, Mizrahi, Erdogan, & White, 1993b). The absence
of the stitching error in the grating pattern on the mask, is an advantage of the holographic
method compared to the electron-beam lithography method (Albert, Theriault, et al.,
1996). However, complex patterns such as quadratic chirps can be inscribed into the
masks produced using electron beams. The phase-mask technique occupies a diffractive
optical element which spatially modulates the UV writing beam. In ideal conditions, the
period of a phase-mask Λpm, is twice the period of a grating Λ (Kashyap, 1999) and can
be represented as:
2pm (2.36)
The period of the etched grooves and the etched depth are considered to be key features
of a phase-mask. FBGs are produced through the diffraction of UV light into several
orders, m = 0, ±1, ±2,… The incident and the diffracted orders meet the general diffraction
equation
sin sin
UVpm
m i
m
(2.37)
where Λpm is the phase-mask period, θm the angle of the diffracted order, λUV the
irradiation wavelength and θi the angle of incident UV beam. When an optical fibre is
placed near or in contact with the phase-mask, the superposition of the diffraction orders
near the phase-mask surface produces an interference pattern leading to the inscription of
Bragg gratings. A maximum visibility is attained when the zeroth order diffraction is
suppressed to a minimum intensity while the +1 and -1 orders consist of identical
maximum intensity or when the transmitted beam and -1 order beam consist of identical
maximum intensity.
FBG inscription using these two methods for normal incident conditions was
demonstrated by (Hill et al., 1993) and for non-normal conditions by (Anderson et al.,

30
1993a). Nevertheless, comparatively the usage of a phase-mask at normal incident
conditions is more convenient. Under normal incident conditions, the zero order beam
intensity can be minimised by adjusting the depth of the phase-mask grooves d, in such a
way that the UV light obtains a 𝜋 phase shift between the air and silica transmission
pathways which results in
2
( 1)slc
UV
n d
(2.38)
where nslc denotes the refractive index of silica at the UV inscription wavelength. The
zero order will be nulled for the design wavelength λUV, in the scenario where the depth
d, of the phase-mask grooves satisfy Eq. (2.38). The alteration in the wavelength of the
laser source requires the employment of a different phase-mask.
The involvement of a phase-mask greatly reduces the complications in an FBG
inscription system. The usage of a single optical element gives a simple and inherently
stable technique for the reproduction of FBGs. The close proximity of the fibre behind
the phase-mask in the near field of diffracting UV beams reduces the sensitivity to
mechanical vibrations. The main drawback of the phase-mask technique is the limited
tuneability of the inscribed Bragg wavelength since it is determined by the fixed
periodicity of a phase-mask. According to experimental findings, the magnification of the
phase-mask periodicity using an extra lens has only resulted in limited tuneability in the
order of a few percent (Prohaska, Snitzer, Rishton, & Boegli, 1993). It is not desirable to
place an optical fibre in contact with the fine grating corrugations, since it might cause
damage to the phase-mask. Therefore, the improvement of the spatial coherence of the
UV inscription beam not only enhances the quality and strength of the FBGs but also
alleviates the need for the optical fibre to be in contact with the phase-mask (Ivanov,
2004; Singh, Jain, & Aggarwal, 2002).
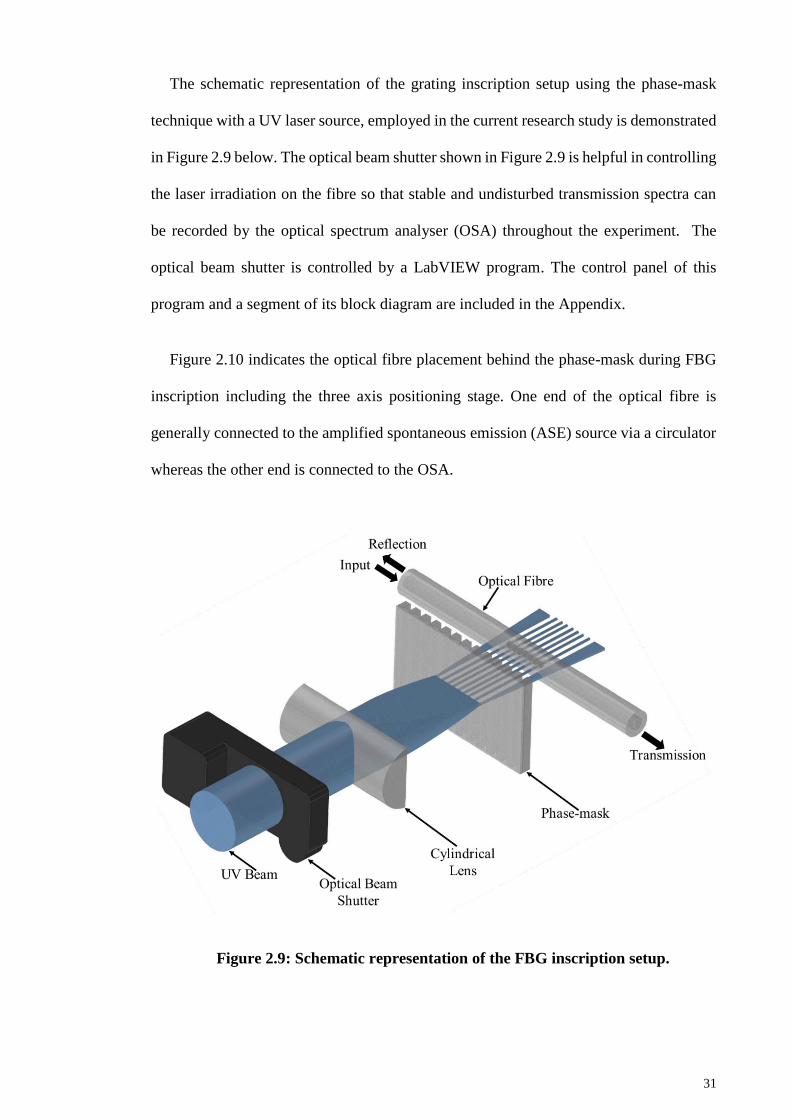
31
The schematic representation of the grating inscription setup using the phase-mask
technique with a UV laser source, employed in the current research study is demonstrated
in Figure 2.9 below. The optical beam shutter shown in Figure 2.9 is helpful in controlling
the laser irradiation on the fibre so that stable and undisturbed transmission spectra can
be recorded by the optical spectrum analyser (OSA) throughout the experiment. The
optical beam shutter is controlled by a LabVIEW program. The control panel of this
program and a segment of its block diagram are included in the Appendix.
Figure 2.10 indicates the optical fibre placement behind the phase-mask during FBG
inscription including the three axis positioning stage. One end of the optical fibre is
generally connected to the amplified spontaneous emission (ASE) source via a circulator
whereas the other end is connected to the OSA.
Figure 2.9: Schematic representation of the FBG inscription setup.
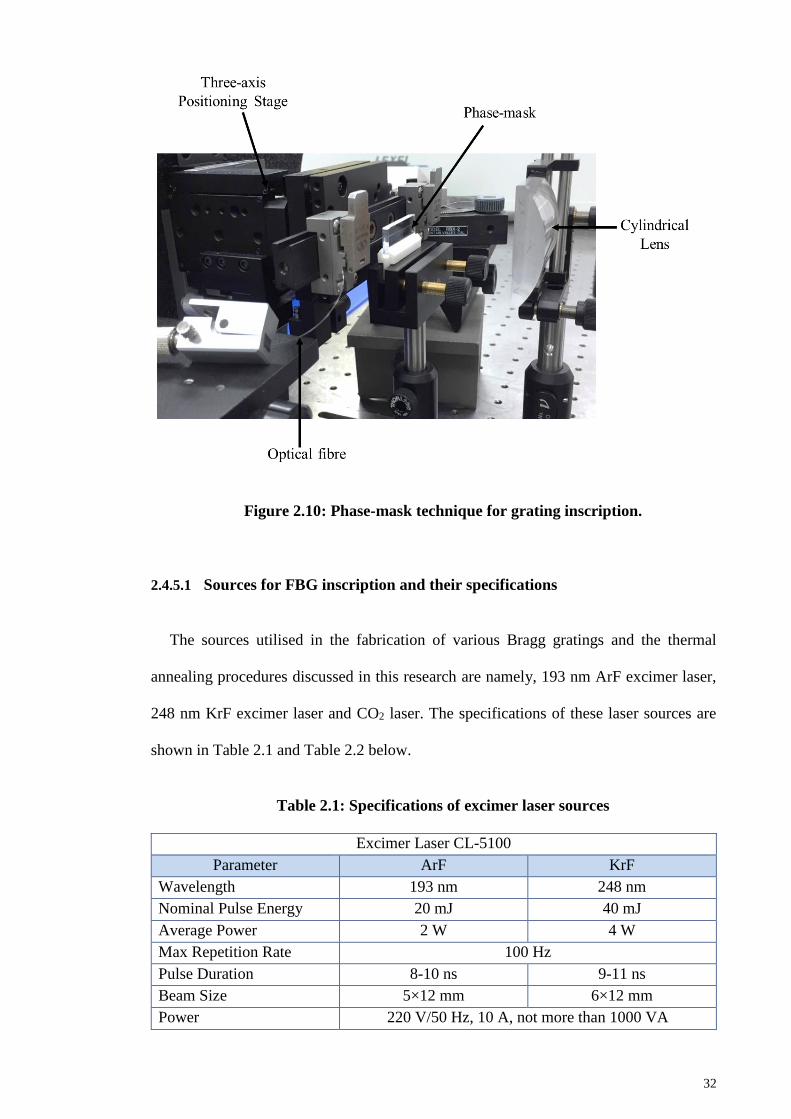
32
Figure 2.10: Phase-mask technique for grating inscription.
2.4.5.1 Sources for FBG inscription and their specifications
The sources utilised in the fabrication of various Bragg gratings and the thermal
annealing procedures discussed in this research are namely, 193 nm ArF excimer laser,
248 nm KrF excimer laser and CO2 laser. The specifications of these laser sources are
shown in Table 2.1 and Table 2.2 below.
Table 2.1: Specifications of excimer laser sources
Excimer Laser CL-5100
Parameter ArF KrF
Wavelength 193 nm 248 nm
Nominal Pulse Energy 20 mJ 40 mJ
Average Power 2 W 4 W
Max Repetition Rate 100 Hz
Pulse Duration 8-10 ns 9-11 ns
Beam Size 5×12 mm 6×12 mm
Power 220 V/50 Hz, 10 A, not more than 1000 VA
33
Table 2.2: Specifications of CO2 laser source
CO2 Laser
Parameter Specification
Wavelength 10600 nm
Average Power >31.1 W
Power Stability ±5%
Rise Time ≤150 µs
Fall Time ≤150 µs
2.5 Summary
In this chapter, an insight to the theory of FBGs was provided using coupled-mode
theory. A comprehensive review on the different types of Bragg gratings based on their
coupling, growth characteristics and their importance was presented. A brief overview on
different grating inscription techniques was provided, particularly highlighting the phase-
mask technique. The sources and their specifications used for grating inscription and
thermal annealing procedures in the current research study were outlined as well.
34
CHAPTER 3: PHOTOSENSITIVITY AND CHARACTERISATION OF
GRATING STRENGTH
The capability to vary the refractive index with UV irradiation is referred to as
photosensitivity of optical fibres. During grating inscription, the optical fibre is placed in
the field of interference and this particular pattern of interference is imprinted in the fibre
core through a UV light-induced refractive index change. The visibilities of the
interference fringe and the Bragg grating have a strong influence towards the grating
reflectivity and the grating strength. This chapter is a discussion of the fibre
photosensitivity and characterisation of the grating strength in terms of grating and
interference visibilities. Several mechanisms accountable for the change in refractive
index including different methods to enhance fibre photosensitivity are discussed. A brief
overview of the material considerations to enhance fibre photosensitivity is provided and
a new photosensitive dopant is introduced. In addition, this chapter further elaborates on
different characterisation techniques to precisely determine the grating and interference
visibilities.
3.1 Photosensitivity Mechanisms
Photosensitivity of optical fibres was first discovered by Hill et al. in germanosilicate
fibre (Hill et al., 1978; Othonos, 1997). Since then, different models have been suggested
for these photo-induced refractive index changes. Colour centre model,
compaction/densification model and stress relaxation model are a few of them. In the
early stages, the photosensitivity of germanosilicate fibre has been associated with an
absorption band peaking at a wavelength of ~240 nm which is ascribed to germanium-
oxygen deficiency centres (GODC) (Meltz et al., 1989). Irradiation of the fibre core to a
wavelength coincident with this band leads to bleaching while producing other absorption
bands which results in a change in the refractive index. It has been described using the
35
Kramers-Kronig relationship by Hand and Russel (1990) and Dong, Archambault,
Reekie, Russell, and Payne (1995) which is given by
2 0 2
'
( )1( )
2 1 ( )
eff
effPn d
(3.1)
where λ, Δαeff (𝜆) and Δneff (𝜆) represent the wavelength, effective change in the absorption
coefficient and the effective refractive index change respectively. P represents the
principal segment of the integral and 𝜆′ denotes the wavelength for which the refractive
index is calculated (Othonos & Kalli, 1999).
Two types of oxygen deficient defects in Ge have been identified to be responsible for
the absorption at ~240 nm (Takahashi, Fujiwara, Kawachi, & Ikushima, 1997) namely,
neutral oxygen monovacancy (NOMV) which is associated with Ge─Ge or Ge─Si bonds
and neutral oxygen di-vacancy (NODV) such as Ge2+ that incorporates two oxygen atoms.
During UV irradiation, NOMV experiences a photochemical conversion where the bond
promptly breaks resulting in a GeE′ centre. Nevertheless, due to the existence of a lone
pair of electrons of Ge at the uppermost level, NODV appears to exhibit a
photochemically stable structure against 5 eV photons (240 nm) (Hosono et al., 1992).
NOMVs are observed at low intensity exposures whereas NODVs are observed only at
high intensities (Fujimaki et al., 1998; Nishii et al., 1995). Since Bragg gratings could
also be inscribed in GODC free Ge-doped optical fibre with the aid of two photon
absorption process (Albert et al., 1999), the photosensitivity of germanosilicate fibre is
not only limited to the GODCs. Another model, referred to as the stress relaxation model
relying on the relaxation of the thermoelastically-induced stress in the fibre core during
UV exposure has been proposed by Wong, Poole, and Sceats (1992). The differentiation
in the thermal expansion coefficients of the fibre core and cladding suggests that there is
a presence of residual stress in the fibre core.
36
Even though the colour centre model has been supported by many experiments (Atkins
& Mizrahi, 1992; Atkins, Mizrahi, & Erdogan, 1993; Simmons, Griscom, LaRochelle,
Mizrahi, & Stegeman, 1991; Williams, Davey, Kashyap, Armitage, & Ainslie, 1992) it
cannot completely explain the observations of all the experiments conducted (Niay et al.,
1994; Xie et al., 1993) with different fibre types and various dopants. Another model
which relies on glass densification induced by photoionisation (Bernadin & Lawandy,
1990) of the Ge defects has also been proposed with experimental assistance (Chiang,
Sceats, & Wong, 1993). Densification in germanosilicate optical fibre and preforms
induced by UV light has been demonstrated through the changes in Raman spectra
(Dianov, Plotnichenko et al., 1997) and the fibre core tension (Fonjallaz, Cochet,
Leuenberger, Limberger, & Salathé, 1995). The compaction in the core glass has been
explained through the correlation of increment in the refractive index, to the increment in
the tensile stress in the fibre core. However, up-to-date colour centre model can be
considered the most widely used model to demonstrate the mechanism behind the FBG
formation (Othonos, 1997).
3.2 Techniques for photosensitivity enhancement
This section demonstrates the main methods used to enhance the photosensitivity
response of optical fibres. Over the past few years, a considerable effort has been put into
enhancing the photosensitivity of silica optical fibres by hydrogen (H2) loading, flame
brushing, pre-sensitisation and by using different photosensitive dopants.
3.2.1 Hydrogenation
H2 loading is a simple and the most widely used technique in achieving high UV
photosensitivity levels in optical fibres and was first discovered by Lemaire, Atkins,
Mizrahi, and Reed (1993). This highly effective approach has been used extensively prior
37
to UV exposure where the optical fibres are immersed in H2 gas at temperatures over a
range of 25-80 °C and at a typical pressure of 150 atm. This produces a diffusion of the
hydrogen molecules into the fibre core and once irradiated with UV laser, produces OH
absorbing species due to the reaction of the hydrogen molecules with Ge-O-Si bonds in
the glass structure. In H2 loaded standard telecommunication fibres, refractive index
changes reaching 10-3 have been reported (Lemaire et al., 1993). The enhancement in
photosensitivity involves thermally induced reactions and photolytic mechanisms
(Atkins, Lemaire, Erdogan, & Mizrahi, 1993) which result in Si-OH, bleachable GODCs
and germanium related defects. The diffusion rate of the hydrogen molecules depends on
the temperature and pressure of the H2 gas. Typically, H2 loading for one week at room
temperature is required to attain the necessary photosensitivity level in the optical fibre.
Nevertheless, the desired time can be reduced to a few days by loading at a higher pressure
or temperature. When accessing photosensitivity, H2 loading eliminates the requirement
of using UV wavelengths which coincide with the defect absorption bands (Grubsky,
Starodubov, & Feinberg, 1999a). Figure 3.1 below indicates the difference in index
change in the presence and the absence of H2 during grating inscription in germanosilicate
fibres. Evidently, much higher index changes can be observed for H2 loaded fibre
compared to that of H2 free fibre.
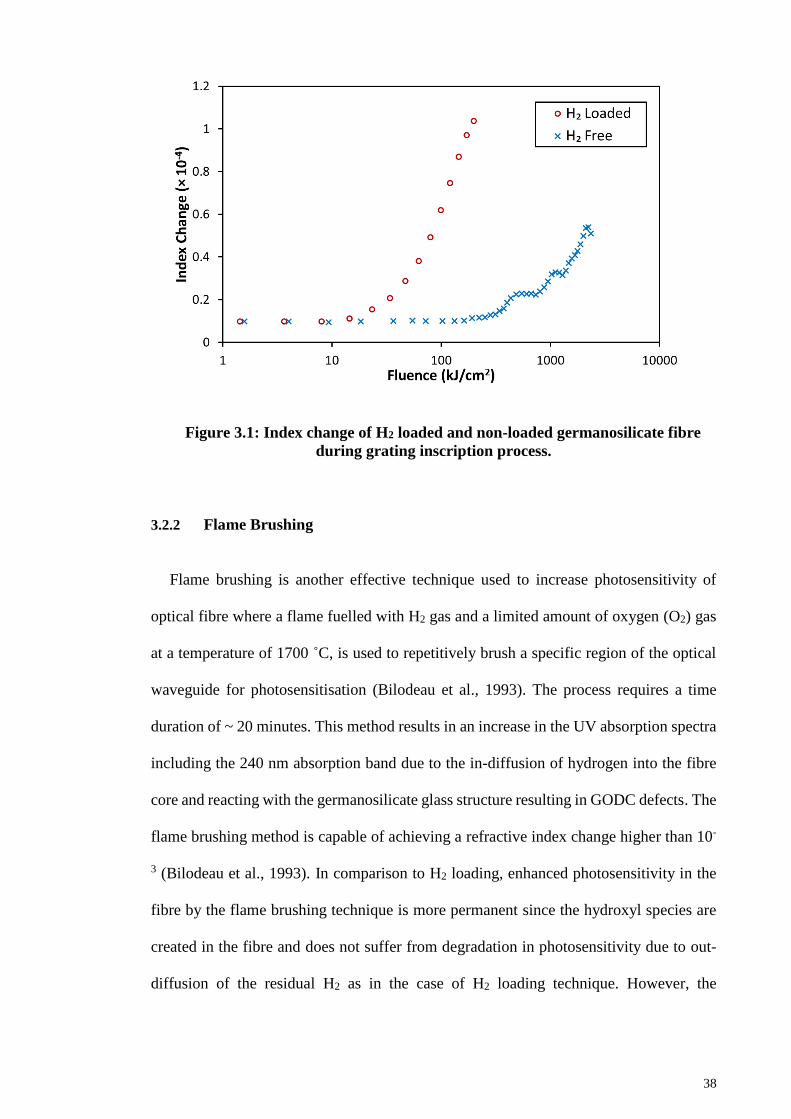
38
Figure 3.1: Index change of H2 loaded and non-loaded germanosilicate fibre
during grating inscription process.
3.2.2 Flame Brushing
Flame brushing is another effective technique used to increase photosensitivity of
optical fibre where a flame fuelled with H2 gas and a limited amount of oxygen (O2) gas
at a temperature of 1700 ˚C, is used to repetitively brush a specific region of the optical
waveguide for photosensitisation (Bilodeau et al., 1993). The process requires a time
duration of ~ 20 minutes. This method results in an increase in the UV absorption spectra
including the 240 nm absorption band due to the in-diffusion of hydrogen into the fibre
core and reacting with the germanosilicate glass structure resulting in GODC defects. The
flame brushing method is capable of achieving a refractive index change higher than 10-
3 (Bilodeau et al., 1993). In comparison to H2 loading, enhanced photosensitivity in the
fibre by the flame brushing technique is more permanent since the hydroxyl species are
created in the fibre and does not suffer from degradation in photosensitivity due to out-
diffusion of the residual H2 as in the case of H2 loading technique. However, the
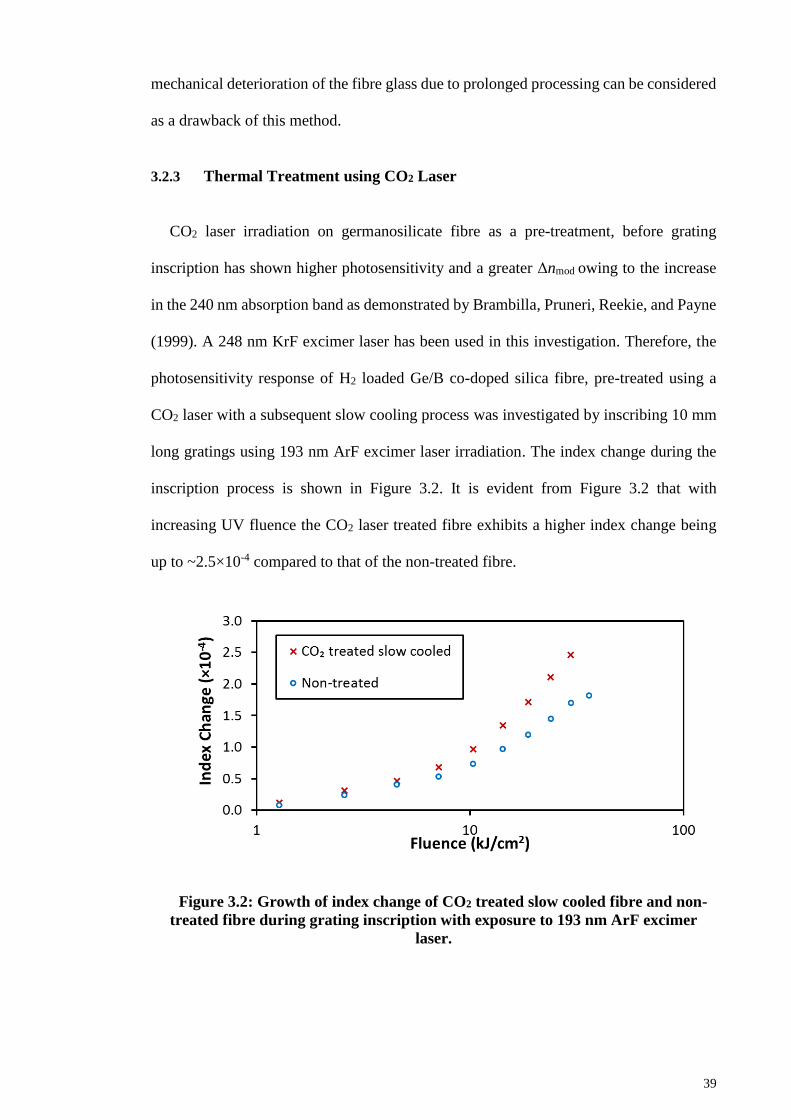
39
mechanical deterioration of the fibre glass due to prolonged processing can be considered
as a drawback of this method.
3.2.3 Thermal Treatment using CO2 Laser
CO2 laser irradiation on germanosilicate fibre as a pre-treatment, before grating
inscription has shown higher photosensitivity and a greater Δnmod owing to the increase
in the 240 nm absorption band as demonstrated by Brambilla, Pruneri, Reekie, and Payne
(1999). A 248 nm KrF excimer laser has been used in this investigation. Therefore, the
photosensitivity response of H2 loaded Ge/B co-doped silica fibre, pre-treated using a
CO2 laser with a subsequent slow cooling process was investigated by inscribing 10 mm
long gratings using 193 nm ArF excimer laser irradiation. The index change during the
inscription process is shown in Figure 3.2. It is evident from Figure 3.2 that with
increasing UV fluence the CO2 laser treated fibre exhibits a higher index change being
up to ~2.5×10⁻⁴ compared to that of the non-treated fibre.
Figure 3.2: Growth of index change of CO2 treated slow cooled fibre and non-
treated fibre during grating inscription with exposure to 193 nm ArF excimer
laser.
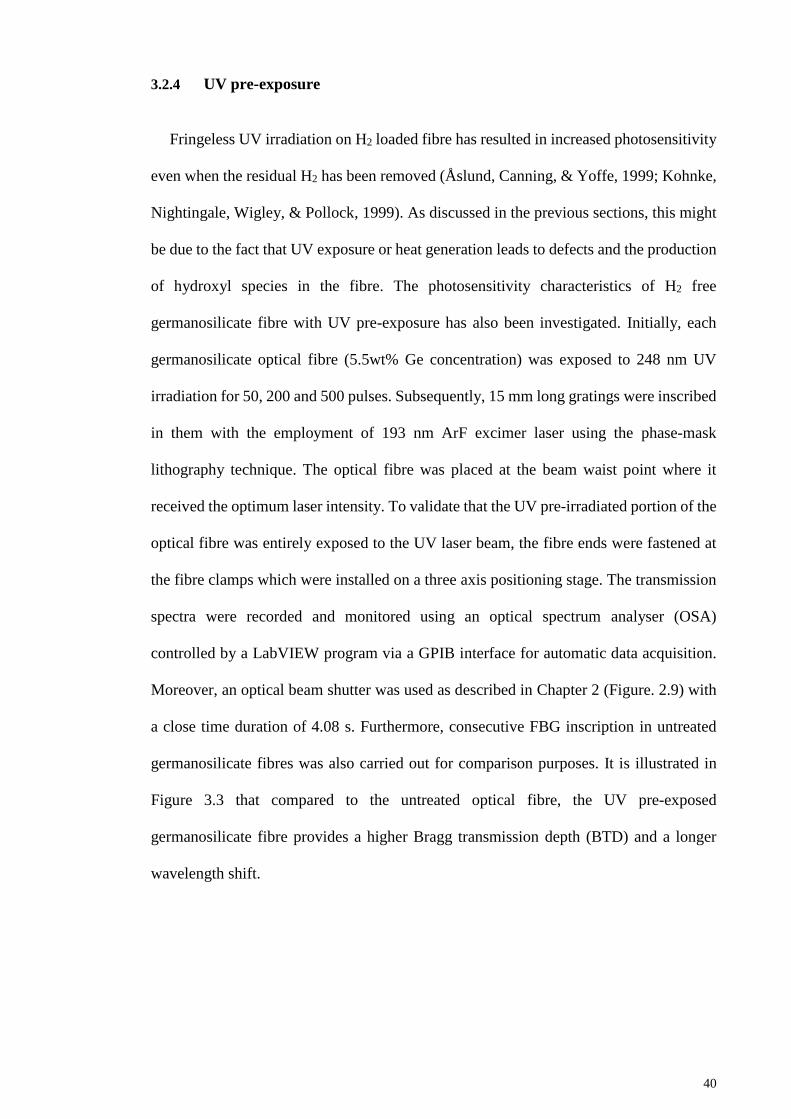
40
3.2.4 UV pre-exposure
Fringeless UV irradiation on H2 loaded fibre has resulted in increased photosensitivity
even when the residual H2 has been removed (Åslund, Canning, & Yoffe, 1999; Kohnke,
Nightingale, Wigley, & Pollock, 1999). As discussed in the previous sections, this might
be due to the fact that UV exposure or heat generation leads to defects and the production
of hydroxyl species in the fibre. The photosensitivity characteristics of H2 free
germanosilicate fibre with UV pre-exposure has also been investigated. Initially, each
germanosilicate optical fibre (5.5wt% Ge concentration) was exposed to 248 nm UV
irradiation for 50, 200 and 500 pulses. Subsequently, 15 mm long gratings were inscribed
in them with the employment of 193 nm ArF excimer laser using the phase-mask
lithography technique. The optical fibre was placed at the beam waist point where it
received the optimum laser intensity. To validate that the UV pre-irradiated portion of the
optical fibre was entirely exposed to the UV laser beam, the fibre ends were fastened at
the fibre clamps which were installed on a three axis positioning stage. The transmission
spectra were recorded and monitored using an optical spectrum analyser (OSA)
controlled by a LabVIEW program via a GPIB interface for automatic data acquisition.
Moreover, an optical beam shutter was used as described in Chapter 2 (Figure. 2.9) with
a close time duration of 4.08 s. Furthermore, consecutive FBG inscription in untreated
germanosilicate fibres was also carried out for comparison purposes. It is illustrated in
Figure 3.3 that compared to the untreated optical fibre, the UV pre-exposed
germanosilicate fibre provides a higher Bragg transmission depth (BTD) and a longer
wavelength shift.
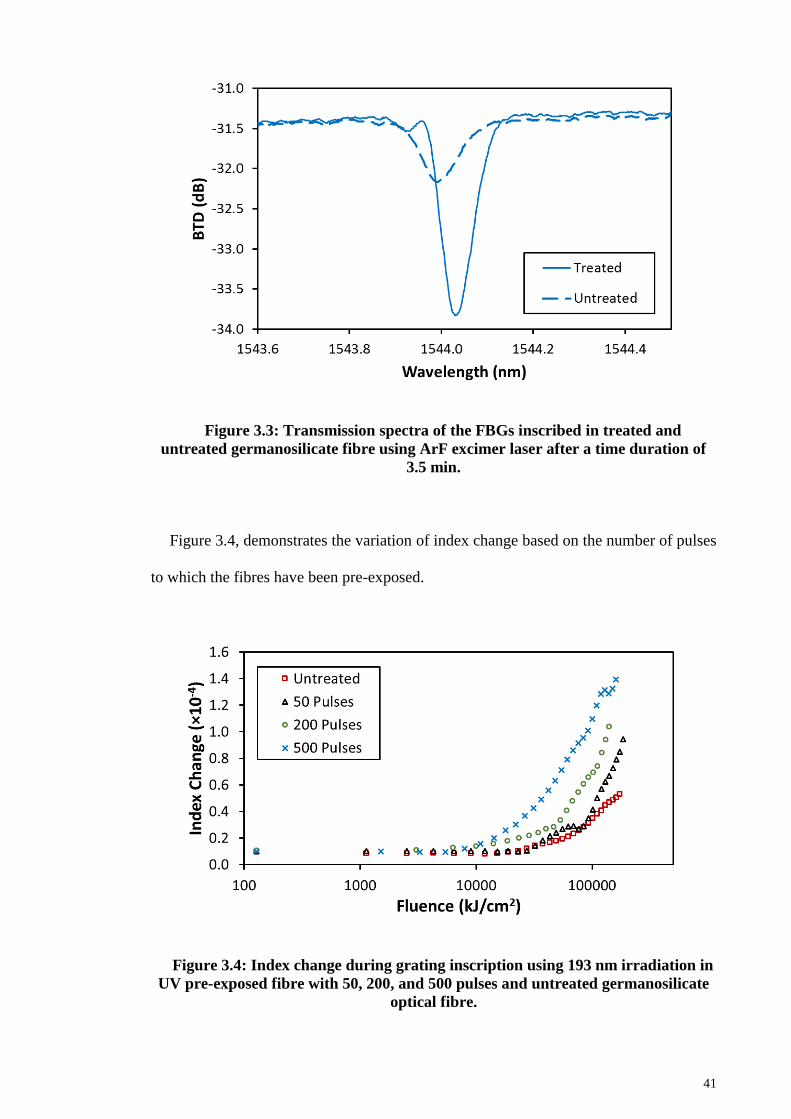
41
Figure 3.3: Transmission spectra of the FBGs inscribed in treated and
untreated germanosilicate fibre using ArF excimer laser after a time duration of
3.5 min.
Figure 3.4, demonstrates the variation of index change based on the number of pulses
to which the fibres have been pre-exposed.
Figure 3.4: Index change during grating inscription using 193 nm irradiation in
UV pre-exposed fibre with 50, 200, and 500 pulses and untreated germanosilicate
optical fibre.
42
An increase in the index change for fibres with an increasing number of pulses during
the pre-exposure is clearly observed whereas the untreated fibre indicates the least index
change. The range of UV-fluence for each experiment differs based on the type of fibre
and the type of laser used.
3.2.5 Choice of dopant
The following section gives a brief summary of various types of dopants reported in
enhancing the photosensitivity of optical fibres. Each dopant possesses its own unique
characteristics.
3.2.5.1 Germanium (Ge)
Since the first grating inscription, GeO2 still appears to be the most widely used dopant
in photosensitive optical fibre manufacturing. Photosensitivity and the GeO2
concentration indicate a linear relationship. The photosensitivity characterisation of
germanosilicate fibres usually refers to the 240 nm absorption band which is related to
the germanium oxygen deficient centres (GODCs). Medvedkov, Vasiliev, Gnusin, and
Dianov (2012) have demonstrated the degree of photosensitivity in heavily GeO2 doped
silica optical fibre which consists of a GeO2 concentration of 75 mol%. Co-doping with
B2O3 or SnO2 has also managed to produce a notable enhancement in photosensitivity.
3.2.5.2 Boron (B)
Germanosilicate fibre co-doped with B2O3 exhibits higher photosensitivity compared
to the fibre which solely consists a high germanium concentration (Williams, Ainslie,
Armitage, Kashyap, & Campbell, 1993). In B2O3- SiO2 glass, the presence of 240 nm
absorption band is not visible but at ~ 190 nm the UV absorption band starts to increase
(Dong, Pinkstone, Russell, & Payne, 1994). The enhancement mechanism of B2O3 co-
43
doping can be ascribed to the increase in densification as a result of the stress effects
(Camlibel, Pinnow, & Dabby, 1975). This softens the glass, thereby increasing the
probability of structural rearrangement of the defects and the glass network. The low
thermal stability of B2O3 co-doped fibre compared to fibre doped with GeO2, can be
cosidered as a drawback (Williams & Smith, 1995; Baker, Rourke, Baker, & Goodchild,
1997). Photosensisitvity enhancement in B2O3-GeO2 co-doped fibre due to increased
tension during fibre drawing has been investigated by Ky, Limberger, Salathé, Cochet,
and Dong (1998). Long period gratings (LPGs) have been fabricated using the thermal
release of drawing induced stress (C.S. Kim et al., 2000).
3.2.5.3 Aluminium (Al)
Introducing Al2O3 to GeO2 results in a decrease in the 240 nm absorption band but
produces an absorption band at ~205 nm (Dong et al., 1994). According to J.M. Kim, Oh,
Park, Kim, and Jeong (2000) Al2O3 has been used as an index change modifying dopant
with insignificant effect on photosensitivity while uniform photosensitivity is maintained
between the core and the inner cladding using constant concentration of B2O3-GeO2
where the refractive index of the cladding matches that of silica.
3.2.5.4 Tin (Sn)
Photosensitive fibre co-doped with SnO2 and GeO2 was first reported by Dong, Cruz,
Reekie, Xu, and Payne (1995). Lower losses at the 1.5 µm telecommunication window
and high thermal stability in comparison with the B2O3-GeO2 co-doped fibre are among
the advantages of SnO2 co-doping. UV-induced index changes amounting to 1.4×10⁻³ has
been achieved for these tin co-doped germanosilicate fibres. However, increased tension
during fibre drawing decreases the photosensitivity of SnO2-GeO2 doped silica fibre and
indicates the characteristics of a type IIa grating during grating inscription (Ky et al.,
44
1998). Nevertheless, type I and type II gratings have been successfully inscribed in highly
photosensitive SnO2-P2O5-doped silica fibre (Dong, Cruz, Tucknott, Reekie, & Payne,
1995). According to Brambilla, Pruneri, and Reekie (2000), refractive index modulations
of 2.8×10⁻⁴ have been observed in 0.15 mol% SnO2-doped fibre with exposure to 248 nm
laser irradiation. Volatile SnO2 being burnt off during preform collapse and crystallisation
at ~1 mol% SnO2 levels, complicate the preform fabrication process of these fibres.
3.2.5.5 Nitrogen (N)
Highly photosensitive nitrogen doped germanosilicate fibre consisting of a 2.8×10⁻³
refractive index change at 244 nm wavelength in the absence of H2 loading has been
reported by Dianov, Golant, Mashinsky, et al. (1997). In the presence of H2, the refractive
index change has been recorded as 1×10⁻². However, a large amount of H2 in N-doped
fibre results in a negative effect as the N-H bond shows absorption at ~1506 nm, the third
telecommunication window (Dianov, Golant, Khrapko, Kurkov, & Tomashuk, 1995;
Grand et al., 1990). Grating inscription using 193 nm wavelength in hydrogen and Ge
free N-doped fibre has also been reported (Dianov, Golant, Khrapko et al., 1997). These
type IIa gratings have indicated a high thermal stability at temperature levels beyond 1000
˚C. In addition, LPGs written in N-doped silica fibres using CO2 laser or arc discharge
have appeared to indicate ultra-thermostable capabilities withstanding temperatures over
1000 ˚C (Karpov, Grekov, Dianov, Golant, & Khrapko, 1998). The nitrogen
thermodiffusion process in silica has been used to fabricate these LPGs.
3.2.5.6 Lead (Pb)
PbO-doped silica based photosensitivity has been reported in multicomponent glasses.
Refractive index changes amounting to Δn ∼ 0.09 in UV-induced surface relief gratings
have been reported by Long and Brueck (1999a, 1999b).
45
3.2.5.7 Titanium (Ti)
TiO2 is generally used to dope the outer-cladding of the fibre since it results in a higher
mechanical strength. High refractive index changes have been discovered in gratings
inscribed in optical fibres consisting of TiO2-doped outer cladding during 244 nm CW
laser irradiation (Wang et al., 1999). Furthermore, the hydrogenation time duration has
been reduced to one day at room temperature for these fibres. The TiO2 layer efficiently
absorbs the 240 nm light which leads to a notable increase in the temperature of the fibre
(200 °C at 40 mW, CW 244 nm) leading to enhanced photosensitivity.
3.2.5.8 Fluorine (F)
Deviating from Ge and P which are considered to be network formers, fluorine acts as
a network modifier. Fluorine is among the two dopants that manage to decrease the
refractive index of silica (Lancry & Poumellec, 2013). This has resulted in fluorine being
extremely popular when doping with silica since it has the capability of controlling the
refractive index profile of optical fibres. In the viscosity-matching technique, fluorine is
used to decrease the excess imperfection loss. This technique involves other dopants such
as GeO2, P2O5 and fluorine in matching the viscosity of the core and cladding. In the field
of photolithography, particularly as a material for photomasks relying on 157 nm
technology, fluorine-doped silica is used for high and stable transmission over a wide
spectral range (Liberman et al., 1999; Mizuguchi, Skuja, Hosono, & Ogawa, 1999a,
1999b). A small amount of fluorine up to a level of 1 mol% is sufficient to blue shift the
absorption edge of pure silica (Saito & Ikushima, 2002). Furthermore, Si-F groups result
in radiation toughness of silica samples. The decrease of defect precursors are assumed
to be the reason behind the positive effect of Si-F groups (Kajihara et al., 2004). Defects
such as non-bridging oxygen hole centres (NBOHC) and E′ centres are generated from
strain bonds which absorb in the visible and UV spectral range.
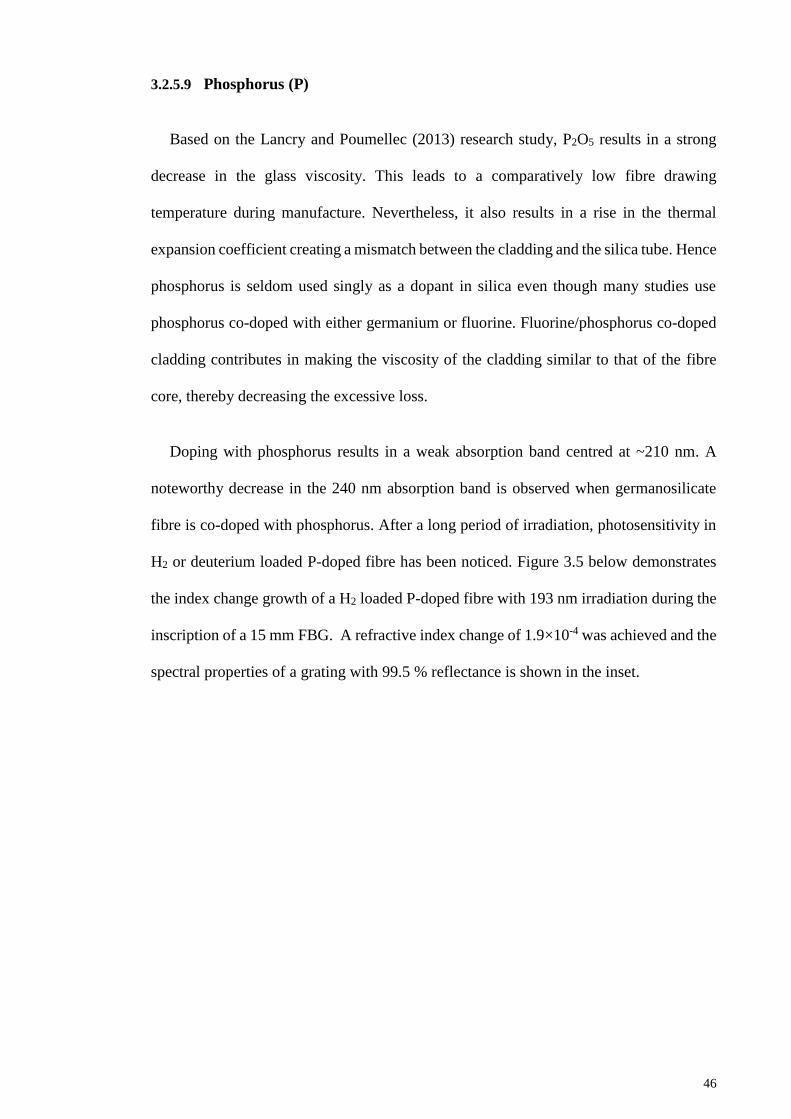
46
3.2.5.9 Phosphorus (P)
Based on the Lancry and Poumellec (2013) research study, P2O5 results in a strong
decrease in the glass viscosity. This leads to a comparatively low fibre drawing
temperature during manufacture. Nevertheless, it also results in a rise in the thermal
expansion coefficient creating a mismatch between the cladding and the silica tube. Hence
phosphorus is seldom used singly as a dopant in silica even though many studies use
phosphorus co-doped with either germanium or fluorine. Fluorine/phosphorus co-doped
cladding contributes in making the viscosity of the cladding similar to that of the fibre
core, thereby decreasing the excessive loss.
Doping with phosphorus results in a weak absorption band centred at ~210 nm. A
noteworthy decrease in the 240 nm absorption band is observed when germanosilicate
fibre is co-doped with phosphorus. After a long period of irradiation, photosensitivity in
H2 or deuterium loaded P-doped fibre has been noticed. Figure 3.5 below demonstrates
the index change growth of a H2 loaded P-doped fibre with 193 nm irradiation during the
inscription of a 15 mm FBG. A refractive index change of 1.9×10⁻⁴ was achieved and the
spectral properties of a grating with 99.5 % reflectance is shown in the inset.
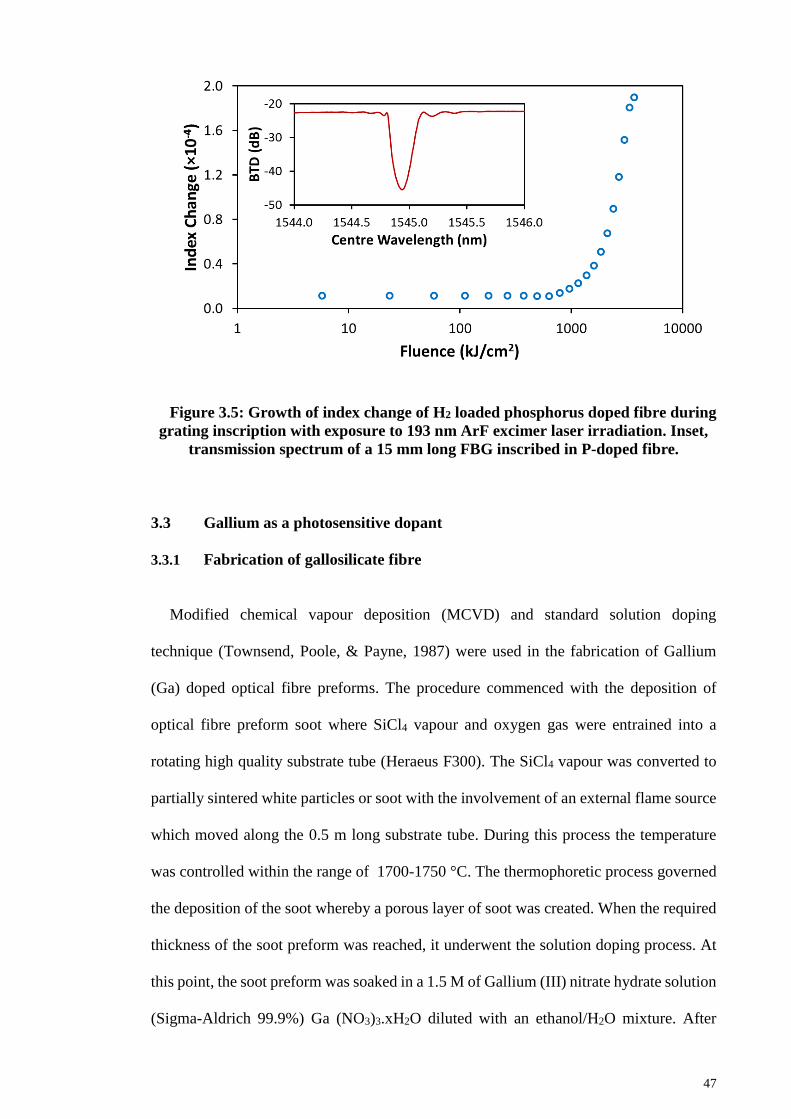
47
Figure 3.5: Growth of index change of H2 loaded phosphorus doped fibre during
grating inscription with exposure to 193 nm ArF excimer laser irradiation. Inset,
transmission spectrum of a 15 mm long FBG inscribed in P-doped fibre.
3.3 Gallium as a photosensitive dopant
3.3.1 Fabrication of gallosilicate fibre
Modified chemical vapour deposition (MCVD) and standard solution doping
technique (Townsend, Poole, & Payne, 1987) were used in the fabrication of Gallium
(Ga) doped optical fibre preforms. The procedure commenced with the deposition of
optical fibre preform soot where SiCl4 vapour and oxygen gas were entrained into a
rotating high quality substrate tube (Heraeus F300). The SiCl4 vapour was converted to
partially sintered white particles or soot with the involvement of an external flame source
which moved along the 0.5 m long substrate tube. During this process the temperature
was controlled within the range of 1700-1750 °C. The thermophoretic process governed
the deposition of the soot whereby a porous layer of soot was created. When the required
thickness of the soot preform was reached, it underwent the solution doping process. At
this point, the soot preform was soaked in a 1.5 M of Gallium (III) nitrate hydrate solution
(Sigma-Aldrich 99.9%) Ga (NO3)3.xH2O diluted with an ethanol/H2O mixture. After
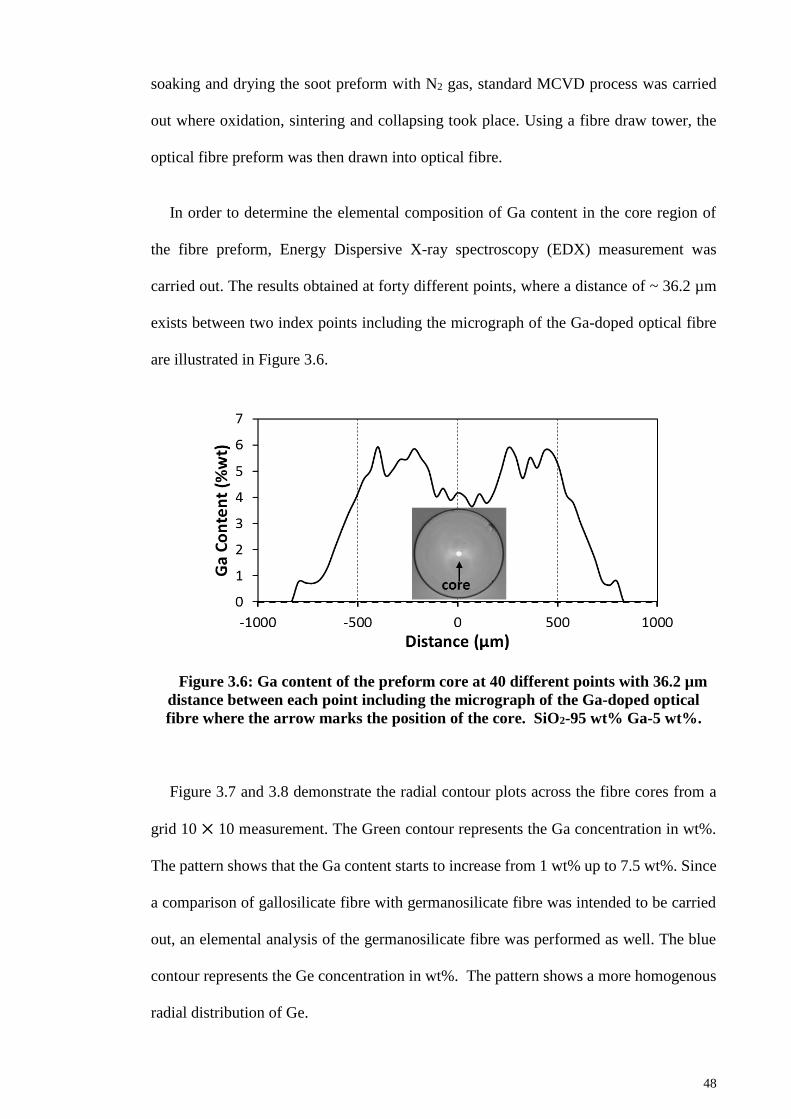
48
soaking and drying the soot preform with N2 gas, standard MCVD process was carried
out where oxidation, sintering and collapsing took place. Using a fibre draw tower, the
optical fibre preform was then drawn into optical fibre.
In order to determine the elemental composition of Ga content in the core region of
the fibre preform, Energy Dispersive X-ray spectroscopy (EDX) measurement was
carried out. The results obtained at forty different points, where a distance of ~ 36.2 µm
exists between two index points including the micrograph of the Ga-doped optical fibre
are illustrated in Figure 3.6.
Figure 3.6: Ga content of the preform core at 40 different points with 36.2 µm
distance between each point including the micrograph of the Ga-doped optical
fibre where the arrow marks the position of the core. SiO2-95 wt% Ga-5 wt%.
Figure 3.7 and 3.8 demonstrate the radial contour plots across the fibre cores from a
grid 10 ⨉ 10 measurement. The Green contour represents the Ga concentration in wt%.
The pattern shows that the Ga content starts to increase from 1 wt% up to 7.5 wt%. Since
a comparison of gallosilicate fibre with germanosilicate fibre was intended to be carried
out, an elemental analysis of the germanosilicate fibre was performed as well. The blue
contour represents the Ge concentration in wt%. The pattern shows a more homogenous
radial distribution of Ge.
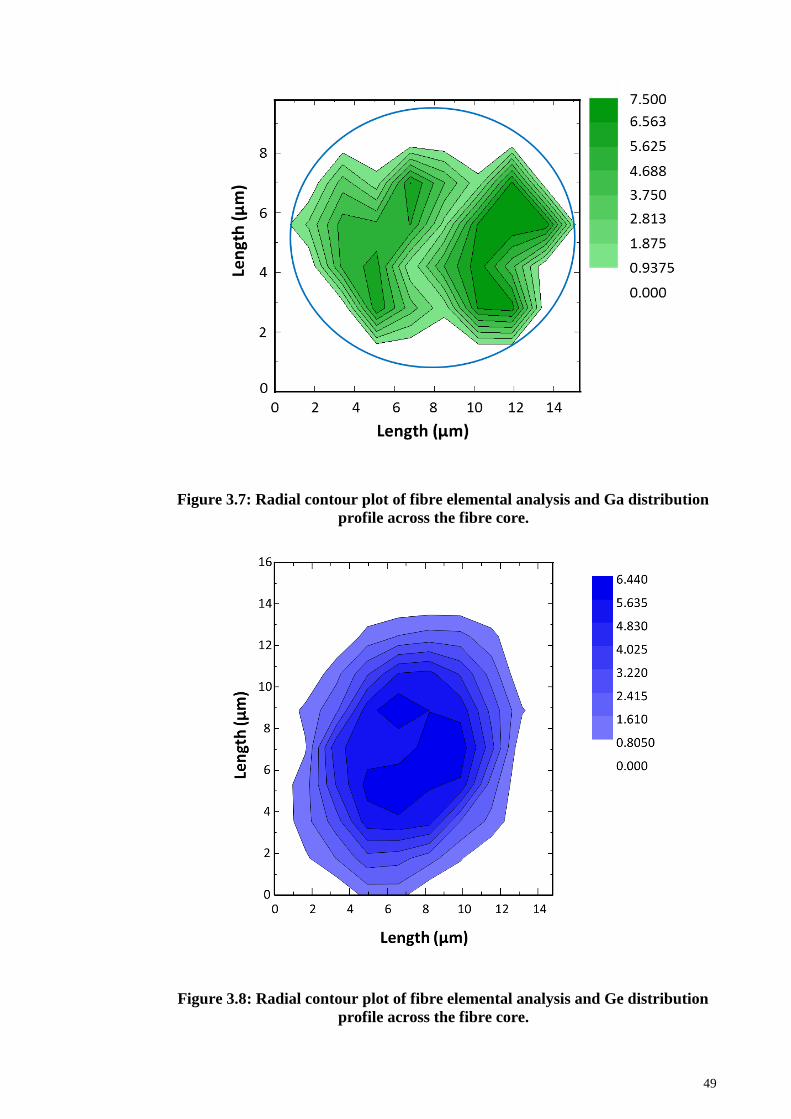
49
Figure 3.7: Radial contour plot of fibre elemental analysis and Ga distribution
profile across the fibre core.
Figure 3.8: Radial contour plot of fibre elemental analysis and Ge distribution
profile across the fibre core.
50
3.3.2 Grating inscription and index growth
Gratings with a grating length of 15 mm were inscribed in both commercially available
germanosilicate single cladding optical fibre (5.5 wt% Ge concentration OFS Zero Water
Peak Fibre) and Ga-doped single cladding optical fibre (5wt% Ga concentration). Phase-
mask lithography together with a 193 nm ArF excimer was used for the inscription
process. A pulse energy of 8 mJ (single pulse fluence of 640 mJ/cm2) with a repetition
rate of 4 Hz and 40 Hz was used during the fabrication procedure for H2 loaded and H2
free conditions respectively. The UV beam size was adjusted using a beam expander and
the grating length was controlled at 15 mm by limiting the beam width with the aid of an
adjustable vertical slit. The core, cladding diameters and the numerical apertures (NA) of
Ga and Ge-doped optical fibres are listed in Table 3.1 below.
Table 3.1: Specification of Ga and Ge-doped optical fibres
Parameter Ga-doped fibre Ge-doped fibre
Core diameter 11.8 µm 8.2 µm
Cladding diameter 125 µm 125 µm
NA 0.15 0.13
An optical spectrum analyser (OSA) controlled by a LabVIEW program via a GPIB
interface was used to monitor and record the transmission spectra. The laser irradiation
on the fibre was controlled by an optical beam shutter with a close time duration of 4.08
s, which was useful in obtaining stable transmission spectra. Subsequently, the
experiment was repeated using a 248 nm KrF excimer laser for comparison purposes.
Analysis of the recorded data was carried out to determine the refractive index changes
of the fibres using the following relationship
1
mod
( ) tanh ( )C F Rn
L
(3.2)
51
where Δnmod denotes the index modulation, λc (F) the centre wavelength as a function of
F the fluence, R the grating reflectivity, 𝜂 the mode overlap parameter and L the grating
length (Ky et al., 1998). The mode overlap parameter can be expressed as
2 2 2
2 2 2 2
d k
d k
(3.3)
where 𝑑, 𝑘 and 𝜆 indicate the fibre core diameter, the NA of the fibre and centre
wavelength respectively. At both H2 loaded and H2 free conditions, the index changes
were calculated with exposure to the two types of excimer lasers. Figure 3.9(a)
demonstrates the refractive index changes in Ga-doped and Ge-doped optical fibres with
exposure to ArF excimer laser. The influence of hydrogenation of the fibres was
discovered by conducting a comparative study between a batch of H2 loaded Ge and Ga-
doped optical fibres with another batch of H2 free fibres. For the H2 free condition, Ga-
doped optical fibres showed consistently higher refractive index changes compared to
that of Ge-doped fibre and in the H2 loaded scenario, Ga-doped fibre also indicated higher
index changes in comparison to Ge-doped optical fibre at low fluence levels. The induced
refractive index of Ga-doped optical fibre amounted to 6.72×10⁻⁵ in the absence of H2
loading and 1.11×10⁻⁴ in the presence of H2 loading.
A 3.7 times higher refractive index change is observed for H2 loaded Ga-doped fibres
at a moderate fluence level of 23 kJ/cm2, compared to H2 loaded Ge-doped optical fibres.
According to Figure 3.9(b), in the ensuing inscription process with KrF excimer laser
(single pulse fluence of 250 mJ/cm2), a much higher refractive index change is observed
for H2 loaded Ge-doped optical fibres compared to H2 loaded Ga-doped optical fibre.
Therefore, it is understood that Ge-doped fibres remain the best preference for FBG
fabrication using 248 nm KrF excimer laser compared to Ga-doped optical fibres. Such
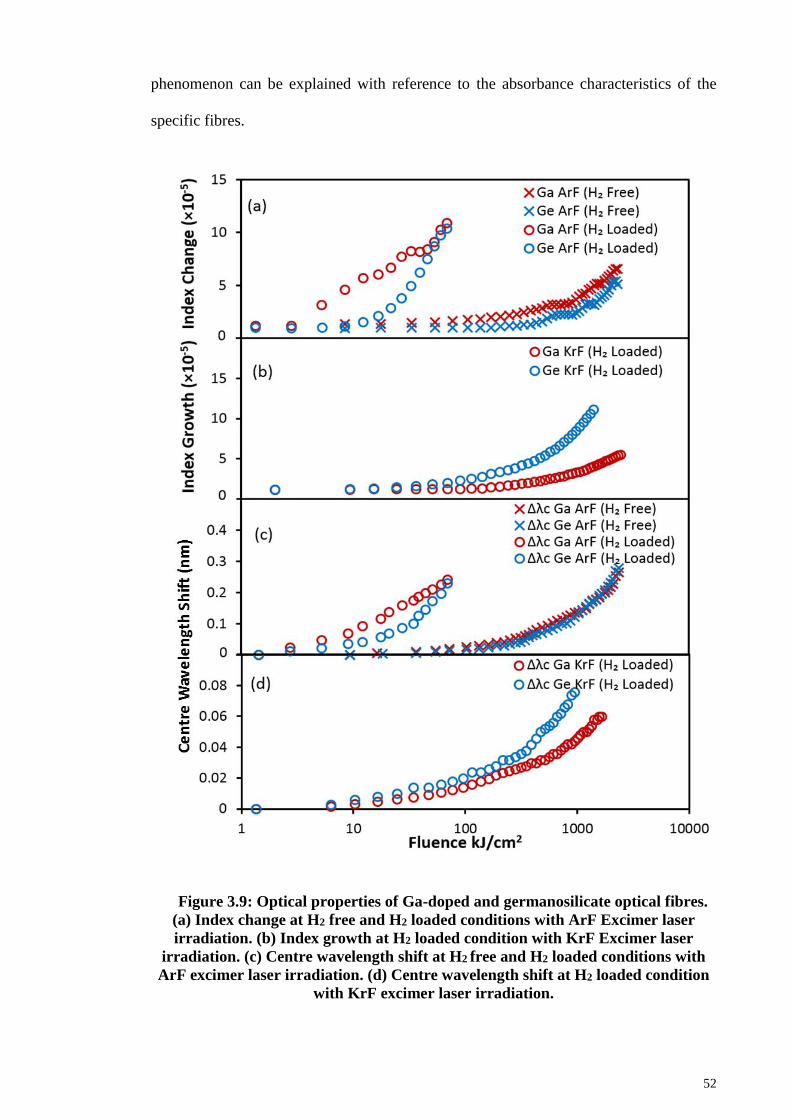
52
phenomenon can be explained with reference to the absorbance characteristics of the
specific fibres.
Figure 3.9: Optical properties of Ga-doped and germanosilicate optical fibres.
(a) Index change at H2 free and H2 loaded conditions with ArF Excimer laser
irradiation. (b) Index growth at H2 loaded condition with KrF Excimer laser
irradiation. (c) Centre wavelength shift at H2 free and H2 loaded conditions with
ArF excimer laser irradiation. (d) Centre wavelength shift at H2 loaded condition
with KrF excimer laser irradiation.
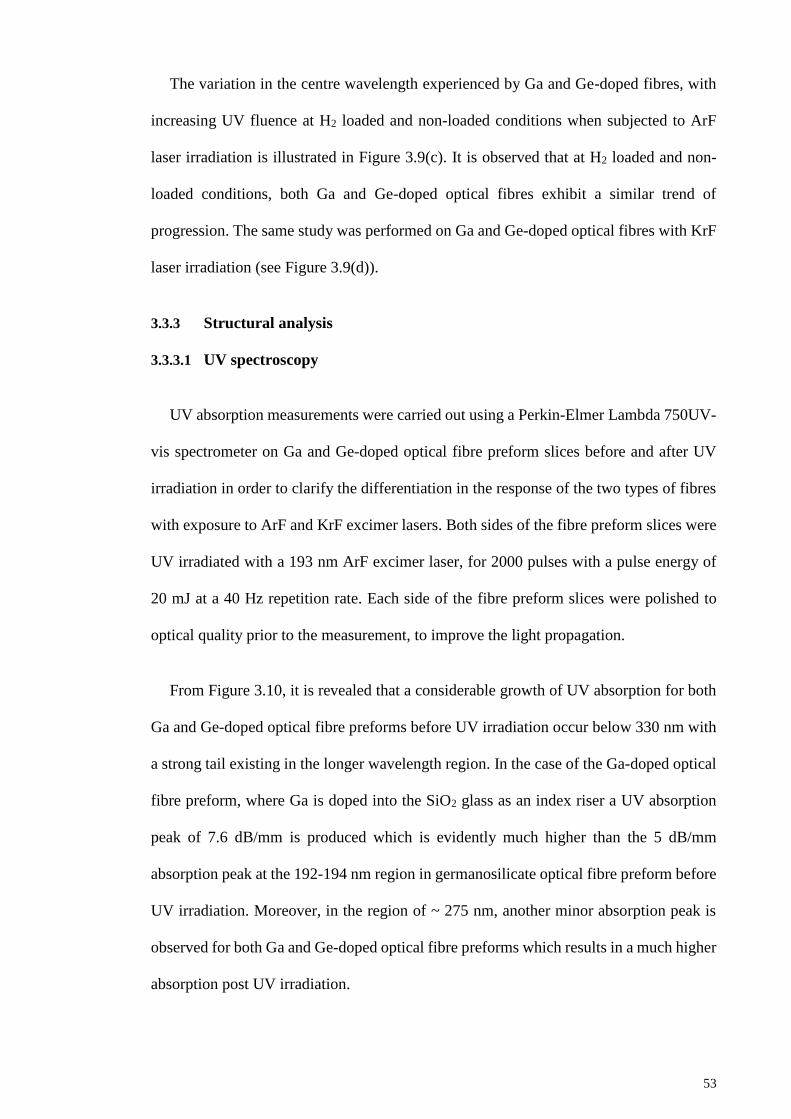
53
The variation in the centre wavelength experienced by Ga and Ge-doped fibres, with
increasing UV fluence at H2 loaded and non-loaded conditions when subjected to ArF
laser irradiation is illustrated in Figure 3.9(c). It is observed that at H2 loaded and non-
loaded conditions, both Ga and Ge-doped optical fibres exhibit a similar trend of
progression. The same study was performed on Ga and Ge-doped optical fibres with KrF
laser irradiation (see Figure 3.9(d)).
3.3.3 Structural analysis
3.3.3.1 UV spectroscopy
UV absorption measurements were carried out using a Perkin-Elmer Lambda 750UV-
vis spectrometer on Ga and Ge-doped optical fibre preform slices before and after UV
irradiation in order to clarify the differentiation in the response of the two types of fibres
with exposure to ArF and KrF excimer lasers. Both sides of the fibre preform slices were
UV irradiated with a 193 nm ArF excimer laser, for 2000 pulses with a pulse energy of
20 mJ at a 40 Hz repetition rate. Each side of the fibre preform slices were polished to
optical quality prior to the measurement, to improve the light propagation.
From Figure 3.10, it is revealed that a considerable growth of UV absorption for both
Ga and Ge-doped optical fibre preforms before UV irradiation occur below 330 nm with
a strong tail existing in the longer wavelength region. In the case of the Ga-doped optical
fibre preform, where Ga is doped into the SiO2 glass as an index riser a UV absorption
peak of 7.6 dB/mm is produced which is evidently much higher than the 5 dB/mm
absorption peak at the 192-194 nm region in germanosilicate optical fibre preform before
UV irradiation. Moreover, in the region of ~ 275 nm, another minor absorption peak is
observed for both Ga and Ge-doped optical fibre preforms which results in a much higher
absorption post UV irradiation.
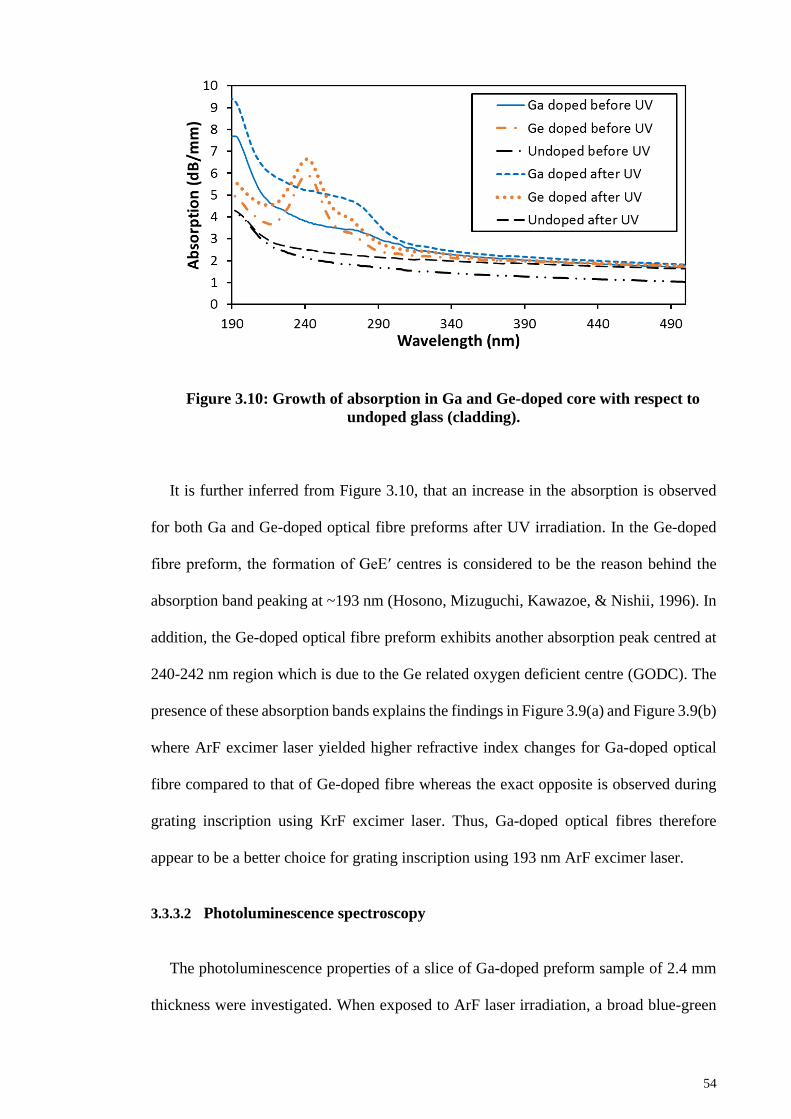
54
Figure 3.10: Growth of absorption in Ga and Ge-doped core with respect to
undoped glass (cladding).
It is further inferred from Figure 3.10, that an increase in the absorption is observed
for both Ga and Ge-doped optical fibre preforms after UV irradiation. In the Ge-doped
fibre preform, the formation of GeE′ centres is considered to be the reason behind the
absorption band peaking at ~193 nm (Hosono, Mizuguchi, Kawazoe, & Nishii, 1996). In
addition, the Ge-doped optical fibre preform exhibits another absorption peak centred at
240-242 nm region which is due to the Ge related oxygen deficient centre (GODC). The
presence of these absorption bands explains the findings in Figure 3.9(a) and Figure 3.9(b)
where ArF excimer laser yielded higher refractive index changes for Ga-doped optical
fibre compared to that of Ge-doped fibre whereas the exact opposite is observed during
grating inscription using KrF excimer laser. Thus, Ga-doped optical fibres therefore
appear to be a better choice for grating inscription using 193 nm ArF excimer laser.
3.3.3.2 Photoluminescence spectroscopy
The photoluminescence properties of a slice of Ga-doped preform sample of 2.4 mm
thickness were investigated. When exposed to ArF laser irradiation, a broad blue-green
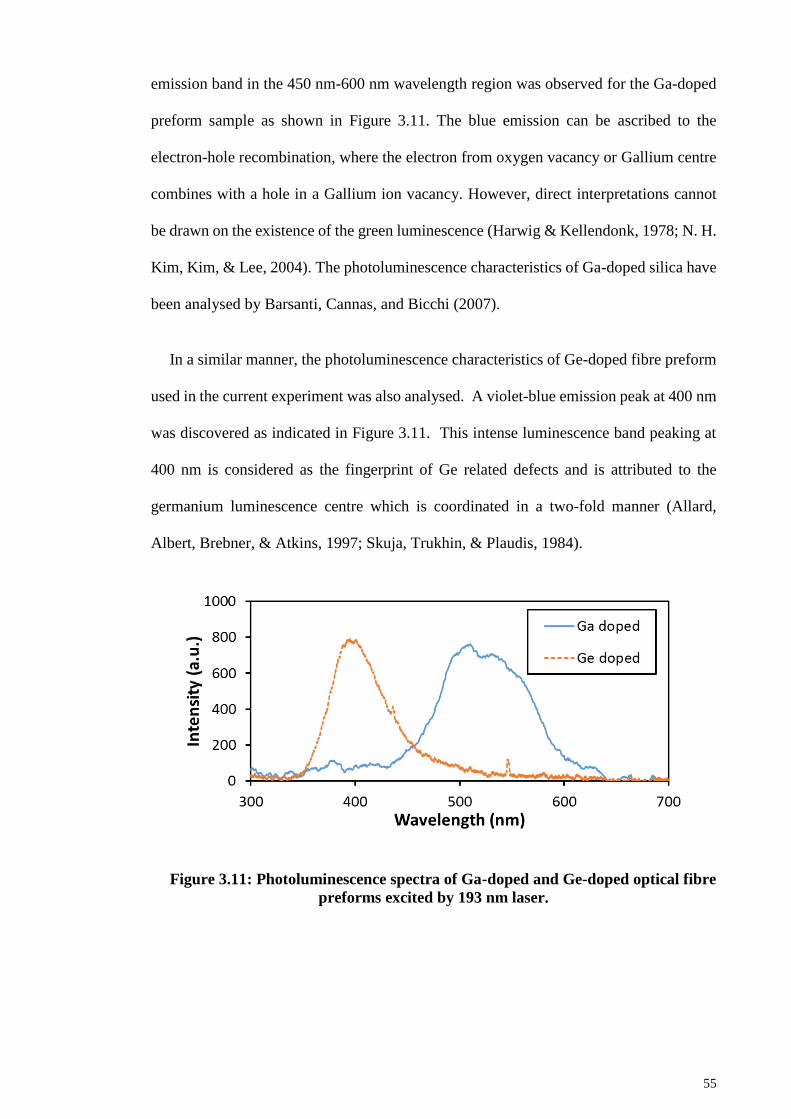
55
emission band in the 450 nm-600 nm wavelength region was observed for the Ga-doped
preform sample as shown in Figure 3.11. The blue emission can be ascribed to the
electron-hole recombination, where the electron from oxygen vacancy or Gallium centre
combines with a hole in a Gallium ion vacancy. However, direct interpretations cannot
be drawn on the existence of the green luminescence (Harwig & Kellendonk, 1978; N. H.
Kim, Kim, & Lee, 2004). The photoluminescence characteristics of Ga-doped silica have
been analysed by Barsanti, Cannas, and Bicchi (2007).
In a similar manner, the photoluminescence characteristics of Ge-doped fibre preform
used in the current experiment was also analysed. A violet-blue emission peak at 400 nm
was discovered as indicated in Figure 3.11. This intense luminescence band peaking at
400 nm is considered as the fingerprint of Ge related defects and is attributed to the
germanium luminescence centre which is coordinated in a two-fold manner (Allard,
Albert, Brebner, & Atkins, 1997; Skuja, Trukhin, & Plaudis, 1984).
Figure 3.11: Photoluminescence spectra of Ga-doped and Ge-doped optical fibre
preforms excited by 193 nm laser.
56
3.4 Grating Characterisation
3.4.1 Interference and grating visibilities
Grating formation in an optical fibre is attained by positioning the fibre in the field of
interference where the interference pattern is imprinted in the fibre by virtue of a UV-
induced index change. The interference fringe visibility is expressed by
max min
max min
i
I Iv
I I
(3.4)
where Imax and Imin refer to the intensity levels occurring at the constructive (bright
fringes) and destructive positions (dark fringes) of the interference (Huebner et al., 1997).
Maximum interference visibility (vi = 1) is achieved through ensuring equal intensity
between the two beams, which leads to a complete destructive superposition (Imin = 0). In
comparison to the expression of vi, the grating visibility gv is denoted as
max min
max min
g
n nv
n n
(3.5)
where Δnmax and Δnmin are the maximum and minimum local refractive index changes in
the grating. The grating visibility is assumed to be 1 in some literatures for simplicity of
analysis (Erdogan, 1997; Ky et al., 2003). In real scenarios (vi < 1 and vg < 1), higher UV
fluence is necessary in the development of an FBG which consists of an equivalent grating
strength. The grating strength (δn/n) of a Bragg grating can be explained with reference
to its refractive index perturbation (δn) and the modal index (n) (Hill & Meltz, 1997).
This results in a much higher average refractive index change and a shift in Bragg
wavelength. Such a phenomenon can be explained using the linear relation in Eq. (2.21)
introduced in Chapter 2, where σ is responsible for Bragg wavelength shift and κ is
accountable for the growth of grating reflectivity (Erdogan, 1997).
57
An accurate control of the etched depth d, in the design of ±1st order diffraction phase-
mask is essential in order to obtain the least intensity of the zeroth order. This ensures
optimal and uniform fringe visibility across the interference field distribution. The
optimum etched depth d is given by
( 1)2uv
uvd n
(3.6)
where nuv is the refractive index of the phase-mask and λuv is the wavelength of the UV
source (Kashyap, 1999, p. 60).
Due to the high production efficiency and reliability, the technique of excimer laser
irradiation along with the phase-mask is the favoured choice for the fabrication of gratings
in fibres (Herbst & Govorkov, 2003). The significance of enhancing the interference
visibility has been realised by Dyer, Farley, and Giedl (1995). During grating inscription,
spatial and temporal coherences of the excimer laser are some of the key factors to be
considered (Othonos & Lee, 1995). In the execution, to obtain the maximum interference
visibility, the optical fibres were placed closely or sometimes in contact with the phase-
mask. Nevertheless, such restrictions can be diminished through the use of a laser with
smaller line width and beam divergence.
It has been realised that apart from the irradiation wavelengths (Chen, Herman, Taylor,
& Hnatovsky, 2003; Zhang, Herman, Lauer, Chen, & Wei 2001) and various types of
dopants (Brambilla et al., 2000; Ghosh et al., 2011; Shen, Xia, Sun, & Grattan, 2004), the
photosensitivity of an optical fibre can be influenced by the single-pulse-fluence (Zhang
et al., 2001) as well. Low single-pulse-fluence is capable of resulting in a higher index
change in an optical fibre compared to high single-pulse-fluence, regardless of the fact
that the fibres are irradiated with an equivalent cumulated fluence. The phenomenological
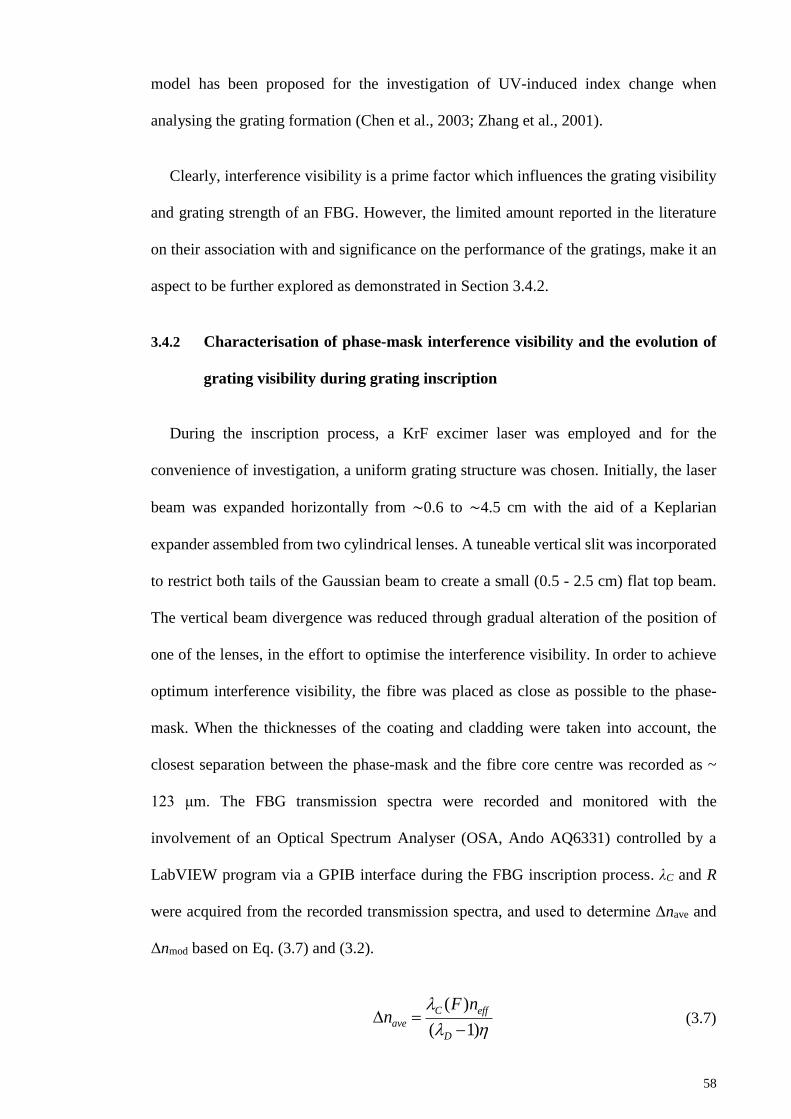
58
model has been proposed for the investigation of UV-induced index change when
analysing the grating formation (Chen et al., 2003; Zhang et al., 2001).
Clearly, interference visibility is a prime factor which influences the grating visibility
and grating strength of an FBG. However, the limited amount reported in the literature
on their association with and significance on the performance of the gratings, make it an
aspect to be further explored as demonstrated in Section 3.4.2.
3.4.2 Characterisation of phase-mask interference visibility and the evolution of
grating visibility during grating inscription
During the inscription process, a KrF excimer laser was employed and for the
convenience of investigation, a uniform grating structure was chosen. Initially, the laser
beam was expanded horizontally from ∼0.6 to ∼4.5 cm with the aid of a Keplarian
expander assembled from two cylindrical lenses. A tuneable vertical slit was incorporated
to restrict both tails of the Gaussian beam to create a small (0.5 - 2.5 cm) flat top beam.
The vertical beam divergence was reduced through gradual alteration of the position of
one of the lenses, in the effort to optimise the interference visibility. In order to achieve
optimum interference visibility, the fibre was placed as close as possible to the phase-
mask. When the thicknesses of the coating and cladding were taken into account, the
closest separation between the phase-mask and the fibre core centre was recorded as ~
123 μm. The FBG transmission spectra were recorded and monitored with the
involvement of an Optical Spectrum Analyser (OSA, Ando AQ6331) controlled by a
LabVIEW program via a GPIB interface during the FBG inscription process. λC and R
were acquired from the recorded transmission spectra, and used to determine Δnave and
Δnmod based on Eq. (3.7) and (3.2).
( )
( 1)
C eff
ave
D
F nn
(3.7)
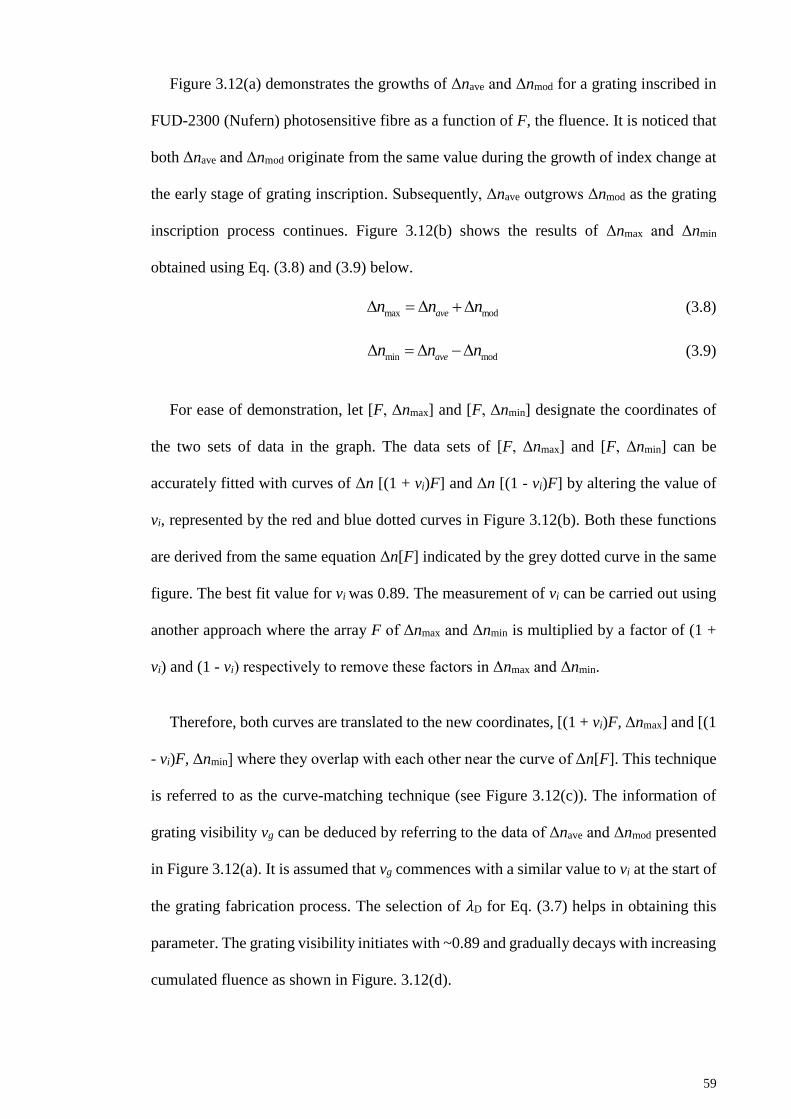
59
Figure 3.12(a) demonstrates the growths of Δnave and Δnmod for a grating inscribed in
FUD-2300 (Nufern) photosensitive fibre as a function of F, the fluence. It is noticed that
both Δnave and Δnmod originate from the same value during the growth of index change at
the early stage of grating inscription. Subsequently, Δnave outgrows Δnmod as the grating
inscription process continues. Figure 3.12(b) shows the results of Δnmax and Δnmin
obtained using Eq. (3.8) and (3.9) below.
max modaven n n (3.8)
min modaven n n (3.9)
For ease of demonstration, let [F, Δnmax] and [F, Δnmin] designate the coordinates of
the two sets of data in the graph. The data sets of [F, Δnmax] and [F, Δnmin] can be
accurately fitted with curves of Δn [(1 + vi)F] and Δn [(1 - vi)F] by altering the value of
vi, represented by the red and blue dotted curves in Figure 3.12(b). Both these functions
are derived from the same equation Δn[F] indicated by the grey dotted curve in the same
figure. The best fit value for vi was 0.89. The measurement of vi can be carried out using
another approach where the array F of Δnmax and Δnmin is multiplied by a factor of (1 +
vi) and (1 - vi) respectively to remove these factors in Δnmax and Δnmin.
Therefore, both curves are translated to the new coordinates, [(1 + vi)F, Δnmax] and [(1
- vi)F, Δnmin] where they overlap with each other near the curve of Δn[F]. This technique
is referred to as the curve-matching technique (see Figure 3.12(c)). The information of
grating visibility vg can be deduced by referring to the data of Δnave and Δnmod presented
in Figure 3.12(a). It is assumed that vg commences with a similar value to vi at the start of
the grating fabrication process. The selection of 𝜆D for Eq. (3.7) helps in obtaining this
parameter. The grating visibility initiates with ~0.89 and gradually decays with increasing
cumulated fluence as shown in Figure. 3.12(d).
60
Figure 3.12: Dynamics of (a) Δnave and Δnmod, (b) Δnmax and Δnmin as a function
of cumulated fluence F. The dotted curves depict the phenomenological functions
Δn [(1 + νi)F] (blue) , Δn[(1 - νi)F] (red) and Δn[F] (grey). (c) The data points of
Δnmax and Δnmin are shifted to the new coordinates of [(1 + νi)F, Δnmax] and [(1 -
νi)F, Δnmin] and they overlap with the curve of Δn[F]. (d) Variation of vg during
grating inscription process (Lim et al., 2015).
61
At F=192 kJ/cm2, it reaches a value of ~0.36. This particular degradation does not
reflect any decay in terms of grating strength during the inscription procedure. For an
efficient inscription process, achieving a high grating visibility with longer tolerance
during the fabrication procedure is beneficial. Apart from the estimation of the
interference visibility, the curve-matching technique discussed in this chapter can also be
incorporated in assessing the quality and effectiveness of the fabrication system.
Figure 3.13 demonstrates the measured interference visibility with varying fibre-
phase-mask distance. It is observed that at further distances, the interference visibility
diminishes possibly due to the restricted coherence length.
Figure 3.13: Variation of measured interference visibility at different fibre-
phase-mask distances (Lim et al., 2015).
Figure 3.14(a) and 3.14(b) indicate the growth of Δnmax and Δnmin when subjected to
different single-pulse-fluence F, values of 13 J/cm², 39 J/cm² and 52 J/cm² but with
equivalent interference visibility (vi = ~0.85). Based on the comparison, it is observed
that a higher index growth rate (per unit fluence) is produced by a lower single-pulse-
fluence. Moreover, a similar value for Δnmax and Δnmin is reached at a less total amount of
fluence referred to as cumulated fluence. In addition, the decreased index growth caused
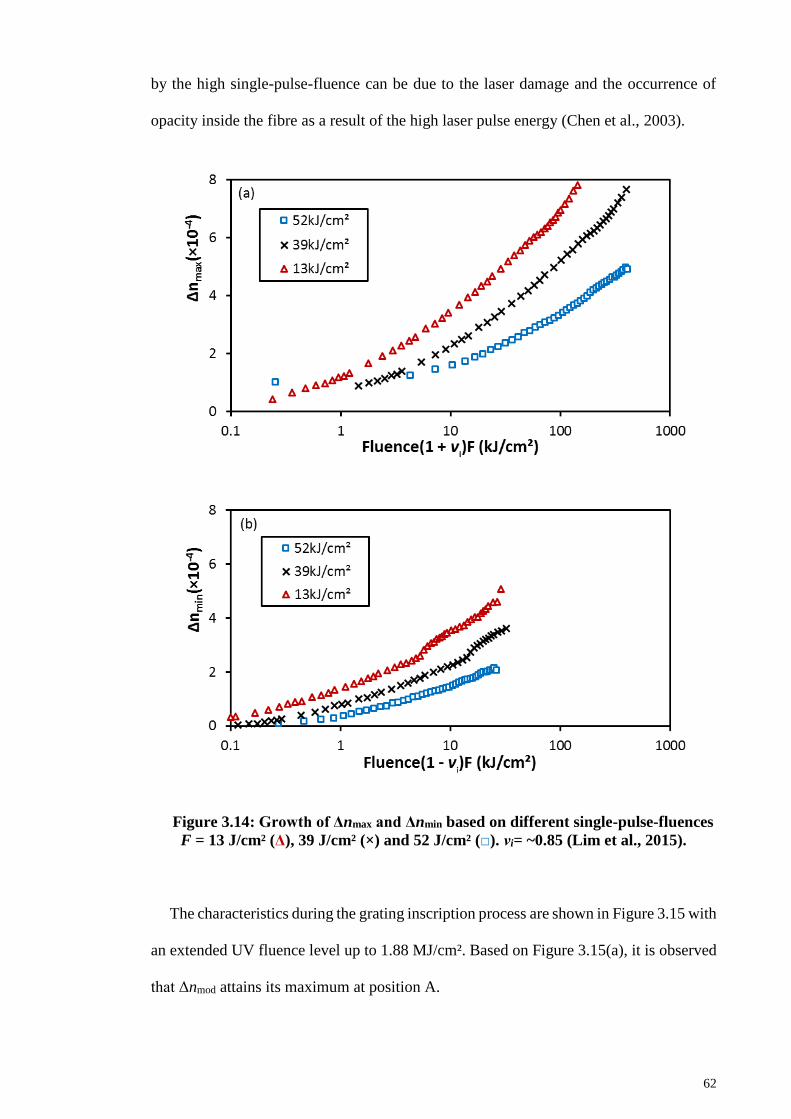
62
by the high single-pulse-fluence can be due to the laser damage and the occurrence of
opacity inside the fibre as a result of the high laser pulse energy (Chen et al., 2003).
Figure 3.14: Growth of Δnmax and Δnmin based on different single-pulse-fluences
F = 13 J/cm² (Δ), 39 J/cm² (×) and 52 J/cm² (□). νi= ~0.85 (Lim et al., 2015).
The characteristics during the grating inscription process are shown in Figure 3.15 with
an extended UV fluence level up to 1.88 MJ/cm². Based on Figure 3.15(a), it is observed
that Δnmod attains its maximum at position A.
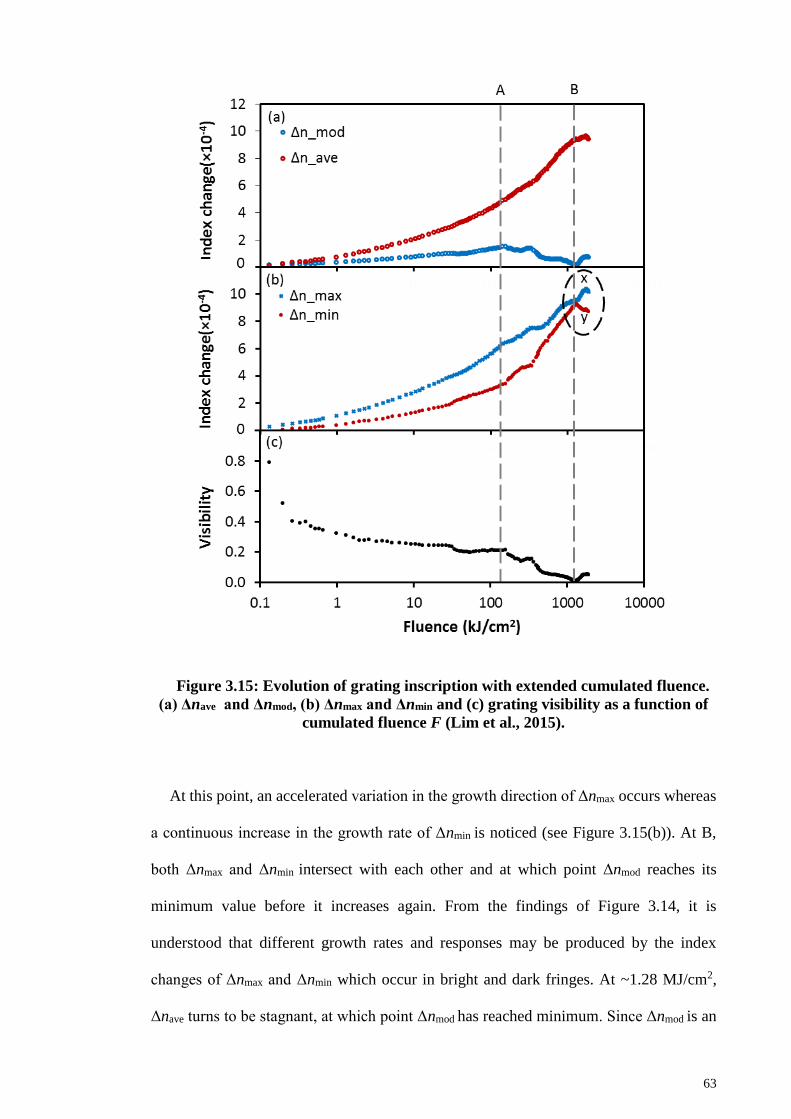
63
Figure 3.15: Evolution of grating inscription with extended cumulated fluence.
(a) Δnave and Δnmod, (b) Δnmax and Δnmin and (c) grating visibility as a function of
cumulated fluence F (Lim et al., 2015).
At this point, an accelerated variation in the growth direction of Δnmax occurs whereas
a continuous increase in the growth rate of Δnmin is noticed (see Figure 3.15(b)). At B,
both Δnmax and Δnmin intersect with each other and at which point Δnmod reaches its
minimum value before it increases again. From the findings of Figure 3.14, it is
understood that different growth rates and responses may be produced by the index
changes of Δnmax and Δnmin which occur in bright and dark fringes. At ~1.28 MJ/cm2,
Δnave turns to be stagnant, at which point Δnmod has reached minimum. Since Δnmod is an
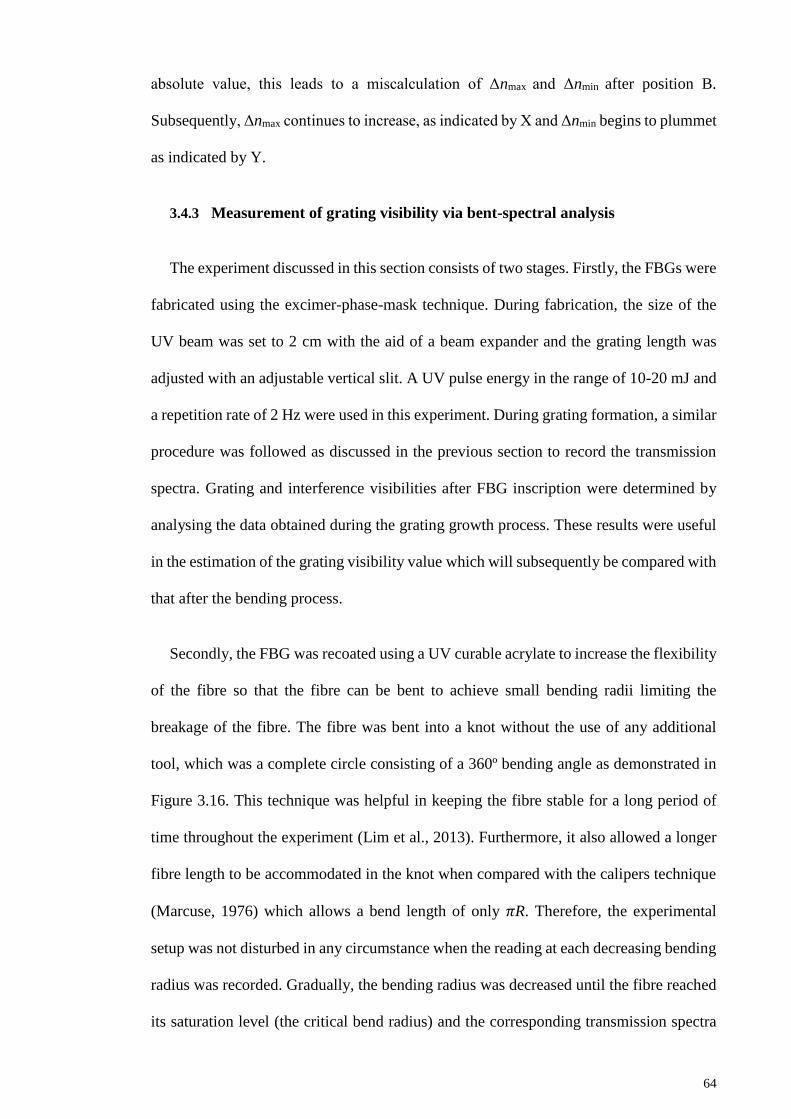
64
absolute value, this leads to a miscalculation of Δnmax and Δnmin after position B.
Subsequently, Δnmax continues to increase, as indicated by X and Δnmin begins to plummet
as indicated by Y.
3.4.3 Measurement of grating visibility via bent-spectral analysis
The experiment discussed in this section consists of two stages. Firstly, the FBGs were
fabricated using the excimer-phase-mask technique. During fabrication, the size of the
UV beam was set to 2 cm with the aid of a beam expander and the grating length was
adjusted with an adjustable vertical slit. A UV pulse energy in the range of 10-20 mJ and
a repetition rate of 2 Hz were used in this experiment. During grating formation, a similar
procedure was followed as discussed in the previous section to record the transmission
spectra. Grating and interference visibilities after FBG inscription were determined by
analysing the data obtained during the grating growth process. These results were useful
in the estimation of the grating visibility value which will subsequently be compared with
that after the bending process.
Secondly, the FBG was recoated using a UV curable acrylate to increase the flexibility
of the fibre so that the fibre can be bent to achieve small bending radii limiting the
breakage of the fibre. The fibre was bent into a knot without the use of any additional
tool, which was a complete circle consisting of a 360º bending angle as demonstrated in
Figure 3.16. This technique was helpful in keeping the fibre stable for a long period of
time throughout the experiment (Lim et al., 2013). Furthermore, it also allowed a longer
fibre length to be accommodated in the knot when compared with the calipers technique
(Marcuse, 1976) which allows a bend length of only 𝜋R. Therefore, the experimental
setup was not disturbed in any circumstance when the reading at each decreasing bending
radius was recorded. Gradually, the bending radius was decreased until the fibre reached
its saturation level (the critical bend radius) and the corresponding transmission spectra
65
were recorded. The recorded data was used to calculate the grating visibility of the bent
FBG.
Figure 3.16: Schematic experimental setup for the proposed FBG bending
technique. OSA: Optical Spectrum Analyser, ASE: Amplified Spontaneous
Emission Source.
3.4.3.1 Mathematical model for the bent-spectral analysis technique
Coupled-mode equations (Erdogan, 1997) can be used to explain the wave
characteristics of a bent FBG. The coupling coefficients and attenuation constant are
affected by the bending process. Therefore, the modified coupled-mode equations can be
expressed as (Lim et al., 2013)
( )
ˆ( ) ( ) ( )dA z
j A z j B zdz
(3.10)
*( )ˆ( ) ( ) ( )
dB zj B z j A z
dz (3.11)
where A(z) and B(z) denote the forward and backward propagating wave amplitudes and
α the new field amplitude attenuation constant. The coefficients of the coupled-mode
equations are described as
(3.12)
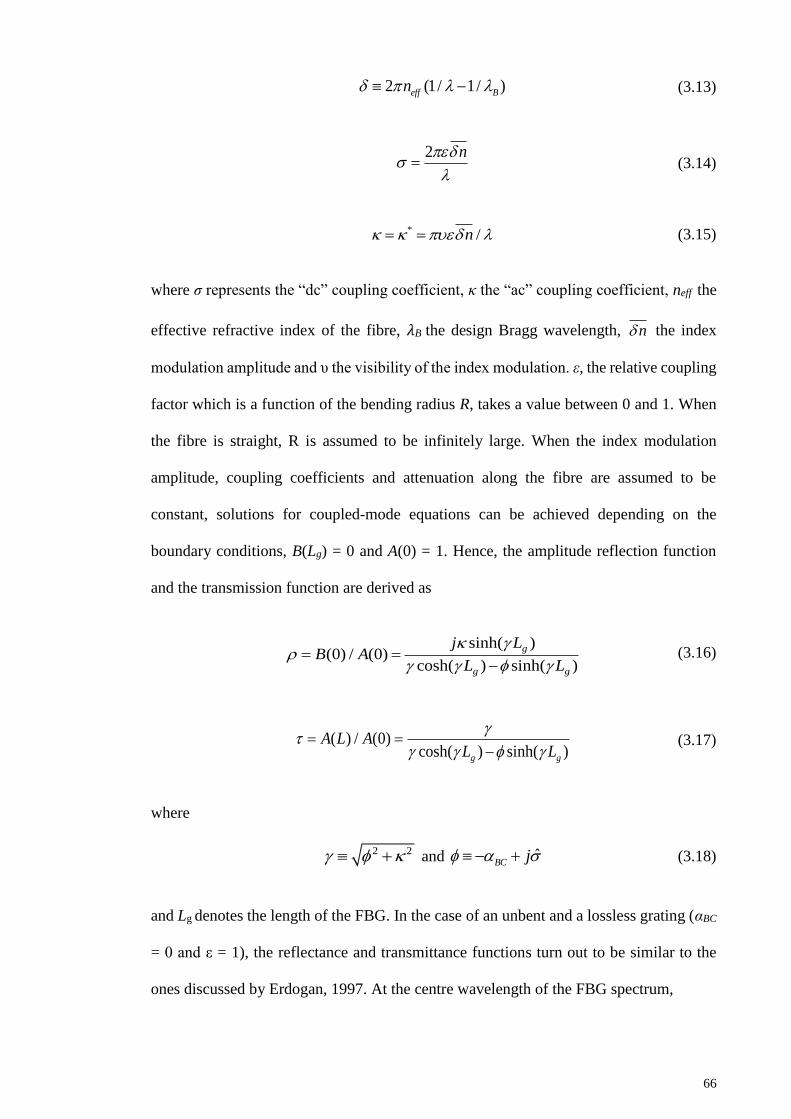
66
2 (1/ 1/ )eff Bn (3.13)
2 n
(3.14)
* /n (3.15)
where σ represents the “dc” coupling coefficient, κ the “ac” coupling coefficient, neff the
effective refractive index of the fibre, 𝜆B the design Bragg wavelength, n the index
modulation amplitude and υ the visibility of the index modulation. ε, the relative coupling
factor which is a function of the bending radius R, takes a value between 0 and 1. When
the fibre is straight, R is assumed to be infinitely large. When the index modulation
amplitude, coupling coefficients and attenuation along the fibre are assumed to be
constant, solutions for coupled-mode equations can be achieved depending on the
boundary conditions, B(Lg) = 0 and A(0) = 1. Hence, the amplitude reflection function
and the transmission function are derived as
sinh( )
(0) / (0)cosh( ) sinh( )
g
g g
j LB A
L L
(3.16)
( ) / (0)cosh( ) sinh( )g g
A L AL L
(3.17)
where
2 2 and ˆBC j (3.18)
and Lg denotes the length of the FBG. In the case of an unbent and a lossless grating (αBC
= 0 and ε = 1), the reflectance and transmittance functions turn out to be similar to the
ones discussed by Erdogan, 1997. At the centre wavelength of the FBG spectrum,
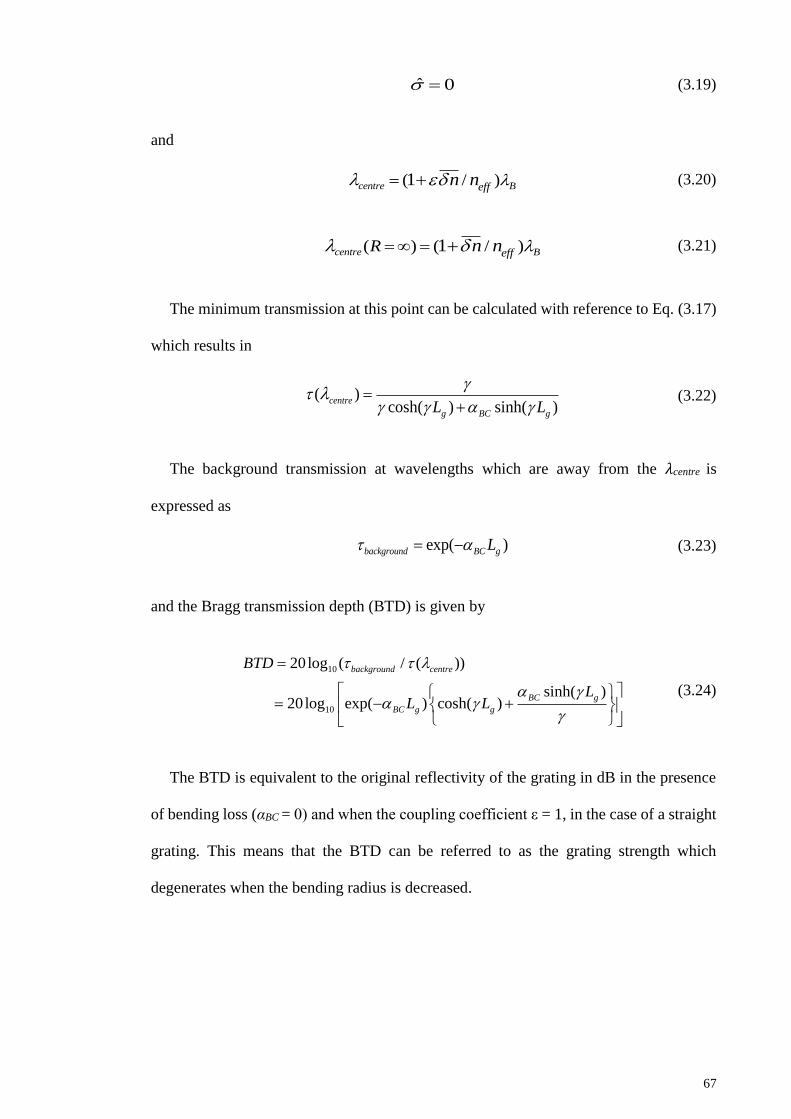
67
ˆ 0 (3.19)
and
( / )1centre Beffn n (3.20)
( ) ( / )1centre BeffR n n (3.21)
The minimum transmission at this point can be calculated with reference to Eq. (3.17)
which results in
( )cosh( ) sinh( )
centre
g BC gL L
(3.22)
The background transmission at wavelengths which are away from the 𝜆centre is
expressed as
exp( )background BC gL (3.23)
and the Bragg transmission depth (BTD) is given by
10
10
20log ( / ( ))
sinh( )20log exp( ) cosh( )
background centre
BC g
BC g g
BTD
LL L
(3.24)
The BTD is equivalent to the original reflectivity of the grating in dB in the presence
of bending loss (αBC = 0) and when the coupling coefficient ε = 1, in the case of a straight
grating. This means that the BTD can be referred to as the grating strength which
degenerates when the bending radius is decreased.
68
3.4.3.2 Grating inscription and visibility analysis
This section describes the effect of the grating and interference visibilities which are
considered as important parameters when analysing the properties of a bent FBG. In an
ideal scenario, both interference and grating visibilities are unity, but it is practically
challenging due to several factors such as: unsuppressed zeroth order, low spatial and
spectral coherences. The ultimate intention of this approach is to estimate the grating
visibilities of the fibre after the grating inscription and bending processes.
The FBGs used in this experiment were fabricated in low bending loss photosensitive
fibres (Nufern FUD-2300) with the employment of a KrF excimer laser and phase-mask
method as shown in Figure 2.9. The UV beam was divided into two components which
eventually recombined creating an interference pattern. Enhanced spatial coherence
length of the excimer laser provided an interference field with good contrast behind the
mask. The gratings were formed in the fibre by exposing it to the overlapping zone of the
two beams. The parameter vi was predicted in such a way, that it was almost equal to the
initial grating visibility value vg of the fibre which was similar to the ideal grating
visibility value. In order to obtain accurate values for vg and vi, low single-pulse energy
was used particularly at the beginning of the FBG inscription process, so that the BTD
induced by the first pulse fluence was small and that the design wavelength of the FBG
could be accurately estimated.
FUD-2300 fibre Bragg gratings consisting of different reflectivity values were
fabricated to investigate the influence on the grating visibilities. Figure 3.17 illustrates
the transmission spectra of a grating inscribed in FUD-2300 fibre. It is observed that each
of the subsequent transmission spectra red shifts implying that the centre wavelength and
the BTD of the grating gradually increase with increasing fluence. The grating whose
transmission spectrum is shown in Figure 3.17 indicates a BTD of 23.9 dB. Figure 3.18
69
indicates the linkage of the centre wavelength and the BTD against increasing fluence of
a grating inscribed in FUD-2300 fibre. Both centre wavelength and BTD show similar
trends of progression. The gradual increase of the two parameters, BTD and centre
wavelength is due to the increment of the “ac” and “dc” coupling of the fibre. With
reference to Eq. (3.20), it can be explained that 𝜆centre can be influenced by bending due
to its relationship with the relative coupling coefficient of the fibre.
Figure 3.17: Transmission spectra of a 2 cm long grating written in FUD-2300
fibre.
Figure 3.18: Overlaid graph of centre wavelength shift and variation of BTD
with increasing UV fluence.
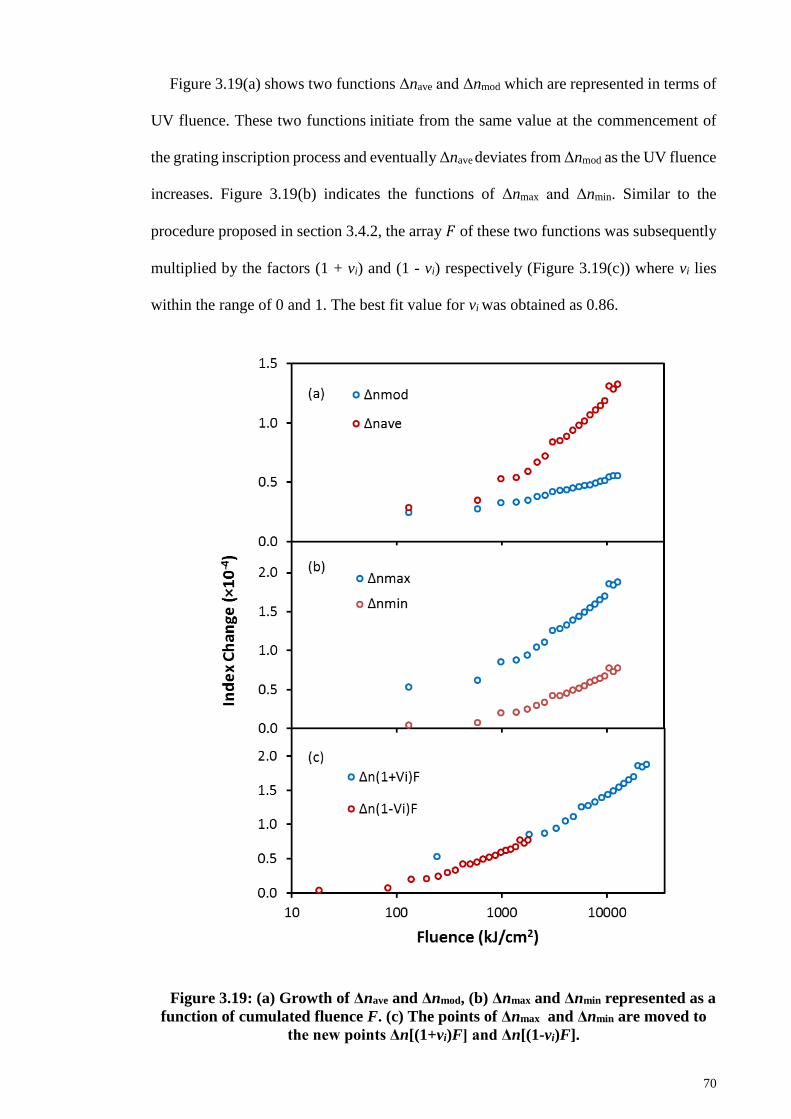
70
Figure 3.19(a) shows two functions Δnave and Δnmod which are represented in terms of
UV fluence. These two functions initiate from the same value at the commencement of
the grating inscription process and eventually Δnave deviates from Δnmod as the UV fluence
increases. Figure 3.19(b) indicates the functions of Δnmax and Δnmin. Similar to the
procedure proposed in section 3.4.2, the array 𝐹 of these two functions was subsequently
multiplied by the factors (1 + vi) and (1 - vi) respectively (Figure 3.19(c)) where vi lies
within the range of 0 and 1. The best fit value for vi was obtained as 0.86.
Figure 3.19: (a) Growth of Δnave and Δnmod, (b) Δnmax and Δnmin represented as a
function of cumulated fluence F. (c) The points of Δnmax and Δnmin are moved to
the new points Δn[(1+vi)F] and Δn[(1-vi)F].
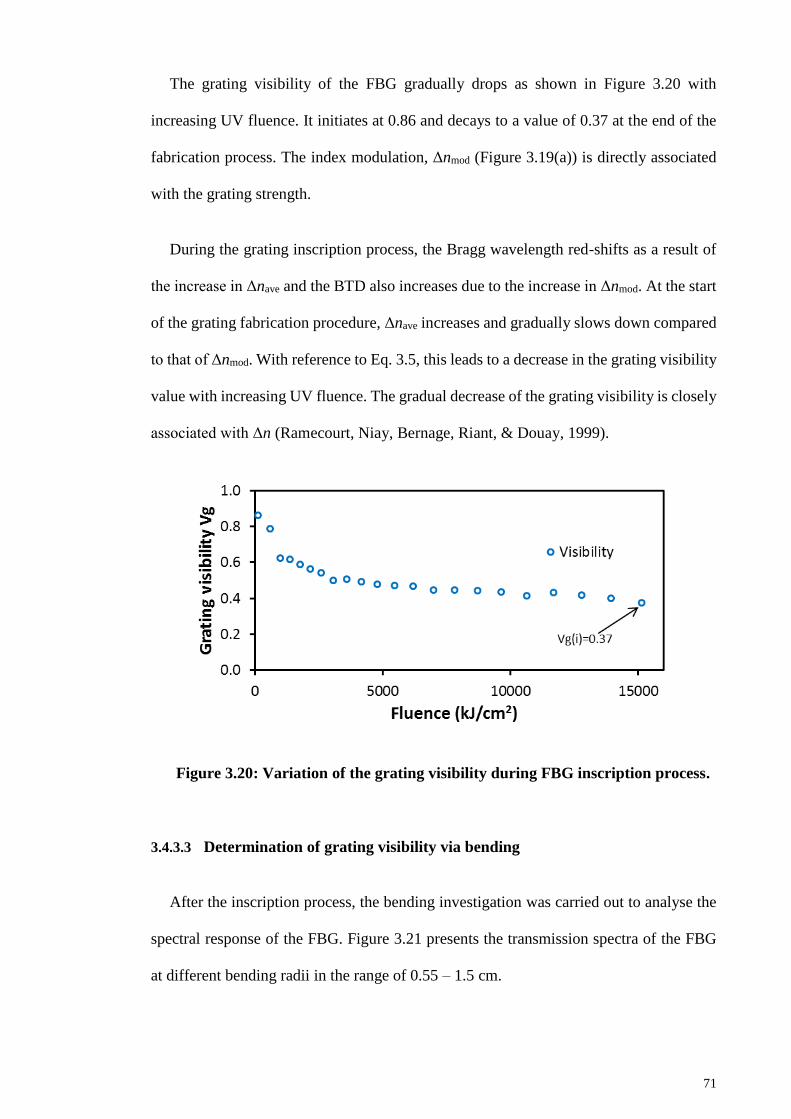
71
The grating visibility of the FBG gradually drops as shown in Figure 3.20 with
increasing UV fluence. It initiates at 0.86 and decays to a value of 0.37 at the end of the
fabrication process. The index modulation, Δnmod (Figure 3.19(a)) is directly associated
with the grating strength.
During the grating inscription process, the Bragg wavelength red-shifts as a result of
the increase in Δnave and the BTD also increases due to the increase in Δnmod. At the start
of the grating fabrication procedure, Δnave increases and gradually slows down compared
to that of Δnmod. With reference to Eq. 3.5, this leads to a decrease in the grating visibility
value with increasing UV fluence. The gradual decrease of the grating visibility is closely
associated with Δn (Ramecourt, Niay, Bernage, Riant, & Douay, 1999).
Figure 3.20: Variation of the grating visibility during FBG inscription process.
3.4.3.3 Determination of grating visibility via bending
After the inscription process, the bending investigation was carried out to analyse the
spectral response of the FBG. Figure 3.21 presents the transmission spectra of the FBG
at different bending radii in the range of 0.55 – 1.5 cm.
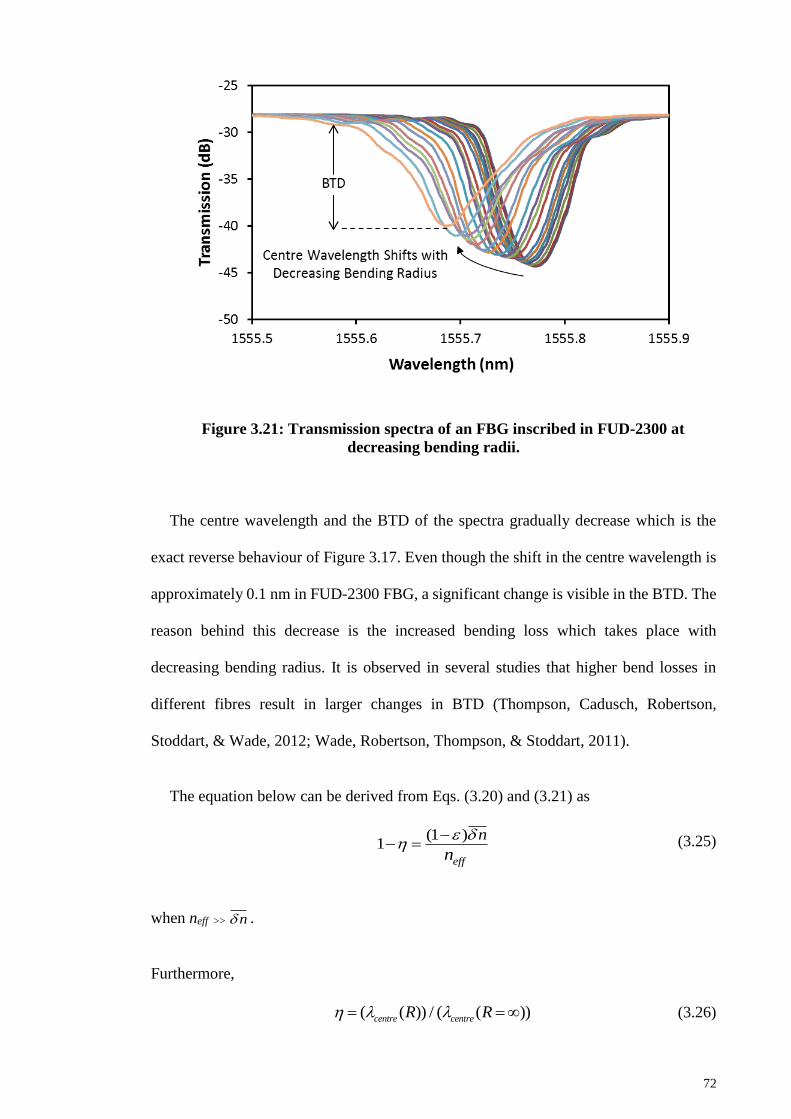
72
Figure 3.21: Transmission spectra of an FBG inscribed in FUD-2300 at
decreasing bending radii.
The centre wavelength and the BTD of the spectra gradually decrease which is the
exact reverse behaviour of Figure 3.17. Even though the shift in the centre wavelength is
approximately 0.1 nm in FUD-2300 FBG, a significant change is visible in the BTD. The
reason behind this decrease is the increased bending loss which takes place with
decreasing bending radius. It is observed in several studies that higher bend losses in
different fibres result in larger changes in BTD (Thompson, Cadusch, Robertson,
Stoddart, & Wade, 2012; Wade, Robertson, Thompson, & Stoddart, 2011).
The equation below can be derived from Eqs. (3.20) and (3.21) as
(1 )1
eff
n
n
(3.25)
when neff >> n .
Furthermore,
( ( )) / ( ( ))centre centreR R (3.26)
73
The values of LHS of Eq. (3.25) were calculated using the data of centre wavelengths
while the RHS of Eq. (3.25) were calculated using the BTD data. In order to acquire the
best fitting graph of these two functions, the visibility value was adjusted until the curves
of the functions overlapped with each other and the optimum cross correlation coefficient
was achieved. The cross correlation coefficient can be computed with
2 2
1( )( )
1
1 1( ) ( )
1 1
x x y yK
x x y yK K
(3.27)
where x and y represent the data of LHS and RHS of Eq. (3.25). �� and �� denote the
respective mean values and the summations ∑ are taken over a segment of length K+1
(Aarts, Irwan, & Janssen, 2002). Afterwards, the grating visibilities before the bending
process, vg(i) and after the bending process, vg(b) were compared and analysed. It is
observed that the final value of vg(i) is as same as the value of vg(b) which is obtained after
bending. The misalignment of LHS and RHS only occurs after exceeding the critical bend
radius of FUD-2300 which is 0.63 cm. NA, core and cladding radii are important
parameters in this experiment. It is also realised that a smaller bending radius prior to
fibre breakage results in high optical losses due to the leakage of wave power from the
core to the cladding.
Figure 3.22 shows the results obtained based on Eq. (3.25). The two graphs are
matched by varying the grating visibility of the fibre. The graphs in Figure 3.22 were
obtained when vg(b) = 0.37 which is almost equivalent to the final value of the grating
visibility, vg(i) obtained during the FBG inscription process demonstrated in Figure 3.20.
This finding shows that the grating visibility of a specific FBG can be determined from
the variation in the transmission spectrum with decreasing bending radius.
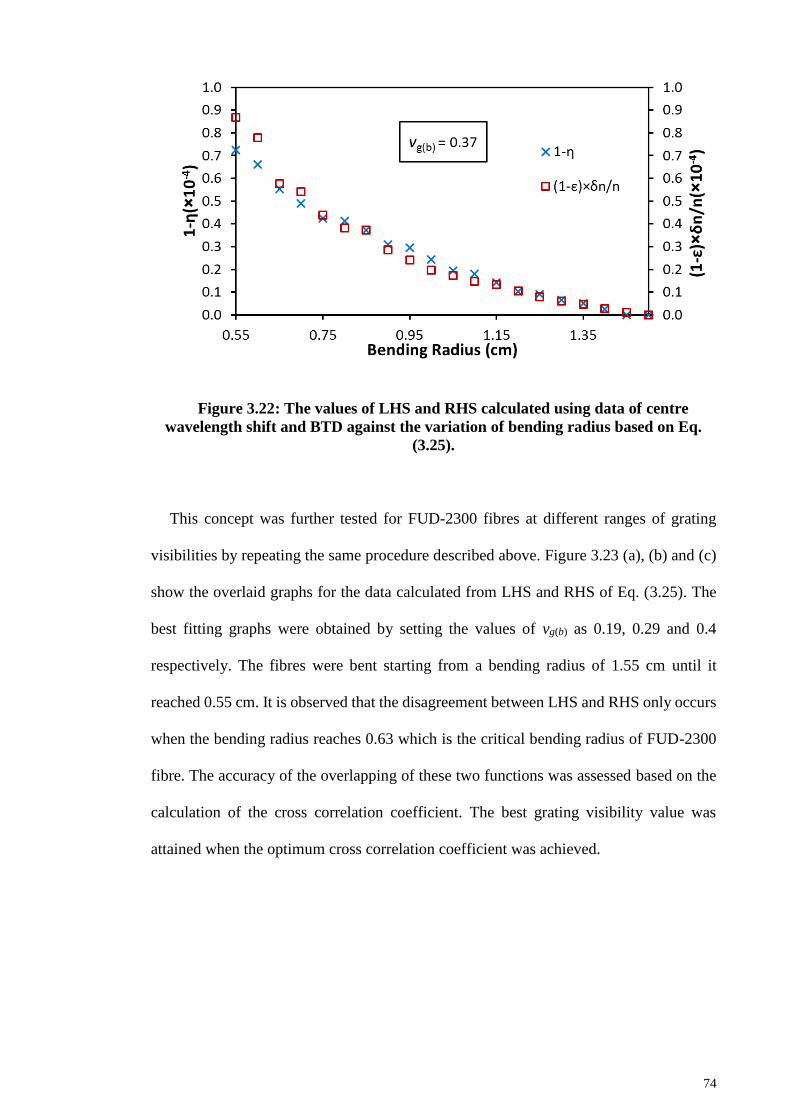
74
Figure 3.22: The values of LHS and RHS calculated using data of centre
wavelength shift and BTD against the variation of bending radius based on Eq.
(3.25).
This concept was further tested for FUD-2300 fibres at different ranges of grating
visibilities by repeating the same procedure described above. Figure 3.23 (a), (b) and (c)
show the overlaid graphs for the data calculated from LHS and RHS of Eq. (3.25). The
best fitting graphs were obtained by setting the values of vg(b) as 0.19, 0.29 and 0.4
respectively. The fibres were bent starting from a bending radius of 1.55 cm until it
reached 0.55 cm. It is observed that the disagreement between LHS and RHS only occurs
when the bending radius reaches 0.63 which is the critical bending radius of FUD-2300
fibre. The accuracy of the overlapping of these two functions was assessed based on the
calculation of the cross correlation coefficient. The best grating visibility value was
attained when the optimum cross correlation coefficient was achieved.
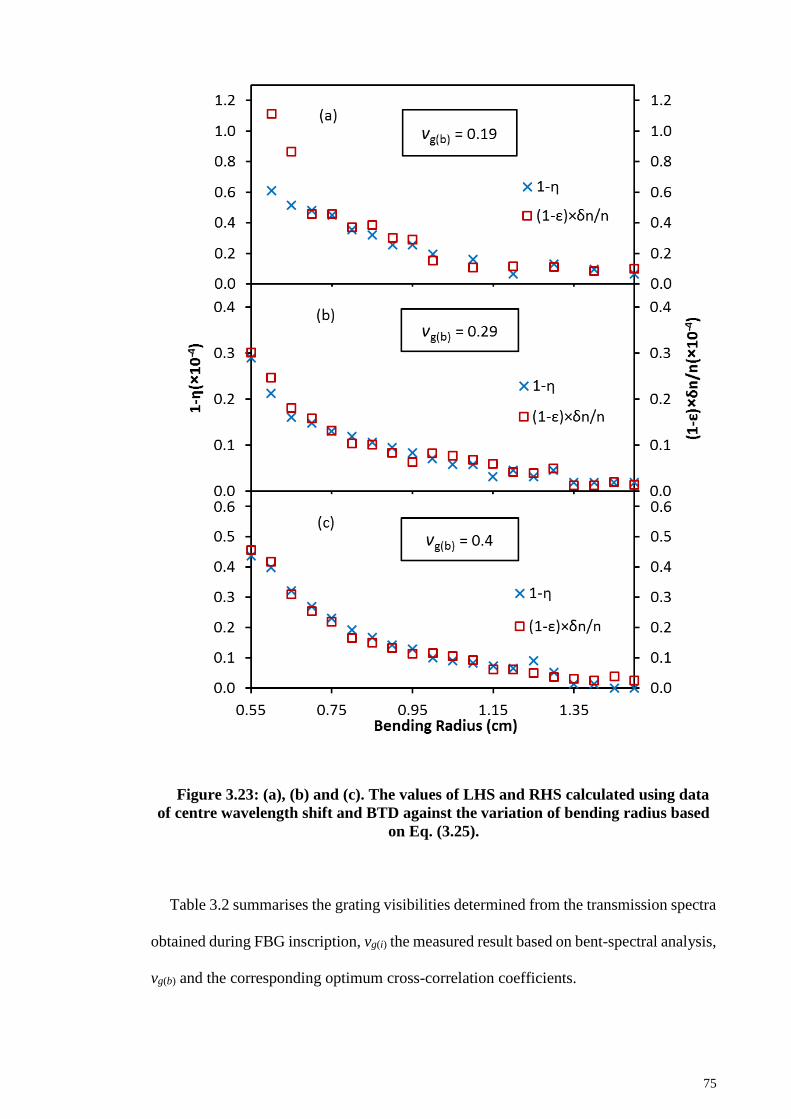
75
Figure 3.23: (a), (b) and (c). The values of LHS and RHS calculated using data
of centre wavelength shift and BTD against the variation of bending radius based
on Eq. (3.25).
Table 3.2 summarises the grating visibilities determined from the transmission spectra
obtained during FBG inscription, vg(i) the measured result based on bent-spectral analysis,
vg(b) and the corresponding optimum cross-correlation coefficients.
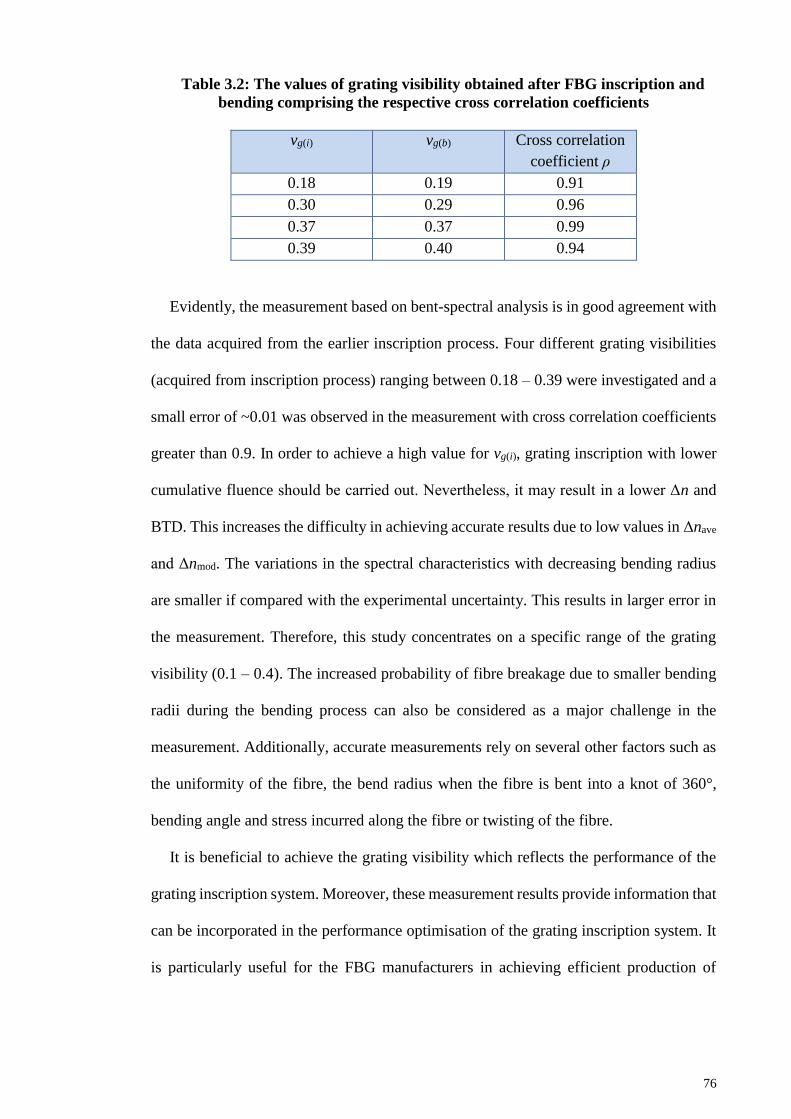
76
Table 3.2: The values of grating visibility obtained after FBG inscription and
bending comprising the respective cross correlation coefficients
vg(i) vg(b) Cross correlation
coefficient ρ
0.18 0.19 0.91
0.30 0.29 0.96
0.37 0.37 0.99
0.39 0.40 0.94
Evidently, the measurement based on bent-spectral analysis is in good agreement with
the data acquired from the earlier inscription process. Four different grating visibilities
(acquired from inscription process) ranging between 0.18 – 0.39 were investigated and a
small error of ~0.01 was observed in the measurement with cross correlation coefficients
greater than 0.9. In order to achieve a high value for vg(i), grating inscription with lower
cumulative fluence should be carried out. Nevertheless, it may result in a lower Δn and
BTD. This increases the difficulty in achieving accurate results due to low values in Δnave
and Δnmod. The variations in the spectral characteristics with decreasing bending radius
are smaller if compared with the experimental uncertainty. This results in larger error in
the measurement. Therefore, this study concentrates on a specific range of the grating
visibility (0.1 – 0.4). The increased probability of fibre breakage due to smaller bending
radii during the bending process can also be considered as a major challenge in the
measurement. Additionally, accurate measurements rely on several other factors such as
the uniformity of the fibre, the bend radius when the fibre is bent into a knot of 360°,
bending angle and stress incurred along the fibre or twisting of the fibre.
It is beneficial to achieve the grating visibility which reflects the performance of the
grating inscription system. Moreover, these measurement results provide information that
can be incorporated in the performance optimisation of the grating inscription system. It
is particularly useful for the FBG manufacturers in achieving efficient production of

77
quality FBGs and preventing excessive UV irradiation which would potentially weaken
the fibre glass strength and lead to glass brittleness.
3.5 Summary
In this chapter, a short description of the existing photosensitivity mechanisms and the
various techniques for photosensitivity enhancement were presented. A brief study of
different photosensitive dopants has been carried out. The role of Gallium as a
photosensitive dopant, detailed information about fabrication of gallosilicate fibre, its
grating inscription characteristics under different conditions and structural behaviour
were investigated.
A mathematical model to characterise the growth in the refractive index change during
grating inscription process was proposed. The curve matching and bent spectral analysis
techniques were introduced as two characterisation techniques. The data of local
refractive index change, Δnmax and Δnmin were generated by determining both Δnave and
Δnmod from the recorded transmission spectra. A single characteristic function Δn (F) was
used to characterise the curves of Δnave and Δnmod. Interference visibility was also
measured using the curve-matching technique. The spectral properties of FBGs under
applied UV fluence and bending conditions were analysed. The coupled-mode equations
were modified since the coupling coefficients and the attenuation constant were affected
by the bending process. Using the bent-spectral analysis technique, measurement of
grating visibility after the inscription process and with decreasing bending radii were
determined by representing the two individual functions on an overlaid graph. Finally,
the repeatability of this measurement technique was tested at different ranges of grating
visibility.
78
CHAPTER 4: THERMAL STABILITY OF FIBRE BRAGG GRATINGS
Fibre Bragg gratings (FBGs) are fabricated through a process of permanent refractive
index change in the fibre core. However, the refractive index modulation of these
structures begins to decay with increasing temperature and eventually it is completely
erased when a specific temperature limit is exceeded. When FBGs are isothermally
annealed for a sufficient time duration at a certain temperature and subsequently annealed
at temperatures lower than this set temperature, it does not result in further degradation
of the grating due to grating stabilisation (Meltz & Morey, 1991). An overview of the
decay models, techniques to enhance thermal stability and gratings with high temperature
resistivity are discussed. The regeneration characteristics of gallosilicate fibre are also
highlighted in this chapter.
4.1 Decay Models
Thermal stability of Bragg gratings depend on numerous factors namely, the type of
fibre (Williams & Smith, 1995), the inscription wavelength (Starodubov, Grubsky,
Feinberg, Kobrin, & Juma, 1997) and hydrogenation (Grubsky, Starodubov, & Feinberg,
1999b; Kannan & Lemaire, 1996). Erdogan et al. (1994) proposed two models to describe
the thermal decay characteristics of FBGs inscribed in erbium-doped silica optical fibres.
They are widely known as the accelerated ageing model and the power law model. These
models assume that the UV-induced defects can be thermally reversed since they possess
a diverse range of activation energies which are the reason behind the change in refractive
index. A schematic diagram of the model is shown in Figure 4.1.
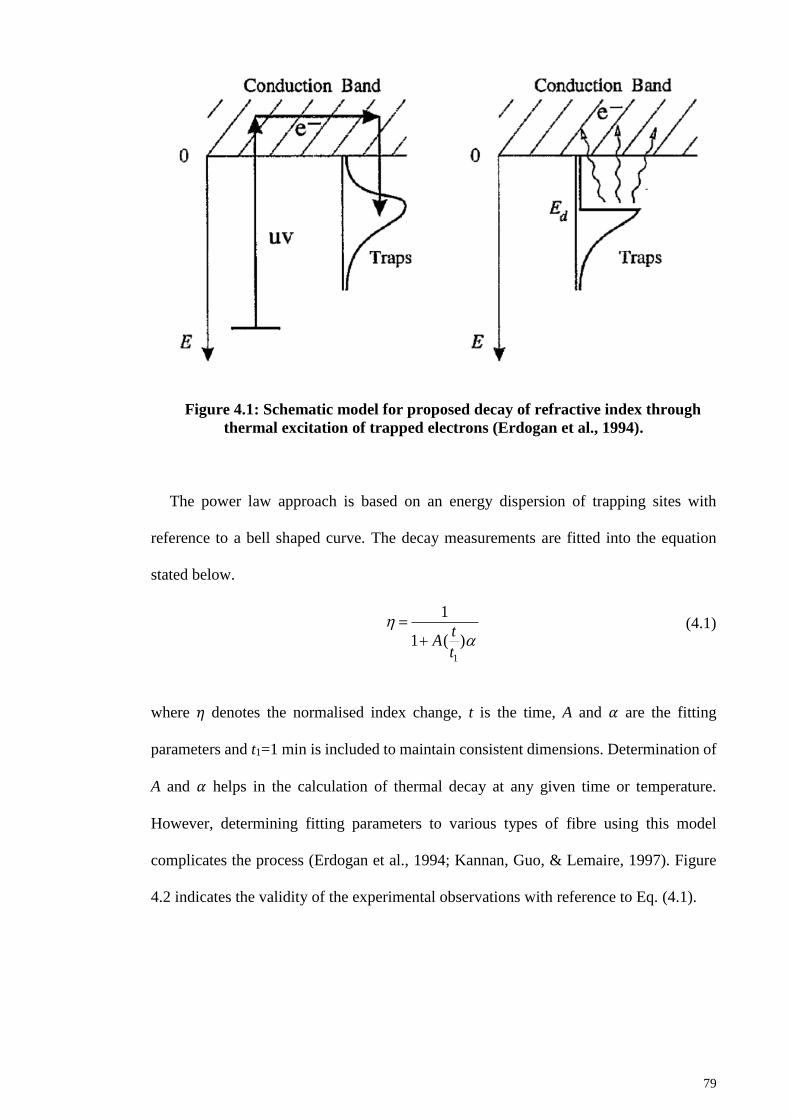
79
Figure 4.1: Schematic model for proposed decay of refractive index through
thermal excitation of trapped electrons (Erdogan et al., 1994).
The power law approach is based on an energy dispersion of trapping sites with
reference to a bell shaped curve. The decay measurements are fitted into the equation
stated below.
1
1
1 ( )t
At
(4.1)
where 𝜂 denotes the normalised index change, t is the time, A and 𝛼 are the fitting
parameters and t1=1 min is included to maintain consistent dimensions. Determination of
A and 𝛼 helps in the calculation of thermal decay at any given time or temperature.
However, determining fitting parameters to various types of fibre using this model
complicates the process (Erdogan et al., 1994; Kannan, Guo, & Lemaire, 1997). Figure
4.2 indicates the validity of the experimental observations with reference to Eq. (4.1).
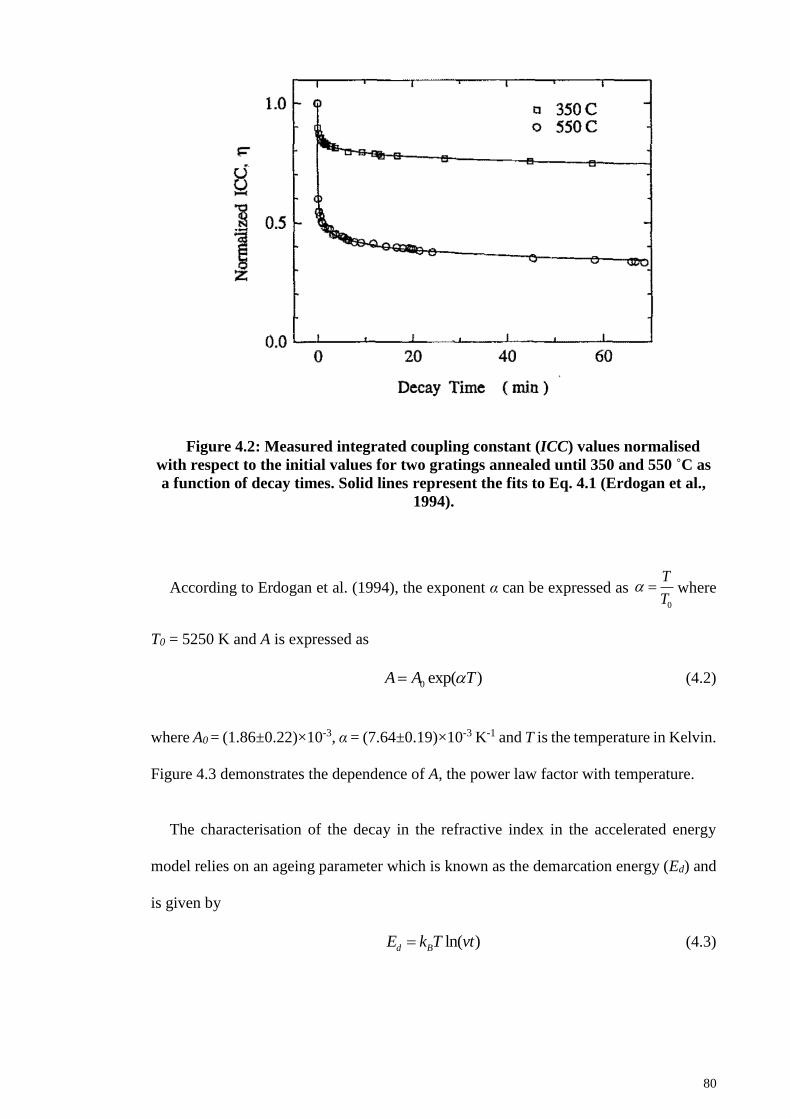
80
Figure 4.2: Measured integrated coupling constant (ICC) values normalised
with respect to the initial values for two gratings annealed until 350 and 550 ˚C as
a function of decay times. Solid lines represent the fits to Eq. 4.1 (Erdogan et al.,
1994).
According to Erdogan et al. (1994), the exponent α can be expressed as 0
T
T where
T0 = 5250 K and A is expressed as
0 exp( )A A T (4.2)
where A0 = (1.86±0.22)×10-3, α = (7.64±0.19)×10-3 K-1 and T is the temperature in Kelvin.
Figure 4.3 demonstrates the dependence of A, the power law factor with temperature.
The characterisation of the decay in the refractive index in the accelerated energy
model relies on an ageing parameter which is known as the demarcation energy (Ed) and
is given by
ln( )d BE k T vt (4.3)
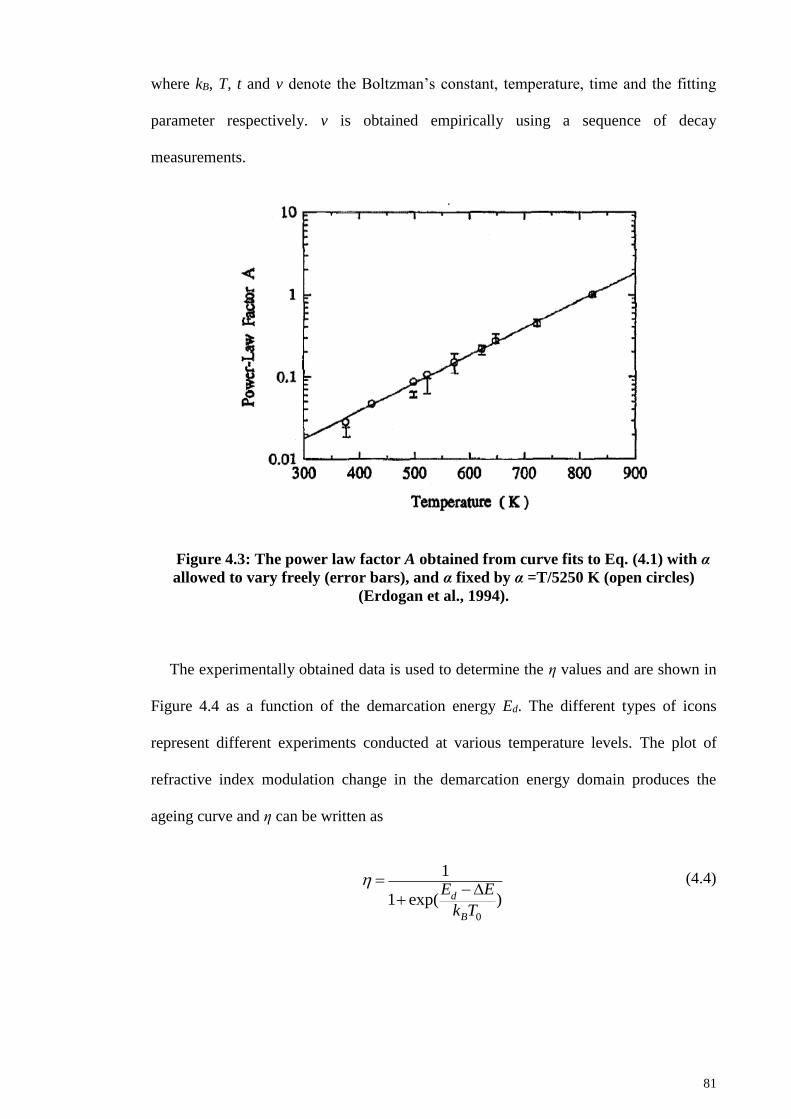
81
where kB, T, t and v denote the Boltzman’s constant, temperature, time and the fitting
parameter respectively. v is obtained empirically using a sequence of decay
measurements.
Figure 4.3: The power law factor A obtained from curve fits to Eq. (4.1) with α
allowed to vary freely (error bars), and α fixed by α =T/5250 K (open circles)
(Erdogan et al., 1994).
The experimentally obtained data is used to determine the η values and are shown in
Figure 4.4 as a function of the demarcation energy Ed. The different types of icons
represent different experiments conducted at various temperature levels. The plot of
refractive index modulation change in the demarcation energy domain produces the
ageing curve and η can be written as
0
1
1 exp( )d
B
E E
k T
(4.4)
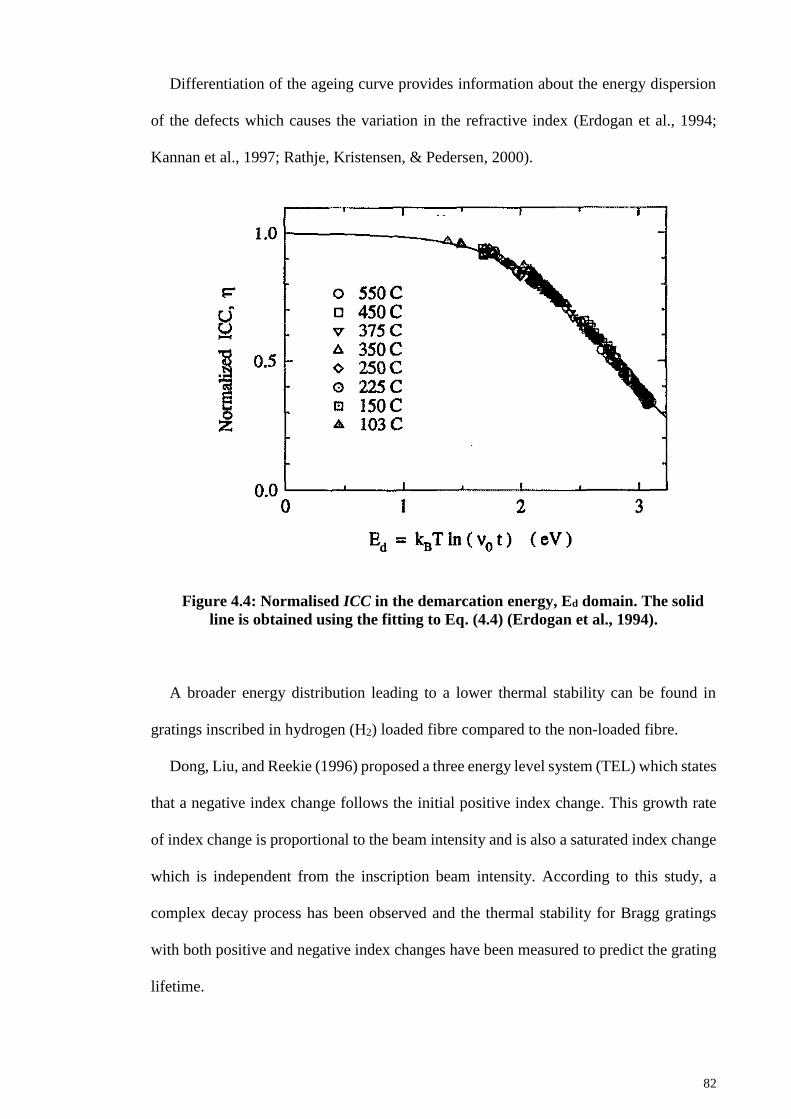
82
Differentiation of the ageing curve provides information about the energy dispersion
of the defects which causes the variation in the refractive index (Erdogan et al., 1994;
Kannan et al., 1997; Rathje, Kristensen, & Pedersen, 2000).
Figure 4.4: Normalised ICC in the demarcation energy, Ed domain. The solid
line is obtained using the fitting to Eq. (4.4) (Erdogan et al., 1994).
A broader energy distribution leading to a lower thermal stability can be found in
gratings inscribed in hydrogen (H2) loaded fibre compared to the non-loaded fibre.
Dong, Liu, and Reekie (1996) proposed a three energy level system (TEL) which states
that a negative index change follows the initial positive index change. This growth rate
of index change is proportional to the beam intensity and is also a saturated index change
which is independent from the inscription beam intensity. According to this study, a
complex decay process has been observed and the thermal stability for Bragg gratings
with both positive and negative index changes have been measured to predict the grating
lifetime.
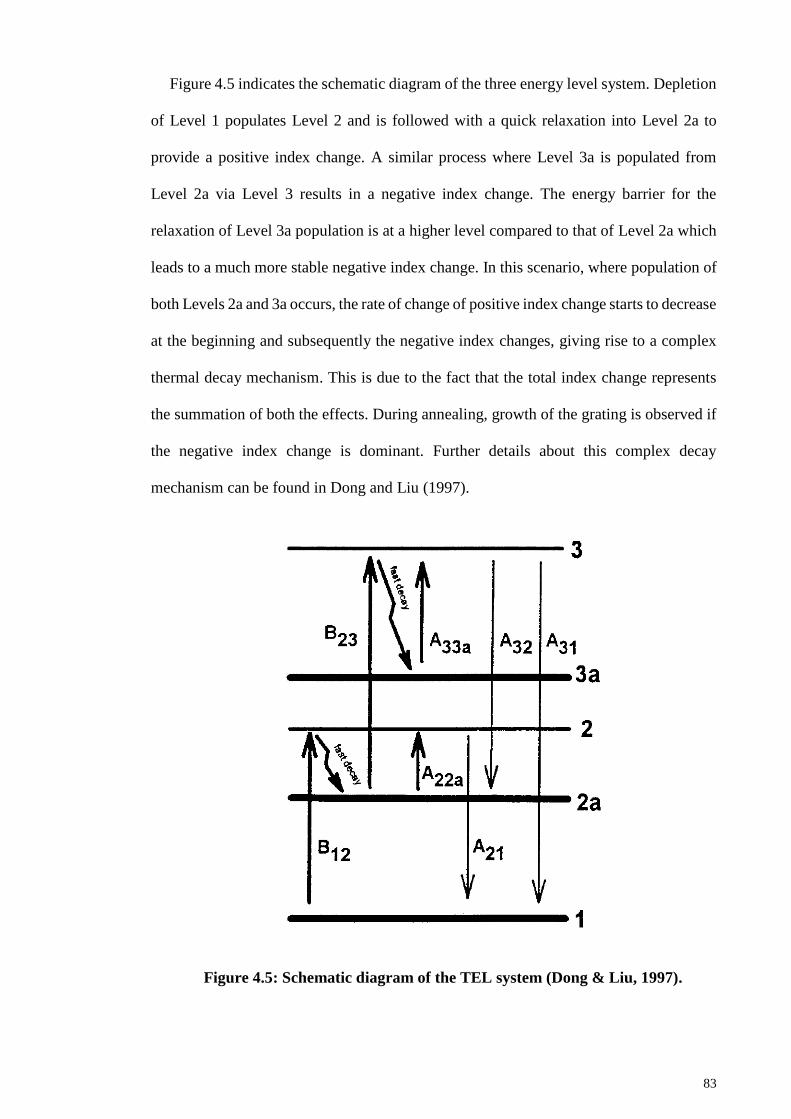
83
Figure 4.5 indicates the schematic diagram of the three energy level system. Depletion
of Level 1 populates Level 2 and is followed with a quick relaxation into Level 2a to
provide a positive index change. A similar process where Level 3a is populated from
Level 2a via Level 3 results in a negative index change. The energy barrier for the
relaxation of Level 3a population is at a higher level compared to that of Level 2a which
leads to a much more stable negative index change. In this scenario, where population of
both Levels 2a and 3a occurs, the rate of change of positive index change starts to decrease
at the beginning and subsequently the negative index changes, giving rise to a complex
thermal decay mechanism. This is due to the fact that the total index change represents
the summation of both the effects. During annealing, growth of the grating is observed if
the negative index change is dominant. Further details about this complex decay
mechanism can be found in Dong and Liu (1997).
Figure 4.5: Schematic diagram of the TEL system (Dong & Liu, 1997).
84
4.1.1 Types of accelerated ageing experiments
Accelerated ageing tests can be performed in three different ways. They are namely,
true isochronal annealing, step isochronal annealing and isothermal annealing (Lancry,
Poumellec, Costes, & Magné, 2014). True isochronal annealing is carried out by
annealing the exact same gratings with a rising temperature for a set time duration. In this
method, at each annealing temperature, a new grating is used. The step isochronal
annealing method differs from the true isochronal method in the sense that for each
independent annealing step, the same grating is incorporated. This also makes it possible
for a reliable approximation to be made about the true isochronal annealing method
(Razafimahatratra, Niay, Douay, Poumellec, & Riant, 2000). This is the most commonly
used technique since it consumes a lesser amount of time. The isothermal annealing
technique comprises holding the temperatures at set values above room temperature for
identical gratings where the transmission spectra of the gratings are recorded periodically
(Erdogan et al., 1994).
4.1.2 Determination of thermal decay during accelerated ageing experiments
The thermal degradation of a grating can be modelled in terms of its normalised
integrated coupling coefficient (NICC) since the ICC is directly proportional to the peak
reflectivity. At any given time, the peak reflectivity of a grating can be represented as
min1R T (4.5)
where Tmin is the minimum transmission of the grating which occurs at the Bragg
wavelength (𝜆B). The ICC is given by
1
mintanh ( 1ICC T (4.6)
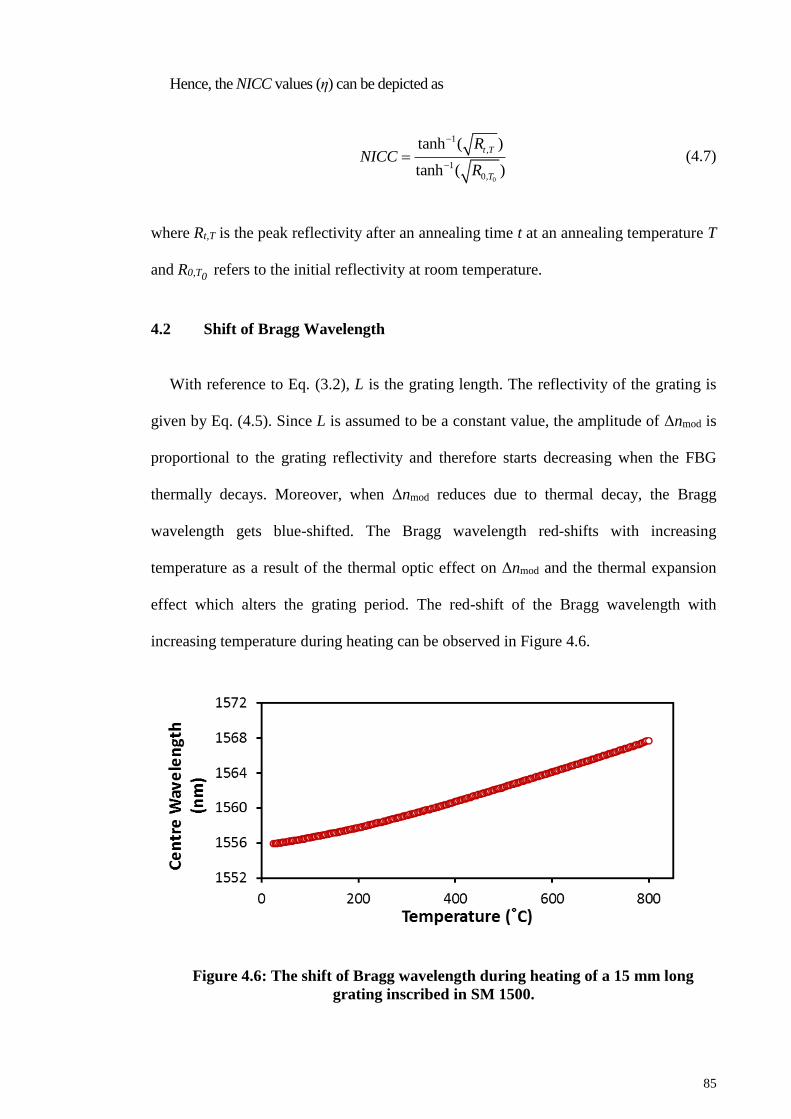
85
Hence, the NICC values (η) can be depicted as
0
1
,
1
0,
tanh ( )
tanh ( )
t T
T
RNICC
R
(4.7)
where Rt,T is the peak reflectivity after an annealing time t at an annealing temperature T
and R0,T0 refers to the initial reflectivity at room temperature.
4.2 Shift of Bragg Wavelength
With reference to Eq. (3.2), L is the grating length. The reflectivity of the grating is
given by Eq. (4.5). Since L is assumed to be a constant value, the amplitude of Δnmod is
proportional to the grating reflectivity and therefore starts decreasing when the FBG
thermally decays. Moreover, when Δnmod reduces due to thermal decay, the Bragg
wavelength gets blue-shifted. The Bragg wavelength red-shifts with increasing
temperature as a result of the thermal optic effect on Δnmod and the thermal expansion
effect which alters the grating period. The red-shift of the Bragg wavelength with
increasing temperature during heating can be observed in Figure 4.6.
Figure 4.6: The shift of Bragg wavelength during heating of a 15 mm long
grating inscribed in SM 1500.
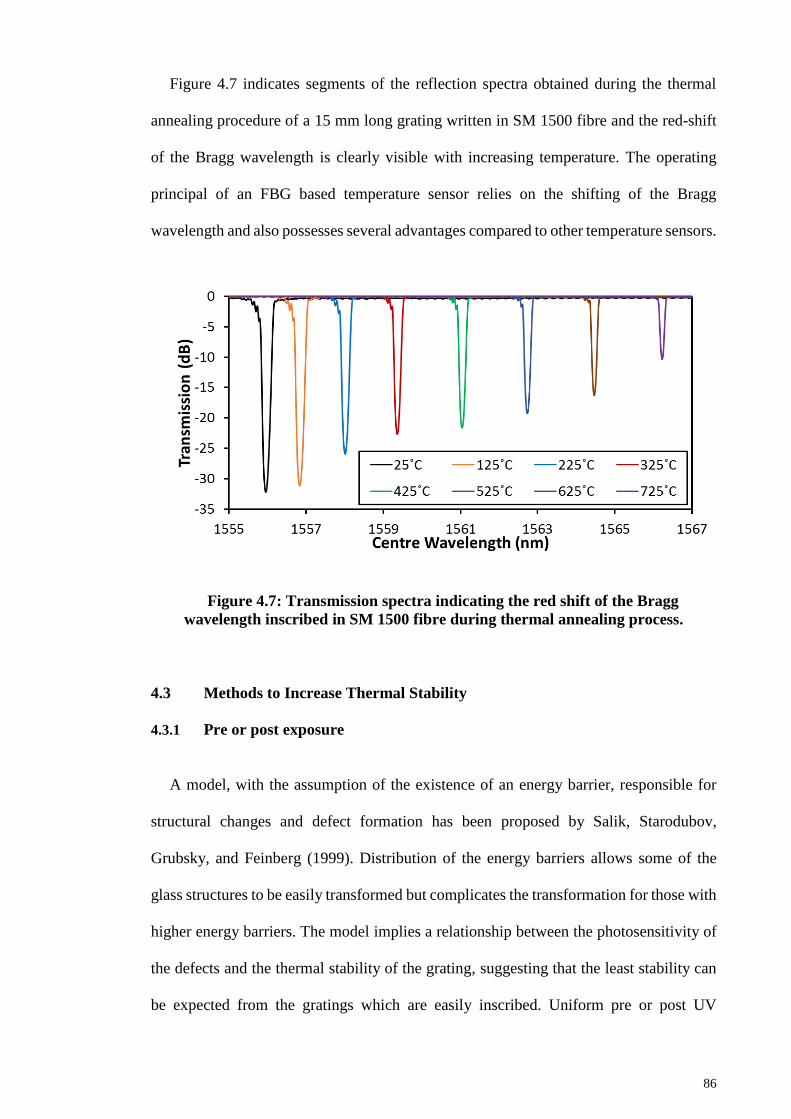
86
Figure 4.7 indicates segments of the reflection spectra obtained during the thermal
annealing procedure of a 15 mm long grating written in SM 1500 fibre and the red-shift
of the Bragg wavelength is clearly visible with increasing temperature. The operating
principal of an FBG based temperature sensor relies on the shifting of the Bragg
wavelength and also possesses several advantages compared to other temperature sensors.
Figure 4.7: Transmission spectra indicating the red shift of the Bragg
wavelength inscribed in SM 1500 fibre during thermal annealing process.
4.3 Methods to Increase Thermal Stability
4.3.1 Pre or post exposure
A model, with the assumption of the existence of an energy barrier, responsible for
structural changes and defect formation has been proposed by Salik, Starodubov,
Grubsky, and Feinberg (1999). Distribution of the energy barriers allows some of the
glass structures to be easily transformed but complicates the transformation for those with
higher energy barriers. The model implies a relationship between the photosensitivity of
the defects and the thermal stability of the grating, suggesting that the least stability can
be expected from the gratings which are easily inscribed. Uniform pre or post UV
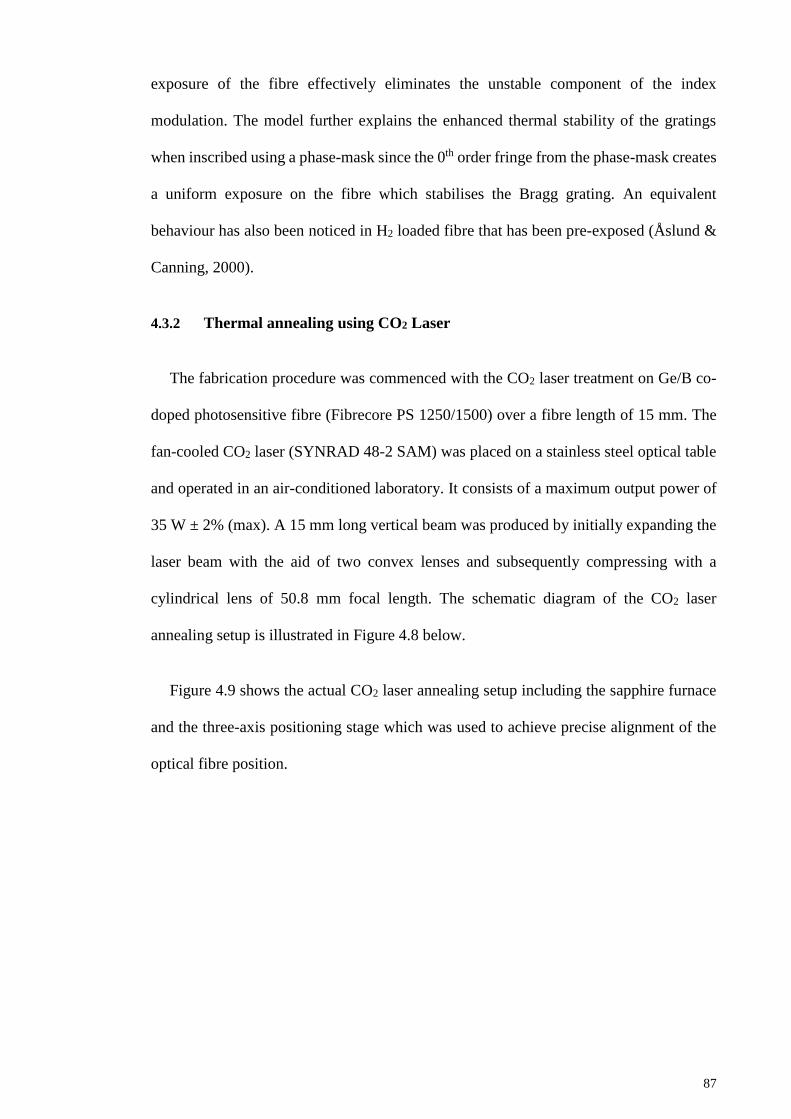
87
exposure of the fibre effectively eliminates the unstable component of the index
modulation. The model further explains the enhanced thermal stability of the gratings
when inscribed using a phase-mask since the 0th order fringe from the phase-mask creates
a uniform exposure on the fibre which stabilises the Bragg grating. An equivalent
behaviour has also been noticed in H2 loaded fibre that has been pre-exposed (Åslund &
Canning, 2000).
4.3.2 Thermal annealing using CO2 Laser
The fabrication procedure was commenced with the CO2 laser treatment on Ge/B co-
doped photosensitive fibre (Fibrecore PS 1250/1500) over a fibre length of 15 mm. The
fan-cooled CO2 laser (SYNRAD 48-2 SAM) was placed on a stainless steel optical table
and operated in an air-conditioned laboratory. It consists of a maximum output power of
35 W ± 2% (max). A 15 mm long vertical beam was produced by initially expanding the
laser beam with the aid of two convex lenses and subsequently compressing with a
cylindrical lens of 50.8 mm focal length. The schematic diagram of the CO2 laser
annealing setup is illustrated in Figure 4.8 below.
Figure 4.9 shows the actual CO2 laser annealing setup including the sapphire furnace
and the three-axis positioning stage which was used to achieve precise alignment of the
optical fibre position.
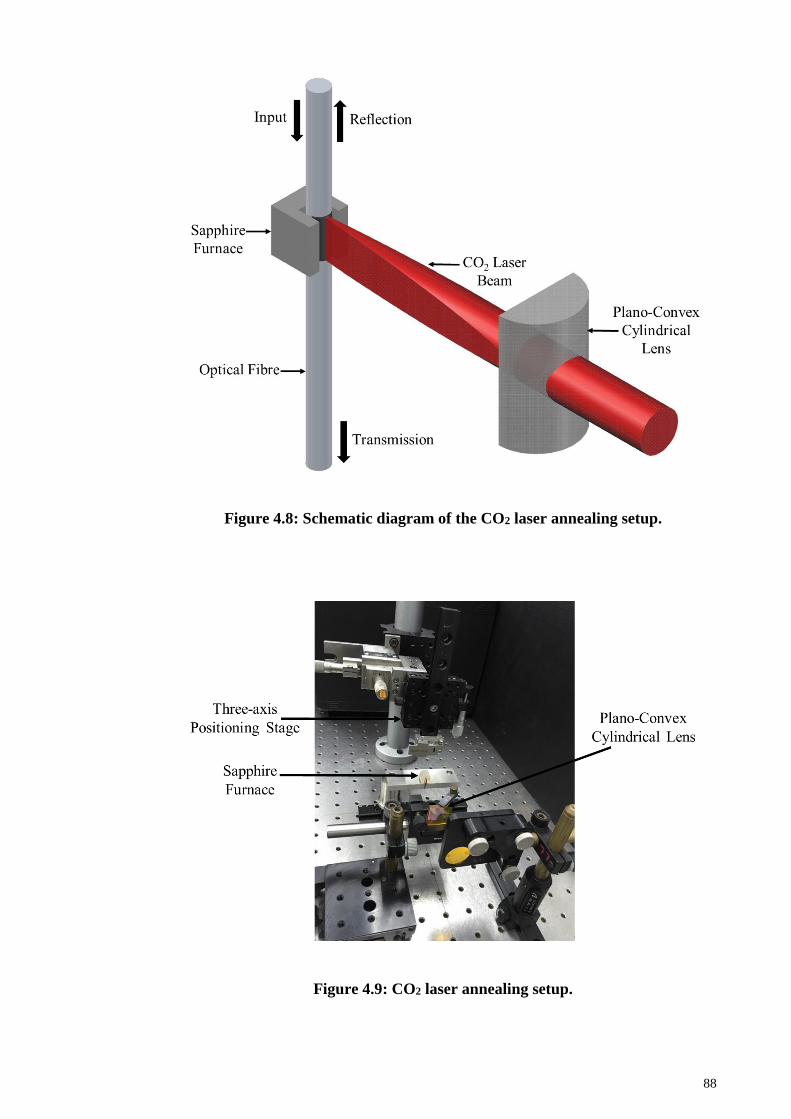
88
Figure 4.8: Schematic diagram of the CO2 laser annealing setup.
Figure 4.9: CO2 laser annealing setup.

89
During the CO2 laser pre-treatment, the laser power irradiation on the fibre was raised
from 0 W to 14.4 W (80% of the maximum laser power) at a rate of 0.18 W/s with a hold
time of 5 min after the ramping procedure. A slow cooling process was followed after the
annealing process of the PS fibre using the CO2 laser where the laser power was reduced
at a rate of 0.09 W every 10s. Subsequently, the CO2 laser treated fibre along with non-
treated fibre were loaded in a pressurised H2 gas chamber at 1800 psi for 10 days.
Afterwards, the FBG inscription procedure was carried out in both types of fibres and 10
mm Bragg gratings were inscribed using 193 nm ArF excimer laser until similar
reflectivity levels were achieved for each fibre. The reflectivity of both gratings amounted
to ~ 40 dB. Monitoring of the transmission spectra of the two types of fibres was achieved
using an Optical Spectrum Analyser (OSA). Prior to the annealing process, both the
treated and non-treated PS fibre were kept inside an oven at 80 ˚C for 8 hours to achieve
out-diffusion of the residual H2 from the fibre core.
The annealing process was carried out on both CO2 laser treated and non-treated PS
fibre under similar temperature conditions to achieve accurate measurements. The fibres
were placed inside a tube furnace (see Figure 4.10) where the temperature increment was
controlled using the inbuilt program in the furnace. During the annealing procedure, the
temperature was initially increased from room temperature (25 C) to 100 ˚C at a ramping
time of 5 min. Subsequently, the temperatures were incremented to 200 ˚C and 300 ˚C
and dwelled at each temperature for 3 hours. During the treatment, the transmission
spectra were observed and recorded within a time interval of one minute for each fibre in
a similar manner as discussed in Chapter 3. The experiment was repeated at 100 ˚C, 150
˚C and 250 ˚C in order to analyse the accelerated ageing curves of the treated fibre and to
verify the validity of this study.
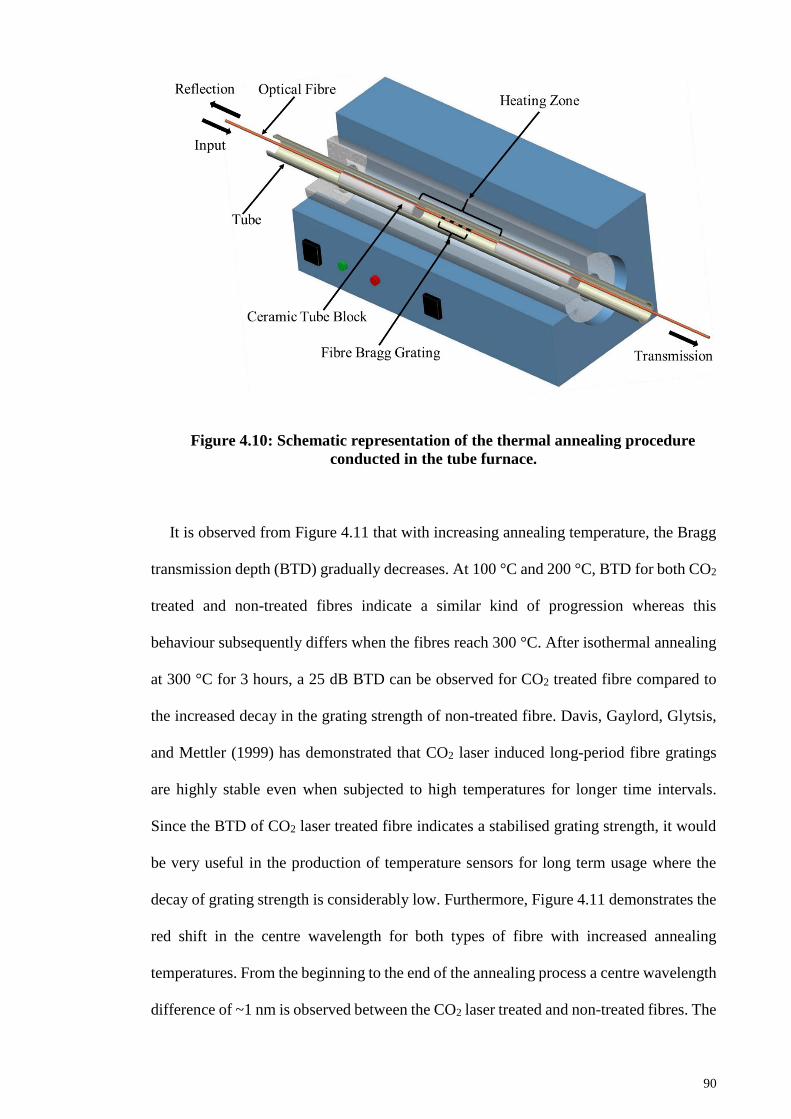
90
Figure 4.10: Schematic representation of the thermal annealing procedure
conducted in the tube furnace.
It is observed from Figure 4.11 that with increasing annealing temperature, the Bragg
transmission depth (BTD) gradually decreases. At 100 °C and 200 °C, BTD for both CO2
treated and non-treated fibres indicate a similar kind of progression whereas this
behaviour subsequently differs when the fibres reach 300 °C. After isothermal annealing
at 300 °C for 3 hours, a 25 dB BTD can be observed for CO2 treated fibre compared to
the increased decay in the grating strength of non-treated fibre. Davis, Gaylord, Glytsis,
and Mettler (1999) has demonstrated that CO2 laser induced long-period fibre gratings
are highly stable even when subjected to high temperatures for longer time intervals.
Since the BTD of CO2 laser treated fibre indicates a stabilised grating strength, it would
be very useful in the production of temperature sensors for long term usage where the
decay of grating strength is considerably low. Furthermore, Figure 4.11 demonstrates the
red shift in the centre wavelength for both types of fibre with increased annealing
temperatures. From the beginning to the end of the annealing process a centre wavelength
difference of ~1 nm is observed between the CO2 laser treated and non-treated fibres. The
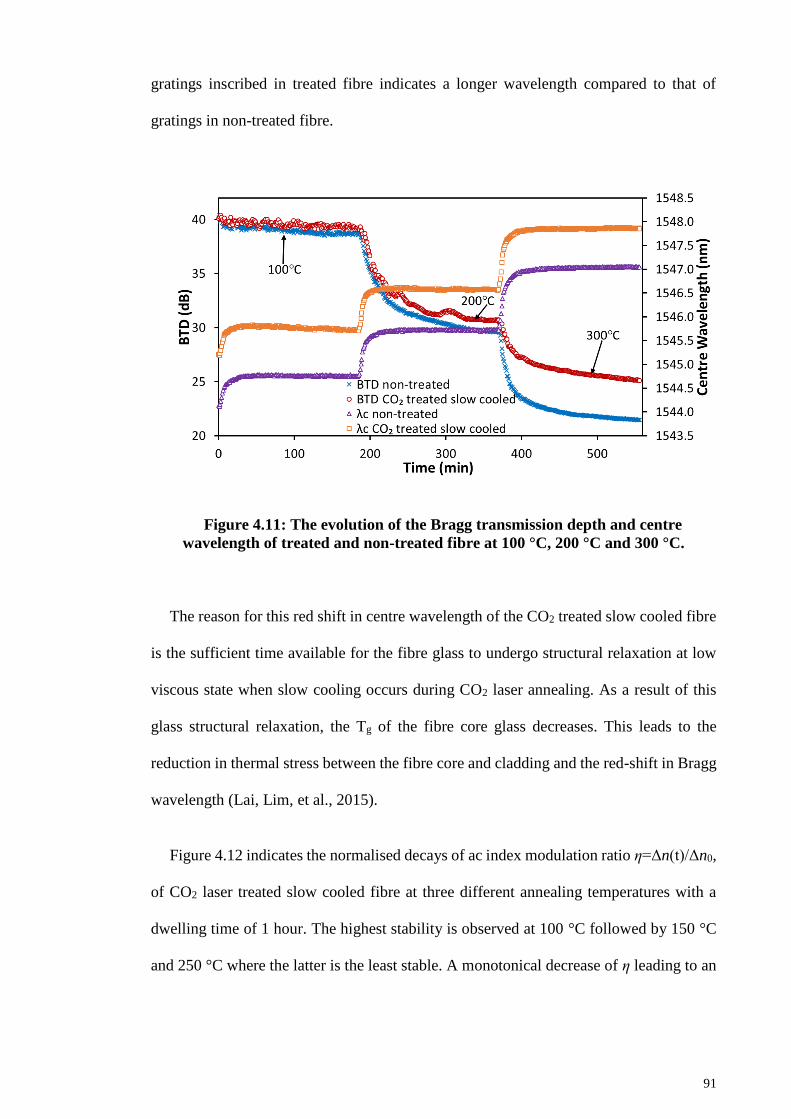
91
gratings inscribed in treated fibre indicates a longer wavelength compared to that of
gratings in non-treated fibre.
Figure 4.11: The evolution of the Bragg transmission depth and centre
wavelength of treated and non-treated fibre at 100 °C, 200 °C and 300 °C.
The reason for this red shift in centre wavelength of the CO2 treated slow cooled fibre
is the sufficient time available for the fibre glass to undergo structural relaxation at low
viscous state when slow cooling occurs during CO2 laser annealing. As a result of this
glass structural relaxation, the Tg of the fibre core glass decreases. This leads to the
reduction in thermal stress between the fibre core and cladding and the red-shift in Bragg
wavelength (Lai, Lim, et al., 2015).
Figure 4.12 indicates the normalised decays of ac index modulation ratio η=Δn(t)/Δn0,
of CO2 laser treated slow cooled fibre at three different annealing temperatures with a
dwelling time of 1 hour. The highest stability is observed at 100 °C followed by 150 °C
and 250 °C where the latter is the least stable. A monotonical decrease of η leading to an
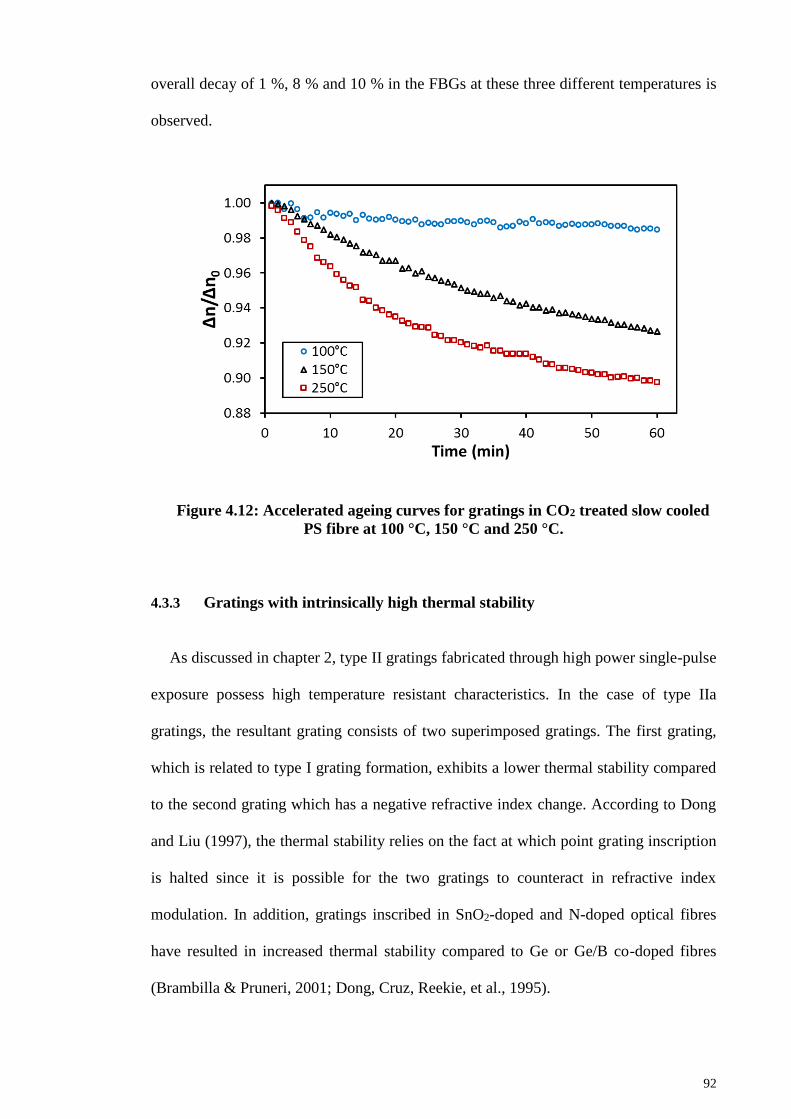
92
overall decay of 1 %, 8 % and 10 % in the FBGs at these three different temperatures is
observed.
Figure 4.12: Accelerated ageing curves for gratings in CO2 treated slow cooled
PS fibre at 100 °C, 150 °C and 250 °C.
4.3.3 Gratings with intrinsically high thermal stability
As discussed in chapter 2, type II gratings fabricated through high power single-pulse
exposure possess high temperature resistant characteristics. In the case of type IIa
gratings, the resultant grating consists of two superimposed gratings. The first grating,
which is related to type I grating formation, exhibits a lower thermal stability compared
to the second grating which has a negative refractive index change. According to Dong
and Liu (1997), the thermal stability relies on the fact at which point grating inscription
is halted since it is possible for the two gratings to counteract in refractive index
modulation. In addition, gratings inscribed in SnO2-doped and N-doped optical fibres
have resulted in increased thermal stability compared to Ge or Ge/B co-doped fibres
(Brambilla & Pruneri, 2001; Dong, Cruz, Reekie, et al., 1995).
93
4.3.4 Molecular water induced gratings
The main concept of molecular water induced FBGs relies on the Δnmod of the fibre
using molecular water (Zhang & Kahrizi, 2007). The disintegration of molecular water is
unfeasible over temperatures ranging from freezing point (0 ˚C) to melting temperature
of silica (Tomozawa, Kim, & Lou, 2001) owing to the strong bonds that exist in molecular
water. Therefore, the molecular water induced FBG possesses the capability of
withstanding much higher temperatures compared to the erasing temperature of the
general H2 loaded FBGs. In addition, at 1000 ˚C molecular water has a relatively low
diffusivity of DH2O=2×10⁻⁷ cm2/s in the silica fibre (Davis & Tomozawa, 1995). Hence,
the diffusion of molecular water from segments of high concentration to that of low
concentration will be extremely slow at high temperature.
It has also been discovered that the reflectivity and thermal sustainability of molecular
water induced FBGs rely on the Si-OH concentration in the core of the fibre (Zhang &
Kahrizi, 2007). The maximum operating temperature for these molecular water induced
high reflectivity FBGs has been recorded above 1100 ˚C. This has resulted in the
production of high reflectivity gratings with high temperature stability.
4.4 High temperature resistant gratings
FBGs with operating temperature limits beyond the standard telecommunication
conditions are vital in the production of fibre based temperature sensors. Emerging as a
strong opponent for conventional electrical and electronic sensors, FBGs possess a vast
number of advantages. For instance, their immunity to electro-magnetic interference, low
fabrication cost, high sensitivity and multiplexing capabilities (Kersey et al., 1997).
Hence FBG based temperature sensors have proved successful in certain sectors such as
94
oil and gas industry and microwave related applications where there is explosion hazard
or electromagnetic interference.
The type of the grating and the process of refractive index modification in a particular
grating are crucial factors when accommodating them as temperature sensors in high
temperature applications. The thermal properties of the commonly used type I FBGs
inscribed using UV irradiation have been comprehensively investigated in some research
studies (Chen & Herman, 2003; Erdogan et. al., 1994). Erdogan et. al. (1994) has
proposed a quantitative model for analysing the reduction of the UV-induced index
change with respect to the temperature to predict the lifetime of these FBGs. However,
apart from the thermally induced decay in the reflectivity of the conventional FBGs, a
complete erasure of the original seed grating (SG) has also been observed when exposed
to high temperature environments (400-500°C). These limitations restrict the deployment
of FBGs in many high temperature applications. In an effort to address this shortcoming,
various FBG based sensors have been fabricated using different approaches, such as the
process of hypersensitisation of the fibre (Åslund & Canning, 2000) and formation of
type II and type IIA gratings with exposure to femtosecond lasers (Archambault et al.,
1993a; Groothoff & Canning, 2004). In recent research studies, new types of thermally
resistant gratings with superior high temperature sustainability commonly known as
chemical composition gratings (CCG) and regenerated fibre Bragg gratings (RFBG)
(Bandyopadhyay, Canning, Biswas, Stevenson, & Dasgupta, 2011; Lindner et al., 2009;)
have been reported.
4.4.1 Chemical composition gratings (CCG)
Bragg gratings stable at high temperatures can be achieved by changing the fluorine
concentration of the fibre core periodically (Fokine, Sahlgren, & Stubbe, 1996). This
change in fluorine concentration results in a refractive index change. The thermal stability
95
of such a structure relies on the diffusing characteristics of fluorine. The alteration of the
fluorine concentration in the fibre core is carried out with reference to the chemical
equation below.
heat
Si OH F Si Si O Si HF (4.8)
Kirchof, Unger, Pissler, and Knappe (1995) has proposed this equation to explain the
decrease in the hydroxyl concentration in fluorine-doped silica. The reduction in hydroxyl
concentration is ascribed to the formation and diffusion of hydrogen fluoride. It is
predicted to be highly mobile compared to bound fluorine. Hydroxyl groups can be
introduced to the fibre core thermally or by exposing hydrogen loaded fibre to UV
irradiation. Fringed UV exposure leads to the formation of hydroxyl groups locally and
consists of the periodicity of the interference pattern which results in sub-micron
structures. Therefore, FBGs which consist of refractive index modulations due to a
variation in the chemical composition are known as chemical composition gratings.
According to Fokine (2002), thermal annealing of this particular type of gratings at high
temperature levels of 1000 and 1200 ˚C have shown significant enhancement in the
thermal stability compared to other different types of FBGs. However, a successive
investigation based on high temperature thermal annealing of type I gratings has
demonstrated that the existence of fluorine is not required to regenerate the index
modulation (Trpkovski, Kitcher, Baxter, Collins, & Wade, 2005). The CCGs have been
found in Er-doped fibre co-doped with Ge, Sn and Al as well. Moreover, the usual concept
of grating regeneration has been noticed in simple H2 loaded germanosilicate fibre (Zhang
& Kahrizi, 2007).
4.4.2 Regenerated fibre Bragg gratings (RFBG)
The fabrication process involves an isothermal annealing process of the SG until the
erasure of the grating properties which is followed by a grating regeneration. This new
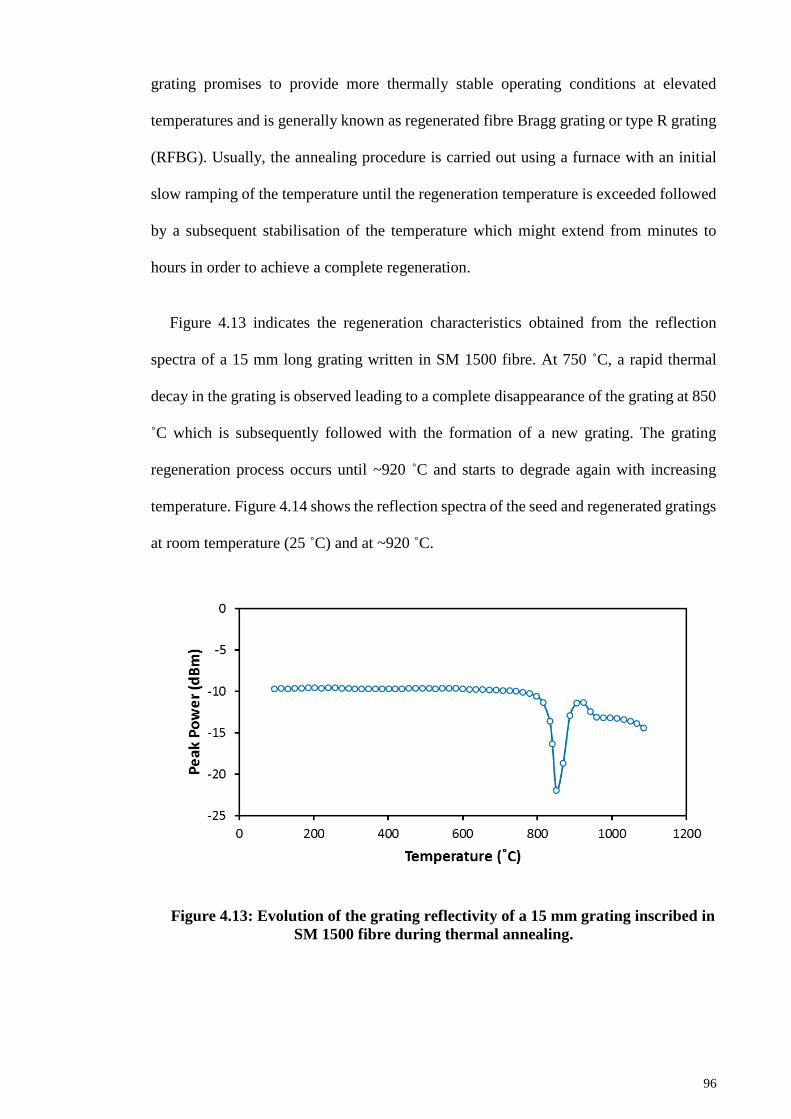
96
grating promises to provide more thermally stable operating conditions at elevated
temperatures and is generally known as regenerated fibre Bragg grating or type R grating
(RFBG). Usually, the annealing procedure is carried out using a furnace with an initial
slow ramping of the temperature until the regeneration temperature is exceeded followed
by a subsequent stabilisation of the temperature which might extend from minutes to
hours in order to achieve a complete regeneration.
Figure 4.13 indicates the regeneration characteristics obtained from the reflection
spectra of a 15 mm long grating written in SM 1500 fibre. At 750 ˚C, a rapid thermal
decay in the grating is observed leading to a complete disappearance of the grating at 850
˚C which is subsequently followed with the formation of a new grating. The grating
regeneration process occurs until ~920 ˚C and starts to degrade again with increasing
temperature. Figure 4.14 shows the reflection spectra of the seed and regenerated gratings
at room temperature (25 ˚C) and at ~920 ˚C.
Figure 4.13: Evolution of the grating reflectivity of a 15 mm grating inscribed in
SM 1500 fibre during thermal annealing.
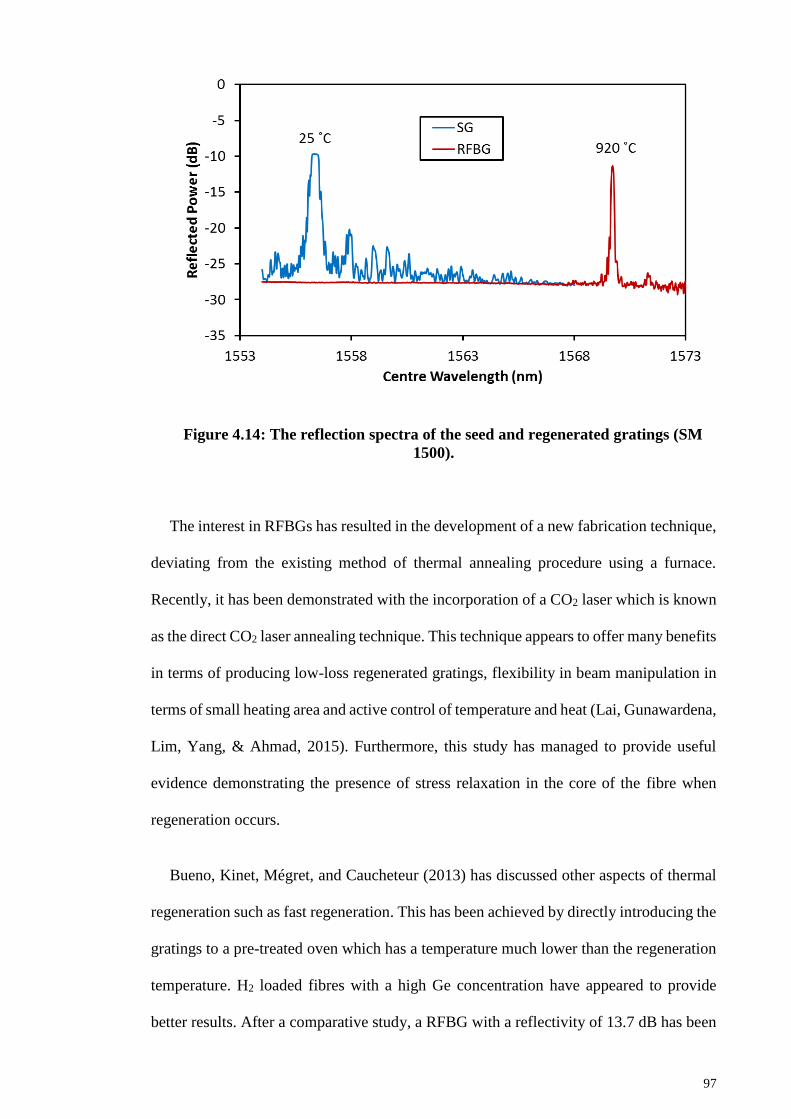
97
Figure 4.14: The reflection spectra of the seed and regenerated gratings (SM
1500).
The interest in RFBGs has resulted in the development of a new fabrication technique,
deviating from the existing method of thermal annealing procedure using a furnace.
Recently, it has been demonstrated with the incorporation of a CO2 laser which is known
as the direct CO2 laser annealing technique. This technique appears to offer many benefits
in terms of producing low-loss regenerated gratings, flexibility in beam manipulation in
terms of small heating area and active control of temperature and heat (Lai, Gunawardena,
Lim, Yang, & Ahmad, 2015). Furthermore, this study has managed to provide useful
evidence demonstrating the presence of stress relaxation in the core of the fibre when
regeneration occurs.
Bueno, Kinet, Mégret, and Caucheteur (2013) has discussed other aspects of thermal
regeneration such as fast regeneration. This has been achieved by directly introducing the
gratings to a pre-treated oven which has a temperature much lower than the regeneration
temperature. H2 loaded fibres with a high Ge concentration have appeared to provide
better results. After a comparative study, a RFBG with a reflectivity of 13.7 dB has been
98
created within a time span of only 31 s in Ge/B co-doped H2 loaded photosensitive fibre
exhibiting a time improvement factor of 110. Bandyopadhyay et al. (2008) has discovered
ultra-high temperature regenerated gratings in 193 nm written H2 loaded Ge/B co-doped
optical fibre. The gratings which are subjected to tension with a load of 85 g have been
annealed using an ultra-high temperature micro heater. The observation of Bragg
wavelength shift is assumed to be the response as a result of the tension which is applied
on the fibre. This is because the high temperature is near to the core-glass softening
temperature as well as the stress relief that occurs between core and cladding owing to
the variation in expansion coefficient.
Regeneration in Helium loaded Bragg gratings inscribed in germanosilicate fibre has
been reported by Cook, Shao, and Canning (2012). These gratings are able to withstand
temperatures exceeding 900 ˚C for more than 4 hours. The high temperature stability of
the He loaded gratings makes them strong competitors to H2 loaded gratings. The study
using this inert gas further justifies the model which describes that the regeneration
process is dominated by mechanical relaxation. According to this model, glass is
transformed to a more stable position via a different rate of relaxation. This is plausible
through high temperature and internal stress modification of the optical fibre.
In addition, non-hydrogen loaded regeneration (Lindner et al., 2009) opposed to the
hydrogen loaded (Bandyopadhyay et al., 2011) regeneration has also been investigated in
various research studies. Besides, regeneration characteristics of multiplexed RFBGs
suitable for high temperature measurements (Laffont, Cotillard, & Ferdinand, 2013) and
the presence of strain on the regeneration behaviour (Wang, Shao, Canning, & Cook,
2013) have also been investigated. However, many of these studies often concentrate on
RFBGs produced using Ge-doped optical fibres, whereas only a few research studies have
reported the existence of RFBGs in non-Ge-doped optical fibre (Yang et al., 2014).
99
Hence, these RFBGs are attracting the attention of the scientific community and are
increasing the need for further exploration.
4.5 Thermally activated gallosilicate fibre Bragg gratings
After the inscription procedure (as discussed in Chapter 3.3), Ga-doped fibre was
annealed in an oven at 80 °C for 8 hours in order to diffuse out the residue H2 in the fibre.
Subsequently, the thermal annealing process was carried out where the Ga-doped fibre
was placed inside a tube furnace (refer to Figure 4.10) and the SG was adjusted in such a
way that it was at the centre of the furnace. This allowed the temperature to be retained
uniformly along the entire length of the SG. The increment in the temperature during the
annealing process was achieved using an inbuilt program in the furnace, where the
temperature was increased uniformly at a rate of ~4.16 °C/min until the grating was
completely erased which was observed at 720 °C. Subsequently, the annealing
temperature was held constant at this temperature for ~ 2 h and 45 min where a new
grating appeared and was ultimately stabilised. The reflection spectra were monitored and
recorded every minute using the procedure discussed in Chapter 3. The grating was
subsequently cooled to room temperature and left for 24 hours prior to the thermal
calibration process. The calibration process of the regenerated gallosilicate grating was
carried out by placing the grating inside the tube furnace and recording the reflection
spectra using an automated system in order to calculate the wavelength shift in accordance
with the variation in temperature from 25 °C to 750 °C during heating and vice versa
during cooling. This procedure was repeated for two more cycles in order to acquire
accurate and reliable data on the temperature sensitivity of the RFBG. Furthermore, the
centre wavelength stability of the RFBG was monitored over a time period of 8 hours
where the temperature was dwelled at 720 °C throughout the investigation.
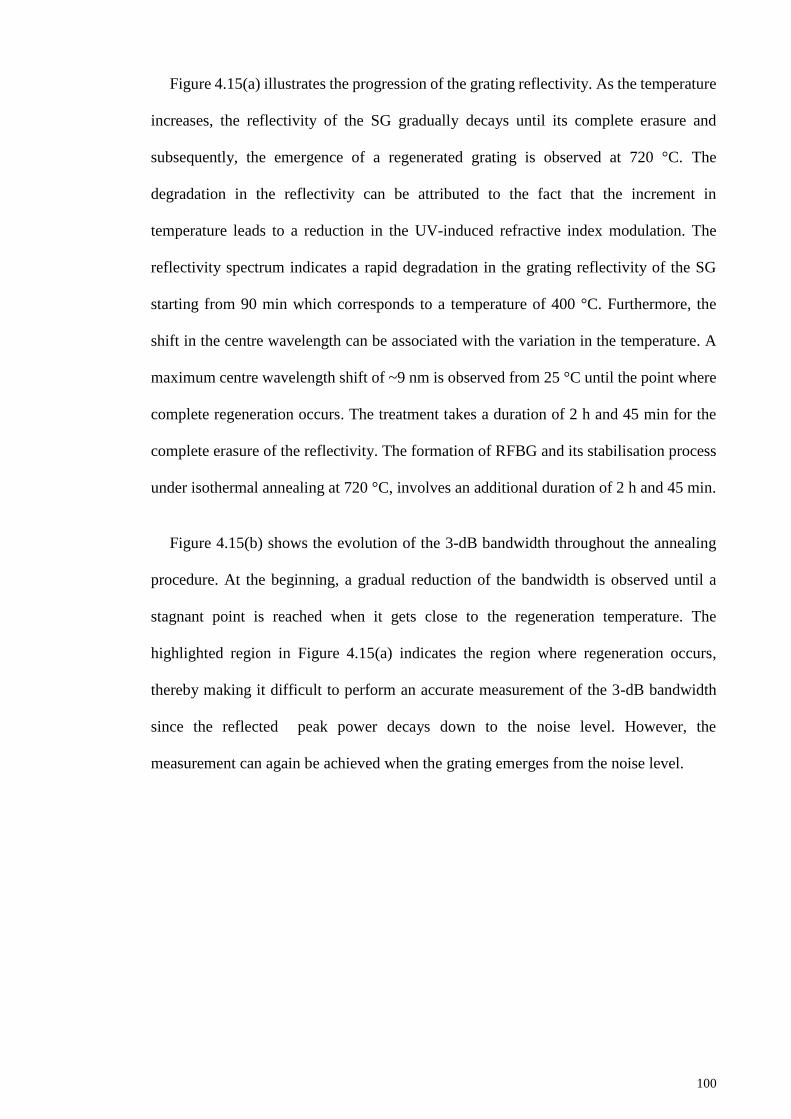
100
Figure 4.15(a) illustrates the progression of the grating reflectivity. As the temperature
increases, the reflectivity of the SG gradually decays until its complete erasure and
subsequently, the emergence of a regenerated grating is observed at 720 °C. The
degradation in the reflectivity can be attributed to the fact that the increment in
temperature leads to a reduction in the UV-induced refractive index modulation. The
reflectivity spectrum indicates a rapid degradation in the grating reflectivity of the SG
starting from 90 min which corresponds to a temperature of 400 °C. Furthermore, the
shift in the centre wavelength can be associated with the variation in the temperature. A
maximum centre wavelength shift of ~9 nm is observed from 25 °C until the point where
complete regeneration occurs. The treatment takes a duration of 2 h and 45 min for the
complete erasure of the reflectivity. The formation of RFBG and its stabilisation process
under isothermal annealing at 720 °C, involves an additional duration of 2 h and 45 min.
Figure 4.15(b) shows the evolution of the 3-dB bandwidth throughout the annealing
procedure. At the beginning, a gradual reduction of the bandwidth is observed until a
stagnant point is reached when it gets close to the regeneration temperature. The
highlighted region in Figure 4.15(a) indicates the region where regeneration occurs,
thereby making it difficult to perform an accurate measurement of the 3-dB bandwidth
since the reflected peak power decays down to the noise level. However, the
measurement can again be achieved when the grating emerges from the noise level.
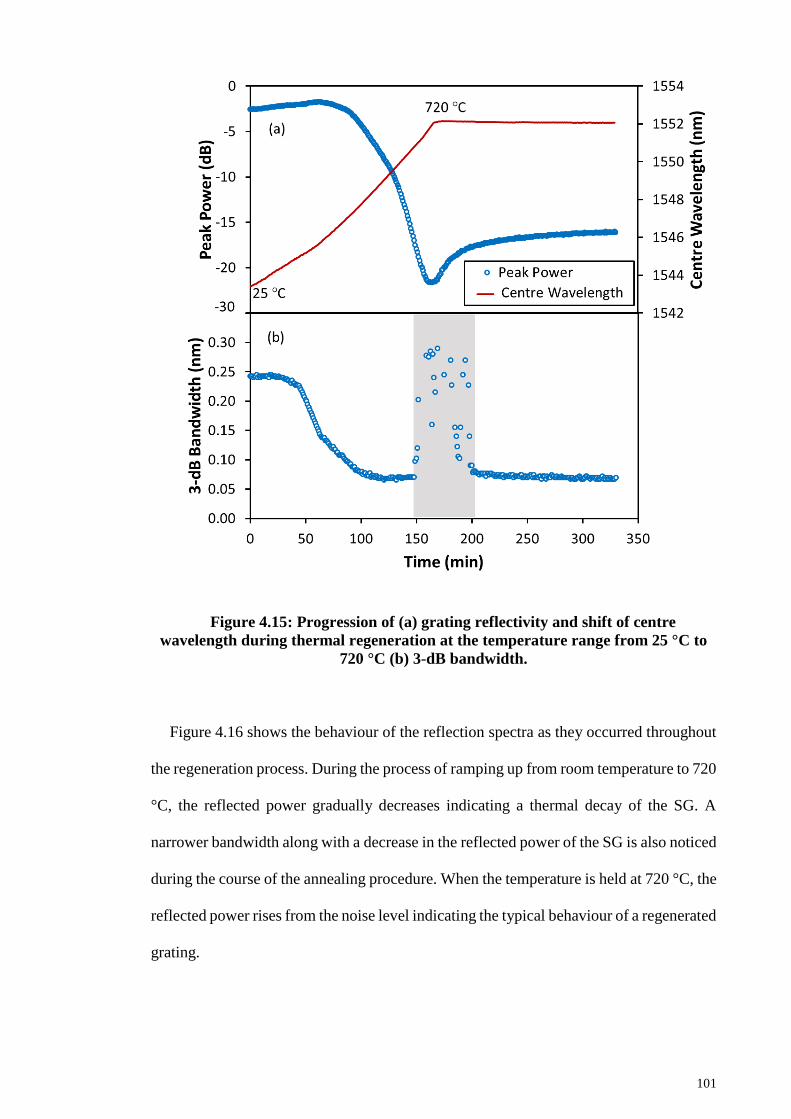
101
Figure 4.15: Progression of (a) grating reflectivity and shift of centre
wavelength during thermal regeneration at the temperature range from 25 °C to
720 °C (b) 3-dB bandwidth.
Figure 4.16 shows the behaviour of the reflection spectra as they occurred throughout
the regeneration process. During the process of ramping up from room temperature to 720
°C, the reflected power gradually decreases indicating a thermal decay of the SG. A
narrower bandwidth along with a decrease in the reflected power of the SG is also noticed
during the course of the annealing procedure. When the temperature is held at 720 °C, the
reflected power rises from the noise level indicating the typical behaviour of a regenerated
grating.
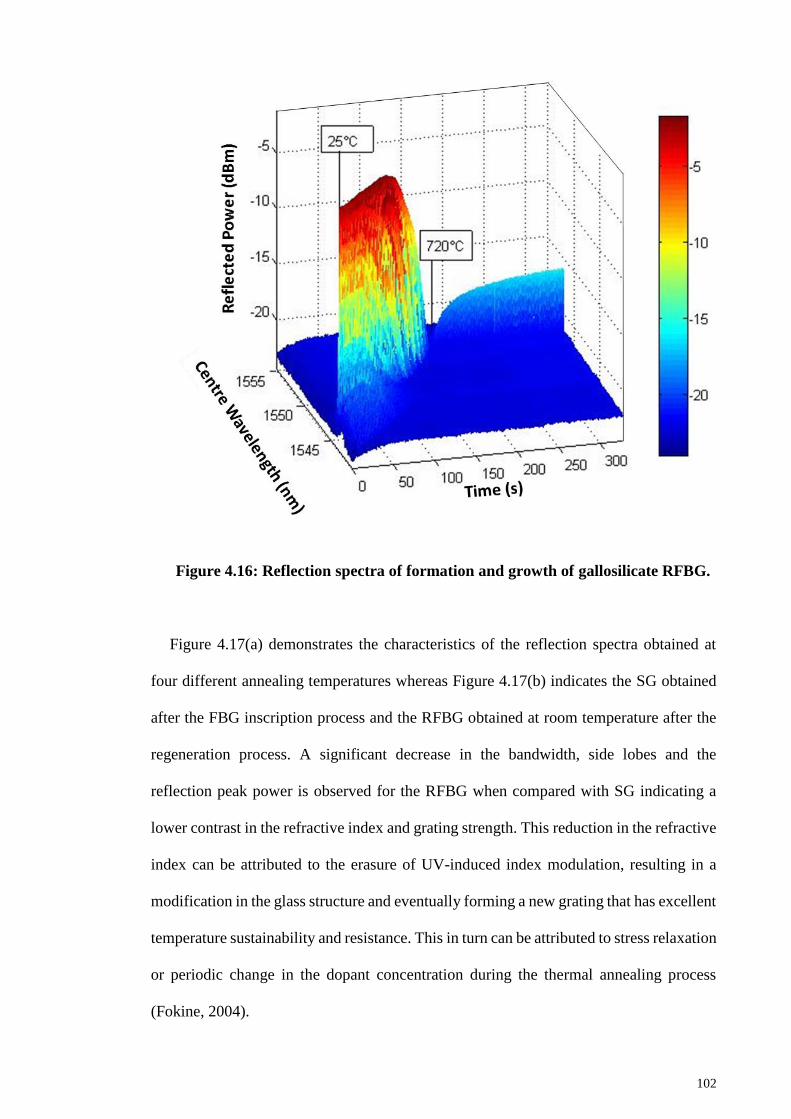
102
Figure 4.16: Reflection spectra of formation and growth of gallosilicate RFBG.
Figure 4.17(a) demonstrates the characteristics of the reflection spectra obtained at
four different annealing temperatures whereas Figure 4.17(b) indicates the SG obtained
after the FBG inscription process and the RFBG obtained at room temperature after the
regeneration process. A significant decrease in the bandwidth, side lobes and the
reflection peak power is observed for the RFBG when compared with SG indicating a
lower contrast in the refractive index and grating strength. This reduction in the refractive
index can be attributed to the erasure of UV-induced index modulation, resulting in a
modification in the glass structure and eventually forming a new grating that has excellent
temperature sustainability and resistance. This in turn can be attributed to stress relaxation
or periodic change in the dopant concentration during the thermal annealing process
(Fokine, 2004).
103
Figure 4.17: (a) Reflection spectra of the grating during the thermal annealing
process at 50 °C, 200 °C, 400 °C and 600 °C (b) Reflection spectra of the seed and
regenerated gratings at 25 °C.
The relaxation of UV-induced stress owing to thermal annealing in Ge-doped fibre
through thermal annealing was first reported by Dürr et al. (2005). During the
regeneration process, the UV-induced stress in the grating is reduced by thermal
annealing to a minimum level at regeneration temperature. This is followed by the
structural rearrangement of the molecules in the glass matrix where a new grating
structure is slowly formed. Further research is being carried out to deduce the chemical
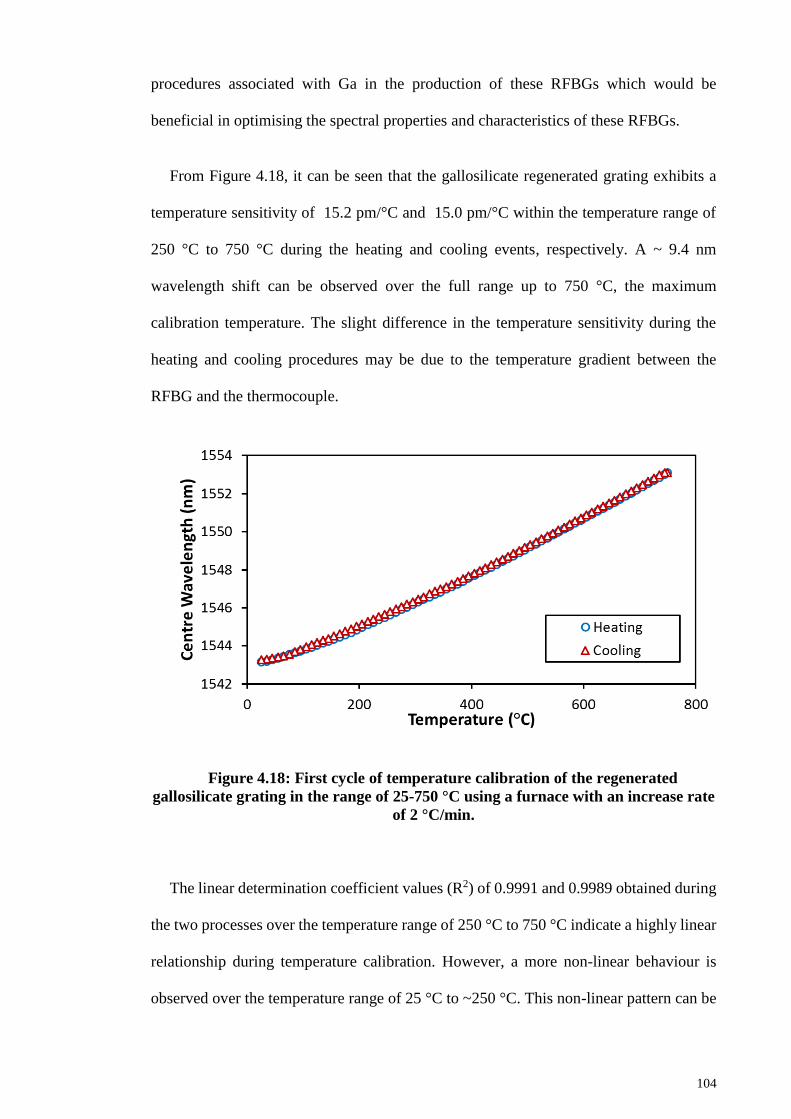
104
procedures associated with Ga in the production of these RFBGs which would be
beneficial in optimising the spectral properties and characteristics of these RFBGs.
From Figure 4.18, it can be seen that the gallosilicate regenerated grating exhibits a
temperature sensitivity of 15.2 pm/°C and 15.0 pm/°C within the temperature range of
250 °C to 750 °C during the heating and cooling events, respectively. A ~ 9.4 nm
wavelength shift can be observed over the full range up to 750 °C, the maximum
calibration temperature. The slight difference in the temperature sensitivity during the
heating and cooling procedures may be due to the temperature gradient between the
RFBG and the thermocouple.
Figure 4.18: First cycle of temperature calibration of the regenerated
gallosilicate grating in the range of 25-750 °C using a furnace with an increase rate
of 2 °C/min.
The linear determination coefficient values (R2) of 0.9991 and 0.9989 obtained during
the two processes over the temperature range of 250 °C to 750 °C indicate a highly linear
relationship during temperature calibration. However, a more non-linear behaviour is
observed over the temperature range of 25 °C to ~250 °C. This non-linear pattern can be
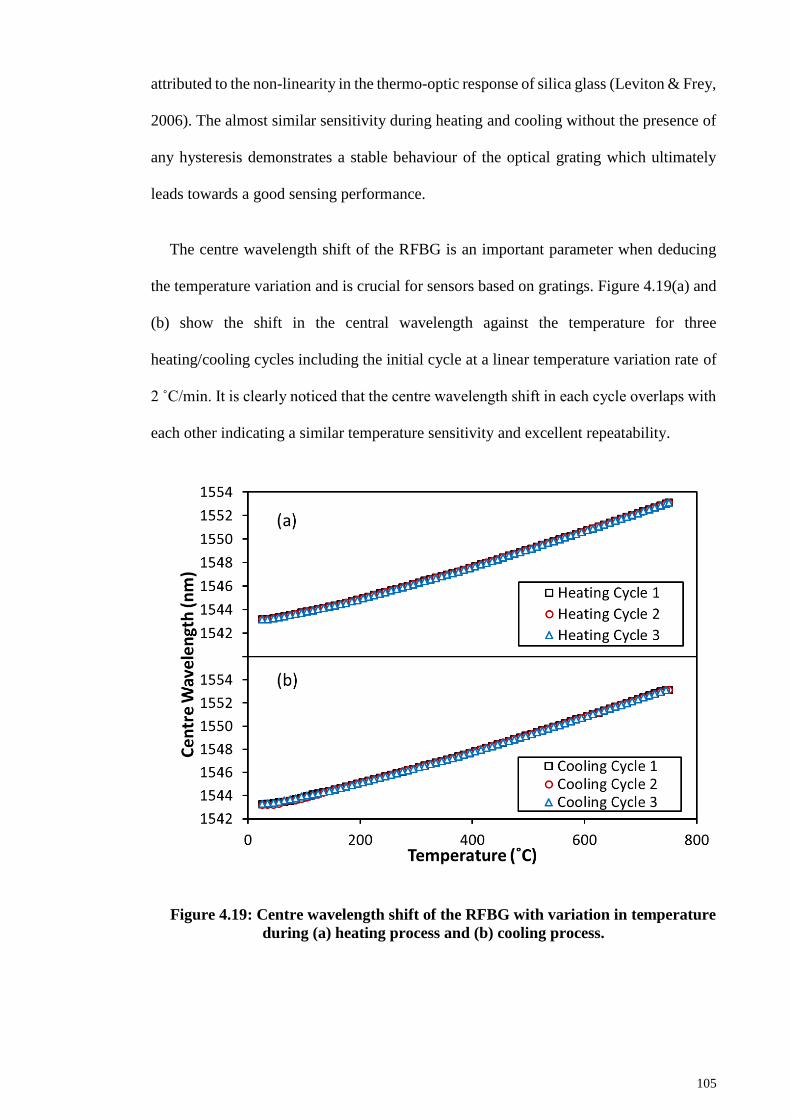
105
attributed to the non-linearity in the thermo-optic response of silica glass (Leviton & Frey,
2006). The almost similar sensitivity during heating and cooling without the presence of
any hysteresis demonstrates a stable behaviour of the optical grating which ultimately
leads towards a good sensing performance.
The centre wavelength shift of the RFBG is an important parameter when deducing
the temperature variation and is crucial for sensors based on gratings. Figure 4.19(a) and
(b) show the shift in the central wavelength against the temperature for three
heating/cooling cycles including the initial cycle at a linear temperature variation rate of
2 ˚C/min. It is clearly noticed that the centre wavelength shift in each cycle overlaps with
each other indicating a similar temperature sensitivity and excellent repeatability.
Figure 4.19: Centre wavelength shift of the RFBG with variation in temperature
during (a) heating process and (b) cooling process.
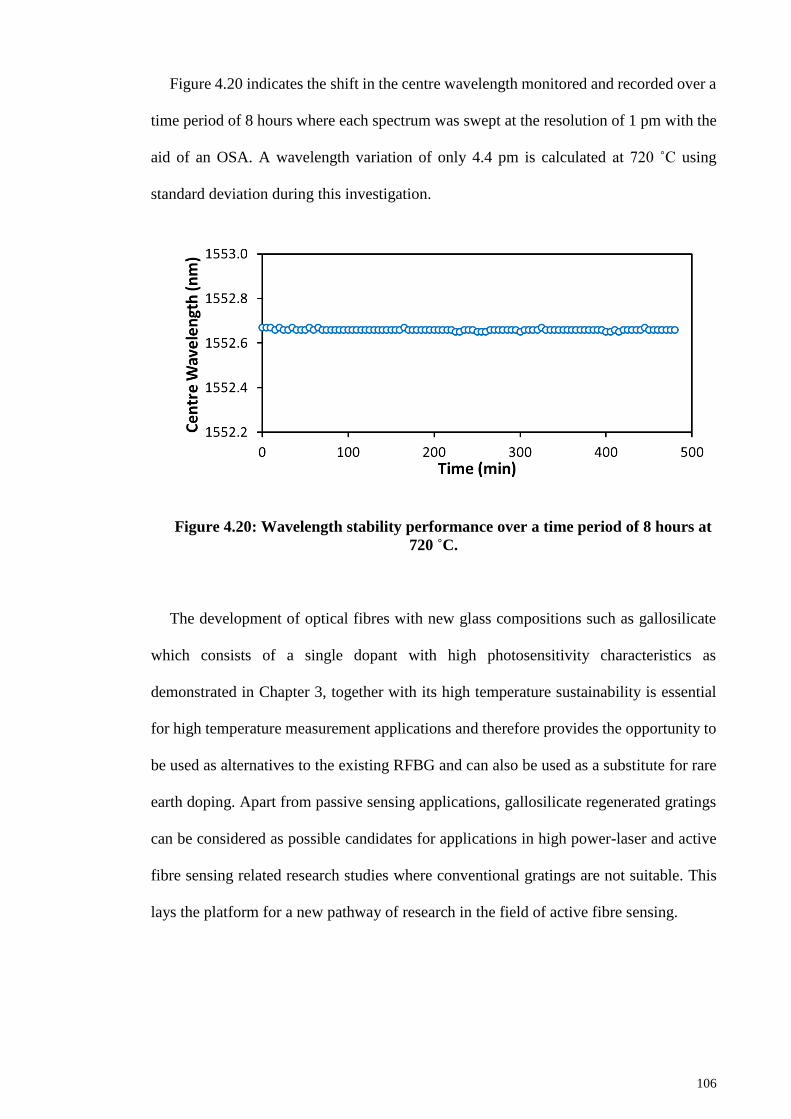
106
Figure 4.20 indicates the shift in the centre wavelength monitored and recorded over a
time period of 8 hours where each spectrum was swept at the resolution of 1 pm with the
aid of an OSA. A wavelength variation of only 4.4 pm is calculated at 720 ˚C using
standard deviation during this investigation.
Figure 4.20: Wavelength stability performance over a time period of 8 hours at
720 ˚C.
The development of optical fibres with new glass compositions such as gallosilicate
which consists of a single dopant with high photosensitivity characteristics as
demonstrated in Chapter 3, together with its high temperature sustainability is essential
for high temperature measurement applications and therefore provides the opportunity to
be used as alternatives to the existing RFBG and can also be used as a substitute for rare
earth doping. Apart from passive sensing applications, gallosilicate regenerated gratings
can be considered as possible candidates for applications in high power-laser and active
fibre sensing related research studies where conventional gratings are not suitable. This
lays the platform for a new pathway of research in the field of active fibre sensing.
107
4.6 Summary
This chapter has focused on an investigation of the thermal stability of FBGs.
Discussions of various decay models were included to provide comprehensive
information to the reader. Additionally, the characteristic behaviour of FBGs during
thermal annealing and different methods to enhance the thermal stability of a particular
grating were discussed. CO2 laser annealing was introduced as a technique to enhance
thermal stability of an FBG. Numerous Bragg gratings capable of withstanding high
temperatures were introduced and discussed. A thorough investigation on the
regeneration properties of gallosilicate fibre was also carried out. Repetitive experiments
to investigate the heating and cooling characteristics of gallosilicate fibre during the
calibration of temperature sensitivity were performed and their outcomes analysed.
108
CHAPTER 5: THERMALLY ENDURING GRATINGS BASED ON
THERMALLY INDUCED REVERSIBLE EFFECT
The main focus of this chapter is to emphasise the significantly high thermally induced
reversible effect present in a grating as short as 10 mm inscribed in hydrogen (H2) loaded
Ge/B co-doped photosensitive fibre with 193 nm laser irradiation. A comprehensive
investigation is carried out on this effect by performing both continuous and stepwise
annealing procedures to demonstrate the grating decay behaviour in the demarcation
energy domain, Ed and predict the operating lifetime of the grating. Further inspections
are conducted on other types of fibre at various annealing rates to investigate the presence
of the thermally induced reversible effect and to characterise the grating decay in the
demarcation energy domain.
5.1 Thermally induced reversible effect
Many applications require the use of a grating with longer lifetime and good thermal
stability for efficient functioning. In telecommunication standards, the grating based
devices are required to have an operational lifetime of 25 years and function over a
temperature range from -25 to +80 °C. It has been discovered by Erdogan et al. (1994)
and Poumellec (1998) that pre-annealing an FBG wipes out a segment of the index change
which has an irreversible decay ranging in the operating life span of the grating retaining
simply the stabilised segment of the index change. Nevertheless, it is realised that
temperature variation in a pre-annealed grating causes the Bragg wavelength to be shifted
(Douay et al., 1993). This might be due to the fact that ΔλB is strongly influenced by the
thermal expansion coefficients (Yoffe, Krug, Ouellette, & Thorncraft, 1995).
Reversible and irreversible changes in the reflectivity of a grating with increasing
temperature have been observed by Razafimahatratra et al. (2000) in Ge, B and Sn co-
109
doped silica fibre. Temperature induced isochronal and isothermal decays in Bragg
gratings inscribed using CW exposure have been investigated. In the process, it has been
noticed that the isochronal step decays aid in predicting the isothermal decays through
consideration of reversible alterations in the reflectivity of a grating which occurs as a
result of varying temperature. This is because the temperature variations occur in a
stepwise process so that more control can be gained over the experiment. The accelerated
ageing model discussed in Chapter 4 has been useful in sampling the initial dispersal of
trapped site energies during isochronal annealing. Based on this observation, it is
demonstrated that the initial dispersal for both weak and strong gratings are similar.
Hidayat et al. (2001) has reported the existence of reversible changes in highly Ge-
doped fibres. However, this effect is not visible in H2 loaded fibres. These changes have
been induced by varying the temperature of the grating over the range of 77 K < T < 573
K and several factors responsible for the reversible changes have been investigated. The
increased fraction of the guided optical power which travels through the fibre core due to
heating of the fibre with reference to the dependence of overlap integral with temperature
is considered as a possible explanation for the thermally induced reversible effect in the
grating reflectivity (Hidayat et al., 2001). According to Hidayat et al. (2001) difference
between core and cladding in dn/dT due to the chemical composition, the reliance of
residual stress on temperature or due to UV-induced changes can be listed as the probable
reasons for the reversible changes.
Gnusin, Vasil'ev, Medvedkov, and Dianov (2010), has reported the presence of
reversible changes in grating reflectivity induced by strain and temperature in various
types of FBGs. Based on the study, the reversible changes of type I, type IIa and H2 loaded
type I gratings have been investigated at elevated temperatures. An increase in the grating
reflectivity by 3.1 % and 3.0 % has been observed for gratings with type I and type IIa
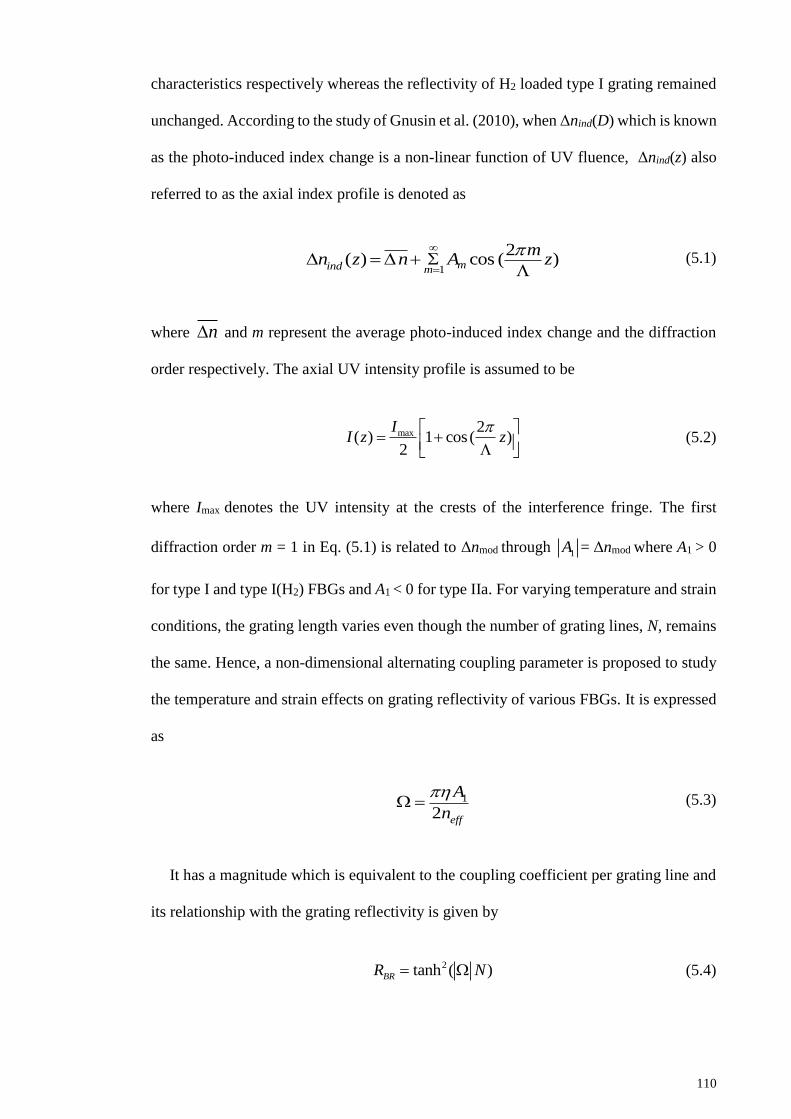
110
characteristics respectively whereas the reflectivity of H2 loaded type I grating remained
unchanged. According to the study of Gnusin et al. (2010), when Δnind(D) which is known
as the photo-induced index change is a non-linear function of UV fluence, Δnind(z) also
referred to as the axial index profile is denoted as
1
2( ) cos ( )mind m
mn z n A z
(5.1)
where n and m represent the average photo-induced index change and the diffraction
order respectively. The axial UV intensity profile is assumed to be
max 2( ) 1 cos ( )
2
II z z
(5.2)
where Imax denotes the UV intensity at the crests of the interference fringe. The first
diffraction order m = 1 in Eq. (5.1) is related to Δnmod through 1A = Δnmod where A1 > 0
for type I and type I(H2) FBGs and A1 < 0 for type IIa. For varying temperature and strain
conditions, the grating length varies even though the number of grating lines, N, remains
the same. Hence, a non-dimensional alternating coupling parameter is proposed to study
the temperature and strain effects on grating reflectivity of various FBGs. It is expressed
as
1
2eff
A
n
(5.3)
It has a magnitude which is equivalent to the coupling coefficient per grating line and
its relationship with the grating reflectivity is given by
2tanh ( )BRR N (5.4)
111
The importance of the coupling parameter has been highlighted and its relative changes
as a function of temperature variation have been demonstrated. The effect of UV fluence
and the concentration of Ge present in the core of the fibre on the reversible changes of
the coupling parameter, Ω has been thoroughly analysed and it has been found that in
relation to the UV fluence, reversible changes in the grating reflectivity are significant
even at UV fluences as low as 1 kJ/cm2. Furthermore, the initial increase in dΩ/dT for
type I and IIa FBGs is correlated with the germanium concentration in the core of the
fibre. Moreover, the results obtained to date suggest that the photo-induced
transformations of defect centres which occur in the germanosilica glass network are
responsible for the reversible changes at low fluence levels.
The thermo-optical coefficient undergoes spatial modulation during exposure of a
germano-silicate glass to a UV fringe pattern. It is believed that this phenomenon has a
considerable effect in the study of temperature induced reversible changes in refractive
index modulation. The defects produced during the UV exposure, excluding Ge(1) and
Ge(2) (Tsai, Williams, & Friebele, 1998) are generally presumed to be confined. This
results in a spatial modulation of the UV-induced absorption spectrum along the fibre
core (Leconte et al., 1997). An increase in the glass temperature leads to a reversible
change of the absorption bands associated with defects, leading to a reversible alteration
in the Δnmod. Therefore, much effort has been directed towards testing these theories
including the evolution of reversible changes of the index modulation with varying
temperature and correlation with UV absorption and structural changes.
5.2 Origins of temperature reliance of grating reflectivity
5.2.1 Reliance of residual stress on temperature
Residual elastic stress and strain including frozen-in inelastic strains are present in
many optical fibres. The thermal history, frozen-in viscoelasticity and UV-induced
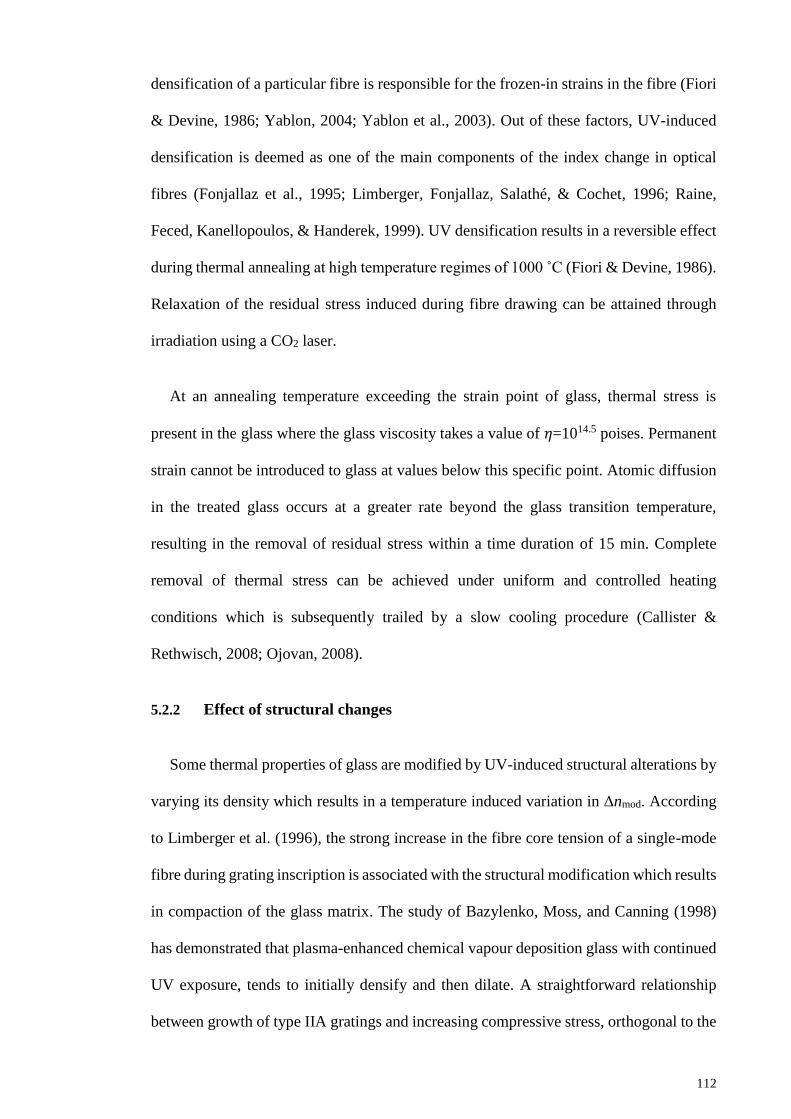
112
densification of a particular fibre is responsible for the frozen-in strains in the fibre (Fiori
& Devine, 1986; Yablon, 2004; Yablon et al., 2003). Out of these factors, UV-induced
densification is deemed as one of the main components of the index change in optical
fibres (Fonjallaz et al., 1995; Limberger, Fonjallaz, Salathé, & Cochet, 1996; Raine,
Feced, Kanellopoulos, & Handerek, 1999). UV densification results in a reversible effect
during thermal annealing at high temperature regimes of 1000 ˚C (Fiori & Devine, 1986).
Relaxation of the residual stress induced during fibre drawing can be attained through
irradiation using a CO2 laser.
At an annealing temperature exceeding the strain point of glass, thermal stress is
present in the glass where the glass viscosity takes a value of 𝜂=1014.5 poises. Permanent
strain cannot be introduced to glass at values below this specific point. Atomic diffusion
in the treated glass occurs at a greater rate beyond the glass transition temperature,
resulting in the removal of residual stress within a time duration of 15 min. Complete
removal of thermal stress can be achieved under uniform and controlled heating
conditions which is subsequently trailed by a slow cooling procedure (Callister &
Rethwisch, 2008; Ojovan, 2008).
5.2.2 Effect of structural changes
Some thermal properties of glass are modified by UV-induced structural alterations by
varying its density which results in a temperature induced variation in Δnmod. According
to Limberger et al. (1996), the strong increase in the fibre core tension of a single-mode
fibre during grating inscription is associated with the structural modification which results
in compaction of the glass matrix. The study of Bazylenko, Moss, and Canning (1998)
has demonstrated that plasma-enhanced chemical vapour deposition glass with continued
UV exposure, tends to initially densify and then dilate. A straightforward relationship
between growth of type IIA gratings and increasing compressive stress, orthogonal to the
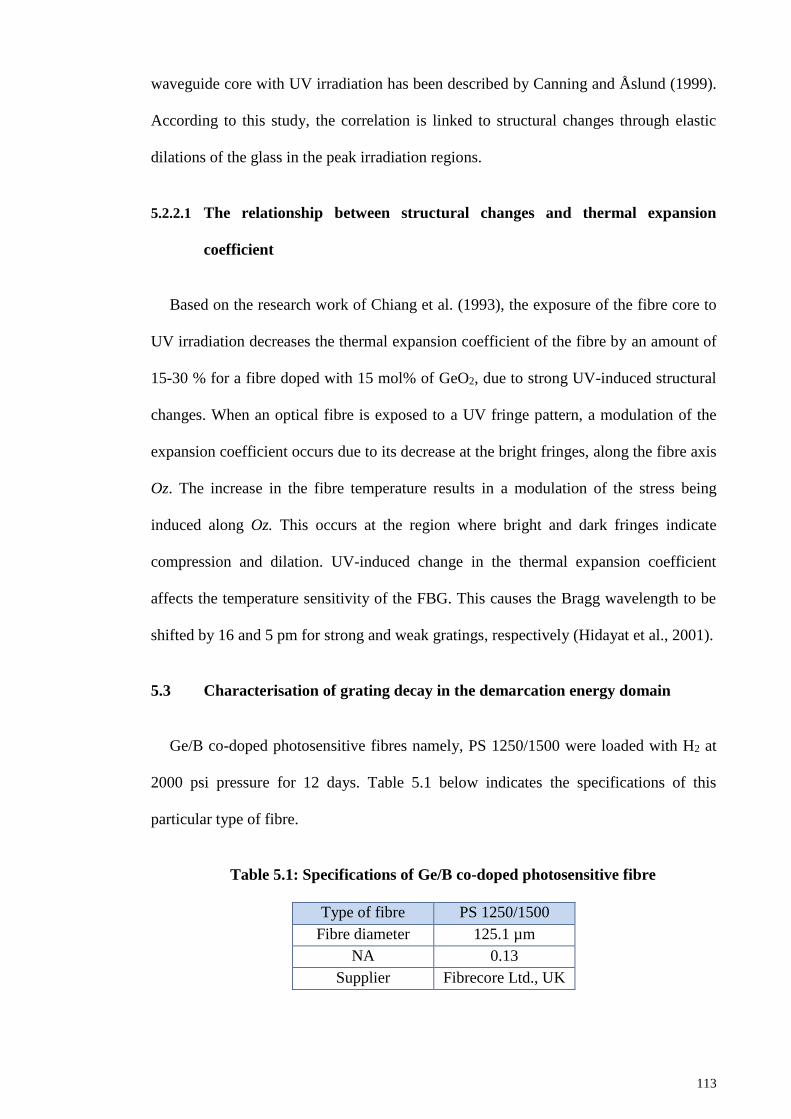
113
waveguide core with UV irradiation has been described by Canning and Åslund (1999).
According to this study, the correlation is linked to structural changes through elastic
dilations of the glass in the peak irradiation regions.
5.2.2.1 The relationship between structural changes and thermal expansion
coefficient
Based on the research work of Chiang et al. (1993), the exposure of the fibre core to
UV irradiation decreases the thermal expansion coefficient of the fibre by an amount of
15-30 % for a fibre doped with 15 mol% of GeO2, due to strong UV-induced structural
changes. When an optical fibre is exposed to a UV fringe pattern, a modulation of the
expansion coefficient occurs due to its decrease at the bright fringes, along the fibre axis
Oz. The increase in the fibre temperature results in a modulation of the stress being
induced along Oz. This occurs at the region where bright and dark fringes indicate
compression and dilation. UV-induced change in the thermal expansion coefficient
affects the temperature sensitivity of the FBG. This causes the Bragg wavelength to be
shifted by 16 and 5 pm for strong and weak gratings, respectively (Hidayat et al., 2001).
5.3 Characterisation of grating decay in the demarcation energy domain
Ge/B co-doped photosensitive fibres namely, PS 1250/1500 were loaded with H2 at
2000 psi pressure for 12 days. Table 5.1 below indicates the specifications of this
particular type of fibre.
Table 5.1: Specifications of Ge/B co-doped photosensitive fibre
Type of fibre PS 1250/1500
Fibre diameter 125.1 µm
NA 0.13
Supplier Fibrecore Ltd., UK
114
Afterwards, 10 mm long gratings were inscribed in them using ArF excimer laser-
phase-mask technique. Recording and monitoring of the transmission spectra were
carried out in a similar manner as discussed in Chapter 3. A pulse energy of 7 mJ and a
repetition rate of 2 Hz consisting of a single pulse fluence of 560 mJ/cm2 were used to
fabricate FBGs with a peak reflectivity of ~99.98 %. Subsequently, the gratings were
inserted to an oven and annealed at 80 ˚C for 24 hours and kept at room temperature for
10 days in order to remove the residue H2. After out-diffusion of H2, the gratings were
placed in a tube furnace (see Figure 4.10) and the thermal annealing procedure was
commenced, where the gratings were subjected to a continuous ramping rate of 3 °C/min
starting from room temperature (25 °C) until 550 °C. Recording of the transmission
spectra was carried out on a one minute interval basis. As discussed in Chapter 4, the
thermal decay at each annealing temperature experienced by the grating was represented
using NICC, η, since ICC depicts the grating strength and is associated with the UV-
induced refractive index change.
To verify the accuracy of the experiment, a separate stepwise annealing process was
also carried out and a detailed set of data was obtained. This particular experiment was
conducted under similar conditions to the continuous annealing process initiating from
25 ˚C followed by 125 °C, 225 °C, 325 °C and 425 °C in a stepwise process. With the aid
of an inbuilt program in the furnace, the temperature was dwelled on for a time duration
of 2 hours at each temperature. Afterwards, these treated gratings which underwent the
stepwise annealing process were subjected to an isothermal annealing procedure for 8
hours at 200 ˚C to explore their thermal stability. This procedure was repeated at 300 ˚C
and 400 ˚ C.
Figure 5.1 illustrates the growth of the index change of H2 loaded Ge/B co-doped
photosensitive fibre using an ArF excimer laser. A ~99.98 % grating reflectivity with an
115
index change of ~1.3×10⁻⁴ is achieved within ~96 s. Figure 5.2 indicates the transmission
spectrum of the grating produced.
Figure 5.1: Rise of the refractive index change with increasing time during
grating fabrication.
Figure 5.2: Transmission spectrum of the 10 mm long FBG inscribed in PS
1250/1500 fibre.
It is presumed that the activation energy of the thermodynamically unstable traps is
broadly distributed when predicting the operational lifetime of the grating. Grating
fabrication is responsible for this effect. The experimental support proving this can be
found in (Pal, Mandal, Sun, & Grattan, 2003). Hence, the degree of ageing of an FBG at
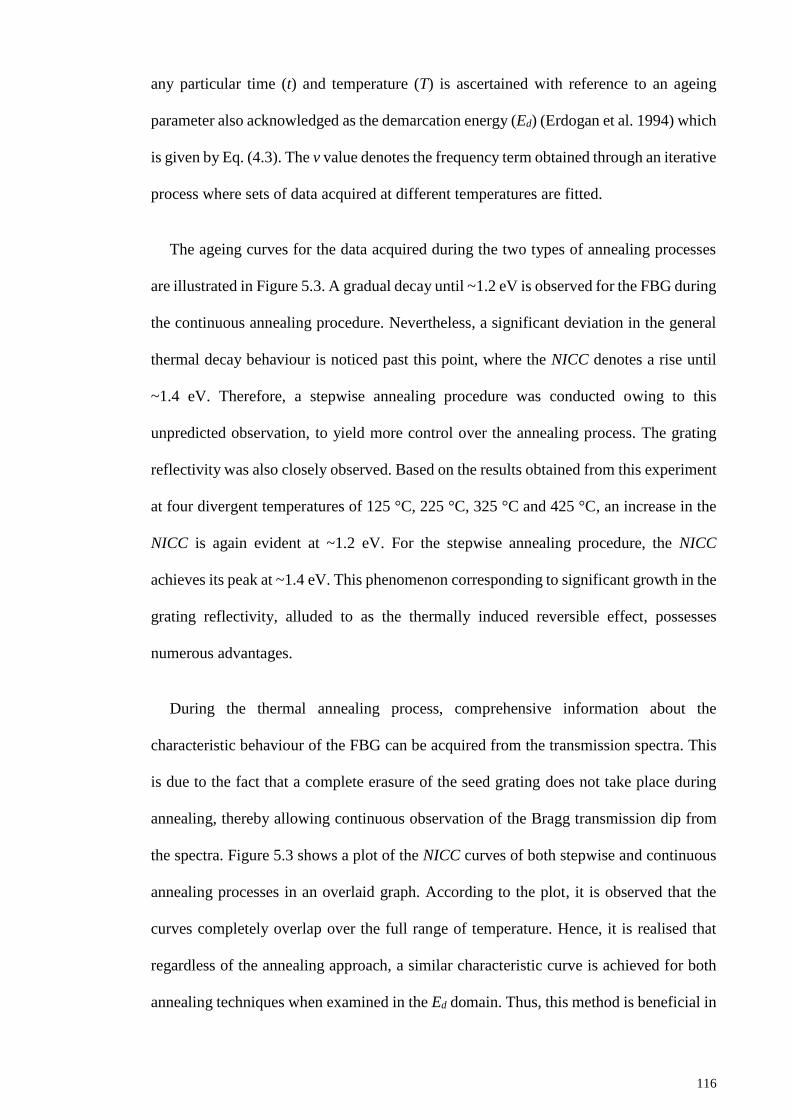
116
any particular time (t) and temperature (T) is ascertained with reference to an ageing
parameter also acknowledged as the demarcation energy (Ed) (Erdogan et al. 1994) which
is given by Eq. (4.3). The v value denotes the frequency term obtained through an iterative
process where sets of data acquired at different temperatures are fitted.
The ageing curves for the data acquired during the two types of annealing processes
are illustrated in Figure 5.3. A gradual decay until ~1.2 eV is observed for the FBG during
the continuous annealing procedure. Nevertheless, a significant deviation in the general
thermal decay behaviour is noticed past this point, where the NICC denotes a rise until
~1.4 eV. Therefore, a stepwise annealing procedure was conducted owing to this
unpredicted observation, to yield more control over the annealing process. The grating
reflectivity was also closely observed. Based on the results obtained from this experiment
at four divergent temperatures of 125 °C, 225 °C, 325 °C and 425 °C, an increase in the
NICC is again evident at ~1.2 eV. For the stepwise annealing procedure, the NICC
achieves its peak at ~1.4 eV. This phenomenon corresponding to significant growth in the
grating reflectivity, alluded to as the thermally induced reversible effect, possesses
numerous advantages.
During the thermal annealing process, comprehensive information about the
characteristic behaviour of the FBG can be acquired from the transmission spectra. This
is due to the fact that a complete erasure of the seed grating does not take place during
annealing, thereby allowing continuous observation of the Bragg transmission dip from
the spectra. Figure 5.3 shows a plot of the NICC curves of both stepwise and continuous
annealing processes in an overlaid graph. According to the plot, it is observed that the
curves completely overlap over the full range of temperature. Hence, it is realised that
regardless of the annealing approach, a similar characteristic curve is achieved for both
annealing techniques when examined in the Ed domain. Thus, this method is beneficial in
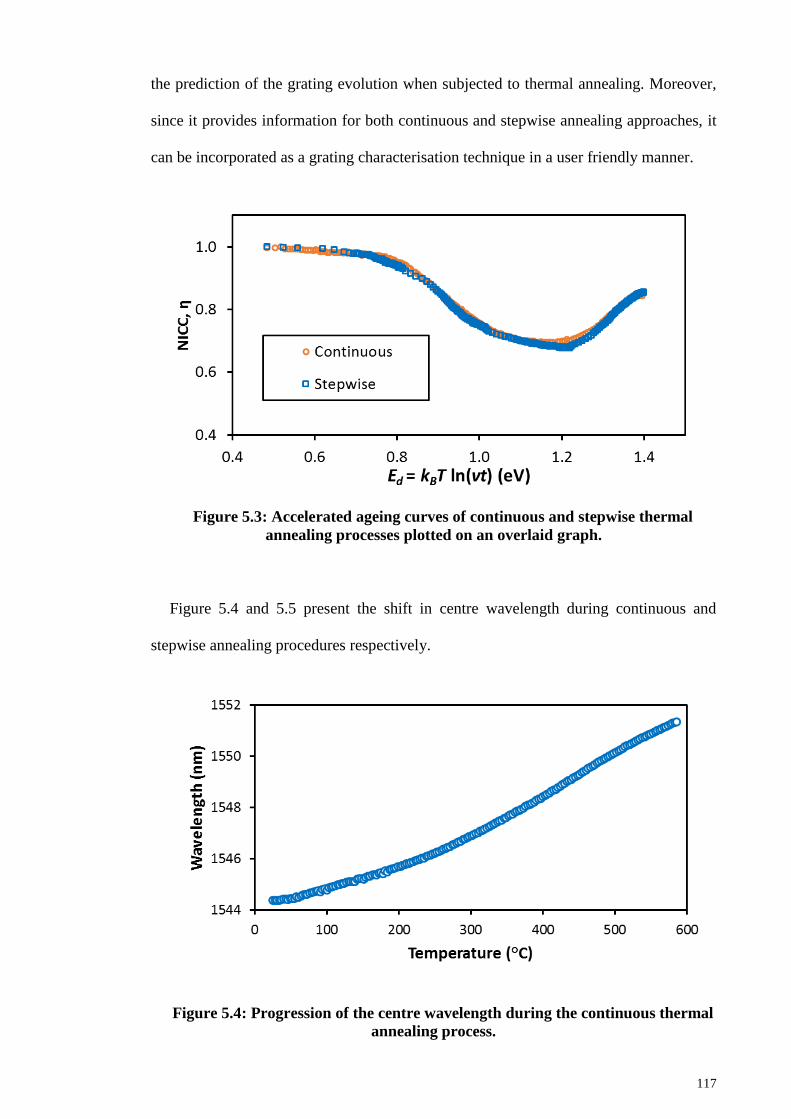
117
the prediction of the grating evolution when subjected to thermal annealing. Moreover,
since it provides information for both continuous and stepwise annealing approaches, it
can be incorporated as a grating characterisation technique in a user friendly manner.
Figure 5.3: Accelerated ageing curves of continuous and stepwise thermal
annealing processes plotted on an overlaid graph.
Figure 5.4 and 5.5 present the shift in centre wavelength during continuous and
stepwise annealing procedures respectively.
Figure 5.4: Progression of the centre wavelength during the continuous thermal
annealing process.
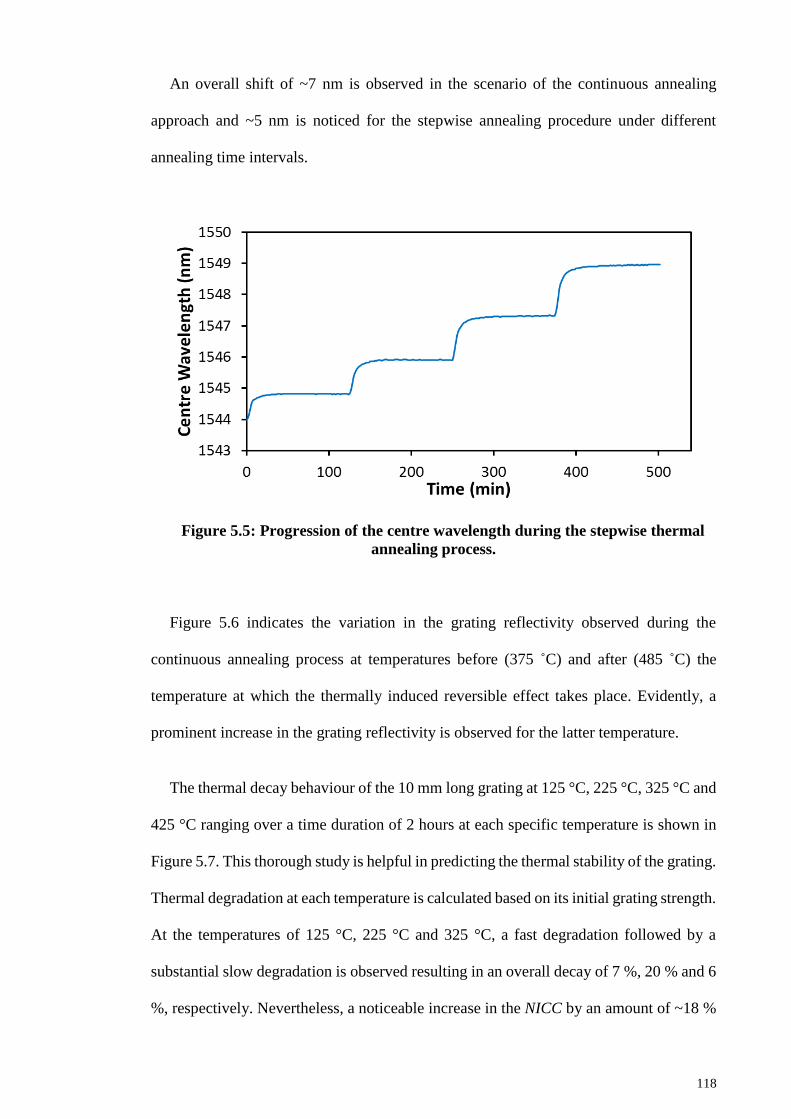
118
An overall shift of ~7 nm is observed in the scenario of the continuous annealing
approach and ~5 nm is noticed for the stepwise annealing procedure under different
annealing time intervals.
Figure 5.5: Progression of the centre wavelength during the stepwise thermal
annealing process.
Figure 5.6 indicates the variation in the grating reflectivity observed during the
continuous annealing process at temperatures before (375 ˚C) and after (485 ˚C) the
temperature at which the thermally induced reversible effect takes place. Evidently, a
prominent increase in the grating reflectivity is observed for the latter temperature.
The thermal decay behaviour of the 10 mm long grating at 125 °C, 225 °C, 325 °C and
425 °C ranging over a time duration of 2 hours at each specific temperature is shown in
Figure 5.7. This thorough study is helpful in predicting the thermal stability of the grating.
Thermal degradation at each temperature is calculated based on its initial grating strength.
At the temperatures of 125 °C, 225 °C and 325 °C, a fast degradation followed by a
substantial slow degradation is observed resulting in an overall decay of 7 %, 20 % and 6
%, respectively. Nevertheless, a noticeable increase in the NICC by an amount of ~18 %
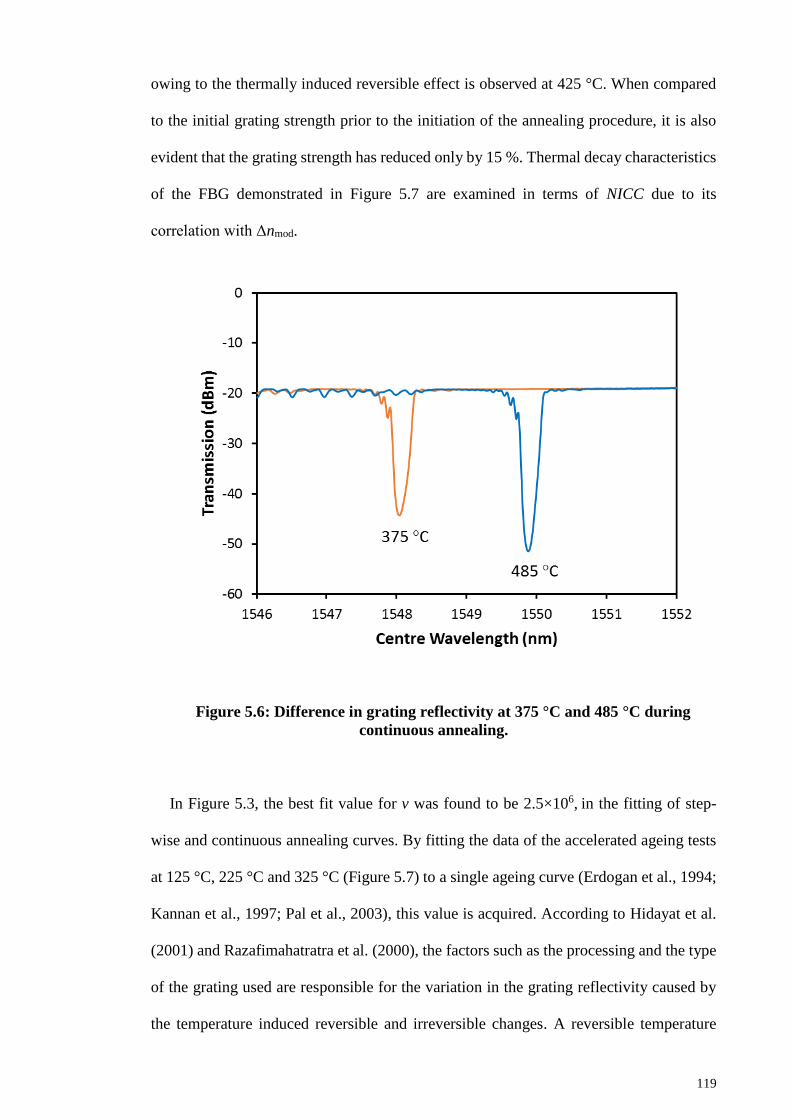
119
owing to the thermally induced reversible effect is observed at 425 °C. When compared
to the initial grating strength prior to the initiation of the annealing procedure, it is also
evident that the grating strength has reduced only by 15 %. Thermal decay characteristics
of the FBG demonstrated in Figure 5.7 are examined in terms of NICC due to its
correlation with Δnmod.
Figure 5.6: Difference in grating reflectivity at 375 °C and 485 °C during
continuous annealing.
In Figure 5.3, the best fit value for v was found to be 2.5×10⁶, in the fitting of step-
wise and continuous annealing curves. By fitting the data of the accelerated ageing tests
at 125 °C, 225 °C and 325 °C (Figure 5.7) to a single ageing curve (Erdogan et al., 1994;
Kannan et al., 1997; Pal et al., 2003), this value is acquired. According to Hidayat et al.
(2001) and Razafimahatratra et al. (2000), the factors such as the processing and the type
of the grating used are responsible for the variation in the grating reflectivity caused by
the temperature induced reversible and irreversible changes. A reversible temperature
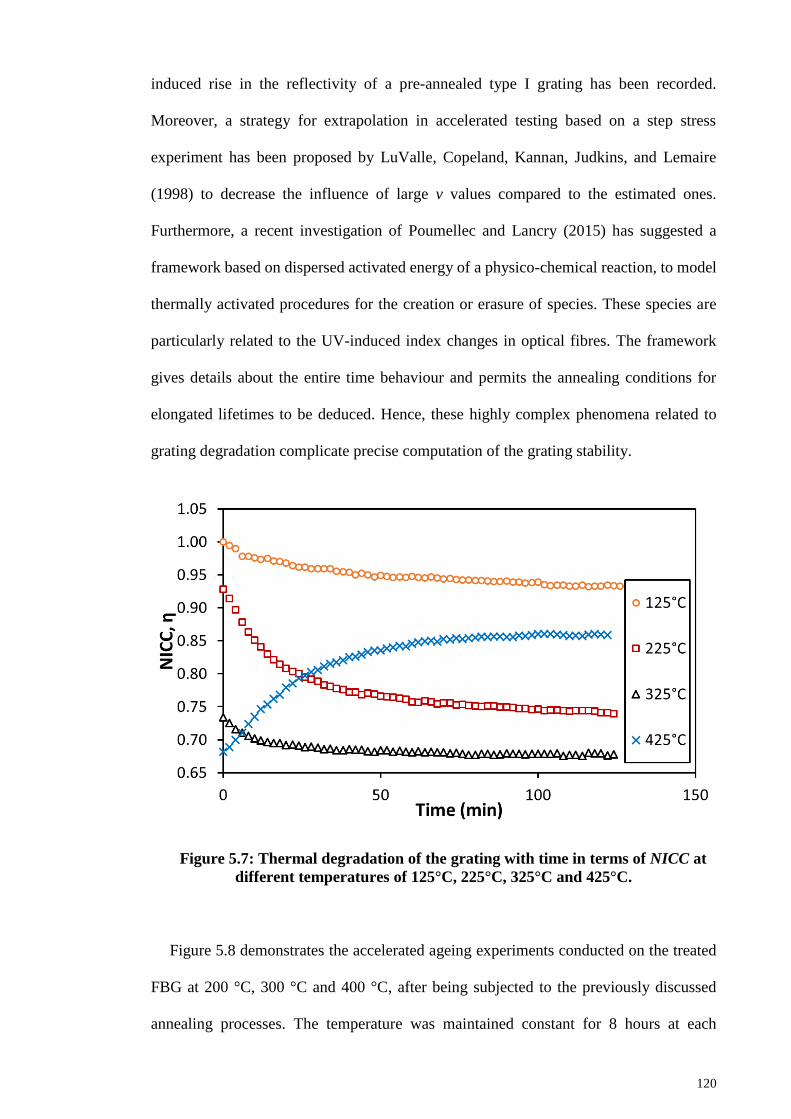
120
induced rise in the reflectivity of a pre-annealed type I grating has been recorded.
Moreover, a strategy for extrapolation in accelerated testing based on a step stress
experiment has been proposed by LuValle, Copeland, Kannan, Judkins, and Lemaire
(1998) to decrease the influence of large v values compared to the estimated ones.
Furthermore, a recent investigation of Poumellec and Lancry (2015) has suggested a
framework based on dispersed activated energy of a physico-chemical reaction, to model
thermally activated procedures for the creation or erasure of species. These species are
particularly related to the UV-induced index changes in optical fibres. The framework
gives details about the entire time behaviour and permits the annealing conditions for
elongated lifetimes to be deduced. Hence, these highly complex phenomena related to
grating degradation complicate precise computation of the grating stability.
Figure 5.7: Thermal degradation of the grating with time in terms of NICC at
different temperatures of 125°C, 225°C, 325°C and 425°C.
Figure 5.8 demonstrates the accelerated ageing experiments conducted on the treated
FBG at 200 °C, 300 °C and 400 °C, after being subjected to the previously discussed
annealing processes. The temperature was maintained constant for 8 hours at each
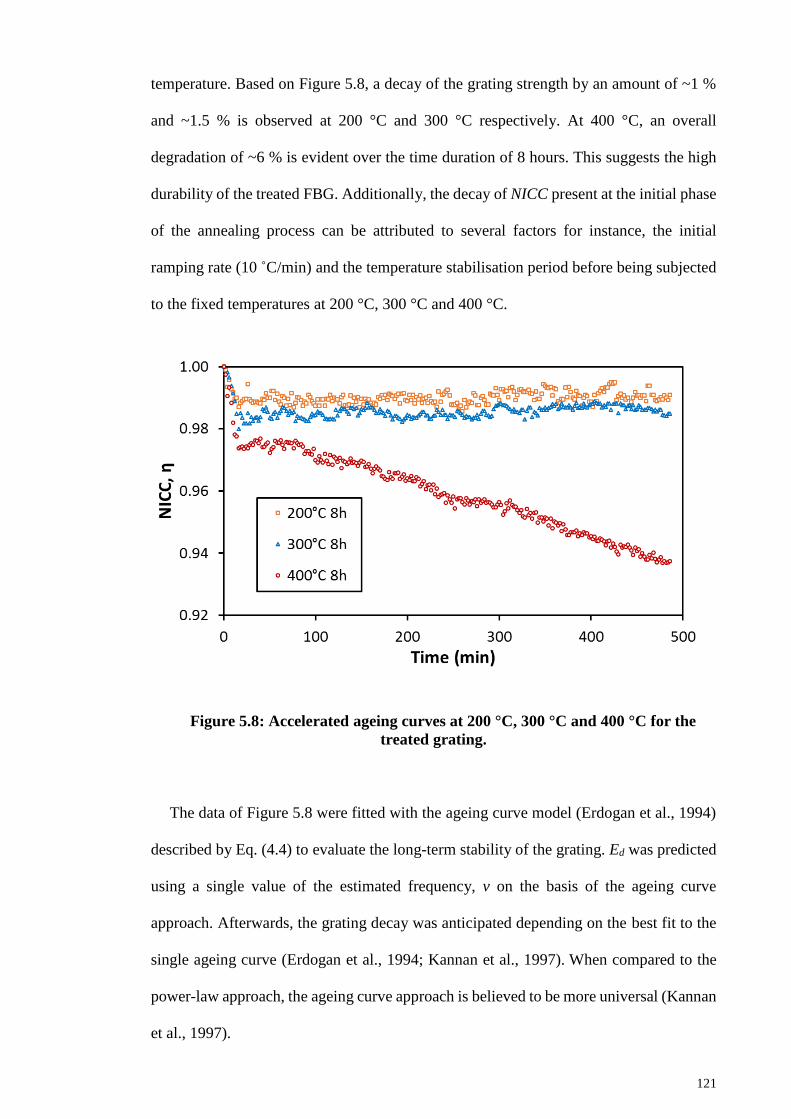
121
temperature. Based on Figure 5.8, a decay of the grating strength by an amount of ~1 %
and ~1.5 % is observed at 200 °C and 300 °C respectively. At 400 °C, an overall
degradation of ~6 % is evident over the time duration of 8 hours. This suggests the high
durability of the treated FBG. Additionally, the decay of NICC present at the initial phase
of the annealing process can be attributed to several factors for instance, the initial
ramping rate (10 ˚C/min) and the temperature stabilisation period before being subjected
to the fixed temperatures at 200 °C, 300 °C and 400 °C.
Figure 5.8: Accelerated ageing curves at 200 °C, 300 °C and 400 °C for the
treated grating.
The data of Figure 5.8 were fitted with the ageing curve model (Erdogan et al., 1994)
described by Eq. (4.4) to evaluate the long-term stability of the grating. Ed was predicted
using a single value of the estimated frequency, v on the basis of the ageing curve
approach. Afterwards, the grating decay was anticipated depending on the best fit to the
single ageing curve (Erdogan et al., 1994; Kannan et al., 1997). When compared to the
power-law approach, the ageing curve approach is believed to be more universal (Kannan
et al., 1997).
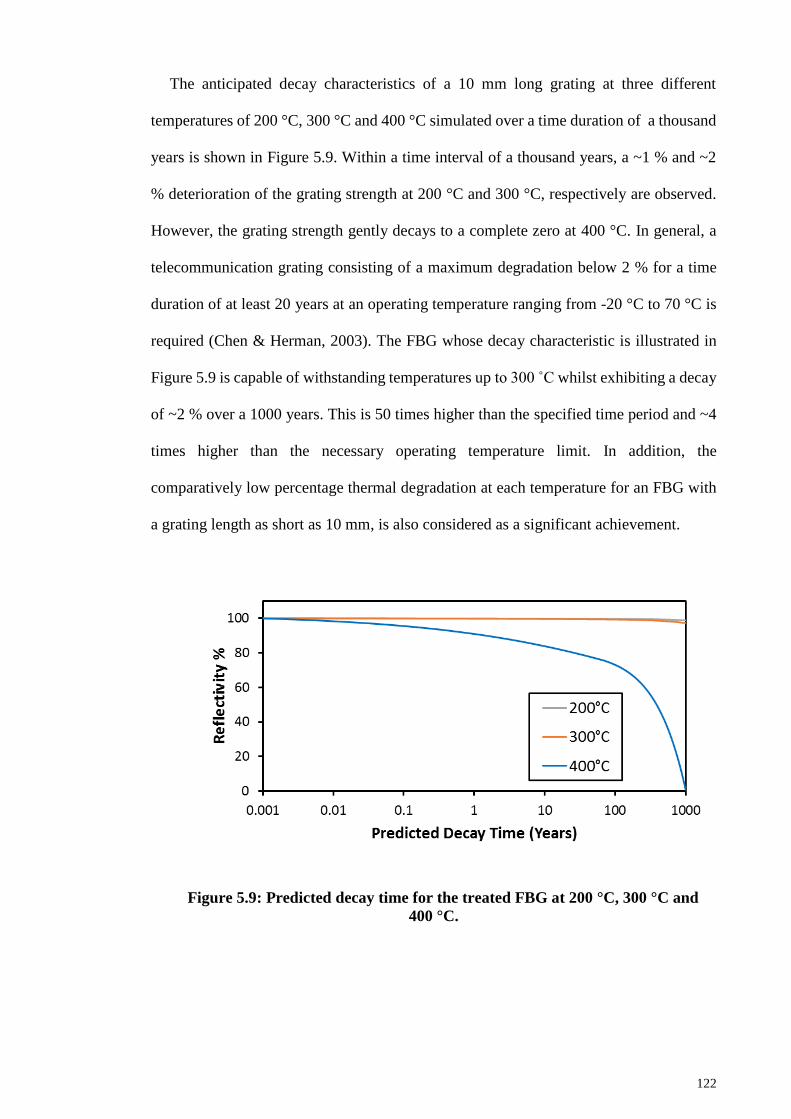
122
The anticipated decay characteristics of a 10 mm long grating at three different
temperatures of 200 °C, 300 °C and 400 °C simulated over a time duration of a thousand
years is shown in Figure 5.9. Within a time interval of a thousand years, a ~1 % and ~2
% deterioration of the grating strength at 200 °C and 300 °C, respectively are observed.
However, the grating strength gently decays to a complete zero at 400 °C. In general, a
telecommunication grating consisting of a maximum degradation below 2 % for a time
duration of at least 20 years at an operating temperature ranging from -20 °C to 70 °C is
required (Chen & Herman, 2003). The FBG whose decay characteristic is illustrated in
Figure 5.9 is capable of withstanding temperatures up to 300 ˚C whilst exhibiting a decay
of ~2 % over a 1000 years. This is 50 times higher than the specified time period and ~4
times higher than the necessary operating temperature limit. In addition, the
comparatively low percentage thermal degradation at each temperature for an FBG with
a grating length as short as 10 mm, is also considered as a significant achievement.
Figure 5.9: Predicted decay time for the treated FBG at 200 °C, 300 °C and
400 °C.
123
5.3.1 Effect of temperature ramping rate
Over the past few years, some studies have demonstrated the effect of using different
temperature ramping rates on different types of fibres during various experiments when
exploring the thermal decay characteristics of gratings. Rathje et al. (2000) has
investigated the effect of temperature ramp speeds on the survival of the grating of both
deuterium (D2) loaded and non-loaded 15 mol% Ge-doped photosensitive fibre.
According to the study three similar gratings have been annealed at three different
ramping speeds of 0.25, 0.025 and 0.0036 K/s. The analysis of the normalised thermal
degradation of the grating strength, κL has indicated that all three gratings possess a
similar shape of thermal decay curves but are lengthened along the temperature axis
indicating that the FBG experiencing the fastest heating rate exhibits the maximum
surviving temperature. Afterwards, an ageing curve has been plotted and its reliability
obtained from raw data has been tested by performing a separate experiment. The results
achieved have indicated that the actual and the predicted decay curves exhibit good
agreement with each other. Differentiating the ageing curve has provided sufficient
information on the underlying energy distribution. A similar type of experiment has been
conducted using gratings inscribed in D2 loaded fibre and the results obtained have
indicated two energy distributions showing the involvement of two different defects.
The study of Violakis, Limberger, Mashinsky, and Dianov (2011) has revealed the
thermal stability of H2 loaded and non-loaded Bi-Al-SiO2 and SMF-28 fibres through
continuous isochronal thermal annealing procedure. Three varying ramp rates of 0.25,
0.025 and 0.0038 K/s have been used during the experiment on three similar FBGs in
each type of fibre. The fastest and slowest heating rates have been constrained by the
specifications of the furnace and some practical concerns such as the complete run time
(< 3 days). Motivation for using the three different ramp rates is to be able to include two
124
orders of magnitude of ramp rate over the range 0.25 to 0.0038 K/s. The resulting spectra
have been analysed in a similar way to that suggested by Rathje et al. (2000) when
determining the thermal sustainability of the FBGs. The refractive index changes and the
thermal decay parameters for each heating rate have also been illustrated.
The study of temperature ramping rate is not limited to the analysis of thermal decay
characteristics. Some research studies have investigated the role of different thermal
ramping rates during thermal regeneration of FBGs. As discussed in Chapter 4, Bueno et
al. (2013) has managed to achieve fast regeneration of Bragg gratings. A RFBG with 1.6
dB reflectivity has been achieved within a time span of 10 min and by adjusting the
temperature of the oven, RFBGs exhibiting different amounts of losses over various time
spans have also been obtained. In addition, Lai, Gunawardena, et al. (2015) has
demonstrated the time consumed by three distinct types of gratings in different fibres
namely, PS 1250/1500, SM 1500 and ZWP-SMF for grating regeneration under different
heating rates by direct CO2 laser annealing. According to this study, PS 1250/1500 fibre
has appeared to produce the optimum result of the three types of fibres examined.
5.3.2 Thermal decay comparison of different gratings
Figure 5.10 shows the decay characteristics of PS 1250/1500, SM 1500 and ZWPF at
three different annealing rates of 3 °C/min, 6 °C/min and 9 °C/min. In Figure 5.10(a), a
gradual decay is observed until 425 °C in PS 1250/1500 which follows the usual
temperature decay behaviour of a grating. However, subsequently an increase in the
NICC is observed in the region of 425-550 °C depending on the ramping rate. This
phenomenon known as the thermally induced reversible effect has been observed in PS
1250/1500 gratings during both stepwise and continuous annealing processes as
discussed in Chapter 5.3. Afterwards, a rapid thermal decay can be observed until the
grating completely vanishes, commencing the grating regeneration process.
125
Nevertheless, when the annealing temperature is further increased the RFBG initiates
its decaying process in the region of 900-950 °C. It is also noticed that gratings inscribed
in the PS 1250/1500 have the lowest value of regeneration temperature between the three
fibres investigated. The existence of the boron dopant reduces the glass transition
temperature of the fibre material which permits stress relaxation to occur and the glass
structure to be rearranged at a lower temperature (Lai, Gunawardena, et al., 2015). A
slight increase in the NICC in the region of ~350 °C is observed in the case of the SM
1500. However, it is less significant compared to the phenomenon present in Figure
5.10(a). Regeneration characteristics in SM 1500 gratings were observed at 800 °C, 838
°C and 860 °C for temperature ramping rates of 3 °C/min, 6 °C/min and 9 °C/min
respectively. When compared with PS 1250/1500 and OFS zero water peak fibre, SM
1500 exhibits the highest NICC during regeneration especially when the experiment was
conducted at a ramping rate of 3 °C/min. The presence of the thermally induced
reversible effect can be considered negligible in ZWPF although grating regeneration can
still be clearly observed in 950-1015 °C range which subsequently decays to a complete
zero with increasing temperature.
Furthermore, according to Figure 5.10 it is also noticed that with increasing annealing
rate the temperature at which the grating regeneration occurs gradually increases. This
condition is visible in the gratings inscribed in all three types of fibre. In addition, it is
also found that H2 loading plays a vital role in increasing the possibility of attaining
thermal regeneration (Canning et al., 2010).
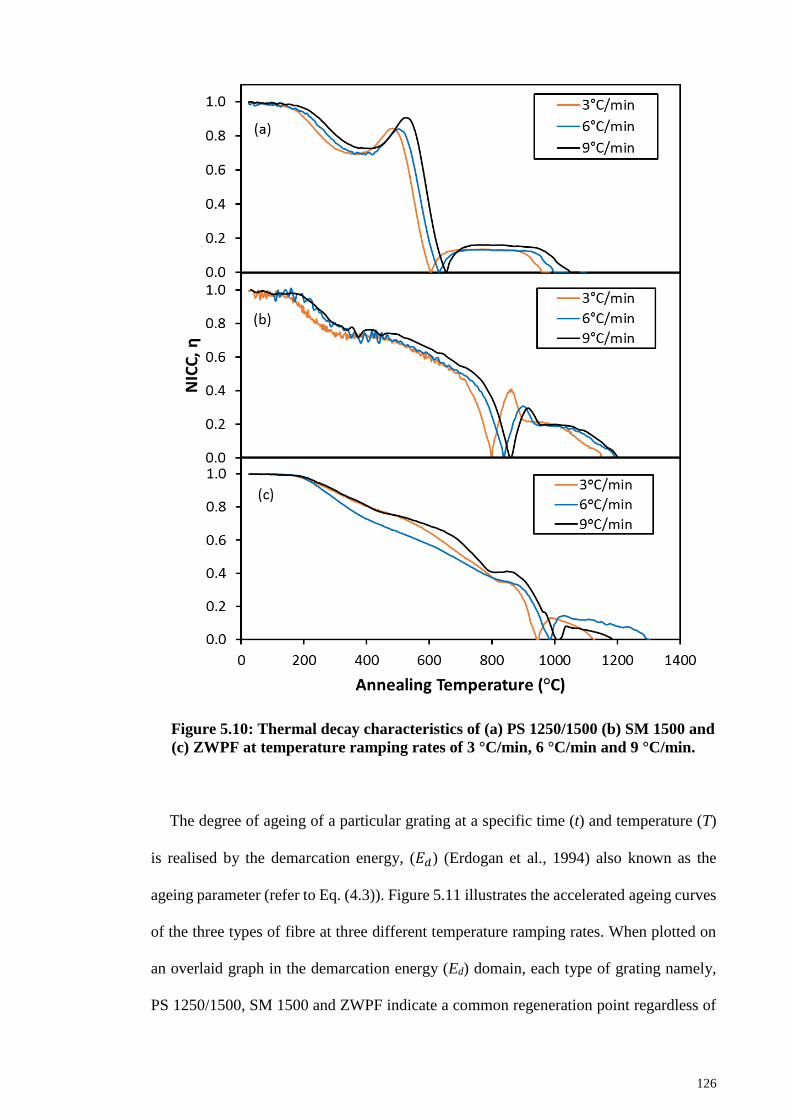
126
Figure 5.10: Thermal decay characteristics of (a) PS 1250/1500 (b) SM 1500 and
(c) ZWPF at temperature ramping rates of 3 °C/min, 6 °C/min and 9 °C/min.
The degree of ageing of a particular grating at a specific time (t) and temperature (T)
is realised by the demarcation energy, (𝐸𝑑) (Erdogan et al., 1994) also known as the
ageing parameter (refer to Eq. (4.3)). Figure 5.11 illustrates the accelerated ageing curves
of the three types of fibre at three different temperature ramping rates. When plotted on
an overlaid graph in the demarcation energy (Ed) domain, each type of grating namely,
PS 1250/1500, SM 1500 and ZWPF indicate a common regeneration point regardless of
127
the difference in the temperature ramping rates. For PS 1250/1500 this point occurs at
~1.46 eV and it is clearly noticed that a higher ramping rate results in a higher NICC of
0.16. In the case of SM 1500 and ZWPF, the regeneration points are achieved at 1.57 and
1.96 eV respectively. The calculated v value for PS 1250/1500, SM 1500 and zero water
peak gratings are 2.5×10⁶ Hz, 2×10⁴ Hz and 1×10⁵ Hz respectively. Representing the
thermal degradation of the FBGs in the Ed domain provides the opportunity of projecting
the decay of an FBG for any amalgamation of time and temperature.
Figure 5.12 indicates transmission spectra of the three types of fibre and their
respective centre wavelengths obtained during the grating regeneration procedure at a
temperature ramping rate of 9 °C/min. Regeneration in SM 1500 occurs at a much higher
wavelength/temperature compared to PS 1250/1500 and ZWPF. Comparatively, SM
1500 exhibits a much higher maximum grating reflectivity of ~6.3 dB during regeneration
followed by PS 1250/1500 and lastly ZWPF.
This is possibly related to the thermal sensitivity and the original Bragg wavelength.
Based on the observed results, grating regeneration of ZWPF occurs at the highest
temperature in comparison to the rest of the gratings and results in a grating reflectivity
of approximately 1 dB.
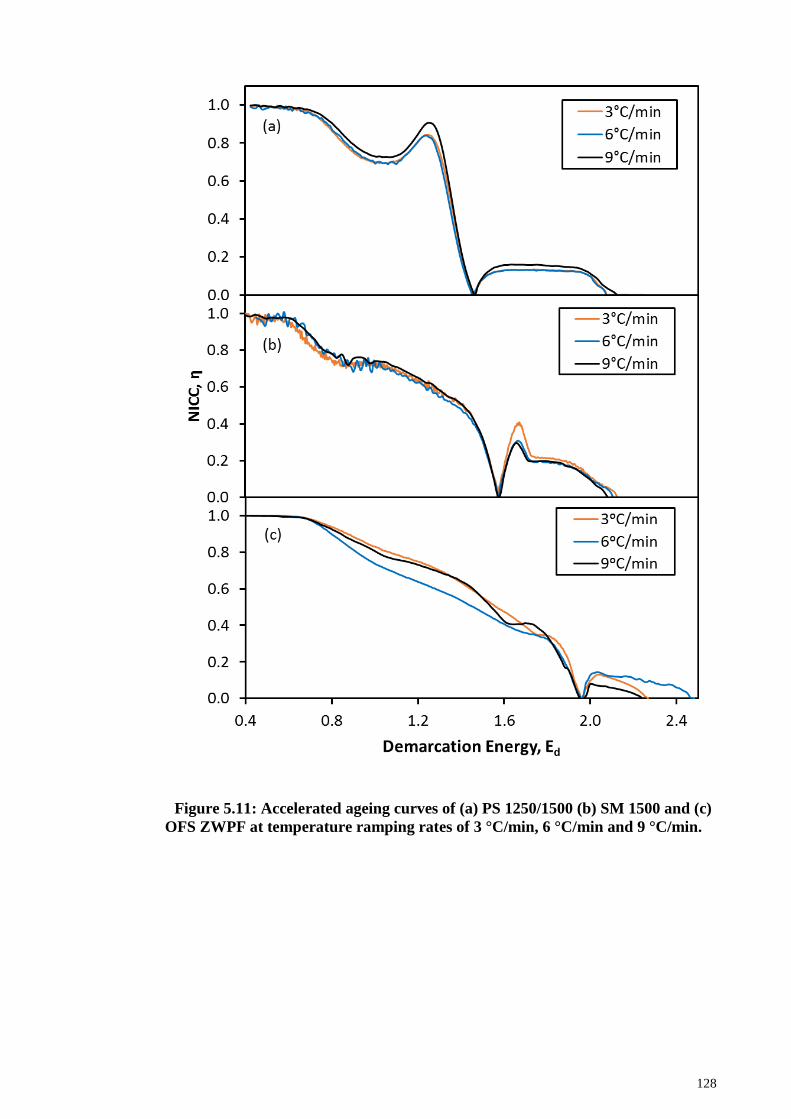
128
Figure 5.11: Accelerated ageing curves of (a) PS 1250/1500 (b) SM 1500 and (c)
OFS ZWPF at temperature ramping rates of 3 °C/min, 6 °C/min and 9 °C/min.
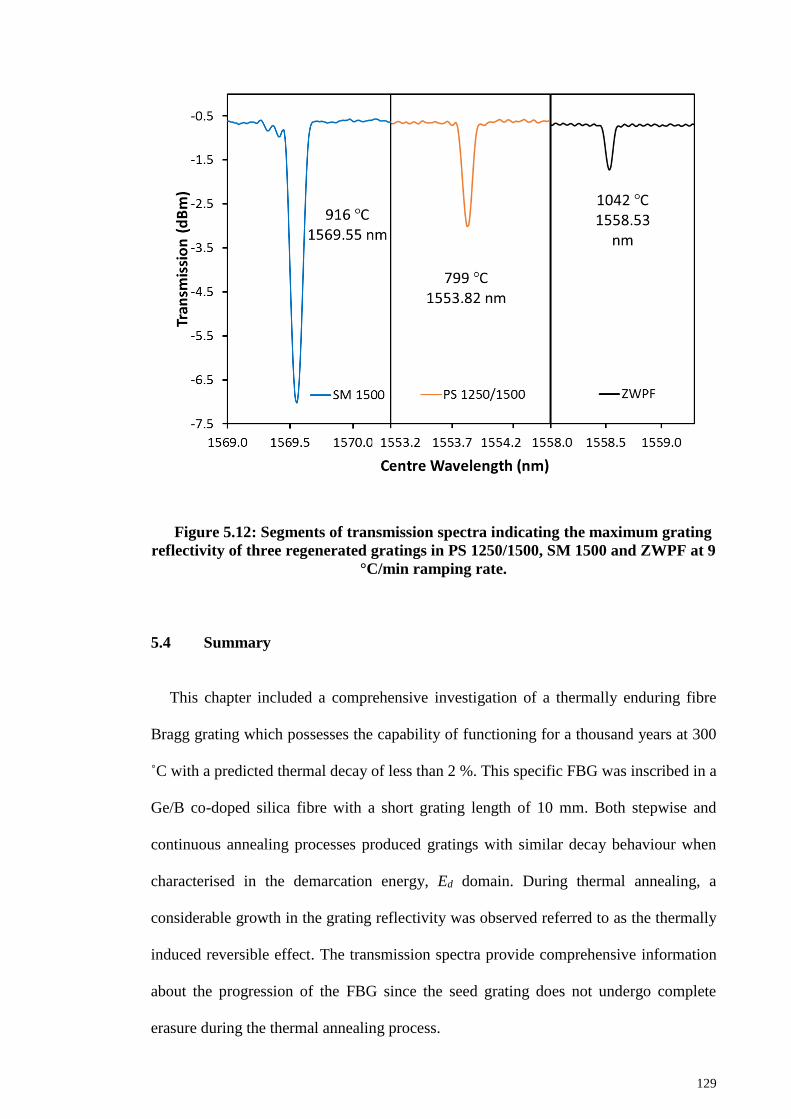
129
Figure 5.12: Segments of transmission spectra indicating the maximum grating
reflectivity of three regenerated gratings in PS 1250/1500, SM 1500 and ZWPF at 9
°C/min ramping rate.
5.4 Summary
This chapter included a comprehensive investigation of a thermally enduring fibre
Bragg grating which possesses the capability of functioning for a thousand years at 300
˚C with a predicted thermal decay of less than 2 %. This specific FBG was inscribed in a
Ge/B co-doped silica fibre with a short grating length of 10 mm. Both stepwise and
continuous annealing processes produced gratings with similar decay behaviour when
characterised in the demarcation energy, Ed domain. During thermal annealing, a
considerable growth in the grating reflectivity was observed referred to as the thermally
induced reversible effect. The transmission spectra provide comprehensive information
about the progression of the FBG since the seed grating does not undergo complete
erasure during the thermal annealing process.
130
In addition, the thermal decay behaviour of gratings written in three distinct types of
H2 loaded fibre under three different ramping rates of 3 °C/min, 6 °C/min and 9 °C/min
were investigated. The ageing characteristics were explored and a characterisation
technique for the thermal decay of a specific grating in the demarcation energy domain
was proposed with minimum reliance on the temperature ramping rate.
131
CHAPTER 6: CONCLUSION AND FUTURE DIRECTION
This chapter concludes the thesis which deals with various techniques for
characterisation and realisation of novel fibre Bragg gratings (FBGs) both in theoretical
and experimental point of views. It summarises the results and findings of this research
study and proposes a direction for future research to exploit the key findings of the current
investigation.
6.1 Conclusion
The research contribution of this thesis has concentrated on the photosensitivity,
grating strength and thermal endurance of fibre Bragg gratings (FBGs). The proposed
Ga-doped optical fibre demonstrates high photosensitivity capabilities and is more
photosensitive compared to the generally used Ge-doped fibre especially at low UV
fluence levels when irradiated with 193 nm ArF excimer laser at both H2 loaded and H2
free conditions. The enhancement in photosensitivity to the ArF excimer laser is due to
the high absorbance at 193 nm. Since Ga-doped fibre produces high index changes at low
UV fluence levels in the prescence of H2, it can be considered as an excellent candidate
for efficient FBG production with minimum consumption of UV fluence.
A mathematical model was proposed to characterise the growth of refractive index
change in fibre during grating fabrication. Both Δnave and Δnmod were determined from
the recorded transmission spectra and were incorporated in the generation of the local
refractive index changes, Δnmax and Δnmin. A single characteristic function, Δn[F] was
used to characterise the curves of Δnmax and Δnmin. A gradual decrease in the grating
visibility, vg was observed during the FBG inscription process. The curve-matching
technique was used to measure the interference visibility, vi with the aid of Δnmax and
Δnmin curves. This simple technique serves as a convenient tool for characterisation of the
132
grating inscription setup especially when determining the interference and grating
visibilities.
The bent-spectral analysis method was conducted in two stages, where spectral
properties of the FBGs were analysed at each stage which assisted in deducing the grating
visibility values under applied UV fluence and bending conditions. Measurements of the
grating visibility after grating inscription and with decreasing bending radius were
compared by representing the two functions on an overlaid graph. The experiment was
repeated for a wide range of visibility values to verify the validity of the results. The
accuracy of these results was confirmed by investigating the cross correlation coefficient
of the functions. Interference and grating visibilities are two parameters which influence
the grating strength. Therefore, the importance in calculating these two parameters
together with the relative ease of use and cost effectiveness offered by this technique
makes it more appealing to be used in practical applications.
In the exploration of thermal stability of Bragg gratings, grating regeneration
characteristics were observed in Ga-doped optical fibres. These regenerated fibre Bragg
gratings (RFBGs) are suitable for measuring temperature even at high temperature range.
The grating regeneration results in an increase of the grating reflectivity at 720 °C after
being initially bleached. Temperature sensitivities of 15.2 pm/°C and 15.0 pm/°C were
attained during temperature calibration for the respective heating and cooling processes.
These findings of RFBGs open up an entirely new area of research in designing
temperature sensors using new glass compositions capable of withstanding high
temperatures.
In addition, with the use of a new annealing treatment, a thermal enduring FBG sensor
was fabricated based on thermally induced reversible effect, which is capable of operating
for a thousand years with a predicted thermal decay of less than 2 % at 300 ˚C. The FBG
133
consisting of a grating length as short as 10 mm is inscribed in Germanium/Boron co-
doped photosensitive silica core fibre. A similar trend of progression during both stepwise
and continuous annealing procedures was observed for the gratings when characterised
with respect to the demarcation energy Ed. This permits reliable predictions to be made
on the thermal decay characteristics of the respective gratings. Since the process does not
involve complete erasure of the seed grating (SG) as in the case of grating regeneration,
it provides the possibility of observing the grating decay behaviour through monitoring
of the transmission spectra and enabling detailed information to be obtained on the
progression of the grating. The predicted thermal degradation of the grating is less than 2
% for a thousand years and maintains a grating reflectivity of 98 % at 300 C. This grating
with prolonged thermal endurance gives rise to a new sector of research in the
investigation of durable fibre grating sensors suitable for applications conducted in the
range of 200 - 400 ˚C.
The thermal degradation of gratings fabricated in three different types of H2 loaded
fibres were explored under three different temperature ramping rates of 3 °C/min, 6
°C/min and 9 °C/min. The thermally induced reversible effect was prominent in PS
1250/1500 gratings. The ageing characteristics were explored in the Ed domain and a
characterising technique which can be used to predict the thermal degradation of a
particular FBG with minimum dependence on the thermal annealing rate was proposed.
6.2 Future Direction
As well as the interest of producing photosensitive fibre with regeneration capabilities,
Ga-doping can also be beneficial in the production of efficient and high power optical
amplifiers and lasers, because it possesses index raising capabilities and the added benefit
of being used as a substitute for Aluminium (Al) when co-doping with rare-earth
materials. In addition, gratings can be efficiently inscribed in these rare-earth doped fibres
134
followed by thermal regeneration to produce efficient fibre lasers or distributed Bragg
reflectors (DBRs) which can withstand high temperatures. Also, it is believed that Ga-
doped fibre at communication transmission bands can be accommodated as an alternative
to germanosilicate fibre for similar applications.
In the characterisation of the grating strength, the measurement results of interference
and grating visibilities can be used to obtain information about the coherence properties
of the laser used which will be beneficial in optimising the performance of the grating
inscription system. Since both the curve-matching technique and the bent-spectral
analysis technique use only the existing components and equipment in the grating
inscription system, additional peripheral tools will not be required for this characterisation
tests making them cost-effective characterisation tools suitable for both the
manufacturing industry and academic research of FBGs.
The grating with prolonged thermal endurance fabricated based on the thermally
induced reversible effect can be successfully used as a temperature sensor at elevated
temperatures due to its enhanced temperature response which does not involve complete
grating regeneration. These gratings can also be accommodated in a vast number of
applications where extended grating lifetime is a priority. Moreover, the study conducted
to analyse the effect of annealing at various temperature ramping rates can be further
extended to few-mode and multi-mode fibre where a comprehensive investigation can be
carried out in the Ed domain. Optical fibres have revolutionised the telecommunication
and sensing industries and FBGs are considered to be prime components of the optical
fibre technology. Hence, further research needs to be carried out to harness each and every
aspect of Bragg gratings.
135
REFERENCES
Aarts, R. M., Irwan, R., & Janssen, A. J. (2002). Efficient tracking of the cross-correlation
coefficient. IEEE Transactions on Speech and Audio Processing, 10(6), 391-402.
Albert, J., Hill, K. O., Johnson, D. C., Bilodeau, F., & Rooks, M. J. (1996). Moire phase
masks for automatic pure apodisation of fibre Bragg gratings.Electronics
Letters, 32(24), 2260-2261.
Albert, J., Theriault, S., Bilodeau, F., Johnson, D. C., Hill, K. O., Sixt, P., & Rooks, M.
J. (1996). Minimization of phase errors in long fiber Bragg grating phase masks
made using electron beam lithography. IEEE Photonics Technology
Letters, 8(10), 1334-1336.
Albert, J., Hill, K. O., Johnson, D. C., Bilodeau, F., Mihailov, S. J., Borrelli, N. F., &
Amin, J. (1999). Bragg gratings in defect-free germanium-doped optical
fibers. Optics letters, 24(18), 1266-1268.
Albert, J., Hill, K. O., Malo, B., Theriault, S., Bilodeau, F., Johnson, D. C., & Erickson,
L. E. (1995). Apodisation of the spectral response of fibre Bragg gratings using a
phase mask with variable diffraction efficiency. Electronics Letters, 31(3), 222-
223.
Allard, L. B., Albert, J., Brebner, J. L., & Atkins, G. R. (1997). Photoinduced optical
absorption and 400-nm luminescence in low-germanium-content optical fiber
preforms irradiated with ArF and KrF excimer-laser light. Optics letters, 22(11),
819-821.
Anderson, D. Z., Mizrahi, V., Erdogan, T., & White, A. E. (1993a). Production of in-fibre
gratings using a diffractive optical element. Electronics Letters, 29(6), 566-568.
Anderson, D. Z., Mizrahi, V., Erdogan, T., & White, A. E. (1993b, February). Phase-
mask method for volume manufacturing of fiber phase gratings. InOptical Fiber
Communication Conference (p. PD16). Optical Society of America.
Antipov, S., Ams, M., Williams, R. J., Magi, E., Withford, M. J., & Fuerbach, A. (2016).
Direct infrared femtosecond laser inscription of chirped fiber Bragg
gratings. Optics express, 24(1), 30-40.
Archambault, J. L. (1994). Photorefractive gratings in optical fibres (Doctoral Thesis,
Southampton University, United Kingdom).
136
Archambault, J. L., Reekie, L., & Russell, P. S. J. (1993a). 100% reflectivity Bragg
reflectors produced in optical fibres by single excimer laser pulses.Electronics
Letters, 29(5), 453-455.
Archambault, J. L., Reekie, L., & Russell, P. S. J. (1993b). High reflectivity and narrow
bandwidth fibre gratings written by single excimer pulse.Electronics
letters, 29(1), 28-29.
Åslund, M., & Canning, J. (2000). Annealing properties of gratings written into UV-
presensitized hydrogen-outdiffused optical fiber. Optics letters, 25(10), 692-694.
Åslund, M., Canning, J., & Yoffe, G. (1999). Locking in photosensitivity within optical
fiber and planar waveguides by ultraviolet preexposure. Opt. Lett, 24(24), 1826-
1828.
Atkins, R. M., & Mizrahi, V. (1992). Observations of changes in UV absorption bands of
singlemode germanosilicate core optical fibres on writing and thermally erasing
refractive index gratings. Electronics Letters, 28(18), 1743-1744.
Atkins, R. M., Lemaire, P. J., Erdogan, T., & Mizrahi, V. (1993). Mechanisms of
enhanced UV photosensitivity via hydrogen loading in germanosilicate
glasses. Electronics Letters, 29(14), 1234-1235.
Atkins, R. M., Mizrahi, V., & Erdogan, T. (1993). 248 nm induced vacuum UV spectral
changes in optical fibre preform cores: support for a colour centre model of
photosensitivity. Electronics Letters, 29(4), 385-387.
Baker, S. R., Rourke, H. N., Baker, V., & Goodchild, D. (1997). Thermal decay of fiber
Bragg gratings written in boron and germanium codoped silica fiber. Journal of
Lightwave Technology, 15(8), 1470-1477.
Ball, G. A., & Morey, W. W. (1991). Efficient integrated Nd/sup 3+/fiber laser.IEEE
photonics technology letters, 3(12), 1077-1078.
Ball, G. A., Morey, W. W., & Glenn, W. H. (1991). Standing-wave monomode erbium
fiber laser. IEEE Photonics Technology Letters, 3, 613-615.
Ball, G. A., & Morey, W. W. (1992). Continuously tuneable single-mode erbium fiber
laser. Optics letters, 17(6), 420-422.
137
Bandyopadhyay, S., Canning, J., Biswas, P., Stevenson, M., & Dasgupta, K. (2011). A
study of regenerated gratings produced in germanosilicate fibers by high
temperature annealing. Optics express, 19(2), 1198-1206.
Bandyopadhyay, S., Canning, J., Stevenson, M., & Cook, K. (2008). Ultrahigh-
temperature regenerated gratings in boron-codoped germanosilicate optical fiber
using 193 nm. Opt. Lett, 33(16), 1917-1919.
Barsanti, S., Cannas, M., & Bicchi, P. (2007). Gallium doped SiO 2: Towards a new
luminescent material. Journal of Non-Crystalline Solids, 353(5), 679-683.
Bazylenko, M. V., Moss, D., & Canning, J. (1998). Complex photosensitivity observed
in germanosilica planar waveguides. Optics letters, 23(9), 697-699.
Bernardin, J. P., & Lawandy, N. M. (1990). Dynamics of the formation of Bragg gratings
in germanosilicate optical fibers. Optics communications, 79(3-4), 194-199.
Bilodeau, F., Hibino, Y., Abe, M., Malo, B., Albert, J., Kawachi, M., ... & Hill, K. O.
(1993). Photosensitization of optical fiber and silica-on-silicon/silica
waveguides. Optics Letters, 18(12), 953-955.
Brambilla, G., & Pruneri, V. (2001). Enhanced photorefractivity in tin-doped silica
optical fibers (review). Institute of Electrical and Electronics Engineers: Journal
of Selected Topics in Quantum Electronics, 7(3), 403-408.
Brambilla, G., Pruneri, V., & Reekie, L. (2000). Photorefractive index gratings in SnO2:
SiO2 optical fibres. Appl. Phys. Lett, 76(7), 807.
Brambilla, G., Pruneri, V., Reekie, L., & Payne, D. N. (1999). Enhanced photosensitivity
in germanosilicate fibers exposed to CO 2 laser radiation.Optics letters, 24(15),
1023-1025.
Bueno, A., Kinet, D., Mégret, P., & Caucheteur, C. (2013). Fast thermal regeneration of
fiber Bragg gratings. Optics letters, 38(20), 4178-4181.
Butov, O. V., Dianov, E. M., & Golant, K. M. (2006). Nitrogen-doped silica-core fibres
for Bragg grating sensors operating at elevated temperatures.Measurement
science and technology, 17(5), 975.
Byron, K. C., Sugden, K., Bricheno, T., & Bennion, I. (1993). Fabrication of chirped
Bragg gratings in photosensitive fibre. Electronics letters, 29(18), 1659-1660.
138
Callister, W. D., & Rethwisch, D. G. (2008). Fundamentals of materials science and
engineering: an integrated approach. Wiley.
Camlibel, I., Pinnow, D. A., & Dabby, F. W. (1975). Optical aging characteristics of
borosilicate clad fused silica core fiber optical waveguides. Applied Physics
Letters, 26(4), 185-187.
Canning, J. (2008). Fibre gratings and devices for sensors and lasers. Laser & Photonics
Reviews, 2(4), 275-289.
Canning, J., & Åslund, M. (1999). Correlation of ultraviolet-induced stress changes and
negative index growth in type IIa germanosilicate waveguide gratings. Optics
letters, 24(7), 463-465.
Canning, J., & Sceats, M. G. (1994). Pi-phase-shifted periodic distributed structures in
optical fibres by UV post-processing. Electronics Letters, 30, 1344-1345.
Canning, J., Cook, K., Åslund, M., Stevenson, M., Biswas, P., & Bandyopadhyay, S.
(2010). Regenerated fibre Bragg gratings. INTECH Open Access Publisher.
Caucheteur, C., Wuilpart, M., Chen, C., Megret, P., & Albert, J. (2009, January). Multi-
point in-line refractometry using tilted fiber Bragg gratings. In2009 IEEE/LEOS
Winter Topicals Meeting Series.
Chen, K. P., & Herman, P. R. (2003). Photosensitization of standard fibers with deep UV
laser radiation. Journal of lightwave technology, 21(9), 1958-1968.
Chen, K. P., Herman, P. R., Taylor, R., & Hnatovsky, C. (2003). Vacuum-ultraviolet
laser-induced refractive-index change and birefringence in standard optical
fibers. Journal of lightwave technology, 21(9), 1969-1977.
Cheong, Y. K., Chong, W. Y., Chong, S. S., Lim, K. S., & Ahmad, H. (2014).
Regenerated Type-IIa Fibre Bragg Grating from a Ge–B codoped fibre via
thermal activation. Optics & Laser Technology, 62, 69-72.
Chiang, K. S., Sceats, M. G., & Wong, D. (1993). Ultraviolet photolytic-induced changes
in optical fibers: the thermal expansion coefficient. Optics letters, 18(12), 965-
967.
Cole, M. J., Loh, W. H., Laming, R. I., Zervas, M. N., & Barcelos, S. (1995). Moving
fibre/phase-mask-scanning beam technique for enhanced flexibility in producing
fibre gratings with uniform phase-mask. Electronics Letters-IEE, 31, 1488-1490.
139
Cook, K., Shao, L. Y., & Canning, J. (2012). Regeneration and helium: regenerating
Bragg gratings in helium-loaded germanosilicate optical fibre.Optical Materials
Express, 2(12), 1733-1742.
Cortes, P. Y., Ouellette, F., & LaRochelle, S. (1998). Intrinsic apodisation of Bragg
gratings written using UV-pulse interferometry. Electronics Letters, 34(4), 396-
397.
D'Amato, F. X., & Dunphy, J. R. (1992, November). Tuneable semiconductor laser
sources using fiber Bragg gratings. In LEOS'92, Conference Proceedings. IEEE
Lasers and Electro-Optics Society, 1992 Annual Meeting(pp. 343-344). IEEE.
Davis, D. D., Gaylord, T. K., Glytsis, E. N., & Mettler, S. C. (1999). Very-high-
temperature stable CO 2-laser-induced long-period fibre gratings.Electronics
Letters, 35(9), 740-742.
Davis, K. M., & Tomozawa, M. (1995). Water diffusion into silica glass: structural
changes in silica glass and their effect on water solubility and diffusivity. Journal
of Non-Crystalline Solids, 185(3), 203-220.
Dianov, E. M., Golant, K. M., Khrapko, R. R., Kurkov, A. S., & Tomashuk, A. L. (1995).
Low-hydrogen silicon oxynitride optical fibers prepared by SPCVD. Journal of
lightwave technology, 13(7), 1471-1474.
Dianov, E. M., Golant, K. M., Khrapko, R. R., Kurkov, A. S., Leconte, B., Douay, M., ...
& Niay, P. (1997, February). Grating formation in a germanium free silicon
oxynitride fibre. In Optical Fibre Gratings (Digest No. 1997/037), IEE
Colloquium on (pp. 4-1). IET.
Dianov, E. M., Golant, K. M., Mashinsky, V. M., Medvedkov, O. I., Nikolin, I. V.,
Sazhin, O. D., & Vasiliev, S. A. (1997). Highly photosensitive nitrogen-doped
germanosilicate fibre for index grating writing. Electronics Letters, 33(15), 1334-
1335.
Dianov, E. M., Karpov, V. I., Grekov, M. V., Golant, K. M., Vasiliev, S. A., Medvedkov,
O. I., & Khrapko, R. R. (1997, January). Thermo-induced long-period fibre
gratings. In IEE conference publication (Vol. 2, pp. 53-56). Institution of
Electrical Engineers.
Dianov, E. M., Plotnichenko, V. G., Koltashev, V. V., Pyrkov, Y. N., Ky, N. H.,
Limberger, H. G., & Salathe, R. P. (1997). UV-irradiation-induced structural
transformation of germanoscilicate glass fiber. Optics letters, 22(23), 1754-1756.
140
Dong, L., & Liu, W. F. (1997). Thermal decay of fiber Bragg gratings of positive and
negative index changes formed at 193 nm in a boron-codoped germanosilicate
fiber. Applied optics, 36(31), 8222-8226.
Dong, L., Archambault, J. L., Reekie, L., Russell, P. S. J., & Payne, D. N. (1995).
Photoinduced absorption change in germanosilicate preforms: evidence for the
color-center model of photosensitivity. Applied optics, 34(18), 3436-3440.
Dong, L., Cruz, J. L., Reekie, L., Xu, M. G., & Payne, D. N. (1995). Enhanced
photosensitivity in tin-codoped germanosilicate optical fibers.IEEE Photonics
Technology Letters, 7(9), 1048-1050.
Dong, L., Cruz, J. L., Tucknott, J. A., Reekie, L., & Payne, D. N. (1995). Strong
photosensitive gratings in tin-doped phosphosilicate optical fibers.Optics
letters, 20(19), 1982-1984.
Dong, L., Liu, W. F., & Reekie, L. (1996). Negative-index gratings formed by a 193-nm
excimer laser. Optics letters, 21(24), 2032-2034.
Dong, L., Pinkstone, J., Russell, P. S. J., & Payne, D. N. (1994). Ultraviolet absorption in
modified chemical vapor deposition preforms. JOSA B, 11(10), 2106-2111.
Douay, M., Fertein, E., Xie, W. X., Bernage, P., Niay, P., Bayon, J. F., & Georges, T.
(1993). Thermal hysteresis of Bragg wavelengths of intra-core fiber
gratings. IEEE photonics technology letters, 5(11), 1331-1334.
Dürr, F., Limberger, H. G., Salathé, R. P., Vasiliev, S. A., Medvedkov, O. I., Bozhkov,
A. S., & Dianov, E. M. (2005). Annealing-induced stress changes in UV-
irradiated germanium-doped fibers. In BGPP’2005, Bragg Gratings,
Photosensitivity, and Poling in Glass Waveguides: OSA Topical Meeting.
Dyer, P. E., Farley, R. J., & Giedl, R. (1995). Analysis of grating formation with excimer
laser irradiated phase-masks. Optics communications, 115(3), 327-334.
Eggleton, B. J., Ahmed, K. A., Liu, H. F., Krug, P. A., & Poladian, L. (1994).
Experimental demonstration of compression of dispersed optical pulses by
reflection from self-chirped optical fiber Bragg gratings. Optics letters, 19(12),
877-879.
Erdogan, T. (1997). Fiber grating spectra. Journal of lightwave technology, 15(8), 1277-
1294.
141
Erdogan, T., Mizrahi, V., Lemaire, P. J., & Monroe, D. (1994). Decay of ultraviolet‐induced fiber Bragg gratings. Journal of Applied Physics, 76(1), 73-80.
Farries, M. C., Radgale, C., & Reid, D. C. J. (1992). Broadband chirped fibre Bragg filters
for pump rejection and recycling in erbium doped fibre amplifiers. Electronics
letters, 28(5), 487-489.
Fiori, C., & Devine, R. A. B. (1985). Ultraviolet irradiation induced compaction and
photoetching in amorphous, thermal SiO 2. In MRS Proceedings (Vol. 61, p. 187).
Cambridge University Press.
Fokine, M. (2002). Photosensitivity, chemical composition gratings and optical fiber
based components (Doctoral Thesis, Royal Institute of Technology, Stockholm,
Sweden). Retrieved from http://www.diva-portal.org/smash/get/diva2:9235/
FULLTEXT01.pdf
Fokine, M. (2004). Underlying mechanisms, applications, and limitations of chemical
composition gratings in silica based fibers. Journal of non-crystalline solids, 349,
98-104.
Fokine, M., Sahlgren, B. E., & Stubbe, R. (1996, December). High temperature resistant
Bragg gratings fabricated in silica optical fibres. InProc. Australian Conf. on
Optical Fibre Technology (ACOFT).
Fonjallaz, P. Y., Cochet, F., Leuenberger, B., Limberger, H. G., & Salathé, R. P. (1995).
Tension increase correlated to refractive-index change in fibers containing UV-
written Bragg gratings. Optics letters, 20(11), 1346-1348.
Fujimaki, M., Watanabe, T., Katoh, T., Kasahara, T., Miyazaki, N., Ohki, Y., &
Nishikawa, H. (1998). Structures and generation mechanisms of paramagnetic
centers and absorption bands responsible for Ge-doped SiO 2 optical-fiber
gratings. Physical Review B, 57(7), 3920.
Ghosh, S., Das, S., Paul, M. C., Dasgupta, K., Bohra, D., Chaudhary, H. S., ... &
Vaijapurkar, S. G. (2011). Evaluation of the performance of high phosphorous
with germanium codoped multimode optical fiber for use as a radiation sensor at
low dose rates. Applied Optics, 50(25), E80-E85.
Gnusin, P. I., Vasil'ev, S. A., Medvedkov, O. I., & Dianov, E. M. (2010). Reversible
changes in the reflectivity of different types of fibre Bragg gratings. Quantum
Electronics, 40(10), 879-886.
142
Grand, G., Jadot, J. P., Denis, H., Valette, S., Fournier, A., & Grouillet, A. M. (1990).
Low-loss PECVD silica channel waveguides for optical
communications. Electronics letters, 26(25), 2135-2137.
Grattan, K. T. V., & Meggitt, B. T. (Eds.). (2000). Optical fiber sensor technology:
Advanced applications : Kluwer Academic. Dordrecht.
Groothoff, N., & Canning, J. (2004). Enhanced type IIA gratings for high-temperature
operation. Optics letters, 29(20), 2360-2362.
Grubsky, V., Starodubov, D. S., & Feinberg, J. (1999a). Photochemical reaction of
hydrogen with germanosilicate glass initiated by 3.4–5.4-eV ultraviolet
light. Optics letters, 24(11), 729-731.
Grubsky, V., Starodubov, D. S., & Feinberg, J. (1999b, February). Effect of molecular
water on thermal stability of gratings in hydrogen-loaded optical fibers. In Optical
Fiber Communication Conference, 1999, and the International Conference on
Integrated Optics and Optical Fiber Communication. OFC/IOOC'99. Technical
Digest (Vol. 3, pp. 53-55). IEEE.
Hand, D. P., & Russell, P. S. J. (1990). Photoinduced refractive-index changes in
germanosilicate fibers. Optics letters, 15(2), 102-104.
Harwig, T., & Kellendonk, F. (1978). Some observations on the photoluminescence of
doped β-galliumsesquioxide. Journal of Solid State Chemistry, 24(3), 255-263.
Herbst, L., & Govorkov, S. V. (2003, April). Excimer laser application: writing of fiber
Bragg gratings. In Photonics Fabrication Europe (pp. 35-42). International
Society for Optics and Photonics.
Hidayat, A., Wang, Q., Niay, P., Douay, M., Poumellec, B., Kherbouche, F., & Riant, I.
(2001). Temperature-induced reversible changes in the spectral characteristics of
fiber Bragg gratings. Applied optics, 40(16), 2632-2642.
Hill, K. O., & Meltz, G. (1997). Fiber Bragg grating technology fundamentals and
overview. Journal of lightwave technology, 15(8), 1263-1276.
Hill, K. O., Bilodeau, F., Malo, B., & Johnson, D. C. (1991). Birefringent photosensitivity
in monomode optical fibre: application to external writing of rocking
filters. Electronics Letters, 27(17), 1548-1550.
143
Hill, K. O., Fujii, Y., Johnson, D. C., & Kawasaki, B. S. (1978). Photosensitivity in optical
fiber waveguides: Application to reflection filter fabrication. Applied Physics
Letters, 32(10), 647-649.
Hill, K. O., Malo, B., Bilodeau, F., Johnson, D. C., & Albert, J. (1993). Bragg gratings
fabricated in monomode photosensitive optical fiber by UV exposure through a
phase mask. Applied Physics Letters, 62(10), 1035-1037.
Hill, K. O., Malo, B., Vineberg, K. A., Bilodeau, F., Johnson, D. C., & Skinner, I. (1990).
Efficient mode conversion in telecommunication fibre using externally written
gratings. Electronics Letters, 26(16), 1270-1272.
Hill, K. O., Takiguchi, K., Bilodeau, F., Malo, B., Kitagawa, T., Thériault, S., ... & Albert,
J. (1994). Chirped in-fiber Bragg gratings for compensation of optical-fiber
dispersion. Optics letters, 19(17), 1314-1316.
Hosono, H., Abe, Y., Kinser, D. L., Weeks, R. A., Muta, K., & Kawazoe, H. (1992).
Nature and origin of the 5-eV band in SiO 2: GeO 2 glasses. Physical Review
B, 46(18), 11445.
Hosono, H., Mizuguchi, M., Kawazoe, H., & Nishii, J. (1996). Correlation between Ge
E′ Centers and Optical Absorption Bands in SiO2: GeO2 Glasses. Japanese
journal of applied physics, 35(2B), L234.
Huebner, J., Svalgaard, M., Gruener-Nielsen, L., & Kristensen, M. (1997, January).
Phenomenological model of UV-induced Bragg grating growth in germanosilicate
fibers. In Photonics West'97 (pp. 11-21). International Society for Optics and
Photonics.
Iadicicco, A., Campopiano, S., Paladino, D., Cutolo, A., & Cusano, A. (2007). Micro-
structured fiber Bragg gratings: optimization of the fabrication process. Optics
express, 15(23), 15011-15021.
Islam, M. R., Gunawardena, D. S., Lee, Y. S., Lim, K. S., Yang, H. Z., & Ahmad, H.
(2016). Fabrication and characterization of laser-ablated cladding resonances of
two different-diameter photosensitive optical fibers. Sensors and Actuators A:
Physical, 243, 111-116.
Ivanov, O. V. (2004). Near-field effects in fabrication of fiber Bragg gratings using phase
masks. Optics communications, 229(1), 167-172.
144
James, S. W., & Tatam, R. P. (2003). Optical fibre long-period grating sensors:
characteristics and application. Measurement science and technology, 14(5), R49.
Kajihara, K., Ikuta, Y., Oto, M., Hirano, M., Skuja, L., & Hosono, H. (2004). UV–VUV
laser induced phenomena in SiO 2 glass. Nuclear Instruments and Methods in
Physics Research Section B: Beam Interactions with Materials and Atoms, 218,
323-331.
Kannan, S., & Lemaire, P. J. Thermal reliability of Bragg gratings written in hydrogen-
sensitized fibers. In Optical Fiber Communications, 1996. OFC'96(pp. 84-85).
IEEE.
Kannan, S., Guo, J. Z., & Lemaire, P. J. (1997). Thermal stability analysis of UV-induced
fiber Bragg gratings. Journal of lightwave technology, 15(8), 1478-1483.
Karpov, V. I., Grekov, M. V., Dianov, E. M., Golant, K. M., & Khrapko, R. R. (1998).
Utlra-Thermostable Long-Period Gratings Written in Nitrogen-Doped Silica
Fibers. In MRS Proceedings (Vol. 531, p. 391). Cambridge University Press.
Kashyap, R. (1999). Fiber bragg gratings. Academic press.
Kashyap, R., Armitage, J. R., Wyatt, R., Davey, S. T., & Williams, D. L. (1990). All-
fibre narrowband reflection gratings at 1500 nm. Electronics Letters, 26(11), 730-
732.
Kashyap, R., McKee, P. F., Campbell, R. J., & Williams, D. L. (1994). Novel method of
producing all fibre photoinduced chirped gratings. Electronics letters, 30(12),
996-998.
Kersey, A. D., Davis, M. A., Patrick, H. J., LeBlanc, M., Koo, K. P., Askins, C. G., ... &
Friebele, E. J. (1997). Fiber grating sensors. Journal of lightwave
technology, 15(8), 1442-1463.
Kim, C. S., Han, Y., Lee, B. H., Han, W. T., Paek, U. C., & Chung, Y. (2000). Induction
of the refractive index change in B-doped optical fibers through relaxation of the
mechanical stress. Optics Communications, 185(4), 337-342.
Kim, J. M., Oh, K., Park, T. S., Kim, C. S., & Jeong, K. (2000). Suppression of cladding-
mode coupling loss in fiber Bragg gratings by independent control of refractive
index and photosensitive profiles in a single-mode optical fiber.IEEE Photonics
Technology Letters, 12(11), 1504-1506.
145
Kim, N. H., Kim, H. W., & Lee, C. (2004). Amorphous gallium oxide nanowires
synthesized by metalorganic chemical vapor deposition. Materials Science and
Engineering: B, 111(2), 131-134.
Kirchof, J., Unger, S., Pissler, H. J., & Knappe, B. (1995, February). Hydrogen-induced
hydroxyl profiles in doped silica layers. In Optical Fiber Communication
Conference (p. WP9). Optical Society of America.
Kogelnik, H., & Shank, C. V. (1972). Coupled‐wave theory of distributed feedback
lasers. Journal of applied physics, 43(5), 2327-2335.
Kohnke, G. E., Nightingale, D. W., Wigley, P. G., & Pollock, C. R. (1999, February).
Photosensitization of optical fiber by UV exposure of hydrogen loaded fiber.
In Optical Fiber Communication Conference (p. PD20). Optical Society of
America.
Ky, N. H., Limberger, H. G., Salathé, R. P., Cochet, F., & Dong, L. (2003). UV-irradiation
induced stress and index changes during the growth of type-I and type-IIA fiber
gratings. Optics Communications, 225(4), 313-318.
Ky, N. H., Limberger, H. G., Salathé, R. P., Cochet, F., & Dong, L. (1998). Effects of
drawing tension on the photosensitivity of Sn–Ge-and B–Ge-codoped core
fibers. Optics letters, 23(17), 1402-1404.
Laffont, G., Cotillard, R., & Ferdinand, P. (2013). Multiplexed regenerated fiber Bragg
gratings for high-temperature measurement. Measurement Science and
Technology, 24(9), 094010.
Lai, M. H., Gunawardena, D. S., Lim, K. S., Yang, H. Z., & Ahmad, H. (2015).
Observation of grating regeneration by direct CO2 laser annealing.Optics
express, 23(1), 452-463.
Lai, M. H., Lim, K. S., Gunawardena, D. S., Yang, H. Z., Chong, W. Y., & Ahmad, H.
(2015). Thermal stress modification in regenerated fiber Bragg grating via
manipulation of glass transition temperature based on CO2-laser annealing. Optics
letters, 40(5), 748-751.
Lancry, M., & Poumellec, B. (2013). UV laser processing and multiphoton absorption
processes in optical telecommunication fiber materials. Physics Reports, 523(4),
207-229.
146
Lancry, M., Poumellec, B., Costes, S., & Magné, J. (2014). Reliable Lifetime Prediction
for Passivated Fiber Bragg Gratings for Telecommunication
Applications. Fibers, 2(1), 92-107.
Leconte, B., Xie, W. X., Douay, M., Bernage, P., Niay, P., Bayon, J. F., ... & Poignant,
H. (1997). Analysis of color-center-related contribution to Bragg grating
formation in Ge: SiO 2 fiber based on a local Kramers–Kronig transformation of
excess loss spectra. Applied optics, 36(24), 5923-5930.
Lemaire, P. J., Atkins, R. M., Mizrahi, V., & Reed, W. A. (1993). High pressure H2
loading as a technique for achieving ultrahigh UV photosensitivity and thermal
sensitivity in GeO2 doped optical fibres.Electronics Letters, 29(13), 1191-1193.
Leviton, D. B., & Frey, B. J. (2006, June). Temperature-dependent absolute refractive
index measurements of synthetic fused silica. In SPIE Astronomical Telescopes+
Instrumentation (pp. 62732K-62732K). International Society for Optics and
Photonics.
Liberman, V., Bloomstein, T. M., Rothschild, M., Sedlacek, J. H. C., Uttaro, R. S., Bates,
A. K., ... & Orvek, K. (1999). Materials issues for optical components and
photomasks in 157 nm lithography. Journal of Vacuum Science & Technology
B, 17(6), 3273-3279.
Lim, K. S., Gunawardena, D. S., Lai, M. H., Islam, M. R., Yang, H. Z., Qiao, X., ... &
Ahmad, H. (2015). Characterization of phasemask interference visibility and the
evolution of grating visibility during grating formation. Measurement, 64, 163-
167.
Lim, K. S., Yang, H. Z., Becir, A., Lai, M. H., Ali, M. M., Qiao, X., & Ahmad, H. (2013).
Spectral analysis of bent fiber Bragg gratings: theory and experiment. Optics
letters, 38(21), 4409-4412.
Limberger, H. G., Fonjallaz, P. Y., Lambelet, P., Salathe, R. P., Zimmer, C., & Gilgen,
H. H. (1993, December). Optical low-coherence reflectometry (OLCR)
characterization of efficient Bragg gratings in optical fiber. In Optics Quebec (pp.
272-283). International Society for Optics and Photonics.
Limberger, H. G., Fonjallaz, P. Y., Salathé, R. P., & Cochet, F. (1996). Compaction‐and
photoelastic‐induced index changes in fiber Bragg gratings.Applied Physics
Letters, 68(22), 3069-3071.
147
Lindner, E., Chojetzki, C., Brückner, S., Becker, M., Rothhardt, M., & Bartelt, H. (2009).
Thermal regeneration of fiber Bragg gratings in photosensitive fibers. Optics
express, 17(15), 12523-12531.
Long, X. C., & Brueck, S. R. J. (1999a). Composition dependence of the photoinduced
refractive-index change in lead silicate glasses. Optics letters, 24(16), 1136-1138.
Long, X. C., & Brueck, S. R. J. (1999b). Large photosensitivity in lead–silicate
glasses. Applied physics letters, 74(15), 2110-2112.
LuValle, M. J., Copeland, L. R., Kannan, S., Judkins, J. B., & Lemaire, P. J. (1998). A
strategy for extrapolation in accelerated testing. Bell Labs technical journal, 3(3),
139-147.
Malo, B., Hill, K. O., Bilodeau, F., Johnson, D. C., & Albert, J. (1993). Point-by-point
fabrication of micro-Bragg gratings in photosensitive fibre using single excimer
pulse refractive index modification techniques. Electronics Letters, 29(18), 1668-
1669.
Marcuse, D. (1976). Curvature loss formula for optical fibers. JOSA, 66(3), 216-220.
Markowski, K., Jedrzejewski, K., & Osuch, T. (2016). Numerical analysis of double chirp
effect in tapered and linearly chirped fiber Bragg gratings. Applied Optics, 55(17),
4505-4513.
Martin, J., Lauzon, J., Thibault, S., & Ouellette, F. (1994, February). Novel Writing
Technique of Long and Highly Reflective In-fiber Bragg Gratings and
Investigation of the Linearly Chirped Component. In Optical Fiber
Communication Conference (p. PD29). Optical Society of America.
Matsuhara, M., & Hill, K. O. (1974). Optical-waveguide band-rejection filters:
design. Applied Optics, 13(12), 2886-2888.
Medvedkov, O. I., Vasiliev, S. A., Gnusin, P. I., & Dianov, E. M. (2012). Photosensitivity
of optical fibers with extremely high germanium concentration. Optical Materials
Express, 2(11), 1478-1489.
Meltz, G., & Morey, W. W. (1991, December). Bragg grating formation and
germanosilicate fiber photosensitivity. In International Workshop on
Photoinduced Self-Organization Effects in Op (pp. 185-199). International
Society for Optics and Photonics.

148
Meltz, G., Morey, W., & Glenn, W. H. (1989). Formation of Bragg gratings in optical
fibers by a transverse holographic method. Optics letters, 14(15), 823-825.
Mihailov, S. J., & Gower, M. C. (1994). Recording of efficient high-order Bragg
reflectors in optical fibres by mask image projection and single pulse exposure
with an excimer laser. Electronics Letters-IEE, 30(9), 707-707.
Mizuguchi, M., Skuja, L., Hosono, H., & Ogawa, T. (1999a). Photochemical processes
induced by 157-nm light in H 2-impregnated glassy SiO 2: OH.Optics
letters, 24(13), 863-865.
Mizuguchi, M., Skuja, L., Hosono, H., & Ogawa, T. (1999b). F-doped and H-2-
impregnated synthetic SiO2 glasses for 157 nm optics. Journal of Vacuum Science
& Technology B, 17(6), 3280-3284.
Morey, W. W., Dunphy, J. R., & Meltz, G. (1992, January). Multiplexing fiber Bragg
grating sensors. In Distributed and Multiplexed Fiber Optic Sensors(pp. 216-
224). International Society for Optics and Photonics.
Nand, A. (2007). Intragrating sensing using chirped optical fibre Bragg gratings
(Doctoral Thesis, Victoria University, Australia). Retrieved from
http://vuir.vu.edu.au/1499/1/Nand.pdf
Niay, P., Bernage, P., Legoubin, S., Douay, M., Xie, W. X., Bayon, J. F., ... & Poumellec,
B. (1994). Behaviour of spectral transmissions of Bragg gratings written in
germania-doped fibres: writing and erasing experiments using pulsed or cw uv
exposure. Optics Communications, 113(1), 176-192.
Nishii, J., Fukumi, K., Yamanaka, H., Kawamura, K. I., Hosono, H., & Kawazoe, H.
(1995). Photochemical reactions in GeO 2-SiO 2 glasses induced by ultraviolet
irradiation: comparison between Hg lamp and excimer laser. Physical Review
B, 52(3), 1661.
Ojovan, M. I. (2009). Viscosity and glass transition in amorphous oxides.Advances in
Condensed Matter Physics, 2008.
Othonos, A. (1997). Fiber bragg gratings. Review of scientific instruments,68(12), 4309-
4341.
Othonos, A., & Kalli, K. (1999). Fiber Bragg gratings: fundamentals and applications in
telecommunications and sensing. Artech House.
149
Othonos, A., & Lee, X. (1995). Novel and improved methods of writing Bragg gratings
with phase-masks. IEEE Photonics Technology Letters, 7(10), 1183-1185.
Othonos, A., Alavie, A. T., Melle, S., & Karr, S. E. (1993). Fiber Bragg grating laser
sensor. Optical Engineering, 32(11), 2841-2846.
Pal, S. (2006). Characterisation of thermal (in) stability and temperature-dependence of
type-I and type-IIA Bragg gratings written in B–Ge co-doped fiber. Optics
communications, 262(1), 68-76.
Pal, S., Mandal, J., Sun, T., & Grattan, K. T. (2003). Analysis of thermal decay and
prediction of operational lifetime for a type I boron-germanium codoped fiber
Bragg grating. Applied optics, 42(12), 2188-2197.
Pilla, P., Iadicicco, A., Contessa, L., Campopiano, S., Cusano, A., Cutolo, A., &
Giordano, M. (2005, May). Long period gratings coated with syndiotactic
polystirene as highly sensitive chemical sensors. In Bruges, Belgium-Deadline
Past (pp. 483-486). International Society for Optics and Photonics.
Poignant, H., Bayon, J. F., Delevaque, E., Monerie, M., Mellot, J. L., Grot, D., ... &
Douay, M. (1997, February). Influence of H 2 loading on the kinetics of Type IIA
fibre Bragg grating photoinscription. In Optical Fibre Gratings (Digest No.
1997/037), IEE Colloquium on (pp. 2-1). IET.
Poumellec, B. (1998). Links between writing and erasure (or stability) of Bragg gratings
in disordered media. Journal of non-crystalline solids, 239(1), 108-115.
Poumellec, B., & Lancry, M. (2015). Kinetics of thermally activated physical processes
in disordered media. Fibers, 3(3), 206-252.
Prohaska, J. D., Snitzer, E., Rishton, S., & Boegli, V. (1993). Magnification of mask
fabricated fibre Bragg gratings. Electronics Letters, 29(18), 1614-1615.
Raine, K. W., Feced, R., Kanellopoulos, S. E., & Handerek, V. A. (1999). Measurement
of axial stress at high spatial resolution in ultraviolet-exposed fibers. Applied
optics, 38(7), 1086-1095.
Ramecourt, D., Niay, P., Bernage, P., Riant, I., & Douay, M. (1999). Growth of strength
of Bragg gratings written in H 2 loaded telecommunication fibre during cw UV
post-exposure. Electronics Letters, 35(4), 329-331.
150
Rathje, J., Kristensen, M., & Pedersen, J. E. (2000). Continuous anneal method for
characterizing the thermal stability of ultraviolet Bragg gratings. Journal of
Applied Physics, 88(2), 1050-1055.
Razafimahatratra, D., Niay, P., Douay, M., Poumellec, B., & Riant, I. (2000). Comparison
of isochronal and isothermal decays of Bragg gratings written through continuous-
wave exposure of an unloaded germanosilicate fiber. Applied optics, 39(12),
1924-1933.
Riant, I. (2002). UV-photoinduced fibre gratings for gain equalisation. Optical Fiber
Technology, 8(3), 171-194.
Rowe, C. J., Bennion, I., & Reid, D. C. J. (1987). High-reflectivity surface-relief gratings
in single-mode optical fibres. IEE Proceedings J-Optoelectronics, 3(134), 197-
202.
Saito, K., & Ikushima, A. J. (2002). Effects of fluorine on structure, structural relaxation,
and absorption edge in silica glass. Journal of applied physics, 91(8), 4886-4890.
Salik, E., Starodubov, D. S., Grubsky, V., & Feinberg, J. (1999, February). Thermally
stable gratings in optical fibers without temperature annealing. InOptical Fiber
Communication Conference (p. ThD3). Optical Society of America.
Sang, X., Chu, P. L., Yu, C., & Lai, R. (2006). Growth dynamics of Bragg gratings in
multimode optical fibre. Optics communications, 260(1), 131-135.
Shen, Y., Xia, J., Sun, T., & Grattan, K. T. (2004). Photosensitive indium-doped
germano-silica fiber for strong FBGs with high temperature sustainability. IEEE
Photonics Technology Letters, 16(5), 1319-1321.
Simmons, K. D., Griscom, D. L., LaRochelle, S., Mizrahi, V., & Stegeman, G. I. (1991).
Correlation of defect centers with a wavelength-dependent photosensitive
response in germania-doped silica optical fibers. Optics letters, 16(3), 141-143.
Singh, N., Jain, S. C., & Aggarwal, A. K. (2002, February). Fabrication of In-Fiber Bragg
Gratings using phase mask technique. In National conference on Advances in
contemporary physics and energy (pp. 172-173).
Skuja, L. N., Trukhin, A. N., & Plaudis, A. E. (1984). Luminescence in Germanium‐Doped Glassy SiO2. physica status solidi (a), 84(2), K153-K157.
151
Smietana, M., Korwin-Pawlowski, M. L., Bock, W. J., Pickrell, G. R., & Szmidt, J.
(2008). Refractive index sensing of fiber optic long-period grating structures
coated with a plasma deposited diamond-like carbon thin film.Measurement
Science and Technology, 19(8), 085301.
Starodubov, D. S., Grubsky, V., Feinberg, J., Kobrin, B., & Juma, S. (1997). Bragg
grating fabrication in germanosilicate fibers by use of near-UV light: a new
pathway for refractive-index changes. Optics letters, 22(14), 1086-1088.
Stepanov, D. Y., Canning, J., & Brodzeli, Z. (1999, November). Real-time
characterisation of fibre grating Fabry-Perots and phase-shifted gratings with 100
kHz resolution. In Technical Digest-Symposium on Optical Fiber Measurements,
1998 (Vol. 930, p. 149). DIANE Publishing.
Stephens, T., Krug, P. A., Brodzeli, Z., Dhosi, G., Ouellette, F., & Poladian, L. (1996).
257 km transmission at 10 Gbit/s in non-dispersion-shifted fibre using an
unchirped fibre Bragg grating dispersion compensator. Electronics
Letters, 32(17), 1599-1601.
Storøy, H., Engan, H. E., Sahlgren, B., & Stubbe, R. (1997). Position weighting of fiber
Bragg gratings for bandpass filtering. Optics letters, 22(11), 784-786.
Sugden, K., Bennion, I., Molony, A., & Copner, N. J. (1994). Chirped gratings produced
in photosensitive optical fibres by fibre deformation during exposure. Electronics
letters, 30(5), 440-442.
Sun, J., Li, Y., & Liu, D. (2005). Widely tunable long-period fiber gratings with
interpolymers as sensitivity-enhanced materials. Optics communications, 249(1),
193-200.
Takahashi, M., Fujiwara, T., Kawachi, T., & Ikushima, A. J. (1997). Defect formation in
GeO2-SiO2 glass by poling with ArF laser excitation. Applied physics letters, 71,
993-995.
Thompson, A. C., Cadusch, P. J., Robertson, D. F., Stoddart, P. R., & Wade, S. A. (2012).
Origins of spectral changes in fiber Bragg gratings due to macrobending. Journal
of Lightwave Technology, 30(22), 3500-3511.
Tomozawa, M., Kim, D. L., & Lou, V. (2001). Preparation of high purity, low water
content fused silica glass. Journal of non-crystalline solids, 296(1), 102-106.
152
Townsend, J. E., Poole, S. B., & Payne, D. (1987). Solution-doping technique for
fabrication of rare-earth-doped optical fibres. Electronics Letters, 7(23), 329-331.
Trpkovski, S., Kitcher, D. J., Baxter, G. W., Collins, S. F., & Wade, S. A. (2005). High-
temperature-resistant chemical composition Bragg gratings in Er 3+-doped optical
fiber. Optics letters, 30(6), 607-609.
Tsai, T. E., Williams, G. M., & Friebele, E. J. (1998). Uniform component of index
structure induced in Ge-SiO2 fibers by spatially modulated ultraviolet
light. Applied physics letters, 72(25), 3243-3245.
Vengsarkar, A. M., Lemaire, P. J., Judkins, J. B., Bhatia, V., Erdogan, T., & Sipe, J. E.
(1996). Long-period fiber gratings as band-rejection filters. Journal of lightwave
technology, 14(1), 58-65.
Violakis, G., Limberger, H. G., Mashinsky, V. M., & Dianov, E. M. (2011). Fabrication
and thermal decay of fiber Bragg gratings in pristine and H 2-loaded Bi-Al co-
doped optical fibers. Optics express, 19(26), B350-B356.
Wade, S. A., Robertson, D. F., Thompson, A. C., & Stoddart, P. R. (2011). Changes in
spectral properties of fibre Bragg gratings owing to bending.Electronics
Letters, 47(9), 558-559.
Wang, T., Shao, L. Y., Canning, J., & Cook, K. (2013). Regeneration of fiber Bragg
gratings under strain. Applied optics, 52(10), 2080-2085.
Wang, Y., Phillips, L., Yelleswarapu, C., George, T., Sharma, A., Burgett, S., & Ruffin,
P. (1999). Enhanced growth rate for Bragg grating formation in optical fibers with
titania-doped outer cladding. Optics communications, 163(4), 185-188.
Williams, D. L., & Smith, R. P. (1995). Accelerated lifetime tests on UV written intra-
core gratings in boron germania codoped silica fibre. Electronics Letters, 31(24),
2120-2121.
Williams, D. L., Ainslie, B. J., Armitage, J. R., Kashyap, R., & Campbell, R. (1993).
Enhanced UV photosensitivity in boron codoped germanosilicate
fibres. Electronics Letters, 29(1), 45-47.
Williams, D. L., Davey, S. T., Kashyap, R., Armitage, J. R., & Ainslie, B. J. (1992).
Direct observation of UV induced bleaching of 240 nm absorption band in
photosensitive germanosilicate glass fibres. Electronics Letters, 28, 369-371.
153
Wong, D., Poole, S. B., & Sceats, M. G. (1992). Stress-birefringence reduction in
elliptical-core fibers under ultraviolet irradiation. Optics letters, 17(24), 1773-
1775.
Xie, W. X., Niay, P., Bernage, P., Douay, M., Bayon, J. F., Georges, T., ... & Poumellec,
B. (1993). Experimental evidence of two types of photorefractive effects occuring
during photoinscriptions of Bragg gratings within germanosilicate fibres. Optics
communications, 104(1-3), 185-195.
Yablon, A. D. (2004). Optical and mechanical effects of frozen-in stresses and strains in
optical fibers. IEEE Journal of Selected Topics in Quantum Electronics, 10(2),
300-311.
Yablon, A. D., Yan, M. F., Wisk, P., DiMarcello, F. V., Fleming, J. W., Reed, W. A., ...
& Lines, M. E. (2003, March). Anomalous refractive index changes in optical
fibers resulting from frozen-in viscoelastic strain. In Optical Fiber
Communication Conference (p. PD06). Optical Society of America.
Yang, H. Z., Qiao, X. G., Das, S., & Paul, M. C. (2014). Thermal regenerated grating
operation at temperatures up to 1400° C using new class of multimaterial glass-
based photosensitive fiber. Optics letters, 39(22), 6438-6441.
Yariv, A. (1973). Coupled-mode theory for guided-wave optics. IEEE Journal of
Quantum Electronics, 9(9), 919-933.
Yoffe, G. W., Krug, P. A., Ouellette, F., & Thorncraft, D. A. (1995). Passive temperature-
compensating package for optical fiber gratings. Applied Optics, 34(30), 6859-
6861.
Zhang, B., & Kahrizi, M. (2007). High-temperature resistance fiber Bragg grating
temperature sensor fabrication. IEEE Sensors Journal, 7(4), 586-591.
Zhang, J., Herman, P. R., Lauer, C., Chen, K. P., & Wei, X. M. (2001, June). 157-nm
laser-induced modification of fused-silica glasses. In Photonics West 2001-
LASE (pp. 125-132). International Society for Optics and Photonics.
154
LIST OF PUBLICATIONS AND PAPERS PRESENTED
Thesis related publications by the author
1. Lim, K. S., Gunawardena, D. S., Lai, M. H., Islam, M. R., Yang, H. Z., Qiao,
X., ... & Ahmad, H. (2015). Characterization of phasemask interference visibility
and the evolution of grating visibility during grating formation. Measurement, 64,
163-167.
2. Gunawardena, D. S., Lai, M. H., Lim, K. S., Ali, M. M., & Ahmad, H. (2015).
Measurement of grating visibility of a fiber Bragg grating based on bent-spectral
analysis. Applied optics, 54(5), 1146-1151.
3. Gunawardena, D. S., Mat-Sharif, K. A., Tamchek, N., Lai, M. H., Omar, N. Y.,
Emami, S. D., ... & Ahmad, H. (2015). Photosensitivity of gallium-doped silica
core fiber to 193 nm ArF excimer laser. Applied optics, 54(17), 5508-5512.
4. Gunawardena, D. S., Mat-Sharif, K. A., Lai, M. H., Lim, K. S., Tamchek, N.,
Omar, N. Y., ... & Ahmad, H. (2016). Thermal Activation of Regenerated Grating
in Hydrogenated Gallosilicate Fiber. IEEE Sensors Journal, 16(6), 1659-1664.
5. Gunawardena, D. S., Lai, M. H., Lim, K. S., Malekmohammadi, A., & Ahmad,
H. (2016). Fabrication of thermal enduring FBG sensor based on thermal induced
reversible effect. Sensors and Actuators A: Physical, 242, 111-115.
6. Gunawardena, D. S., Lai, M. H., Lim, K. S., & Ahmad, H. (2016). Impact of
CO2 Laser Pre-treatment on the Thermal Endurance of Bragg Gratings. Journal
of Optical Society Korea, 20(5), 575-578.
7. Gunawardena, D. S., Lai, M. H., Lim, K. S., & Ahmad, H. (2016). Thermal
Decay Analysis of Fiber Bragg Gratings using Demarcation Energy
Approximation. Optical Fiber Technology, (Under Review).
Conference/Colloquium/Seminar contributions by the author
1. Gunawardena, D. S., Lai, M. H., Lim, K. S., & Ahmad, H. (2015, February).
Enhanced Photosensitivity in 248nm KrF and 193nm ArF Excimer Laser
Irradiated Germanosilicate Fiber. In International Conference on Technological
Advances in Electrical, Electronics and Computer Engineering (ICTAEECE),
Kuala Lumpur, Malaysia.
155
2. Gunawardena, D. S., Lai, M. H., Lim, K. S., & Ahmad, H. (2015, November).
Analysis of Thermal Decay Characteristics of UV-induced FBGs Pre-treated with
CO2 Laser. In International OSA Network of Students Conference on Optics,
Atoms and Laser Applications (IONS KOALA), Auckland, New Zealand.
3. Gunawardena, D. S., (2016, April). Photosensitivity Enhancement and
Characterising Grating Strength of Fiber Bragg Gratings. In Finding Research
Seminar, Institute of Graduate Studies, University of Malaya, Kuala Lumpur,
Malaysia.
4. Gunawardena, D. S., (2016, March). Discovery of an Optical Fiber Sensor
Durable for a 1000 Years. In University of Malaya Three Minute Thesis
Competition (UM3MT), University of Malaya, Kuala Lumpur, Malaysia.
5. Gunawardena, D. S., (2016, March). Photosensitivity Enhancement and
Characterising Grating Strength of Fiber Bragg Gratings. In Candidature Defence
Seminar, Institute of Graduate Studies, University of Malaya, Kuala Lumpur,
Malaysia.
6. Gunawardena, D. S., (2015, February). Photosensitivity and Characterising
Grating Strength of Fiber Bragg Gratings. In Proposal Defence Seminar, Institute
of Graduate Studies, University of Malaya, Kuala Lumpur, Malaysia.
7. Gunawardena, D. S., Lim, K. S., & Ahmad, H. (2015, June). Grating Visibility
Measurement of a Fiber Bragg Grating using Bent Spectral Analysis. In Annual
physics colloquium, University of Malaya, Kuala Lumpur, Malaysia.
8. Lai, M. H., Gunawardena, D. S., Lim, K. S., & Ahmad, H. (2015, December).
Cooling-Rate Induced Fiber Birefringence Variation in Regenerated High
Birefringent Fiber. In 18th International Conference on Photonics (ICP 2015),
Penang, Malaysia.
9. Lim, K. S., Lai, M. H., Gunawardena, D. S., & Ahmad, H. (2015, November).
Fabrication of regenerated grating using carbon dioxide laser. In Workshop on
Specialty Optical Fibers and their Applications, Hong Kong (pp. WF4A-5).
Optical Society of America.
Other related publications by the author during the candidature
1. Islam, M. R., Gunawardena, D. S., Lee, Y. S., Lim, K. S., Yang, H. Z., & Ahmad,
H. (2016). Fabrication and characterization of laser-ablated cladding resonances
of two different-diameter photosensitive optical fibers. Sensors and Actuators A:
Physical, 243, 111-116.
156
2. Lai, M. H., Gunawardena, D. S., Lim, K. S., Machavaram, V. R., Lee, S. H.,
Chong, W. Y., ... & Ahmad, H. (2016). Thermal activation of regenerated fiber
Bragg grating in few mode fibers. Optical Fiber Technology, 28, 7-10.
3. Lai, M. H., Gunawardena, D. S., Lim, K. S., Yang, H. Z., & Ahmad, H. (2015).
Observation of grating regeneration by direct CO2 laser annealing. Optics
express, 23(1), 452-463.
4. Nazal, N. A. M., Gunawardena, D. S., Zaini, M. K. A., Lim, K. S., Chong, W.
Y., & Ahmad, H. (2016). Thermal properties of regenerated gratings in optical
fibers of different core size. Applied Optics, (Under Review).
5. Lai, M. H., Lim, K. S., Gunawardena, D. S., Lee, Y. S., & Ahmad, H. (2016).
Review of CO2 laser applications in optical fiber components fabrication and
treatment. Infrared Physics and Technology, (Under Review).
6. Lai, M. H., Lim, K. S., Gunawardena, D. S., Yang, H. Z., Chong, W. Y., &
Ahmad, H. (2015). Thermal stress modification in regenerated fiber Bragg grating
via manipulation of glass transition temperature based on CO2-laser
annealing. Optics letters, 40(5), 748-751.
7. Ali, M. M., Islam, R., Lim, K. S., Gunawardena, D. S., Yang, H. Z., & Ahmad,
H. (2015). PCF-Cavity FBG Fabry-Perot Resonator for Simultaneous
Measurement of Pressure and Temperature. IEEE Sensors Journal, 15(12), 6921-
6925.
8. Lai, M. H., Lim, K. S., Islam, M. R., Gunawardena, D. S., Yang, H. Z., &
Ahmad, H. (2015). Effect of CO 2 Laser Annealing on Stress Applying Parts
Contributing Toward Birefringence Modification in Regenerated Grating in
Polarization Maintaining Fiber. IEEE Photonics Journal, 7(5), 1-9.
9. Islam, M. R., Ali, M. M., Lai, M. H., Lim, K. S., Gunawardena, D. S.,
Machavaram, V. R., & Ahmad, H. (2015). Wide-range in-fibre Fabry-Perot
resonator for ultrasonic sensing. IET Optoelectronics, 9(3), 136-140.
10. Yang, H. Z., Ali, M. M., Islam, M. R., Lim, K. S., Gunawardena, D. S., &
Ahmad, H. (2015). Cladless few mode fiber grating sensor for simultaneous
refractive index and temperature measurement. Sensors and Actuators A:
Physical, 228, 62-68.
11. Liu, H., Yang, H. Z., Qiao, X. G., Hu, M. L., Feng, Z. Y., Wang, R., Rong, Q.,
Gunawardena, D. S., Lim, K. S., & Ahmad, H. (2016). Strain measurement at
high temperature environment based on Fabry-Perot interferometer cascaded fiber
157
regeneration grating. Sensors and Actuator A: Physical, Sensors and Actuator A:
Physical, 248, 199-205.
12. Yang, H. Z., Liu, H., Wang, Y., Qiao, X. G., Su, D., Li, L., Lim, K. S.,
Gunawardena, D. S., & Ahmad, H. (2016). Strain measurement at temperatures
up to 800 ˚C using regenerated gratings produced in the high Ge doped and B/Ge
co-doped fibers. IEEE Sensors Journal, (Under Review).
Author’s awards and honours during the candidature
1. 1st Runner Up (Faculty Level) at the 3 minute thesis competition (UM3MT)
organised by the University of Malaya, Kuala Lumpur, Malaysia, 2016.
2. Awarded with a conference travel grant to attend International OSA Network of
Students Conference on Optics, Atoms and Laser Applications (IONS KOALA),
Auckland, New Zealand, 2015.
3. Excellent paper award for the best presentation at the 10th international
conference on Technological Advances in Electrical, Electronics and Computer
Engineering (ICTAEECE), The International Institute of Engineers and
Researchers, Kuala Lumpur, Malaysia, 2015.
4. Awarded with a conference travel grant to attend 10th international conference
on Technological Advances in Electrical, Electronics and Computer Engineering
(ICTAEECE), The International Institute of Engineers and Researchers, Kuala
Lumpur, Malaysia, 2015.
5. Selected for the 5th Summer School on Lasers and Laser Applications
(SSOLLA 2014) organised for young scientists from Asia by the Advanced
Photonics Research Institute (APRI), Gwangju Institute of Science and
Technology, Gwangju, South Korea, 2014.
6. Awarded with IPPP grant by University of Malaya to conduct Ph.D. research
under the grant no. PG004-2014A.
7. Completely funded Bright Sparks Scholarship to conduct research throughout
the Ph.D. candidature (2013-2016) at University of Malaya, Kuala Lumpur,
Malaysia.
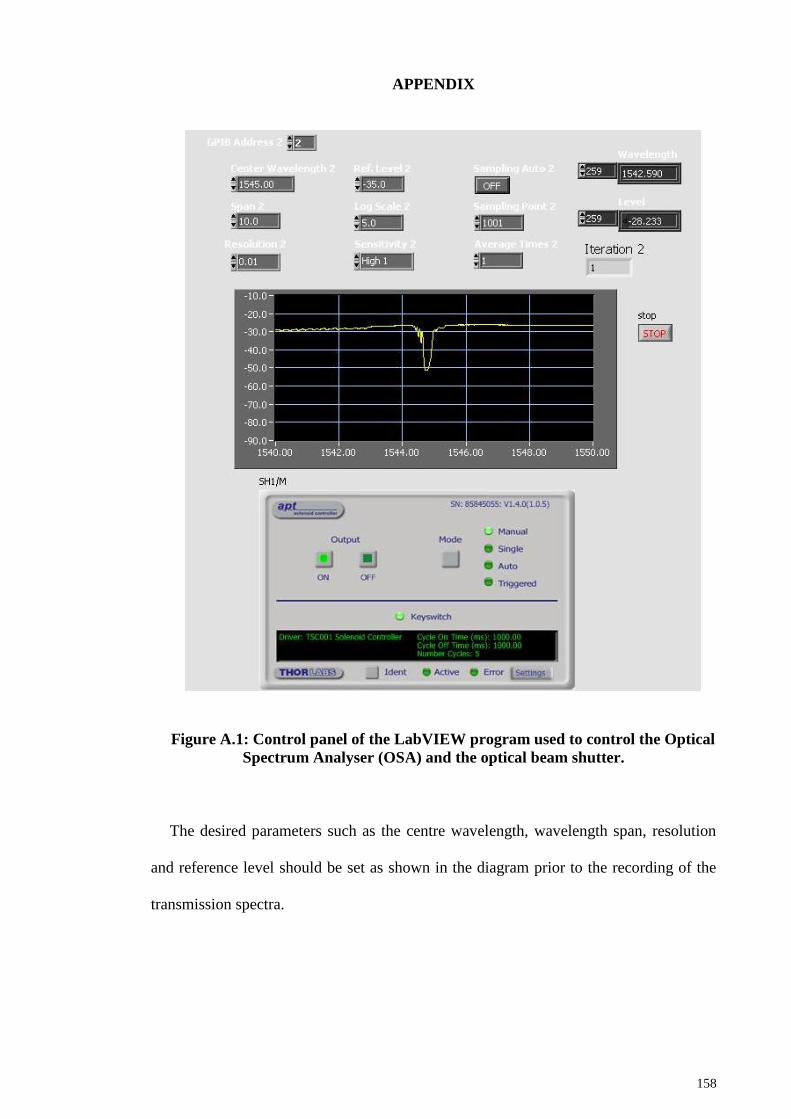
158
APPENDIX
Figure A.1: Control panel of the LabVIEW program used to control the Optical
Spectrum Analyser (OSA) and the optical beam shutter.
The desired parameters such as the centre wavelength, wavelength span, resolution
and reference level should be set as shown in the diagram prior to the recording of the
transmission spectra.
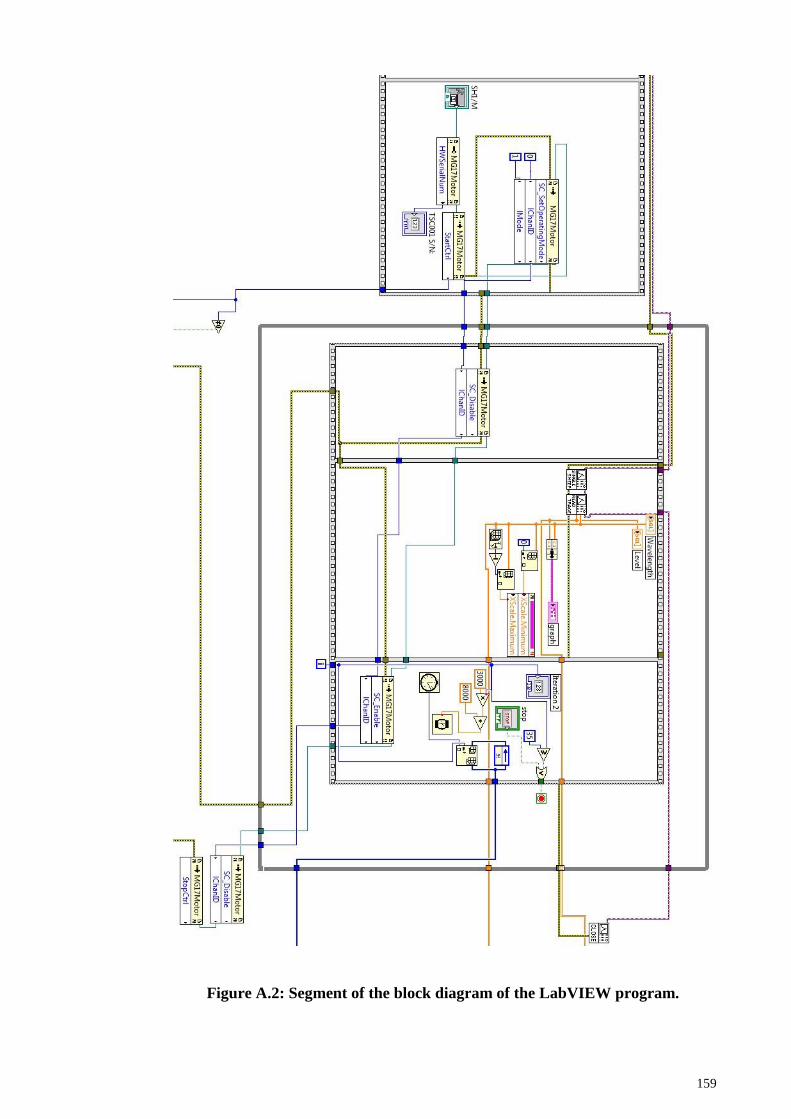
159
Figure A.2: Segment of the block diagram of the LabVIEW program.
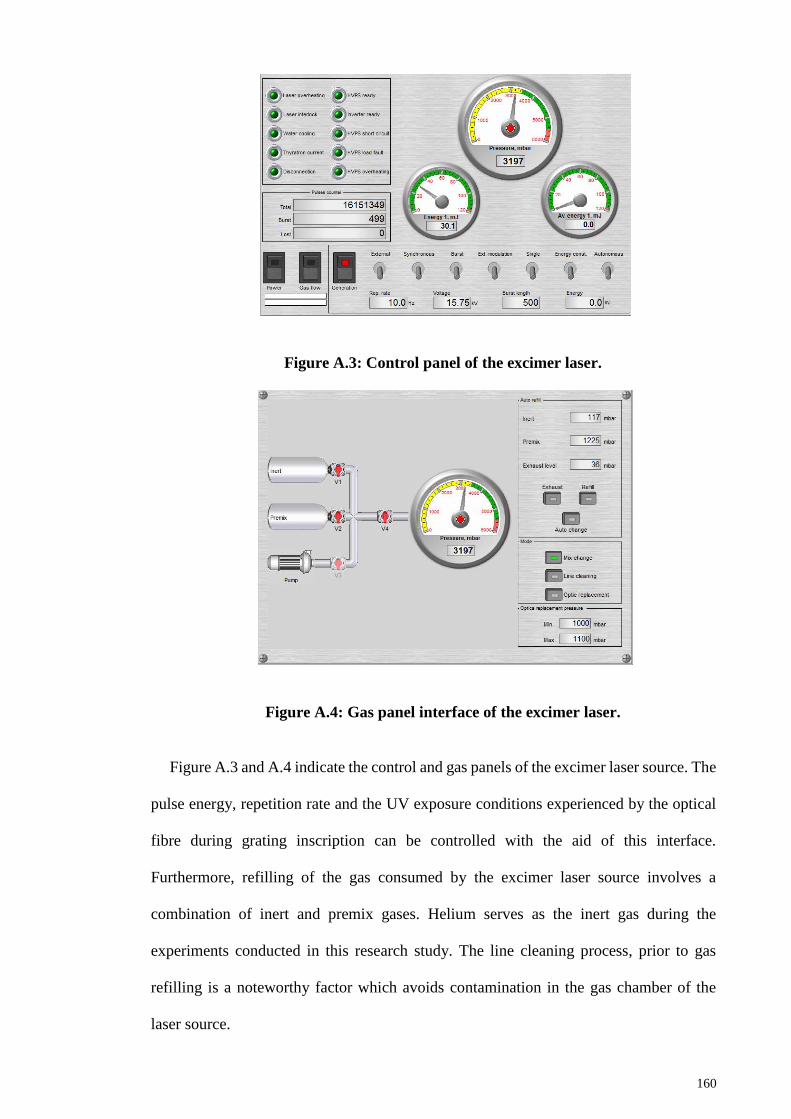
160
Figure A.3: Control panel of the excimer laser.
Figure A.4: Gas panel interface of the excimer laser.
Figure A.3 and A.4 indicate the control and gas panels of the excimer laser source. The
pulse energy, repetition rate and the UV exposure conditions experienced by the optical
fibre during grating inscription can be controlled with the aid of this interface.
Furthermore, refilling of the gas consumed by the excimer laser source involves a
combination of inert and premix gases. Helium serves as the inert gas during the
experiments conducted in this research study. The line cleaning process, prior to gas
refilling is a noteworthy factor which avoids contamination in the gas chamber of the
laser source.