Embed Size (px)
Citation preview
~ Pergamon 0042-6989(94)00122-7
Vision Res. Vol. 35, No. 2, pp. 23~254, 1995 Copyright © 1994 Elsevier Science Ltd
Printed in Great Britain. All rights reserved 0042-6989/95 $7.00 + 0.00
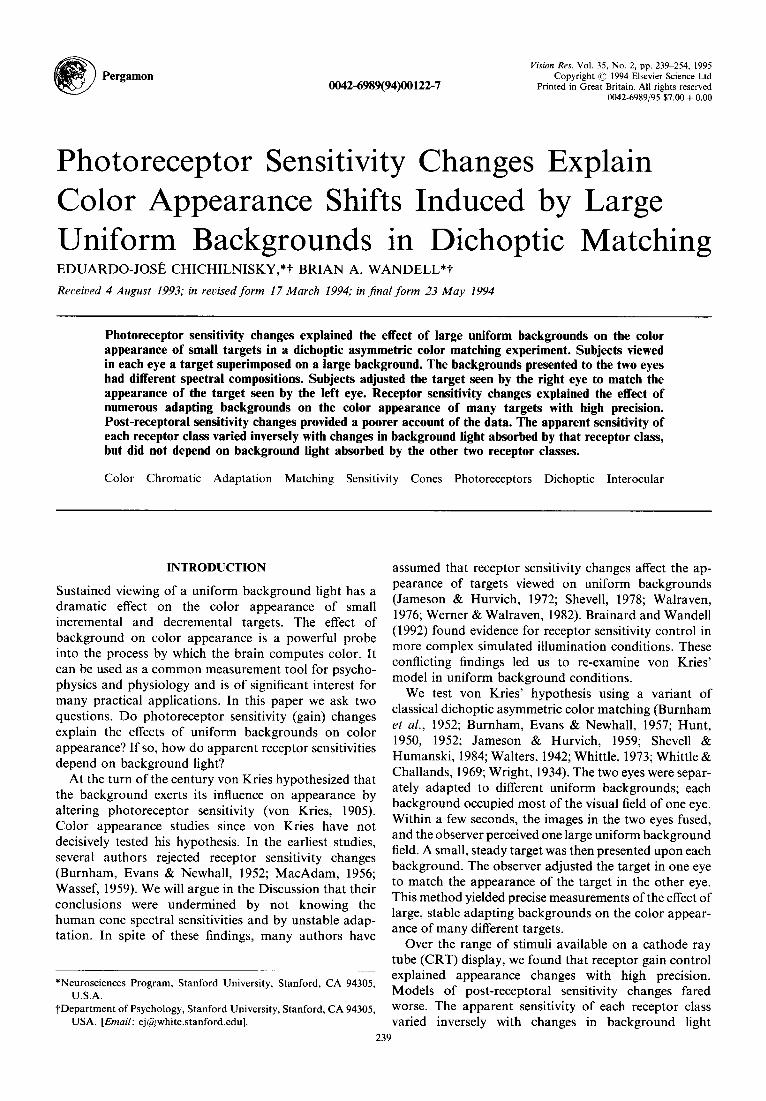
Photoreceptor Sensitivity Changes Explain Color Appearance Shifts Induced by Large Uniform Backgrounds in Dichoptic Matching EDUARDO-JOSI~ CHICHILNISKY,*t BRIAN A. WANDELL*t Received 4 August 1993; in revised form 17 March 1994; in final form 23 May 1994
Photoreceptor sensitivity changes explained the effect of large uniform backgrounds on the color appearance of small targets in a dichoptic asymmetric color matching experiment. Subjects viewed in each eye a target superimposed on a large background. The backgrounds presented to the two eyes had different spectral compositions. Subjects adjusted the target seen by the right eye to match the appearance of the target seen by the left eye. Receptor sensitivity changes explained the effect of numerous adapting backgrounds on the color appearance of many targets with high precision. Post-receptoral sensitivity changes provided a poorer account of the data. The apparent sensitivity of each receptor class varied inversely with changes in background light absorbed by that receptor class, but did not depend on background light absorbed by the other two receptor classes.
Color Chromatic Adaptation Matching Sensitivity Cones Photoreceptors Dichoptic Interocular
INTRODUCTION
Sustained viewing of a uniform background light has a dramatic effect on the color appearance of small incremental and decremental targets. The effect of background on color appearance is a powerful probe into the process by which the brain computes color. It can be used as a common measurement tool for psycho- physics and physiology and is of significant interest for many practical applications. In this paper we ask two questions. Do photoreceptor sensitivity (gain) changes explain the effects of uniform backgrounds on color appearance? If so, how do apparent receptor sensitivities depend on background light?
At the turn of the century von Kries hypothesized that the background exerts its influence on appearance by altering photoreceptor sensitivity (von Kries, 1905). Color appearance studies since von Kries have not decisively tested his hypothesis. In the earliest studies, several authors rejected receptor sensitivity changes (Burnham, Evans & Newhall, 1952; MacAdam, 1956; Wassef, 1959). We will argue in the Discussion that their conclusions were undermined by not knowing the human cone spectral sensitivities and by unstable adap- tation. In spite of these findings, many authors have
*Neurosciences Program, Stanford University, Stanford, CA 94305, U.S.A.
tDepa r tmen t of Psychology, Stanford University, Stanford, CA 94305, USA. [Email: [email protected]].
assumed that receptor sensitivity changes affect the ap- pearance of targets viewed on uniform backgrounds (Jameson & Hurvich, 1972; Shevell, 1978; Walraven, 1976; Werner & Walraven, 1982). Brainard and Wandell (1992) found evidence for receptor sensitivity control in more complex simulated illumination conditions. These conflicting findings led us to re-examine von Kries' model in uniform background conditions.
We test von Kries' hypothesis using a variant of classical dichoptic asymmetric color matching (Burnham et al., 1952; Burnham, Evans & Newhall, 1957; Hunt, 1950, 1952; Jameson & Hurvich, 1959; Shevell & Humanski, 1984; Waiters, 1942; Whittle, 1973; Whittle & Challands, 1969; Wright, 1934). The two eyes were separ- ately adapted to different uniform backgrounds; each background occupied most of the visual field of one eye. Within a few seconds, the images in the two eyes fused, and the observer perceived one large uniform background field. A small, steady target was then presented upon each background. The observer adjusted the target in one eye to match the appearance of the target in the other eye. This method yielded precise measurements of the effect of large, stable adapting backgrounds on the color appear- ance of many different targets.
Over the range of stimuli available on a cathode ray tube (CRT) display, we found that receptor gain control explained appearance changes with high precision. Models of post-receptoral sensitivity changes fared worse. The apparent sensitivity of each receptor class varied inversely with changes in background light
239
240 EDUARDO-JOSI~ CHICHILNISKY and BRIAN A. WANDELL
absorbed by that receptor class, but was independent of the background light absorbed by the others.
METHODS
Display Observers viewed a computer-controlled color C R T
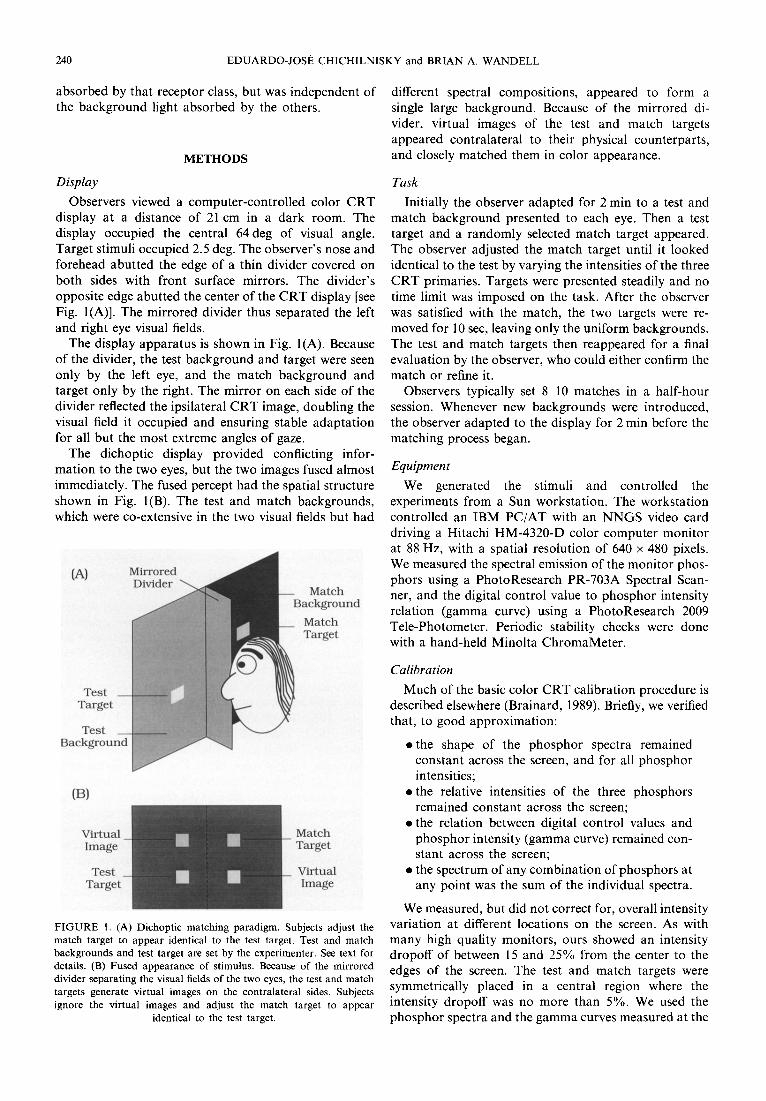
display at a distance of 21 cm in a dark room. The display occupied the central 64deg of visual angle. Target stimuli occupied 2.5 deg. The observer 's nose and forehead abutted the edge of a thin divider covered on both sides with front surface mirrors. The divider's opposite edge abutted the center of the C R T display [see Fig. I(A)]. The mirrored divider thus separated the left and right eye visual fields.
The display apparatus is shown in Fig. I(A). Because of the divider, the test background and target were seen only by the left eye, and the match background and target only by the right. The mirror on each side of the divider reflected the ipsilateral CRT image, doubling the visual field it occupied and ensuring stable adaptation for all but the most extreme angles of gaze.
The dichoptic display provided conflicting infor- mation to the two eyes, but the two images fused almost immediately. The fused percept had the spatial structure shown in Fig. I(B). The test and match backgrounds, which were co-extensive in the two visual fields but had
(A) Match
Background Match Target
different spectral compositions, appeared to form a single large background. Because of the mirrored di- vider, virtual images of the test and match targets appeared contralateral to their physical counterparts, and closely matched them in color appearance.
Task Initially the observer adapted for 2 min to a test and
match background presented to each eye. Then a test target and a randomly selected match target appeared. The observer adjusted the match target until it looked identical to the test by varying the intensities of the three C R T primaries. Targets were presented steadily and no time limit was imposed on the task. After the observer was satisfied with the match, the two targets were re- moved for 10 sec, leaving only the uniform backgrounds. The test and match targets then reappeared for a final evaluation by the observer, who could either confirm the match or refine it.
Observers typically set 8 10 matches in a half-hour session. Whenever new backgrounds were introduced, the observer adapted to the display for 2 min before the matching process began.
Equipment We generated the stimuli and controlled the
experiments from a Sun workstation. The workstation controlled an IBM PC/AT with an N N G S video card driving a Hitachi HM-4320-D color computer monitor at 88 Hz, with a spatial resolution of 640 × 480 pixels. We measured the spectral emission of the monitor phos- phors using a PhotoResearch PR-703A Spectral Scan- ner, and the digital control value to phosphor intensity relation (gamma curve) using a PhotoResearch 2009 Tele-Photometer. Periodic stability checks were done with a hand-held Minolta ChromaMeter .
Test Target
Test lackgroul
(B)
Virtual Image
Test Target
Match Target
Virtual Image
FIGURE 1. (A) Dichoptic matching paradigm. Subjects adjust the match target to appear identical to the test target. Test and match backgrounds and test target are set by the experimenter. See text for details. (B) Fused appearance of stimulus. Because of the mirrored divider separating the visual fields of the two eyes, the test and match targets generate virtual images on the contralateral sides. Subjects ignore the virtual images and adjust the match target to appear
identical to the test target.
Calibration Much of the basic color CRT calibration procedure is
described elsewhere (Brainard, 1989). Briefly, we verified that, to good approximation:
• the shape of the phosphor spectra remained constant across the screen, and for all phosphor intensities;
• the relative intensities of the three phosphors remained constant across the screen;
• the relation between digital control values and phosphor intensity (gamma curve) remained con- stant across the screen;
• the spectrum of any combination of phosphors at any point was the sum of the individual spectra.
We measured, but did not correct for, overall intensity variation at different locations on the screen. As with many high quality monitors, ours showed an intensity dropoff of between 15 and 25% from the center to the edges of the screen. The test and match targets were symmetrically placed in a central region where the intensity dropoff was no more than 5%. We used the phosphor spectra and the gamma curves measured at the
PHOTORECEPTOR SENSITIVITY AND COLOR APPEARANCE 241
{A) Background Chromaticities
- " " - - I - 5 2 0 ' l ' i ' i • , ' i • i •
530 0.8 ~" ~ . 540
510 r ~ 550 ~ 5 6 0
0.6 ~ j 5 7 0 5 o o - - - \ 5 8 o
,o9OI\ 4;\ . ,oo ~460--.~ ~ 400 _
0 . 0 i , , . ' ~ . . ~ 7 . i , , . i . I . i , i .
0.0 0.2 0.4 0.6 0.8
X
(B) Match Chromaticities
~ / " < - - . e 530 ' s 2 ° - - ~ ' ~ - ~ - ~ - - ~ - - w ~ l 0.8 I- /" ~ o -I
o.61 ~ 5 7 0 "I 500--- K ~;~ ~ . * ~ . ~ i 590
0.4 14 ".Z.~ll~.r'. \ ~ 600 -I
41i ::' 4 490-~ \ ~ ~ 630 3
0.0 ~ 0.0 0.2 0.4 0.6 0.8
X
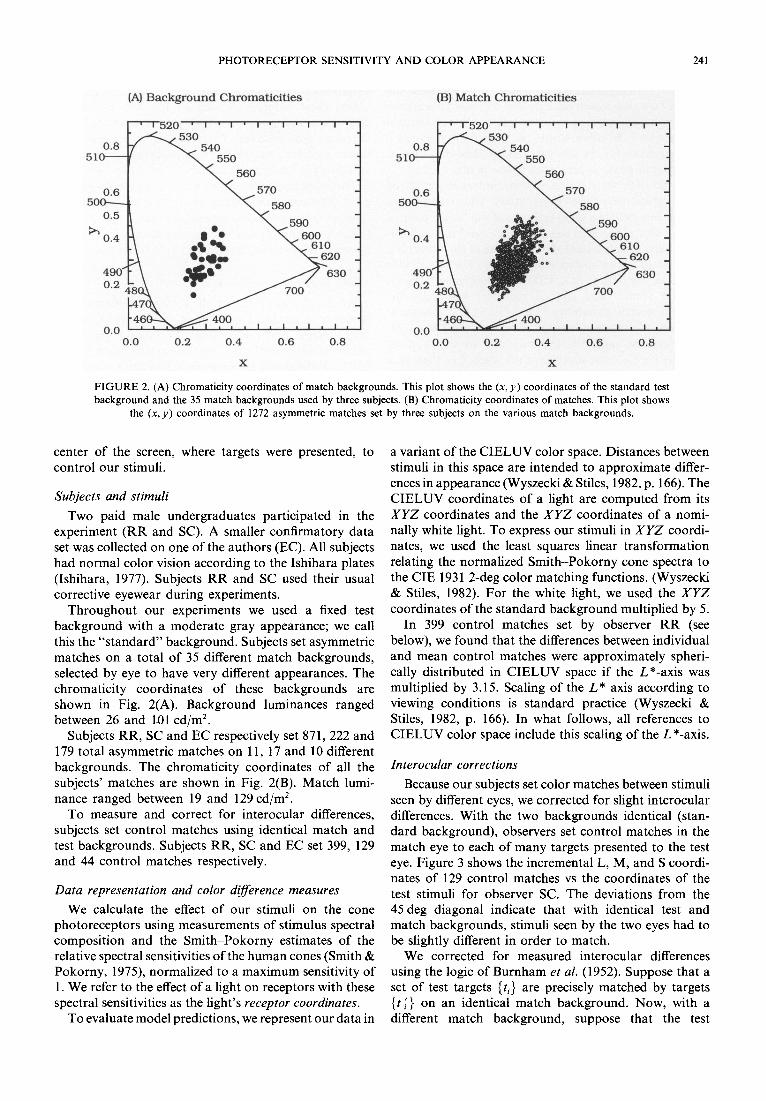
FIGURE 2. (A) Chromaticity coordinates of match backgrounds. This plot shows the (x, y) coordinates of the standard test background and the 35 match backgrounds used by three subjects. (B) Chromaticity coordinates of matches. This plot shows
the (x, y) coordinates of 1272 asymmetric matches set by three subjects on the various match backgrounds.
center of the screen, where targets were presented, to control our stimuli.
Subjects and stimuli Two paid male undergraduates participated in the
experiment (RR and SC). A smaller confirmatory data set was collected on one of the authors (EC). All subjects had normal color vision according to the Ishihara plates (Ishihara, 1977). Subjects RR and SC used their usual corrective eyewear during experiments.
Throughout our experiments we used a fixed test background with a moderate gray appearance; we call this the "s tandard" background. Subjects set asymmetric matches on a total of 35 different match backgrounds, selected by eye to have very different appearances. The chromaticity coordinates of these backgrounds are shown in Fig. 2(A). Background luminances ranged between 26 and 101 cd/m 2.
Subjects RR, SC and EC respectively set 871,222 and 179 total asymmetric matches on 11, 17 and 10 different backgrounds. The chromaticity coordinates of all the subjects' matches are shown in Fig. 2(B). Match lumi- nance ranged between 19 and 129 cd/m 2.
To measure and correct for interocular differences, subjects set control matches using identical match and test backgrounds. Subjects RR, SC and EC set 399, 129 and 44 control matches respectively.
Data representation and color difference measures We calculate the effect of our stimuli on the cone
photoreceptors using measurements of stimulus spectral composit ion and the Smi th-Pokorny estimates of the relative spectral sensitivities of the human cones (Smith & Pokorny, 1975), normalized to a maximum sensitivity of 1. We refer to the effect of a light on receptors with these spectral sensitivities as the light's receptor coordinates.
To evaluate model predictions, we represent our data in
a variant of the C I E L U V color space. Distances between stimuli in this space are intended to approximate differ- ences in appearance (Wyszecki & Stiles, 1982, p. 166). The C I E L U V coordinates of a light are computed from its X Y Z coordinates and the X Y Z coordinates of a nomi- nally white light. To express our stimuli in X Y Z coordi- nates, we used the least squares linear transformation relating the normalized Smith-Pokorny cone spectra to the CIE 1931 2-deg color matching functions. (Wyszecki & Stiles, 1982). For the white light, we used the X Y Z coordinates of the standard background multiplied by 5.
In 399 control matches set by observer RR (see below), we found that the differences between individual and mean control matches were approximately spheri- cally distributed in C I E L U V space if the L*-axis was multiplied by 3.15. Scaling of the L* axis according to viewing conditions is standard practice (Wyszecki & Stiles, 1982, p. 166). In what follows, all references to C IELUV color space include this scaling of the L*-axis.
Interocular corrections Because our subjects set color matches between stimuli
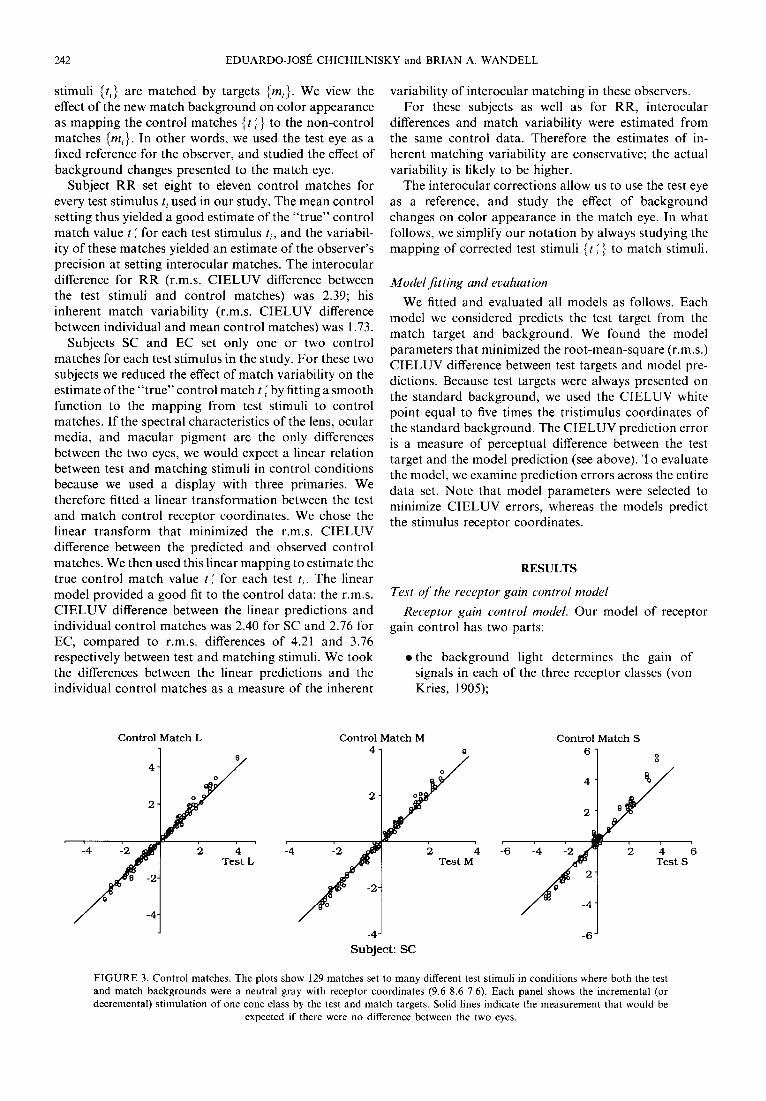
seen by different eyes, we corrected for slight interocular differences. With the two backgrounds identical (stan- dard background), observers set control matches in the match eye to each of many targets presented to the test eye. Figure 3 shows the incremental L, M, and S coordi- nates of 129 control matches vs the coordinates of the test stimuli for observer SC. The deviations from the 45 deg diagonal indicate that with identical test and match backgrounds, stimuli seen by the two eyes had to be slightly different in order to match.
We corrected for measured interocular differences using the logic of Burnham et al. (1952). Suppose that a set of test targets {ti} are precisely matched by targets {t~} on an identical match background. Now, with a different match background, suppose that the test
242 EDUARDO-JOSI~ CHICHILNISKY and BRIAN A. WANDELL
stimuli {b} are matched by targets {mi}. We view the effect o f the new match background on color appearance as mapping the control matches {t;} to the non-cont ro l matches {mi}. In other words, we used the test eye as a fixed reference for the observer, and studied the effect o f background changes presented to the match eye.
Subject R R set eight to eleven control matches for every test stimulus ti used in our study. The mean control setting thus yielded a good estimate o f the " t rue" control match value t ~ for each test stimulus b, and the variabil- ity o f these matches yielded an estimate o f the observer 's precision at setting interocular matches. The interocular difference for R R (r.m.s. C I E L U V difference between the test stimuli and control matches) was 2.39; his inherent match variability (r.m.s. C I E L U V difference between individual and mean control matches) was 1.73.
Subjects SC and EC set only one or two control matches for each test stimulus in the study. For these two subjects we reduced the effect o f match variability on the estimate o f the " t rue" control match t ~ by fitting a smooth function to the mapping f rom test stimuli to control matches. I f the spectral characteristics o f the lens, ocular media, and macular pigment are the only differences between the two eyes, we would expect a linear relation between test and matching stimuli in control condit ions because we used a display with three primaries. We therefore fitted a linear t ransformat ion between the test and match control receptor coordinates. We chose the linear t ransform that minimized the r.m.s. C I E L U V difference between the predicted and observed control matches. We then used this linear mapping to estimate the true control match value t ; for each test t~. The linear model provided a good fit to the control data: the r.m.s. C I E L U V difference between the linear predictions and individual control matches was 2.40 for SC and 2.76 for EC, compared to r.m.s, differences o f 4.21 and 3.76 respectively between test and matching stimuli. We took the differences between the linear predictions and the individual control matches as a measure o f the inherent
variability o f interocular matching in these observers. For these subjects as well as for RR, interocular
differences and match variability were estimated from the same control data. Therefore the estimates o f in- herent matching variability are conservative; the actual variability is likely to be higher.
The interocular corrections allow us to use the test eye as a reference, and study the effect o f background changes on color appearance in the match eye. In what follows, we simplify our notat ion by always studying the mapping of corrected test stimuli {t~} to match stimuli.
Model fitting and evaluation We fitted and evaluated all models as follows. Each
model we considered predicts the test target f rom the match target and background. We found the model parameters that minimized the root-mean-square (r.m.s.) C I E L U V difference between test targets and model pre- dictions. Because test targets were always presented on the s tandard background, we used the C I E L U V white point equal to five times the tristimulus coordinates o f the s tandard background. The C I E L U V prediction error is a measure o f perceptual difference between the test target and the model prediction (see above). To evaluate the model, we examine prediction errors across the entire data set. Note that model parameters were selected to minimize C I E L U V errors, whereas the models predict the stimulus receptor coordinates.
RESULTS
Test of the receptor gain control model Receptor gain control model. Our model o f receptor
gain control has two parts:
• the background light determines the gain o f signals in each of the three receptor classes (von Kries, 1905);
Control Match L
Test L
Control Match M Control Match S :ly' 2 2
2 -4 ~ _ 2 _
-4 .
Subject: SC
~1- -'6 Test M
-6
FIGURE 3. Control matches. The plots show 129 matches set to many different test stimuli in conditions where both the test and match backgrounds were a neutral gray with receptor coordinates (9.6 8.6 7.6). Each panel shows the incremental (or decremental) stimulation of one cone class by the test and match targets. Solid lines indicate the measurement that would be
expected if there were no difference between the two eyes.
Test S
PHOTORECEPTOR SENSITIVITY AND COLOR APPEARANCE 243
• the color appearance of a small target depends on its incremental receptor coordinates (i.e. the difference between target and background recep- tor coordinates) (Walraven, 1976).
We tested the model using the following logic. Sup- pose each test target on background b is matched by some match target on background b'. We express the incremental receptor coordinates of the ith test and matching targets using the notation (t,~, tiM, t,s) and (miL, miM, m,s) respectively. Suppose that the gain of the L cones in the eye exposed to background b is given by gL, and that of the L cones in the eye exposed to background b' is g~_ (and similarly for the M and S cones). If receptoral gain control accounts for appear- ance changes, the test and match targets appear the same when the scaled incremental receptor signals are equal:
g L miL = gL tiL
g~m,M = gM tiM (1)
g'smis = gs t,s
o r
raiL = ( gL /g [ )tiL
miM = (gM/g'M)t,M (2)
mis = (gs/g~)t ,s .
Since a single scalar relates the incremental L cone coordinates of all the test and matching targets, this model predicts that a plot of miL VS tiL forms a straight line through the origin (and similarly for the M and S coordinates). The slope of this line is the ratio of the receptor gains associated with each background, gL/gL.
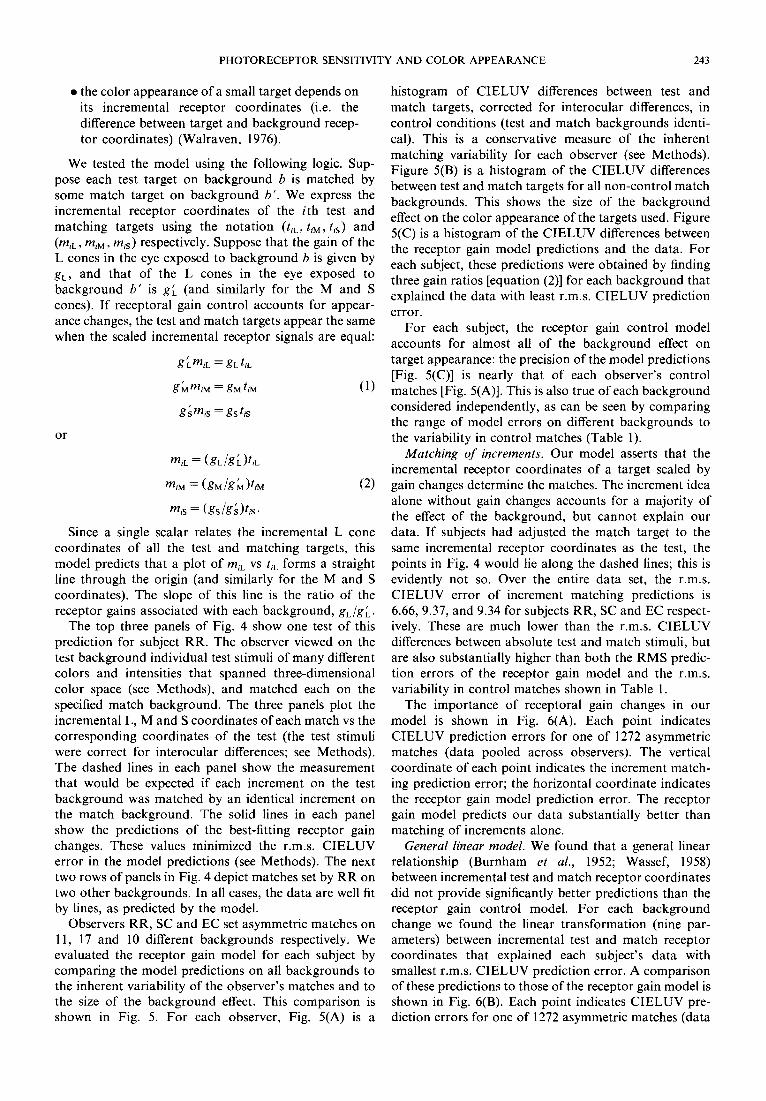
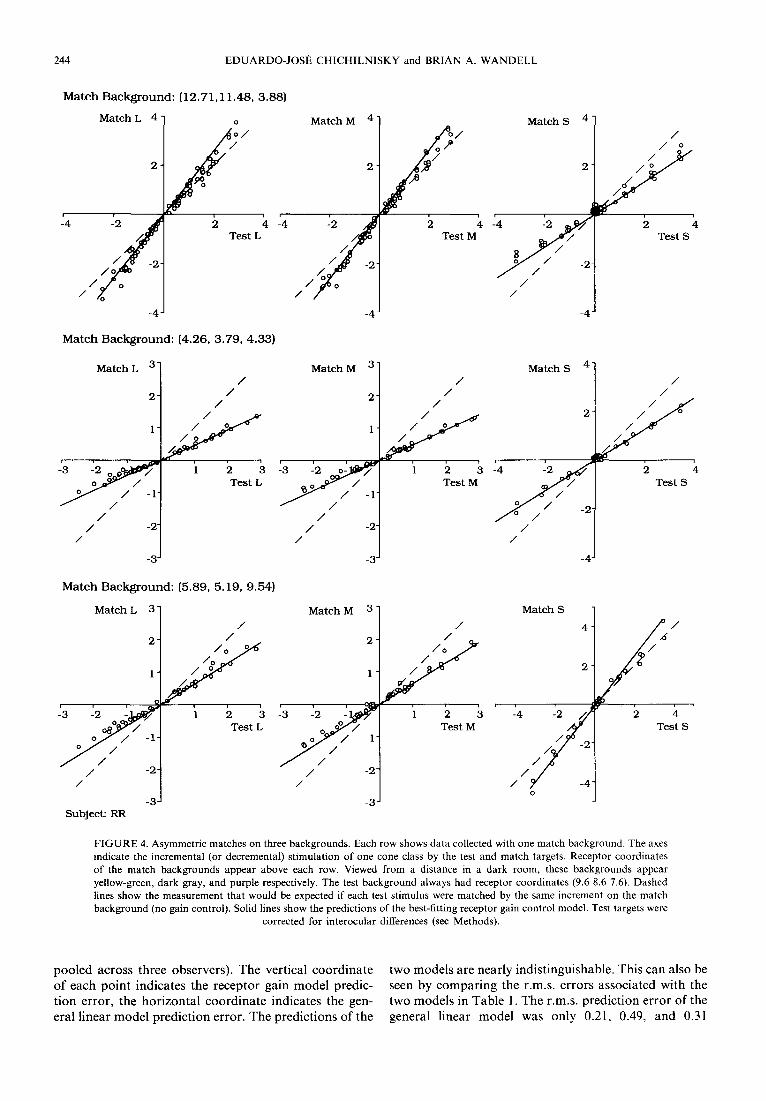
The top three panels of Fig. 4 show one test of this prediction for subject RR. The observer viewed on the test background individual test stimuli of many different colors and intensities that spanned three-dimensional color space (see Methods), and matched each on the specified match background. The three panels plot the incremental L, M and S coordinates of each match vs the corresponding coordinates of the test (the test stimuli were correct for interocular differences; see Methods). The dashed lines in each panel show the measurement that would be expected if each increment on the test background was matched by an identical increment on the match background. The solid lines in each panel show the predictions of the best-fitting receptor gain changes. These values minimized the r.m.s. CIELUV error in the model predictions (see Methods). The next two rows of panels in Fig. 4 depict matches set by RR on two other backgrounds. In all cases, the data are well fit by lines, as predicted by the model.
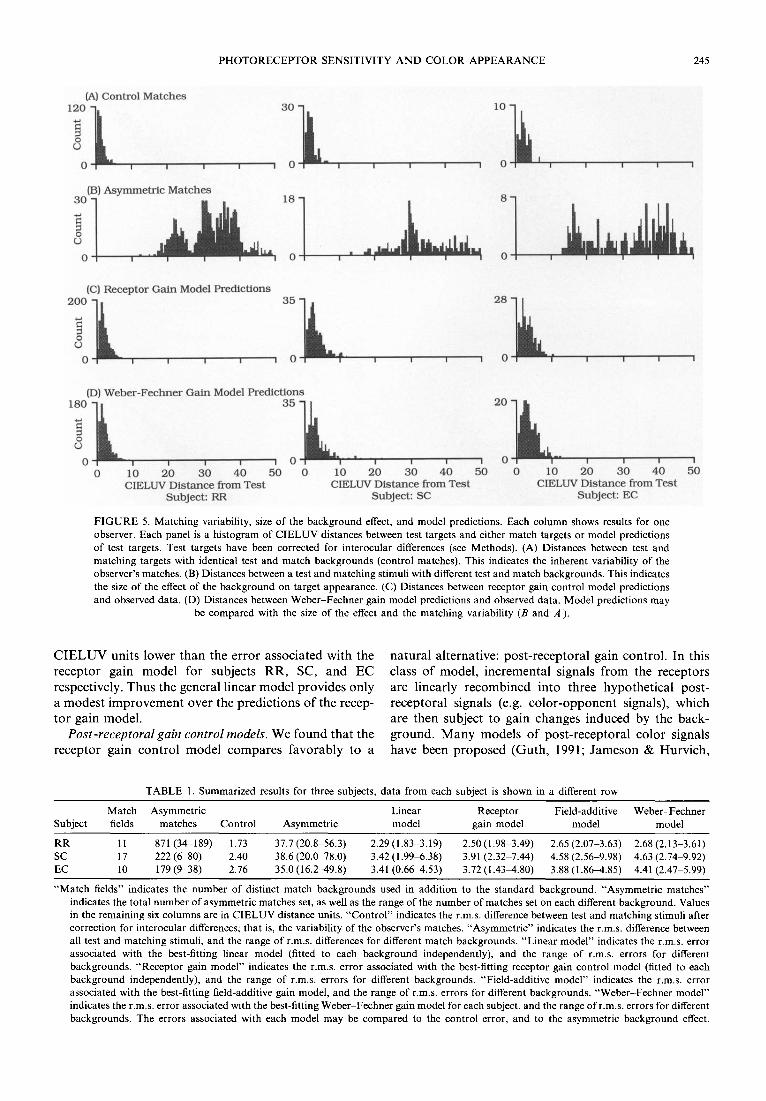
Observers RR, SC and EC set asymmetric matches on 11, 17 and 10 different backgrounds respectively. We evaluated the receptor gain model for each subject by comparing the model predictions on all backgrounds to the inherent variability of the observer's matches and to the size of the background effect. This comparison is shown in Fig. 5. For each observer, Fig. 5(A) is a
histogram of CIELUV differences between test and match targets, corrected for interocular differences, in control conditions (test and match backgrounds identi- cal). This is a conservative measure of the inherent matching variability for each observer (see Methods). Figure 5(B) is a histogram of the CIELUV differences between test and match targets for all non-control match backgrounds. This shows the size of the background effect on the color appearance of the targets used. Figure 5(C) is a histogram of the CIELUV differences between the receptor gain model predictions and the data. For each subject, these predictions were obtained by finding three gain ratios [equation (2)] for each background that explained the data with least r.m.s. CIELUV prediction error.
For each subject, the receptor gain control model accounts for almost all of the background effect on target appearance: the precision of the model predictions [Fig. 5(C)] is nearly that of each observer's control matches [Fig. 5(A)]. This is also true of each background considered independently, as can be seen by comparing the range of model errors on different backgrounds to the variability in control matches (Table 1).
Match ing o f increments. Our model asserts that the incremental receptor coordinates of a target scaled by gain changes determine the matches. The increment idea alone without gain changes accounts for a majority of the effect of the background, but cannot explain our data. If subjects had adjusted the match target to the same incremental receptor coordinates as the test, the points in Fig. 4 would lie along the dashed lines; this is evidently not so. Over the entire data set, the r.m.s. CIELUV error of increment matching predictions is 6.66, 9.37, and 9.34 for subjects RR, SC and EC respect- ively. These are much lower than the r.m.s. CIELUV differences between absolute test and match stimuli, but are also substantially higher than both the RMS predic- tion errors of the receptor gain model and the r.m.s. variability in control matches shown in Table 1.
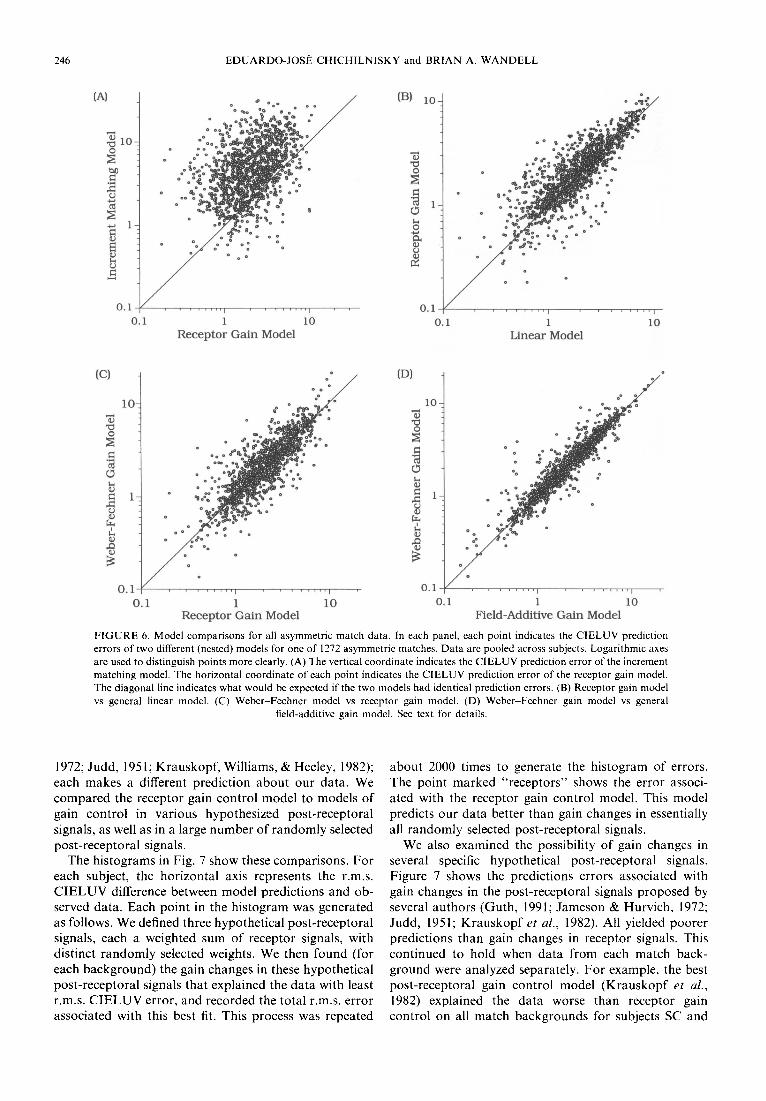
The importance of receptoral gain changes in our model is shown in Fig. 6(A). Each point indicates CIELUV prediction errors for one of 1272 asymmetric matches (data pooled across observers). The vertical coordinate of each point indicates the increment match- ing prediction error; the horizontal coordinate indicates the receptor gain model prediction error. The receptor gain model predicts our data substantially better than matching of increments alone.
General linear model. We found that a general linear relationship (Burnham et al., 1952; Wassef, 1958) between incremental test and match receptor coordinates did not provide significantly better predictions than the receptor gain control model. For each background change we found the linear transformation (nine par- ameters) between incremental test and match receptor coordinates that explained each subject's data with smallest r.m.s. CIELUV prediction error. A comparison of these predictions to those of the receptor gain model is shown in Fig. 6(B). Each point indicates CIELUV pre- diction errors for one of 1272 asymmetric matches (data
244 EDUARDO-JOSI~ CHICHILNISKY and BRIAN A. WANDELL
"4
Match Background : (12.71,11.48, 3.88)
Match L 1 ~ / ~ ; 4 o /
/ k -'4 "2 /~ Test L
/ o
- 4
Match M 4"
J /A / -2"
//
-4
/ o 2
2
Match S
:4 -'2 Test M 8 ~ r / /
~ 2 1
/ /
4 '
/ / o
2 /° ~ "j~/
4 Test S
- 4
Match Background : (4.26, 3.79, 4 .33)
Match L 3"
2
I
/ /
/ -2 /
- 3 -
/ /
/
/ / /
,
1 2 3 Test L
Match M 3 /
2 / /
1" / o
i i 1 :3 "2 ~ 1 2 3 ~~// / Test M
I 1 I
/ / -2-
/
-3
Match S 4 '
/ /
2.
2 4 Test S
"4 -'2
o /
/ /
Match B a c k g r o u n d : (5 .89 , 5 .19 , 9 .54)
Match L 3 "
/ 2 / /o Z
/ o 1" / j
1 2 Test L
-'3 -'2 o_ - ¢ - ~ / ~
o ~ / ~ / / / -I"
/ - 2 /
-3 Subject: RR
Match M
I
:3 :2 o:
/ - 2 /
- 3
3 /
/
1 2 3 Test M
Match S 4 /o/
2 / Z
2 4 Test S
"4 -'2 /
0
FIGURE 4. Asymmetric matches on three backgrounds. Each row shows data collected with one match background. The axes indicate the incremental (or decremental) stimulation of one cone class by the test and match targets. Receptor coordinates of the match backgrounds appear above each row. Viewed from a distance in a dark room, these backgrounds appear yellow-green, dark gray, and purple respectively. The test background always had receptor coordinates (9.6 8.6 7.6). Dashed lines show the measurement that would be expected if each test stimulus were matched by the same increment on the match background (no gain control). Solid lines show the predictions of the best-fitting receptor gain control model. Test targets were
corrected for interocular differences (see Methods).
poo led across three observers) . The vert ical coo rd ina t e o f each po in t indicates the recep tor gain mode l predic- t ion error , the hor i zon ta l coo rd ina t e indicates the gen- eral l inear mode l p red ic t ion error . The predic t ions o f the
two mode l s are near ly indis t inguishable . This can also be seen by compar ing the r.m.s, e r rors associa ted with the two models in Table 1. The r.m.s, p red ic t ion er ror o f the general l inear mode l was only 0.21, 0.49, and 0.31
PHOTORECEPTOR SENSITIVITY AND COLOR APPEARANCE 245
(A) Control Matches 1207L! ~ 3 0 ~ 1 0 ~
0 0 0 I ,
(B) Asymmetric Matches 30
O
0 ,
(C) Receptor Gain Model Predictions
0 , , , , , 0 u ~ , , , , , 0 l , , , ,
(D) Weber-Feehner Gain Model Predictions
L) 0 1 ' I I I I I I
0 10 20 30 40 50 0 I0 20 30 40 50 0 I0 20 30 40 50 CIELUV Distance from Test
Subject: EC
3 k__ 20 '1 I 0
CIELUV Distance from Test CIELUV Distance from Test Subject: RR Subject: SC
FIGURE 5. Matching variability, size of the background effect, and model predictions. Each column shows results for one observer. Each panel is a histogram of CIELUV distances between test targets and either match targets or model predictions of test targets. Test targets have been corrected for interocular differences (see Methods). (A) Distances between test and matching targets with identical test and match backgrounds (control matches). This indicates the inherent variability of the observer's matches. (B) Distances between a test and matching stimuli with different test and match backgrounds. This indicates the size of the effect of the background on target appearance. (C) Distances between receptor gain control model predictions and observed data. (D) Distances between Weber-Fechner gain model predictions and observed data. Model predictions may
be compared with the size of the effect and the matching variability (B and A ).
C I E L U V uni t s l o w e r t h a n the e r r o r a s soc i a t ed wi th the r e c e p t o r ga in m o d e l fo r subjec ts R R , SC, a n d E C respec t ive ly . T h u s the gene ra l l inear m o d e l p r o v i d e s on ly a m o d e s t i m p r o v e m e n t o v e r the p r e d i c t i o n s o f the recep- t o r ga in m o d e l .
Post-receptoral gain control models. W e f o u n d tha t the r e c e p t o r ga in c o n t r o l m o d e l c o m p a r e s f a v o r a b l y to a
n a t u r a l a l t e rna t ive : p o s t - r e c e p t o r a l ga in con t ro l . In this class o f m o d e l , i n c r e m e n t a l s ignals f r o m the r ecep to r s are l inear ly r e c o m b i n e d in to th ree h y p o t h e t i c a l pos t - r e c e p t o r a l s ignals (e.g. c o l o r - o p p o n e n t signals) , wh ich a re then subjec t to ga in changes i n d u c e d by the back - g r o u n d . M a n y m o d e l s o f p o s t - r e c e p t o r a l c o l o r s ignals h a v e been p r o p o s e d ( G u t h , 1991; J a m e s o n & H u r v i c h ,
TABLE 1. Summarized results for three subjects, data from each subject is shown in a different row
Match Asymmetric Linear Receptor Field-additive Weber-Fechner Subject fields matches Control Asymmetric model gain model model model
RR 11 871 (34-189) 1.73 37.7 (20.8-56.3) 2.29 (1.83-3.19) 2.50 (1.98 3.49) 2.65 (2.07-3.63) 2.68 (2.13-3.61) SC 17 222 (6~0) 2.40 38.6 (20.0~78.0) 3.42 (1.99~5.38) 3.91 (2.32 7.44) 4.58 (2.56-9.98) 4.63 (2.74-9.92) EC 10 179 (9-38) 2.76 35.0 (16.2-49.8) 3.41 (0.664.53) 3.72 (1.43-4.80) 3.88 (1.86-4.85) 4.41 (2.47 5.99)
"Match fields" indicates the number of distinct match backgrounds used in addition to the standard background. "Asymmetric matches" indicates the total number of asymmetric matches set, as well as the range of the number of matches set on each different background. Values in the remaining six columns are in CIELUV distance units. "Control" indicates the r.m.s, difference between test and matching stimuli after correction for interocular differences; that is, the variability of the observer's matches. "Asymmetric" indicates the r.m.s, difference between all test and matching stimuli, and the range of r.m.s, differences for different match backgrounds. "Linear model" indicates the r.m.s, error associated with the best-fitting linear model (fitted to each background independently), and the range of r.m.s, errors for different backgrounds. "Receptor gain model" indicates the r.m.s, error associated with the best-fitting receptor gain control model (fitted to each background independently), and the range of r.m.s, errors for different backgrounds. "Field-additive model" indicates the r.m.s, error associated with the best-fitting field-additive gain model, and the range of r.m.s, errors for different backgrounds. "Weber-Fechner model" indicates the r.m.s, error associated with the best-fitting Weber-Fechner gain model for each subject, and the range of r.m.s, errors for different backgrounds. The errors associated with each model may be compared to the control error, and to the asymmetric background effect.
246 EDUARDO-JOSI~ C H I C H I L N I S K Y and BRIAN A. W A N D E L L
(A)
,-• 10- o
0.1 O.
° , . / {B) 10- o , ~ 0~ e e o o o * /
0° a ° ~ - - ~ * " ° / °% v ' ~ ' ~ , . * /
" _ o
• • . 0
o $
. -
"'" - ' 4 , °0o: oo o o o
. . . . . . . . ~ . . . . . . . . I 0.1 1 I 0 0.1
Receptor Gain Model
o
0 t ~ . ~
o ° ~ o o
L : f . : °~"" ~ . o ~ ~ oos
. . . . . . . . i
1 10 Linear Model
(c)
10-
O
1- a~ o
. . . . . . . . I
o
o e o o
o 0 o • oe oo
• 8 • . . , . ~ ~ : - ":.." .~ ~ ~ . -
. ° .
o • • %
(D)
o
1 0
O t~
Q)
0.1 0. I
O . 1 . . . . . . . . I
o.I i io 1 Receptor Gain Model Field-Additive Gain Model
o
o o o ~
• ~ o ° o.ao
o o°w e°* ~ • •
i o "
10
F I G U R E 6. Model comparisons for all asymmetric match data. In each panel, each point indicates the CIELUV prediction errors of two different (nested) models for one of 1272 asymmetric matches. Data are pooled across subjects. Logarithmic axes are used to distinguish points more clearly. (A) The vertical coordinate indicates the CIELUV prediction error of the increment matching model. The horizontal coordinate of each point indicates the CIELUV prediction error of the receptor gain model. The diagonal line indicates what would be expected if the two models had identical prediction errors. (B) Receptor gain model vs general linear model. (C) Webe~Fechne r model vs receptor gain model. (D) Webe~Fechner gain model vs general
field-additive gain model. See text for details.
1972; Judd, 1951 ; Krauskopf, Williams, & Heeley, 1982); each makes a different prediction about our data. We compared the receptor gain control model to models of gain control in various hypothesized post-receptoral signals, as well as in a large number of randomly selected post-receptoral signals.
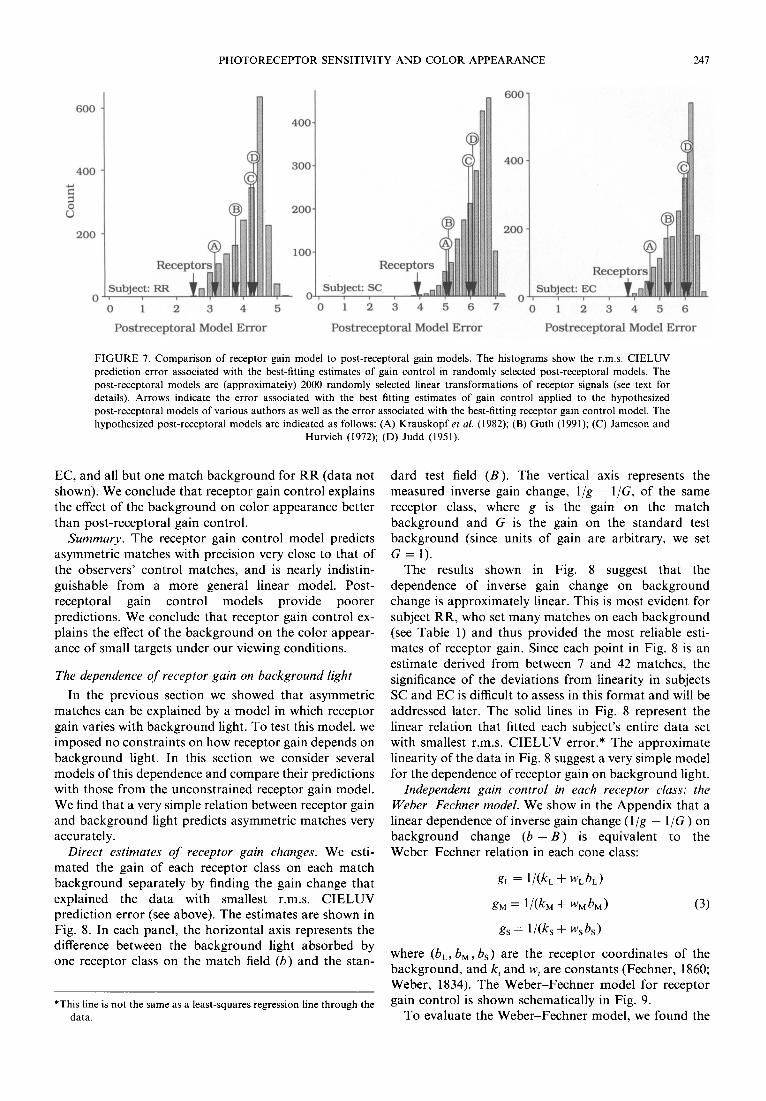
The histograms in Fig. 7 show these comparisons. For each subject, the horizontal axis represents the r.m.s. CIELUV difference between model predictions and ob- served data. Each point in the histogram was generated as follows. We defined three hypothetical post-receptoral signals, each a weighted sum of receptor signals, with distinct randomly selected weights. We then found (for each background) the gain changes in these hypothetical post-receptoral signals that explained the data with least r.m.s. CIELUV error, and recorded the total r.m.s, error associated with this best fit. This process was repeated
about 2000 times to generate the histogram of errors. The point marked "receptors" shows the error associ- ated with the receptor gain control model. This model predicts our data better than gain changes in essentially all randomly selected post-receptoral signals.
We also examined the possibility of gain changes in several specific hypothetical post-receptoral signals. Figure 7 shows the predictions errors associated with gain changes in the post-receptoral signals proposed by several authors (Guth, 1991; Jameson & Hurvich, 1972; Judd, 1951; Krauskopf et al., 1982). All yielded poorer predictions than gain changes in receptor signals. This continued to hold when data from each match back- ground were analyzed separately. For example, the best post-receptoral gain control model (Krauskopf et al., 1982) explained the data worse than receptor gain control on all match backgrounds for subjects SC and
PHOTORECEPTOR SENSITIVITY AND COLOR APPEARANCE 247
600
4OO
O r.j
2oo
Subject: RR
0 1 2 3 4 Postreceptoral Model Error
600
400
200
I R e c e p t o r s .].HHHHHHHH
o 5 0 I 2 3 4 5 6 7
Postreceptoral Model Error
t ReCeptor Jlil.. Su ect: E o . . 0 ® ° ° °
i i i ~ i i
0 1 2 3 4 5 6 Postreceptoral Model Error
FIGURE 7. Comparison of receptor gain model to post-receptoral gain models. The histograms show the r.m.s. CIELUV prediction error associated with the best-fitting estimates of gain control in randomly selected post-receptoral models. The post-receptoral models are (approximately) 2000 randomly selected linear transformations of receptor signals (see text for details). Arrows indicate the error associated with the best fitting estimates of gain control applied to the hypothesized post-receptoral models of various authors as well as the error associated with the best-fitting receptor gain control model. The hypothesized post-receptoral models are indicated as follows: (A) Krauskopf et al. (1982); (B) Guth (1991); (C) Jameson and
Hurvich (1972); (D) Judd (1951).
EC, and all but one match background for RR (data not shown). We conclude that receptor gain control explains the effect of the background on color appearance better than post-receptoral gain control.
Summary. The receptor gain control model predicts asymmetric matches with precision very close to that of the observers' control matches, and is nearly indistin- guishable from a more general linear model. Post- receptoral gain control models provide poorer predictions. We conclude that receptor gain control ex- plains the effect of the background on the color appear- ance of small targets under our viewing conditions.
The dependence o f receptor gain on background light In the previous section we showed that asymmetric
matches can be explained by a model in which receptor gain varies with background light. To test this model, we imposed no constraints on how receptor gain depends on background light. In this section we consider several models of this dependence and compare their predictions with those from the unconstrained receptor gain model. We find that a very simple relation between receptor gain and background light predicts asymmetric matches very accurately.
Direct estimates o f receptor gain changes. We esti- mated the gain of each receptor class on each match background separately by finding the gain change that explained the data with smallest r.m.s. CIELUV prediction error (see above). The estimates are shown in Fig. 8. In each panel, the horizontal axis represents the difference between the background light absorbed by one receptor class on the match field (b) and the stan-
*This line is not the same as a least-squares regression line through the data.
dard test field (B). The vertical axis represents the measured inverse gain change, 1/g - l/G, of the same receptor class, where g is the gain on the match background and G is the gain on the standard test background (since units of gain are arbitrary, we set G = l ) .
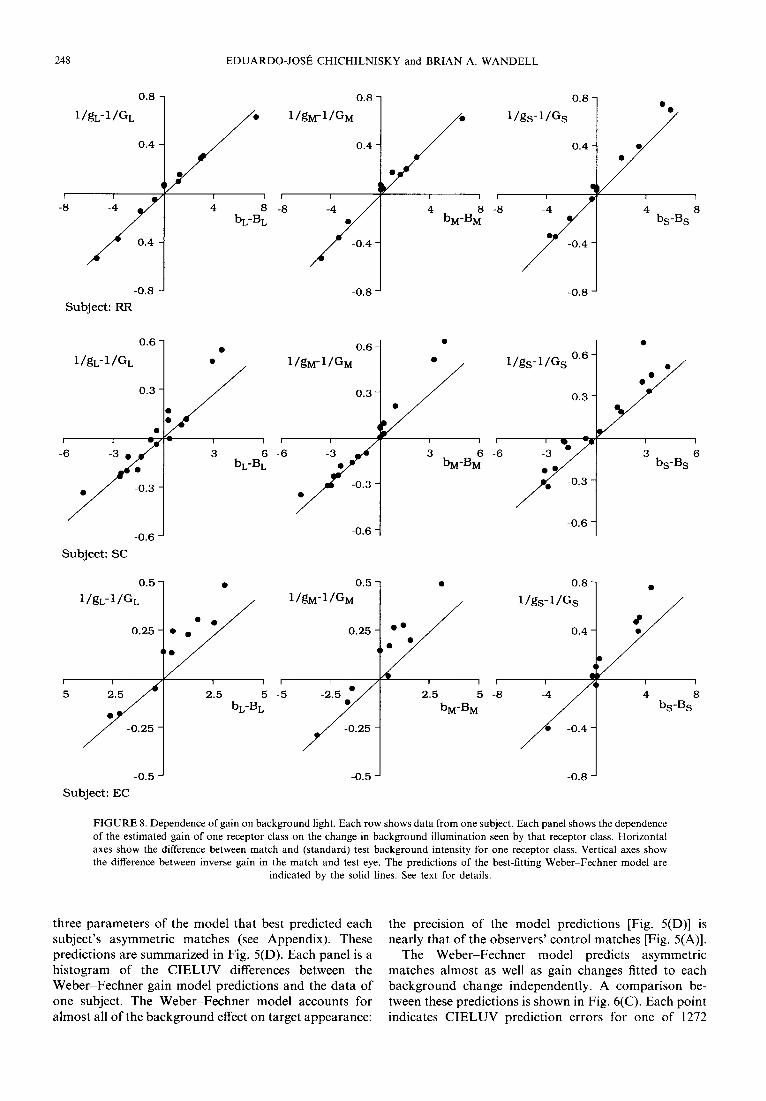
The results shown in Fig. 8 suggest that the dependence of inverse gain change on background change is approximately linear. This is most evident for subject RR, who set many matches on each background (see Table 1) and thus provided the most reliable esti- mates of receptor gain. Since each point in Fig. 8 is an estimate derived from between 7 and 42 matches, the significance of the deviations from linearity in subjects SC and EC is difficult to assess in this format and will be addressed later. The solid lines in Fig. 8 represent the linear relation that fitted each subject's entire data set with smallest r.m.s. CIELUV error.* The approximate linearity of the data in Fig. 8 suggest a very simple model for the dependence of receptor gain on background light.
Independent gain control in each receptor class: the Weber Fechner model. We show in the Appendix that a linear dependence of inverse gain change (1/g - 1/G ) on background change ( b - B ) is equivalent to the Weber-Fechner relation in each cone class:
gL = 1/(k L + w L b e)
gM = 1/(kM + wM b ~ ) (3)
gs = 1/(ks + Ws bs)
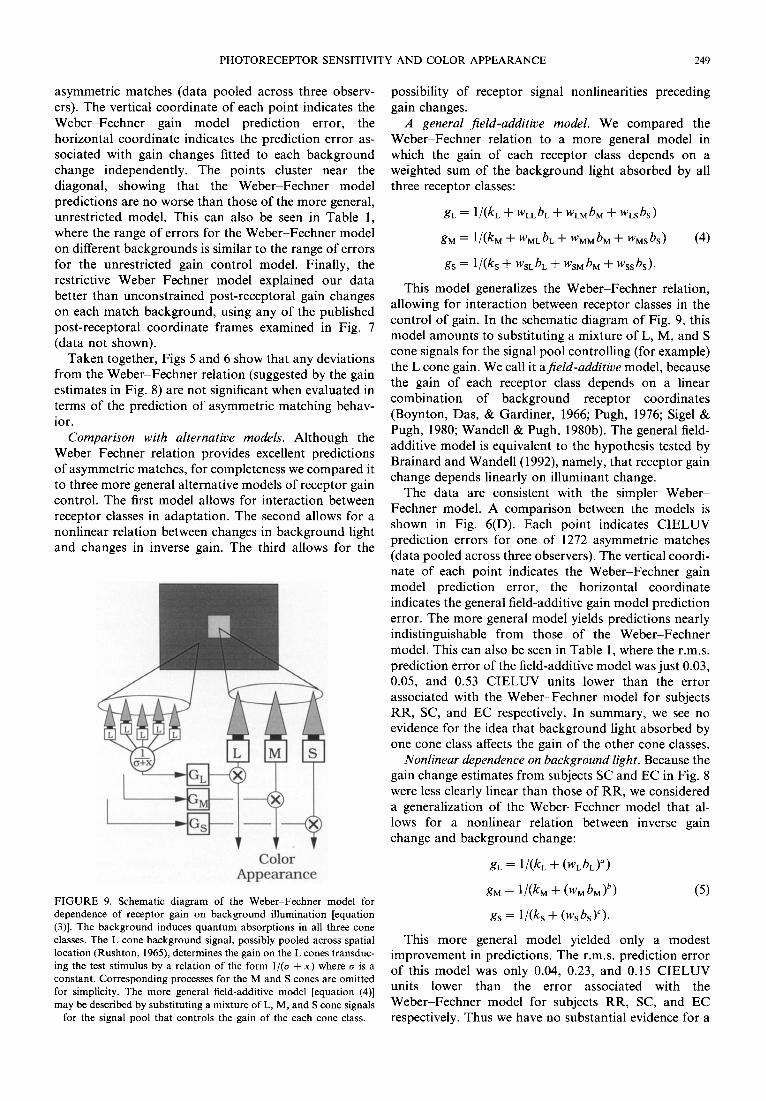
where (be, bM, bs) are the receptor coordinates of the background, and ki and wi are constants (Fechner, 1860; Weber, 1834). The Weber-Fechner model for receptor gain control is shown schematically in Fig. 9.
To evaluate the Weber-Fechner model, we found the
248 EDUARDO-JOSI~ CHICHILNISKY and BRIAN A. WANDELL
0.8
1/gL- 1 /G L
0.4
i i
-0.8 Subject: RR
J i i
4 8 bL-B L
0.8
I / g M - I / G M
0.4
i i f
I I I
4 8 -8 bM-B M
O.8-
l l g s - 1 / G S
0.4-
-0.8
i
4 bs-B s
0.6
I / g L - I / G L
0.3
-6
o 3
-0.6 - Subject: SC
i i
3 6 bL-B L
0.6 I / g M - I / G M
0.3
i i
-0.6 -
i i i
3 6 -6 bM-B M
I / g s - 1 / G s 0 .6-
0 .3-
//•/-0.3 -0.6
i
3 bs-B s
0.5 7 . 0.5 7 • 0.8 I / g L - I / G L i / g s - i / G S
0.25 0.25 0.4
' ' f l ' ' ' : . / l -5 -2.5 5 -5 -2.5 5 -8 -4
-0.5 -0.5 -0.8 Subject: EC
bs-B s
FIGURE 8. Dependence of gain on background light. Each row shows data from one subject. Each panel shows the dependence of the estimated gain of one receptor class on the change in background illumination seen by that receptor class. Horizontal axes show the difference between match and (standard) test background intensity for one receptor class. Vertical axes show the difference between inverse gain in the match and test eye. The predictions of the best-fitting Weber-Fechner model are
indicated by the solid lines. See text for details.
three parameters o f the mode l that best predicted each subject 's asymmetr ic matches (see Appendix) . These predict ions are summar ized in Fig. 5(D). Each panel is a h i s togram of the C I E L U V differences between the W e b e r - F e c h n e r gain mode l predict ions and the da ta o f one subject. The W e b e r - F e c h n e r mode l accounts for a lmos t all o f the background effect on target appearance:
the precision o f the model predict ions [Fig. 5(D)] is nearly that o f the observers ' cont ro l matches [Fig. 5(A)].
The W e b e r - F e c h n e r model predicts asymmetr ic matches a lmost as well as gain changes fitted to each background change independently. A compar i son be- tween these predict ions is shown in Fig. 6(C). Each point indicates C I E L U V predict ion errors for one o f 1272
P H O T O R E C E P T O R SENSITIVITY A N D C O L O R A P P E A R A N C E 249
asymmetric matches (data pooled across three observ- ers). The vertical coordinate of each point indicates the Weber-Fechner gain model prediction error, the horizontal coordinate indicates the prediction error as- sociated with gain changes fitted to each background change independently. The points cluster near the diagonal, showing that the Weber-Fechner model predictions are no worse than those of the more general, unrestricted model. This can also be seen in Table 1, where the range of errors for the Weber-Fechner model on different backgrounds is similar to the range of errors for the unrestricted gain control model. Finally, the restrictive Weber-Fechner model explained our data better than unconstrained post-receptoral gain changes on each match background, using any of the published post-receptoral coordinate frames examined in Fig. 7 (data not shown).
Taken together, Figs 5 and 6 show that any deviations from the Weber-Fechner relation (suggested by the gain estimates in Fig. 8) are not significant when evaluated in terms of the prediction of asymmetric matching behav- ior.
Comparison with alternative models. Although the Weber-Fechner relation provides excellent predictions of asymmetric matches, for completeness we compared it to three more general alternative models of receptor gain control. The first model allows for interaction between receptor classes in adaptation. The second allows for a nonlinear relation between changes in background light and changes in inverse gain. The third allows for the
C o l o r A p p e a r a n c e
F I G U R E 9. Schematic diagram of the W ebe~F echne r model for dependence of receptor gain on background illumination [equation (3)]. The background induces quan t um absorptions in all three cone classes. The L cone background signal, possibly pooled across spatial location (Rushton, 1965), determines the gain on the L cones transduc- ing the test s t imulus by a relation of the form 1/(a + x) where a is a constant. Corresponding processes for the M and S cones are omitted for simplicity. The more general field-additive model [equation (4)] may be described by substi tuting a mixture of L, M, and S cone signals
for the signal pool that controls the gain of the each cone class.
possibility of receptor signal nonlinearities preceding gain changes.
A general field-additive model. We compared the Weber-Fechner relation to a more general model in which the gain of each receptor class depends on a weighted sum of the background light absorbed by all three receptor classes:
g t : 1/(k L W WEE bE W WLM bM W WLS b S )
gM = 1/(kM + WMLbL + WMMbM + WMsbs) (4)
gs = 1/(ks + WsLbL + WsMbM + wssbs).
This model generalizes the Weber-Fechner relation, allowing for interaction between receptor classes in the control of gain. In the schematic diagram of Fig. 9, this model amounts to substituting a mixture of L, M, and S cone signals for the signal pool controlling (for example) the L cone gain. We call it afield-additive model, because the gain of each receptor class depends on a linear combination of background receptor coordinates (Boynton, Das, & Gardiner, 1966; Pugh, 1976; Sigel & Pugh, 1980; Wandell & Pugh, 1980b). The general field- additive model is equivalent to the hypothesis tested by Brainard and Wandell (1992), namely, that receptor gain change depends linearly on illuminant change.
The data are consistent with the simpler Weber- Fechner model. A comparison between the models is shown in Fig. 6(D). Each point indicates CIELUV prediction errors for one of 1272 asymmetric matches (data pooled across three observers). The vertical coordi- nate of each point indicates the Weber-Fechner gain model prediction error, the horizontal coordinate indicates the general field-additive gain model prediction error. The more general model yields predictions nearly indistinguishable from those of the Weber-Fechner model. This can also be seen in Table 1, where the r.m.s. prediction error of the field-additive model was just 0.03, 0.05, and 0.53 CIELUV units lower than the error associated with the Weber-Fechner model for subjects RR, SC, and EC respectively. In summary, we see no evidence for the idea that background light absorbed by one cone class affects the gain of the other cone classes.
Nonlinear dependence on background light. Because the gain change estimates from subjects SC and EC in Fig. 8 were less clearly linear than those of RR, we considered a generalization of the Weber-Fechner model that al- lows for a nonlinear relation between inverse gain change and background change:
gL = 1/(kL + (WLbL) a)
gM = 1/(kM + (wMb~) ~) (5) gs = 1/(ks + (wsbs)C).
This more general model yielded only a modest improvement in predictions. The r.m.s, prediction error of this model was only 0.04, 0.23, and 0.15 CIELUV units lower than the error associated with the Weber-Fechner model for subjects RR, SC, and EC respectively. Thus we have no substantial evidence for a
250 EDUARDO-JOSI~ CHICHILNISKY and BRIAN A. WANDELL
nonlinear relationship between background changes and inverse gain changes.
Nonlinear receptor responses. Primate cone flash re- sponses begin to saturate when the peak photocurrent exceeds about half the maximum achievable current (Schnapf, Nunn, Meister, & Baylor, 1990). We examined the possibility of receptor response nonlinearity preced- ing gain changes as follows. We compared the Weber-Fechner model to a model in which incremental receptor signals are subject to a static nonlinearity of the form x p before W e b e r F e c h n e r gain control. We found the Weber-Fechner parameters [equation (3)] and separate exponents PL, PM, and Ps for each cone class that minimized the r.m.s. CIELUV prediction error for each subject's data set. Permitting this response nonlin- earity did not substantially improve the fit to the data. The r.m.s, prediction error of this model was only 0.04, 0.23, and 0.15 CIELUV units lower than the error associated with the Webe~Fechner model for subjects RR, SC and EC respectively.
In the absence of a model for the dependence of gain on background light (such as the Weber-Fechner model), matching data cannot distinguish a gain change following a response nonlinearity of the form x p from a gain change applied to linear receptor signals: the exponent and the gain change are confounded. Since response nonlinearities are likely to be closely approxi- mated by the form x p, we only tested for response nonlinearities in "the context of the WebewFechner model.
Summary. The Weber-Fechner model of the impact of the background on color appearance carried great pre- dictive power. Allowing for (1) interaction of receptor classes in gain control, (2) receptor response nonlineari- ties, and (3) a nonlinear relation between background changes and inverse gain changes did not substantially improve predictions. The slopes of the lines in Fig. 8 are the only free parameters of the Weber-Fechner model, since we can only estimate gain changes relative to the standard background (see Appendix). Thus, three par- ameters per subject predict all 871, 222, and 179 asymmetric matches for RR, SC, and EC respectively, with nearly the precision of the observers' repeated matches.
DISCUSSION
We first recapitulate our findings:
• receptor gain control explained with excellent precision the effect of uniform backgrounds on the color appearance of small incremental and decremental targets;
• post-receptoral gain control provided a poorer account of the data;
• the apparent gain of each receptor class varied inversely with changes in background light ab- sorbed by that receptor class, but did not depend on background light absorbed by the other receptor classes.
Limitations
C R T display. Our conclusions are restricted to the range of stimuli available on a CRT display. It is possible that more extreme background manipulations will yield different results.
Locus of gain changes. Our study cannot distinguish between gain changes in the receptors themselves and gain changes in post-receptoral signals that preserve the segregation of the L, M, and S cone signals. We use the term "receptor gain" without implying a specific locus in the visual pathways. However, signals from different receptor classes are combined early in the retina (DeValois, 1965; Kaneko & Tachibana, 1983; MacNichol & Svaetichin, 1958; Svaetichin & MacNichol, 1958; Wiesel & Hubel, 1966). This suggests the gain changes we measure occur at or near the receptors.
Interocular matching. Interocular matching provides fast, precise measurements of color appearance shifts, but may reflect interocular interactions not present in normal binocular viewing. For example, several authors have found very small effects of intense contralateral eye adaptation on the color appearance (Shevell & Humanski, 1984) and brightness (Pitt, 1939; Whittle & Challands, 1969) of targets seen by the ipsilateral eye. If dichoptic matching obeys transitivity, our conclusions about interocular color appearance shifts are not com- promised by interocular interactions. Transitivity is defined as follows (Brainard & Wandell, 1992). Suppose that ( a , A ) ~ ( b , B ) means that target a on background A in the left eye is matched by target b on background B in the right. Transitivity requires that if ( a , A ) ~ ( b , B ) , and ( b , B ) ~ ( c , C ) , then (a, A ) ~ (c, C ). For example, interocular matches would be transitive if the contralateral background effect on ipsilateral color appearance behaved like adding a fixed amount of light into the ipsilateral background (Whittle & Challands, 1969). Transitivity is sufficient to validate our analysis because it implies that we would measure the same appearance changes in the right eye no matter what reference stimulus we used in the left eye. Whittle et al. documented transitivity in homochromatic and heterochromatic brightness matching experiments (Whittle, 1973; Whittle & Challands, 1969). The evi- dence therefore suggests that interocular interactions are small and transitive in our conditions, and so are un- likely to affect our conclusions about interocular appear- ance shifts.
However, interocular matches probably would not measure background effects on appearance that occur after binocular combination (e.g. Land, Hubel, Livingstone, Hollis, & Burns, 1983). For example, sup- pose that mechanisms following binocular combination apply a common transformation to the appearance of all test targets in the visual field in a way that depends on the background signal in both eyes. Such a transform- ation would not be measured by interocular matches.
Changes in pupil size. In general, changes in pupil diameter influence receptor gain estimates. However,
PHOTORECEPTOR SENSITIVITY AND COLOR APPEARANCE 251
only interocular differences in pupil diameter matter in our dichoptic matching procedure; these are likely to be very small (Davson, 1972, p. 469). Furthermore, even entirely independent changes in pupil size predict only a small fraction of the measured receptor gain changes. The observed receptor gain varied by more than 300% while independent pupil diameter variation predicts receptor gain changes smaller than 30% over the match field luminance range we used (Wyszecki & Stiles, 1982, p. 105).
Related 6terature Receptor gain: physiology. Schnapf et al. (1990)
observed a Webe~Fechner relation between background light and the flash sensitivity of individual primate cones. They also found that adapting intensities of roughly 3.3 log td were required to halve the sensi- tivity of individual cones (relative to dark sensitivity) compared to the 1-2 log td required to double detection thresholds for cone vision (Hood & Finkelstein, 1986). How do our asymmetric matching data relate to physio- logically measured cone sensitivity changes?
We addressed this question as follows. Schnapf et al. express the dependence of gain (or flash sensitivity) on background illumination as:
g/gD = 1/(1 + b/bo) (6)
where g is the gain when the background intensity is b, gD is the gain in darkness, and b0 is the background intensity required to halve the gain. Using the data in Fig. 8, we can derive an estimate of b0, which may be compared to the measurements of Schnapf et al.
Let B and G represent background intensity and gain in the standard condition. From equation (6), it follows that
1/g -- 1/G = (b - B)/(gDbo). (7)
Gain is expressed in arbitrary units, so we define the gain G associated with the standard background B to be 1 (as in Fig. 8). This choice of units fixes the value of go (gain in darkness) in terms of the standard background inten- sity B and the gain-halving background intensity b0. This is seen by setting g = l ' and b = B in equation (6):
gD = (1 + B/bo). (8)
Substituting into equation (7) and rearranging,
bo = ( b - - B ) / ( 1 / g - 1 / G ) - - B . (9) The quantities ( b - B ) and ( 1 / g - - 1 / G ) are the
horizontal and vertical axes of the plots in Fig. 8, and B is the intensity of the standard background. Thus we used B and the slopes of the best-fitting lines shown in Fig. 8 to estimate b0 from our data. For the three subjects, we estimated b0 values of 114, 206, and 217 td for the L cones, and 130, 212, and 219td for the M cones, for an average of 2.3 log td. Schnapf et al. found
*We assumed a 5 mm pupil diameter to convert background intensity measurements to td (Wyszecki & Stiles, 1982, p. 105). Assuming a 7 mm pupil diameter approximately doubles our estimates of b 0.
a b0 value of 517 td for one L cone and 634, 2535, and 3549 td for three M cones, for an average of 3.3 log td. Thus our estimate of the mean background intensity required to halve cone sensitivity is an order of magni- tude lower than that observed by Schnapf et al. in isolated primate cones, and is somewhat closer to the estimates from detection threshold data (Hood & Finkelstein, 1986).*
Receptor gain: asymmetric color matching. Our results seem to contradict those of several asymmetric matching studies that rejected the receptor gain model (Burnham et al., 1952; MacAdam, 1956; Wassef, 1959). We believe those studies suffered from several methodological and analytical limitations. First, their methods did not guarantee stable adaptation. Two of the studies used interocular matching similar to ours, but the divider separating the visual fields of the two eyes as well as the contralateral region that fused with the ipsilateral test stimulus were black (Burnham et al., 1952; Wassef, 1959). In our conditions, the mirrored divider ensured that each eye was stably adapted independent of the direction of gaze, and the contralateral background contained no black patch. In another study, the subject attempted to stably foveate the dividing line between two juxtaposed adapting fields (MacAdam, 1956). This tech- nique yielded complex relationships between the tristim- ulus coordinates of matching stimuli not observed by others.
Second, because the human cone spectral sensitivities were not known, these studies relied on an elegant but impractical analysis known as Brewer's method to test the receptor gain hypothesis (Brewer, 1954). Specifically, they found the least-squares estimate of the linear trans- formation of tristimulus values between backgrounds, and asked if the eigenvalues of this transformation were real. Since the estimated transformation is subject to noise in the data, it is difficult to evaluate whether the complex eigenvalues were a basis for rejecting the recep- tor gain model. We were able to use the known human cone spectra and iterative searches to find the receptor gain values that provided the best fit to the data in terms of appearance, and concluded that this model predicted the data to excellent approximation.
Finally, these studies examined the relationship between the absolute tristimulus values of matching stimuli. Several considerations favor examining the relation between incremental receptor coordinates (differences from background) in our conditions. First, when the test stimulus is an increment of zero (identical to background), the match will also be a zero increment because the two backgrounds are fused: this is consistent with a pure gain change applied to increments. Second, our informal observations show that a stimulus with zero absolute intensity seen on one test background is not matched by a stimulus of zero absolute intensity on a different match background, ruling out gain changes applied to absolute receptor signals. Third, several stud- ies have argued for partial (Jameson & Hurvich, 1972; Shevell, 1978) or complete (Davies, Faivre & Werner, 1983; Walraven, 1976) discounting of background light
252 EDUARDO-JOSI~ C H I C H I L N I S K Y and BRIAN A. W A N D E L L
in appearance judgments. Finally, in analyzing incre- mental stimuli we found excellent agreement with the parsimonious receptor gain model.
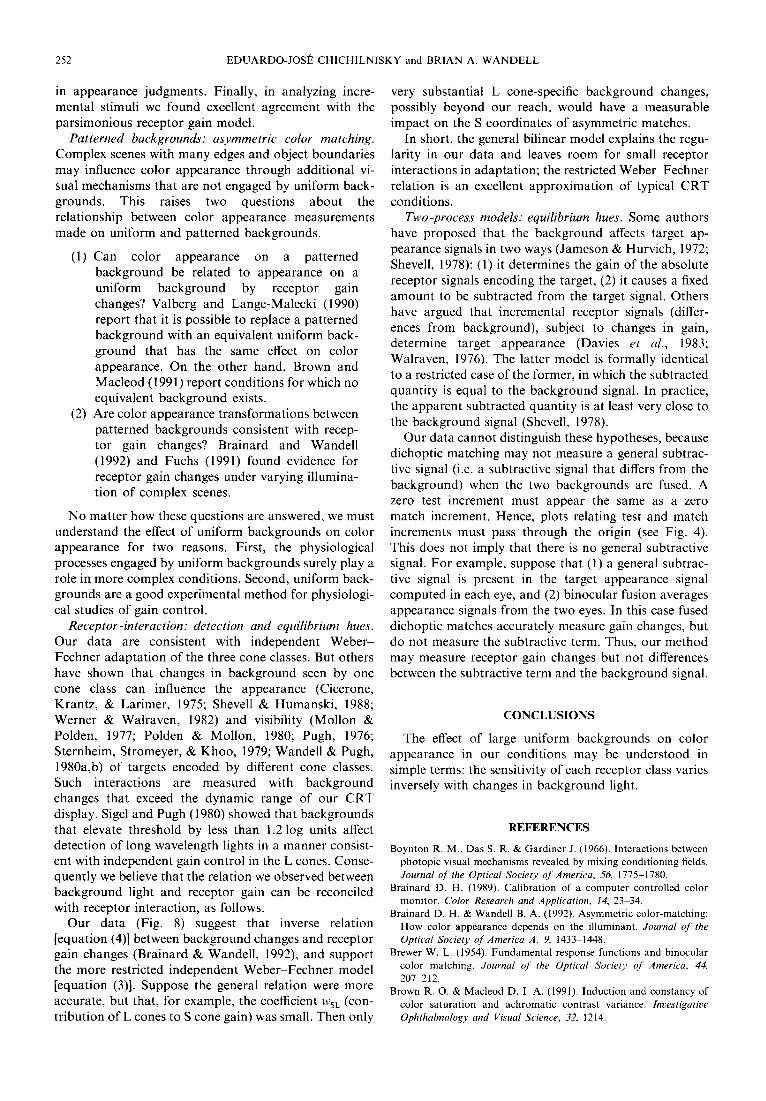
Patterned backgrounds: asymmetric color matching. Complex scenes with many edges and object boundaries may influence color appearance through additional vi- sual mechanisms that are not engaged by uniform back- grounds. This raises two questions about the relationship between color appearance measurements made on uniform and patterned backgrounds.
(1) Can color appearance on a patterned background be related to appearance on a uniform background by receptor gain changes? Valberg and Lange-Malecki (1990) report that it is possible to replace a patterned background with an equivalent uniform back- ground that has the same effect on color appearance. On the other hand, Brown and Macleod (1991) report conditions for which no equivalent background exists.
(2) Are color appearance transformations between patterned backgrounds consistent with recep- tor gain changes? Brainard and Wandell (1992) and Fuchs (1991) found evidence for receptor gain changes under varying illumina- tion of complex scenes.
No matter how these questions are answered, we must understand the effect of uniform backgrounds on color appearance for two reasons. First, the physiological processes engaged by uniform backgrounds surely play a role in more complex conditions. Second, uniform back- grounds are a good experimental method for physiologi- cal studies of gain control.
Receptor-interaction: detection and equilibrium hues. Our data are consistent with independent W e b e ~ Fechner adaptation of the three cone classes. But others have shown that changes in background seen by one cone class can influence the appearance (Cicerone, Krantz, & Larimer, 1975; Shevell & Humanski, 1988; Werner & Walraven, 1982) and visibility (Mollon & Polden, 1977; Polden & Mollon, 1980; Pugh, 1976; Sternheim, Stromeyer, & Khoo, !979; Wandell & Pugh, 1980a,b) of targets encoded by different cone classes. Such interactions are measured with background changes that exceed the dynamic range of our CRT display. Sigel and Pugh (1980) showed that backgrounds that elevate threshold by less than 1.2 log units affect detection of long wavelength lights in a manner consist- ent with independent gain control in the L cones. Conse- quently we believe that the relation we observed between background light and receptor gain can be reconciled with receptor interaction, as follows.
Our data (Fig. 8) suggest that inverse relation [equation (4)] between background changes and receptor gain changes (Brainard & Wandell, 1992), and support the more restricted independent Webe~Fechner model [equation (3)]. Suppose the general relation were more accurate, but that, for example, the coefficient WsL (con- tribution of L cones to S cone gain) was small. Then only
very substantial L cone-specific background changes, possibly beyond our reach, would have a measurable impact on the S coordinates of asymmetric matches.
In short, the general bilinear model explains the regu- larity in our data and leaves room for small receptor interactions in adaptation; the restricted Webe~Fechner relation is an excellent approximation of typical CRT conditions.
Two-process models: equilibrium hues. Some authors have proposed that the background affects target ap- pearance signals in two ways (Jameson & Hurvich, 1972; Shevell, 1978): (1) it determines the gain of the absolute receptor signals encoding the target, (2) it causes a fixed amount to be subtracted from the target signal. Others have argued that incremental receptor signals (differ- ences from background), subject to changes in gain, determine target appearance (Davies et al., 1983; Walraven, 1976). The latter model is formally identical to a restricted case of the former, in which the subtracted quantity is equal to the background signal. In practice, the apparent subtracted quantity is at least very close to the background signal (Shevell, 1978).
Our data cannot distinguish these hypotheses, because dichoptic matching may not measure a general subtrac- tive signal (i.e. a subtractive signal that differs from the background) when the two backgrounds are fused. A zero test increment must appear the same as a zero match increment. Hence, plots relating test and match increments must pass through the origin (see Fig. 4). This does not imply that there is no general subtractive signal. For example, suppose that (1) a general subtrac- rive signal is present in the target appearance signal computed in each eye, and (2) binocular fusion averages appearance signals from the two eyes. In this case fused dichoptic matches accurately measure gain changes, but do not measure the subtractive term. Thus, our method may measure receptor gain changes but not differences between the subtractive term and the background signal.
CONCLUSIONS
The effect of large uniform backgrounds on color appearance in our conditions may be understood in simple terms: the sensitivity of each receptor class varies inversely with changes in background light.
REFERENCES
Boynton R. M., Das S. R. & Gardiner J. (1966). Interactions between photopic visual mechanisms revealed by mixing conditioning fields. Journal of the Optical Society of America, 56, 1775 1780.
Brainard D. H. (1989). Calibration of a computer controlled color monitor. Color Research and Application, 14, 23 34.
Brainard D. H. & Wandell B. A. (1992). Asymmetric color-matching: How color appearance depends on the illuminant. Journal of the Optical Society of America A, 9, 1433 1448.
Brewer W. L. (1954). Fundamental response functions and binocular color matching. Journal of the Optieal Society of America, 44, 207-212.
Brown R. O. & Macleod D. I. A. (1991). Induction and constancy of color saturation and achromatic contrast variance. Investigative Ophthalmology and Visual Science, 32, 1214.
PHOTORECEPTOR SENSITIVITY AND COLOR APPEARANCE 253
Burnham R. W., Evans R. M. & Newhall S. M. (1952). Influence on color perception of adaptation to illumination. Journal of the Optical Society of America, 42, 597 605.
Burnham R. W., Evans R. M. & Newhall S. M. (1957). Prediction of color appearance with different adaptation illuminations. Journal of the Optical Society of America, 47, 35 42.
Cicerone C. M., Krantz D. H. & Larimer J. (1975). Opponent-process additivity--III. Effect of moderate chromatic adaptation. Vision Research, 15, 1125-1135.
Davies S. E., Faivre I. A. & Werner J. S. (1983). Transient processing in chromatic induction. Vision Research, 23, 707-712.
Davson H. (1972). The physiology of the eye (4th edn). New York: Academic Press.
DeValois R. L. (1965). Analysis and coding of color in the primate visual system. Cold Spring Harbor Symposium on Quantitative Biology, 30, 567-579.
Fechner G. T. (1860). Elemente der Psychophysik. Leipzig: Breitkopf and Harterl.
Fuchs H. (1991). Color constancy with non-grey average surrounds. ECVP, 14.
Guth S. L. (1991). Model for color vision and light adaptation. Journal of the Optical Society of America A, 8, 976 993.
Hood D. C. & Finkelstein M. A. (1986). Sensitivity to Light. In Boff K. R., Kaufman L. & Thomas J. P. (Eds), Handbook of perception and human performance: Sensory" processes and perception. New York: Wiley.
Hunt R. W. G. (1950). The effects of daylight and tungsten light- adaptation on color perception. Journal of the Optical Society of America, 40, 336-371.
Hunt R. W. G. (1952). Light and dark adaptation and the perception of color. Journal of the Optical Society of America, 42, 190 199.
Ishihara S. (1977). Tests for color-blindness. Tokyo: Kanehara Shup- pen.
Jameson D. & Hurvich L. (1959). Perceived color and its dependence on focal, surrounding, and preceding stimulus variables. Journal of the Optical Society of America, 49, 890-898.
Jameson D. & Hurvich L. M. (1972). Color adaptation: Sensitivity contrast, and afterimages. In Hurvich L. M. & Jameson D. (Eds), Handbook of sensory physiology (pp. 568-581). Berlin: Springer.
Judd D. B. (1951) Colorimetry and artificial daylight. In Technical Committee No. 7 Report of Secretariat United States Commission, International Commission on Illumination, Twelfth Session (pp. 1-60). Stockholm.
Kaneko A. & Tachibana M. (1983). Double color-opponent receptive fields of carp bipolar cells. Vision Research, 23, 381 388.
Krauskopf J., Williams D. R. & Heeley D. W. (1982). Cardinal directions of color space. Vision Research, 22, 1123-1131.
von Kries, J. (1905). Die Gesichtsempfindungen. In Nagel, W. (Ed.), Handbuch der Physiologie des Meschen (pp. 109~82). Braun- schweig: Vieweg.
Land E. H., Hubel D. H., Livingstone M. S., Hollis S. H. & Burns M. M. (1983). Color-generating interactions across the corpus callosum. Nature, 303, 616 618.
MacAdam D. L. (1956). Chromatic adaptation. Journal of the Optical Society of America, 46, 500-513.
MacNichol E. F. & Svaetichin G. (1958). Electric responses from the isolated retinas of fishes. American Journal of Ophthalmology, 46, 26-46.
Mollon J. D. & Polden P. G. (1977). An anomaly in the response of the eye to light of short wavelengths. Philosophical Transactions of the Royal Society of London B, 278, 207-240.
Pitt F. H. G. (1939). The effect of adaptation and contrast on apparent brightness. Proceedings of the Physical Society of London, 51, 817-830.
Polden P. G. & Mollon J. D. (1980). Reversed effect of adapting stimuli on visual sensitivity. Proceedings of the Royal Society of London B, 210, 235-272.
Pugh E. N. (1976). The nature of the nl colour mechanism of W. S. Stiles. Journal of Physiology, London, 257, 713-747.
Rushton W. A. H. (1965). Visual adaptation. The Ferrier lecture. Proceedings of the Royal Society of London B, 162, 20 46.
Schnapf J. L., Nunn B. J., Meister M. & Baylor D. A. (1990). Visual transduction in cones of the monkey Macacafascicularis. Journal of Physiology, London, 427, 681-713.
Shevell S. K. (1978). The dual role of chromatic backgrounds in color perception. Vision Research, 18, 1649-1661.
Shevell S. K. & Humanski R. (1984). Color perception under contralat- eral and binocularly fused chromatic adaptation. Vision Research, 24, 1011.
Shevell S. K. & Humanski R. A. (1988). Color perception under chromatic adaptation: Red/green equilibria with adapted short- wavelength-sensitive cones. Vision Research, 28, 1345-1356.
Sigel C. & Pugh E. N. (1980). Stiles' Pi-5 color mechanism: Tests of field displacement and field additivity properties. Journal of the Optical Society of America A, 70, 71 81.
Smith V. & Pokorny J. (1975). Spectral sensitivity of the foveal cone photopigments between 400 and 500nm. Vision Research, 15, 161 171.
Sternheim C. E., Stromeyer C. F. III & Khoo M. C. K. (1979). Visibility of chromatic flicker upon spectrally mixed adapting fields. Vision Research, 19, 175-183.
Svaetichin G. & MacNichol E. G. (1958). Retinal mechanisms for chromatic and achromatic vision. Annals New York Academy of Science, 74, 385-404.
Valberg A. & Lange-Malecki B. (1990). "Color constancy" in mondrian patterns: A partial cancellation of physical chromaticity shifts by simultaneous contrast. Vision Research, 30, 371 380.
Walraven J. (1976). Discounting the background-- the missing link in the explanation of chromatic induction. Vision Research, 16, 289 295.
Waiters H. V. (1942). Some experiments on the trichromatic theory of vision. Proceedings of the Royal Society of London B, 131, 27 50.
Wandell B. A. & Pugh E. N. (1980a). Detection of long-duration, long-wavelength incremental flashes by a chromatically coded pathway. Vision Research, 20, 625-636.
Wandell B. A. & Pugh E. N. (1980b) A field-additive pathway detects brief-duration, long-wavelength incremental flashes. Vision Research, 20, 613 624.
Wassef E. G. T. (1958). Investigation into the theory of prediction of the appearance of colors and its bearing on the theory of color vision. Optica Acta, 5, 101-108.
Wassef E. G. T. (1959). Linearity of the relationship between the tristimulus values of corresponding colours seen under different conditions of chromatic adaptation. Optica Acta, 6, 378 393.
Weber E. H. (1834). De pulsu, resorptione, auditu et tactu annotationes anatomicae et physiologicae. Leipzig: C. F. Koehler.
Werner J. S. & Walraven J. (1982). Effect of chromatic adaptation on the achromatic locus: The role of contrast, luminance and back- ground color. Vision Research, 22, 929 944.
Whittle P. (1973). The brightness of coloured flashes on backgrounds of various colours and luminances. Vision Research, 13, 621-638.
Whittle P. & Challands P. D. C. (1969). The effect of background luminance on the brightness of flashes. Vision Research, 9, 1095-1110.
Wiesel T. & Hubel D. H. (1966). Spatial and chromatic interactions in the lateral geniculate body of the rhesus monkey. Journal of Neurophysiology, 29, 1115-1156.
Wright W. D. (1934). The measurement and analysis of colour adaptation phenomena. Proceedings of the Royal Society of London B, 115, 49 87.
Wyszecki G. & Stiles W. S. (1982). Color science--concepts and methods, quantitative data and formulae (2nd edn). New York: Wiley.
Acknowledgements--We thank D. Heeger for comments on the manuscript, D. Brainard for valuable discussions, and two anonymous reviewers for useful comments. We thank S. Choi and R. Rahman for their excellent experimental work. This research was supported by National Eye Institute grant R01-EY03164, and NASA Ames Grant NCC2-307. E. J. Chichilnisky was supported by a predoctoral fellow- ship from the Howard Hughes Medical Institute.
254 EDUARDO-JOSI~ C H I C H I L N I S K Y and BRIAN A. W A N D E L L
A P P E N D I X
Notat ion
Symbol Interpretation Sample units
g, G Gain (sensitivity) mV/quan tum b, B Background intensity Quanta
Weber fraction 1/mV k Dark light Quanta /mV
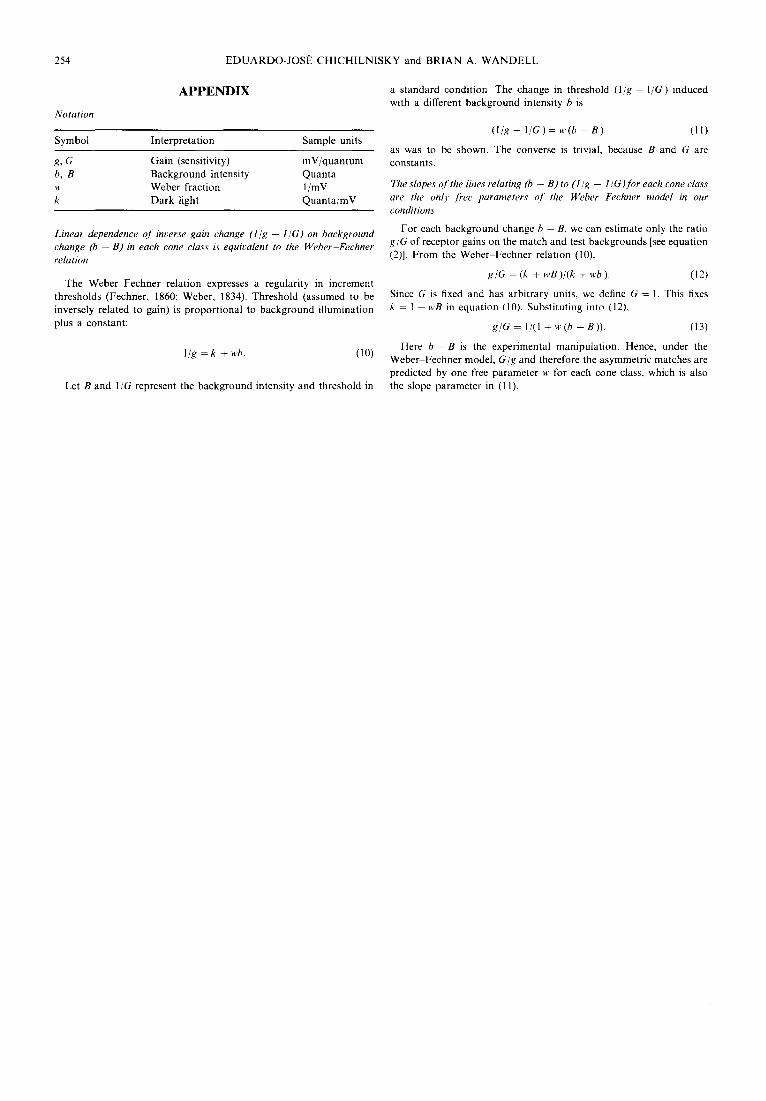
Linear dependence o f inverse gain change ( l /g - l /G) on background change Co - B) in each cone class is equivalent to the Weber Fechner relation
The Webe~Fechne r relation expresses a regularity in increment thresholds (Fechner, 1860; Weber, 1834). Threshold (assumed to be inversely related to gain) is proportional to background illumination plus a constant:
1/g = k + wb. (10)
Let B and 1/G represent the background intensity and threshold in
a standard condition. The change in threshold ( 1 / g - I / G ) induced with a different background intensity b is
( l / g - l / G ) = w ( b B) . (11)
as was to be shown. The converse is trivial, because B and G are constants.
The slopes o f the lines relating (b - B) to (1/g - l /G) for each cone class are the only f ree parameters o f the Weber Fechner model in our conditions
For each background change b - B, we can estimate only the ratio g / G of receptor gains on the match and test backgrounds [see equation (2)]. From the Weber Fechner relation (10).
g i g - (k + w B ) / ( k + wb ). (12)
Since G is fixed and has arbitrary units, we define G = 1. This fixes k - 1 - wB in equation (10). Substituting into (12),
g / G = I/(1 + w(b - -B)) . (13)
Here b - B is the experimental manipulation. Hence, under the Webe~Fechne r model, Gig and therefore the asymmetric matches are predicted by one free parameter w for each cone class, which is also the slope parameter in (l 1).