Embed Size (px)
Citation preview
e i,- " , t ~z 'i
E L S E V I E R Journal of Photochemistry and Photobiology A: Chemistry 89 (1995) 201-207
dlmmal~ PIt31DCIqEM~'I~£
&N'D P l - J J l ~
A : ~ B Y
Photophysics of 8-anilinonaphthalene-1-sulphonate
Ashutosh Upadhyay, T. Bhatt, H.B. Tripathi, D.D. Pant Photophysics Laboratory, Department of Physics, Kumaun University, 263 001 Naini Tal, India
Received 20 October 1994; accepted 7 February 1995
Abstract
The steady state and time-resolved spectra of 8-anilinonaphthalene- 1-sulphonate under various conditions of solvent polarity, viscosity and ~emperature have been investigated. Unlike earlier reports, we have actually observed two emissions (Kosower's non-planar (NP) and charge :ransfer (CT)) in all solvents. While in low polarity solvents emission from the NP state is dominant, in high polarity solvents emission 3ccurs mainly from the CT state. In the frozen glass at 77 K the CT emission vanishes. An interconversion of the NP to the CT state starts near the melting point of the solvent.
Keywords: 8-Anilinonaphthalene-l-sulphonate; Solvent polarity; Viscosity; Temperature
1. Introduction
Weber and Laurence [ 1 ] reported that an intense blue fluorescence of 8-anilinonaphthalene- 1-sulphonate (8,1- ~NS) is observed in less polar solvents whereas a weak green .duorescence is obtained in aqueous solutions. The extreme ~ensitivity of the fluorescence parameters to the environment ,.hake this molecule suitable for use as a probe in biological nvestigations [ 2-4 ]. The photophysics of this molecule and ts derivatives has been extensively studied by Kosower and :oworkers in various solvents [5,6]. They suggest that the -'mitring state in polar solvents is a charge transfer (CT) state iormed by conformational change after excitation. The ,;cheme given by them for the electron transfer process in ~,NS is
"~O,np ~' S*l,np ~ S*l,ct ~ S o , n p (1) kl
S0,np + hv S0,ct + hv
~bsorption of light leads to a locally excited state S ~,.p (non- planar (NP) geometry) which is then transformed into a CT state Sl*ct (planar configuration). In polar solvents the CT state decays via another electron transfer process, resulting ~n quenched fluorescence. On the basis of the relative posi- tions of emission maxima with respect to z values (solvent 0olarity parameter), they suggest that in viscous polar sol- Jents such as glycerol the rate of conversion of the S~.np to I.he Sl,ct state is lowered and emission is observed mainly
1010-6030/95/$09.50 © 1995 Elsevier Science S.A. All rights reserved ;SD11010-6030(95)04057-9
from Sl,np. DeToma et al. [7] studied the kinetics of 2,6- ANS as a function of emission wavelength and suggested that the kinetics is not consistent with the two emitting species. The results are supposed to be consistent with the kinetics of solvent relaxation. It has been found [8-10] that in polar solvents the lifetime is more sensitive to the polarity than to the viscosity. However, Sadkowski and Fleming [ 11 ] find a small increase in the non-radiative rate and no detectable wavelength shift in ethylene glycol on reducing the viscosity from 19.9 to 3.02 cp by heating to 70 °C. This observation and other arguments are believed to go against Kosower's model of two emitting states.
A study of the photophysics of 8,1-ANS over a wide range of temperature (77-340 K) by steady state and time-resolved spectroscopy is expected to help understand the conforma- tional and environmental effects. Some initial steady state spectroscopic studies gave a surprising indication of two well-resolved emissions not reported explicitly so far. This also necessitated a more detailed and careful reinvestigation of already well-known steady state emission.
2. Experimental details
Glycerol, ethanol, propanol, octanol, 1,4-dioxane and eth- ylene glycol of spectroscopic grade were used without further purification. Some of the solvents, e.g. ethyl alcohol, were dried over NaOH. The 1,4-dioxane used was distilled twice and doubly distilled water was used for study. 8,1-ANS was obtained as the acid (Aldrich Chemical Co. Ltd), the ammo-
202 A. Upadhyay et al. / Journal of Photochemistry and Photobiology A: Chemistry 89 (1995) 201-207
nium salt (Sigma Chemical Co.) and the sodium salt (Kodak).
Various samples of 8,1-ANS were examined during the study. This was necessary because the initial experiment showed two resolved bands in emission with the same exci- tation spectra. These samples were purified using the method suggested by Sadkowski and Fleming [ 11 ]. 8,1-ANS obtained as the ammonium salt was purified by first precipi- tating the less soluble magnesium salt from an aqueous solu- tion of excess MgSO4 and then recrystallizing from hot water. The final purified sample showed a single spot in thin layer chromatography (TLC). Since all of them gave the same spectrum, we finally chose the sample crystallized with MgSO4. Freshly prepared solutions ( 8,1-ANS, concentration 5 × 10 -s M) were taken for study. Steady state absorption and emission spectra were recorded using a JASCO V-550 spectrophotometer and FP-777 spectrofluorometer respec- tively. This spectrofluorometer, when compared with the Perkin-Elmer LS-5 luminescence spectrometer 1, showed a better resolution. Spectra were observed at various tempera- tures (77-300 K) using the low temperature accessory of the JASCO FP-777.
Decay time measurements were made with the help of an Edinburgh Model 199 fluorescence time domain spectrome- ter under single-photon-counting conditions [ 12]. Some of the measurements were done using a mode-locked Nd:YAG synchronously pumped and cavity-dumped dye laser as an excitation source in place of the coaxial gated flash-lamp. Data analysis was done with a PDP 11/2 microcomputer by the reconvolution method using a least-squares-fitting pro- gramme. The goodness of fit was estimated by the )(2 distri- bution of residuals and standard deviations. Studies have been performed from 77 to 340 K in glycerol and from 80 K to ambient temperature in ethanol, propanol and octanol.
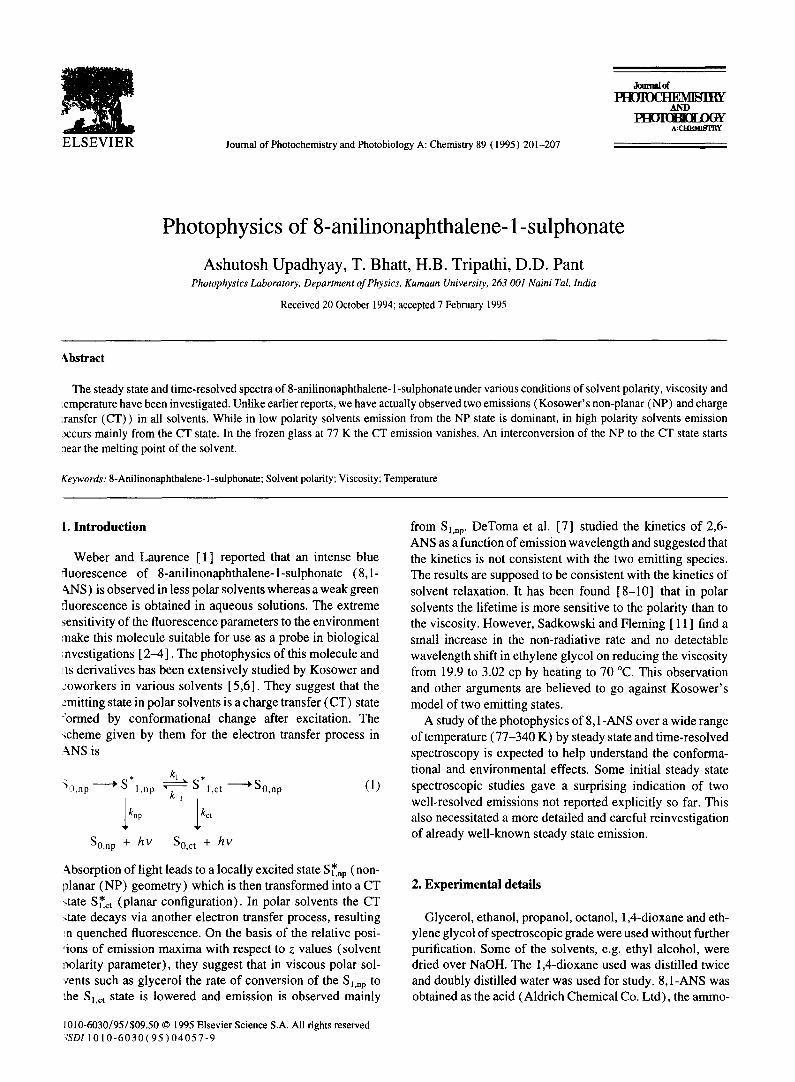
water). The intensity in water falls to about 1/250 of the original value in dioxane. The spectra are normalized to 500 nm. Table 1 gives the peak values of emission maximum along with the data reported by Kosower and Kanety [5 ]. The ET(30) values have been taken from Ref. [5 ]. Since two peaks, one more prominent in dioxane and the other in water, with the same excitation spectrum are observed, we attribute these two peaks to emission from S* (dioxane) and S* 1,rip l , c t
(water). As expected, the CT emission is weak and broad. Even in pure dioxane there is a shoulder at about 500 nm and in pure water there is a shoulder at the blue side near 480 nm, indicating the presence of both emissions in each solvent. The trace presence of NP emission in water is more surprising than that of CT emission in dioxane.
Both NP and CT emissions can be investigated in the polarity range ET(30) = 36-63 in dioxane-water mixtures. We have plotted the frequency shift of both NP and CT emissions with polarity parameter ET(30) as measured in
5 0 0 0 I a ~ I
• ~ 2000 c at
IF~aman/,//~///,#' f h a \ \ \ \ \ \ X,,l I-..t
I000
0 400 450 500 550 600
3. Results and discussion
3.1. Steady state spectra
W a v e l e n g t h ( n m )
Fig. 1. Fluorescence spectra of 8, I-ANS in dioxane-water mixtures at room temperature. Dioxane contents of solutions used were ( a ) 100%, (b) 98.1%, (c) 90.5%, (d) 74.9%, (e) 53.0%, (f) 31.1%, (g) 6.9% and (h) 0%.
As already mentioned, the steady state spectra in various solvents agree in position with the known spectra, except that each broad band reported in the literature was found to have a structure. The excitation spectra monitored across the entire emission band were exactly the same. This observation, along with the fact that all four samples of 8,1-ANS obtained under different conditions and sources tallied with one another, excluded the possibility of an extraneous impurity; however, the presence of a small quantity of moisture in the solvents could not be ruled out. A separate experiment with dioxane- water mixtures similar to that reported by Kosower and Kanety [5] was performed. Fig. 1 displays the emission spectra of 8,1-ANS in eight solvent mixtures (dioxane-
1 We thank Professor P. Mohanty of Jawaharlal Nehru University, New Delhi for allowing us to use his Perkin-Eimer luminescence spectrometer.
Table 1 Emission data for 8,I-ANS in dioxane-water mixtures
Dioxane Er(30) Em. max. (NP) Em. max. (CT) Em. max. ~ (%) (rim) (nm) (nm)
100.0 36.0 463.2 487.0 - 98.9 39.0 468.0 488.0 475.0 98.0 41.1 468.8 499.0 478.0 95.2 43.5 469.8 492.0 482.0 90.5 46.5 471.2 502.0 486.0 84.3 48.0 472.6 505.2 488.0 74.9 50.0 473.0 505.4 491.0 53.0 53.0 477.2 511.0 501.0 31.1 57.0 478.0 517.2 514.0 6.9 61.9 479.0 527.8 530.0 0.0 63.0 480.0 535.6 -
"From Ref. [5].
A. Upadhyay et al. / Journal of Photochemistry and Photobiology A: Chemistry 89 (1995) 201-207 203
22000
21000 r E
2 0 0 0 0
C 0
19000
I I I I I I i
np band
CT band e ' ~
18000 I I I I I I t 30 35 40 45 50 55 60 65 70
4~) ET (30 )
22000 ~ i_ l I
21000
5
2 0 0 0 0 :--
:: 19000 CT band ,J \ 18000 ~ t i J ~ J I \
30 35 40 45 50 55 60 65 70
) E T ( 3 0 )
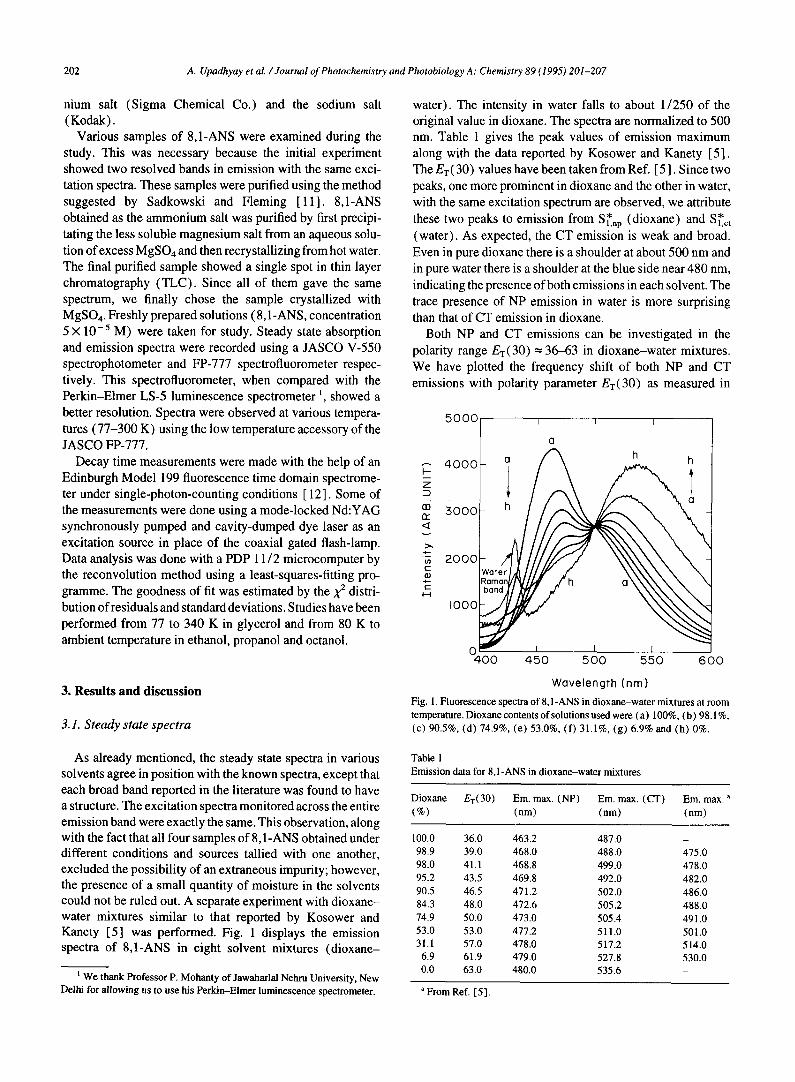
F,g. 2. Plots of emission maximum vs, solvent polarity parameter E'r<3o) , ~ cal mol- t) for 8,1-ANS (a) in a series of dioxane-water mixtures and
t: ) in solvents of various polarities.
:~,lvents of various polarities (Fig. 2 (b ) ) as well as in dioxane-water mixtures (Fig. 2 (a ) ) . The NP emission red ~[ ifts with a lower slope than the CT emission.
The absorption spectra in all solvents such as ethanol, methanol and ethylene glycol are similar; in water a distinct :]~fference, also observed by Sadkowski and Fleming [ 11 ], 4s seen. Although ethylene glycol does not differ from the ~I:her solvents, we show in Fig. 3 the emission, excitation and d,sorption spectra in ethylene glycol. This case appears ,( rnewhat more interesting, because both NP and CT emis- ,~i, ms are well resolved and separate excitation spectra can be n mitored. As can be seen, the excitation spectra at 470 and '~: 5 nm are identical. The emission and excitation spectra of ,c iid ANS (Mg) salt are similar. Table 2 gives the )tmax values ~! NP and CT emissions in various solvents. The observations
:e,:orded above show clearly that there are two excited states NP and CT) involved in emission which are generated from
40
3O
m r r
~ 20
c
c I0
I I I
1 ~ b / f .d"~\\
\\
I ~ ~ 1 1 1
I !00 300 4-00 500
\ \ \ \ \ \ \ I
600 650
Wavelength (nm )
Fig. 3. (a) Absorption, (b, c) excitation (b, monitored at 470 nm; c, mon- itored at 525 nm) and (d) emission spectra of 8,1-ANS (10 -5 M) in ethylene glycol at room temperature.
Table 2 Emission data for 8,1 -ANS in solvents of various polarities
Solvent Er(30) Em. max. (NP) Era. max. (CT) (nm) (nm)
Dioxane 36.0 463.2 - Propanol 50.7 467.0 493.0 Ethanol 51.9 467.4 493.0 Methanol 55.5 472.0 502.4 Ethylene glycol 56.3 477.5 510.0 Glycerol 57.0 474.2 513.0 Water 63.1 480.0 535.0
a single state (NP). It is also known [13] that the longer wavelength edge of emission has a different polarization from the shorter edge.
3.1.1. Spectra at low and intermediate temperatures
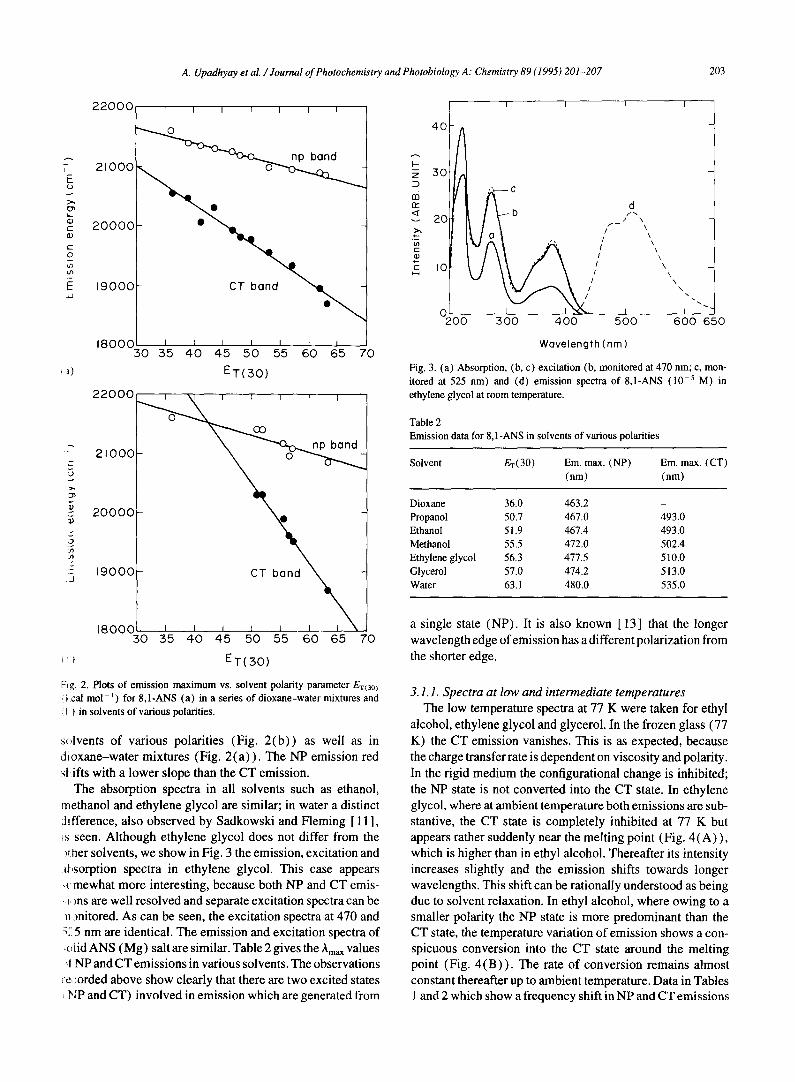
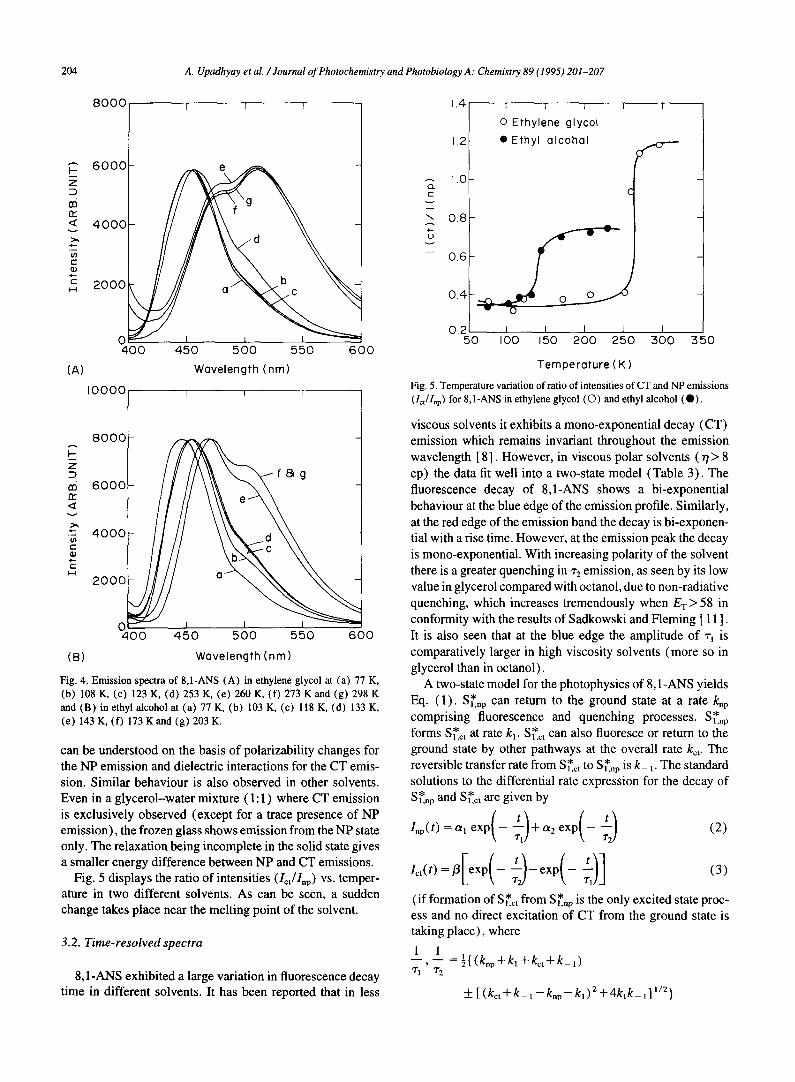
The low temperature spectra at 77 K were taken for ethyl alcohol, ethylene glycol and glycerol. In the frozen glass (77 K) the CT emission vanishes. This is as expected, because the charge transfer rate is dependent on viscosity and polarity. In the rigid medium the configurational change is inhibited; the NP state is not converted into the CT state. In ethylene glycol, where at ambient temperature both emissions are sub- stantive, the CT state is completely inhibited at 77 K but appears rather suddenly near the melting point (Fig. 4 (A) ), which is higher than in ethyl alcohol. Thereafter its intensity increases slightly and the emission shifts towards longer wavelengths. This shift can be rationally understood as being due to solvent relaxation. In ethyl alcohol, where owing to a smaller polarity the NP state is more predominant than the CT state, the temperature variation of emission shows a con- spicuous conversion into the CT state around the melting point (Fig. 4 ( B ) ) . The rate of conversion remains almost constant thereafter up to ambient temperature. Data in Tables I and 2 which show a frequency shift in NP and CT emissions
204 A. Upadhyay et aLI Journal of Photochemistry and Photobiology A: Chemistry 89 (1995) 201-207
8000 I I I
5
m n- <
l - ID
4.- r -
6OOO
4 0 0 0
2000
J 0 400
e
450 500 550 600
(A) Wavelength (nm)
I0000 I I I
8OOO
z / D fE~g a5 6000 Iz /
4000 ~n c : Q)
E /
H 2000 / a
/
0 400 450 500 550 600
(B) Wavelength (nm)
Fig. 4. Emission spectra of 8,I-ANS (A) in ethylene glycol at (a) 77 K, (b) 108 K, (c) 123 K, (d) 253 K, (e) 260 K, (f) 273 K and (g) 298 K and (B) in ethyl alcohol at (a) 77 K, (b) 103 K, (c) 118 K, (d) 133 K, (e) 143 K, (f) 173 K and (g) 203 K.
can be understood on the basis of polarizability changes for the NP emission and dielectric interactions for the CT emis- sion. Similar behaviour is also observed in other solvents. Even in a glycerol-water mixture ( 1:1) where CT emission is exclusively observed (except for a trace presence of NP emission), the frozen glass shows emission from the NP state only. The relaxation being incomplete in the solid state gives a smaller energy difference between NP and CT emissions.
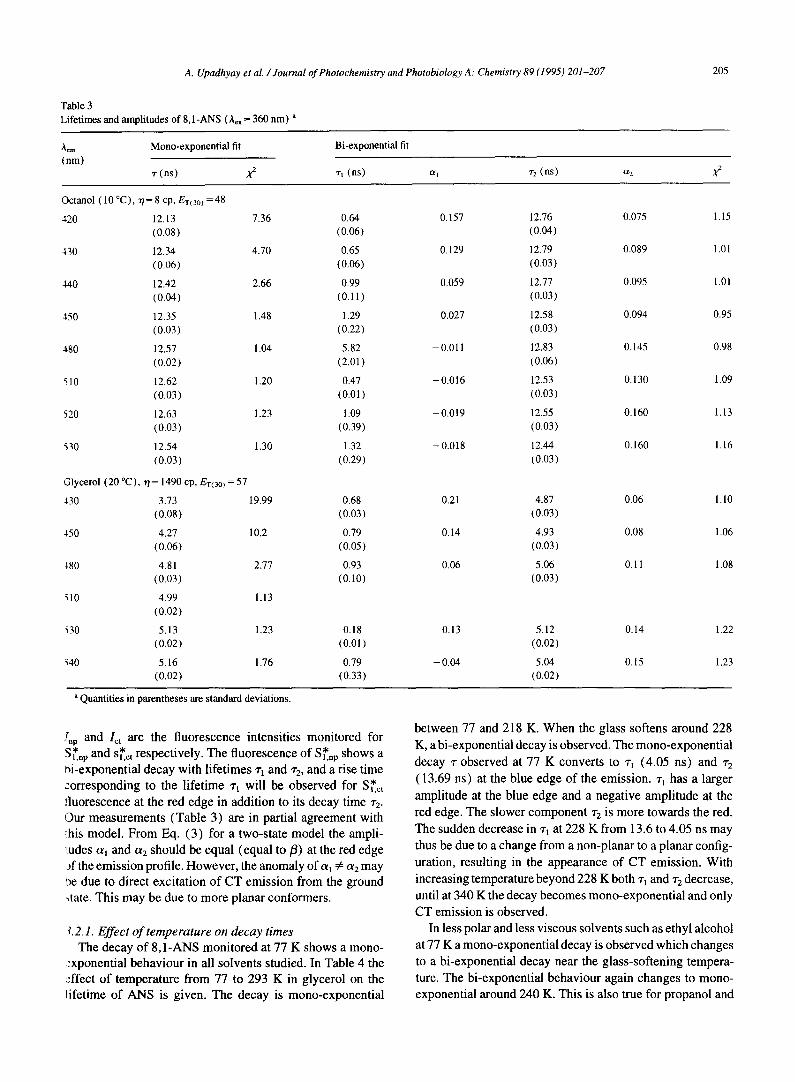
Fig. 5 displays the ratio of intensities (Ict/l,p) vs. temper- ature in two different solvents. As can be seen, a sudden change takes place near the melting point of the solvent.
3.2. Time-resolved spectra
8,1-ANS exhibited a large variation in fluorescence decay time in different solvents. It has been reported that in less
O_
c
v
1.4
1.2
l.O
0.8
o Ethylene glycol • Ethyl alcohal
0-4-..4-t ~ . w 0
0 . 2 I I I I 5 0 I 0 0 150 2 0 0 2 5 0
Temperature ( K )
I I
I 300 350
Fig. 5. Temperature variation of ratio of intensities of CT and NP emissions (lct/Inp) for 8,1-ANS in ethylene glycol (©) and ethyl alcohol (0) .
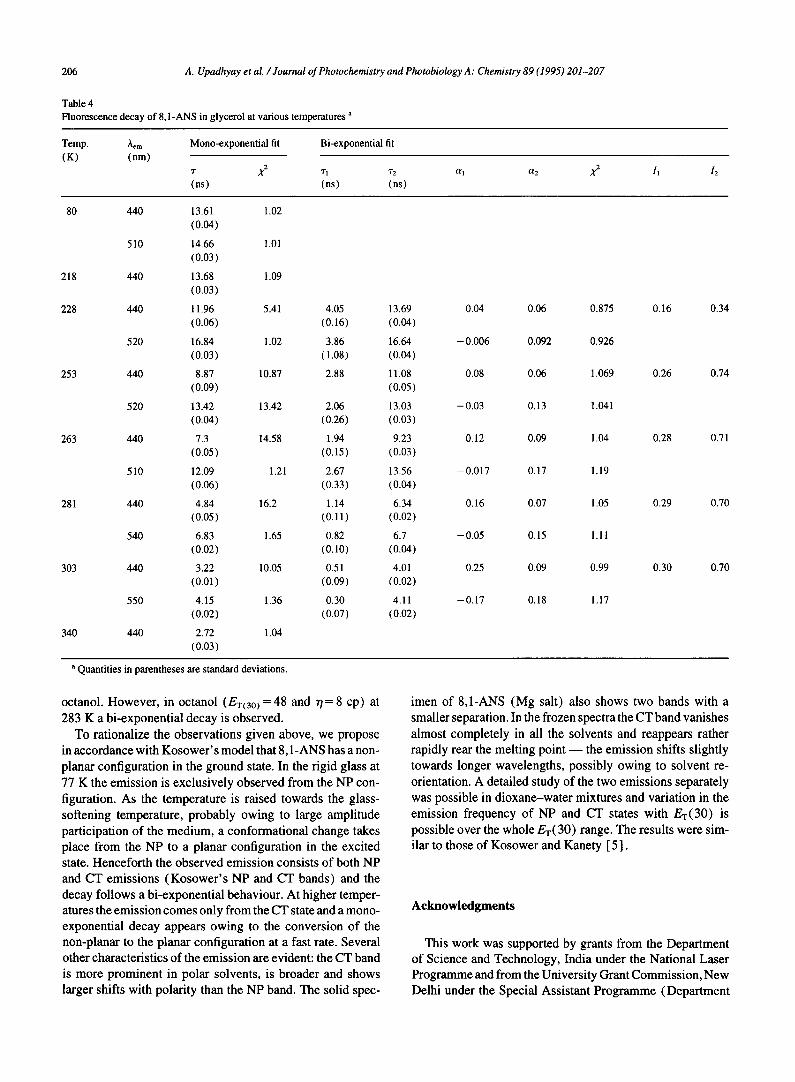
viscous solvents it exhibits a mono-exponential decay (CT) emission which remains invariant throughout the emission wavelength [ 8]. However, in viscous polar solvents ( r/> 8 cp) the data fit well into a two-state model (Table 3). The fluorescence decay of 8,1-ANS shows a bi-exponential behavi0ur at the blue edge of the emission profile. Similarly, at the red edge of the emission band the decay is bi-exponen- tial with a rise time. However, at the emission peak the decay is mono-exponential. With increasing polarity of the solvent there is a greater quenching in ~'2 emission, as seen by its low value in glycerol compared with octanol, due to non-radiative quenching, which increases tremendously when ET > 58 in conformity with the results of Sadkowski and Fleming [ 11 ]. It is also seen that at the blue edge the amplitude of ~-~ is comparatively larger in high viscosity solvents (more so in glycerol than in octanol).
A two-state model for the photophysics of 8,1-ANS yields Eq. (1) S* • Lnp can return to the ground state at a rate knp comprising fluorescence and quenching processes. S~np forms S* at rate k 1. S* 1,ct l,ct can also fluoresce or return to the ground state by other pathways at the overall rate kct. The reversible transfer rate from S~,~t to S~,,p is k_ 1. The standard solutions to the differential rate expression for the decay of S* and S~.~t are given by 1 , n p
Inp(t)=alexp(--~l)+ot2exp(--t ~ (2)
Ict(t) = f l [ e x p ( - t ) - e x p ( - ~1)] (3)
(if formation of S ~,ct from S ~.,p is the only excited state proc- ess and no direct excitation of CT from the ground state is taking place), where
1 1 - - , - - = ½{ (knp+kl + k e t + k - 1 ) T~ "r 2
4- [ (kct + k_ 1 -knr,-kl)2+4klk_l] w2 }
A. Upadhyay et aL / Journal of Photochemistry and Photobiology A: Chemistry 89 (1995) 201-207
Table 3 Lifetimes and amplitudes of 8,1-ANS ()re, = 360 nm) a
205
A.,. Mono-exponential fit Bi-exponential fit (nm)
z (ns) X 2 r, (ns) a, r~ (ns) az X 2
Octanol ( 10 °C), "q= 8 cp, Ex(3o) =48
420 12,13 7.36 0.64 0.157 12.76 0.075 1.15 (0,08) (0.06) (0.04)
430 12,34 4.70 0.65 0.129 12.79 0.089 1.01 (0,06) (0.06) (0.03)
440 12.42 2.66 0.99 0.059 12.77 0.095 1.01 (0.04) (0.11) (0.03)
450 12.35 1.48 1.29 0.027 12.58 0.094 0.95 (0,03) (0.22) (0.03)
480 12,57 1.04 5.82 -0 .011 12.83 0.145 0.98 (0,02) (2.01) (0.06)
510 12,62 1.20 0.47 - 0.016 12.53 0.130 1.09 (0,03) (0.01) (0.03)
520 12.63 1.23 1.09 -0 .019 12.55 0.160 1.13 (0,03) (0.39) (0.03)
530 12.54 1.30 1.32 -0 .018 12.44 0.160 1.16 (0.03) (0.29) (0.03)
Glycerol (20 °C), 77= 1490 cp, ET(3o) = 57
~30 3.73 19.99 0.68 0.21 4.87 0.06 1.10 (0.08) (0.03) (0.03)
-~50 4.27 10.2 0.79 0.14 4.93 0.08 1.06 (0.06) (0.05) (0.03)
480 4.81 2.77 0.93 0.06 5.06 0.11 1.08 (0.03) (0.10) (0.03)
510 4.99 1.13 (0.02)
530 5.13 1.23 0.18 - 0 . 1 3 5.12 0.14 1.22 (0.02) (0.01) (0.02)
~40 5.16 1.76 0.79 - 0.04 5.04 0.15 1.23 (0.02) (0.33) (0.02)
Quantities in parentheses are standard deviations.
,~p and let are the fluorescence intensities monitored for S ~.np and s~.ct respectively. The * fluorescence of S,.np shows a igi-exponential decay with lifetimes ~'1 and ~'2, and a rise time corresponding to the lifetime ~'l will be observed for S,*¢, fluorescence at the red edge in addition to its decay time r2. Our measurements (Table 3) are in partial agreement with ~his model. From Eq. (3) for a two-state model the ampli- ,udes a, and a2 should be equal (equal to/3) at the red edge :)f the emission profile. However, the anomaly of a, 4= a 2 may !ge due to direct excitation of CT emission from the ground .tate. This may be due to more planar conformers.
~.2.1. Effect of temperature on decay times The decay of 8,1-ANS monitored at 77 K shows a mono-
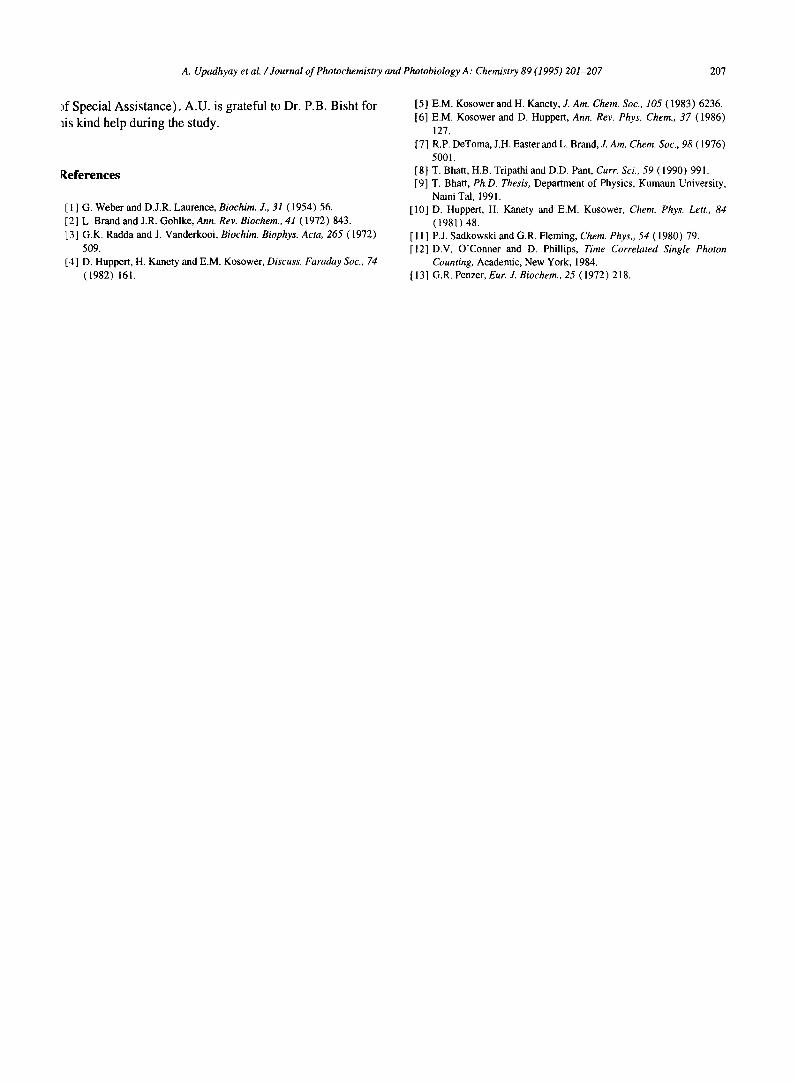
~xponential behaviour in all solvents studied. In Table 4 the effect of temperature from 77 to 293 K in glycerol on the lifetime of ANS is given. The decay is mono-exponential
between 77 and 218 K. When the glass softens around 228 K, a bi-exponential decay is observed. The mono-exponential decay r observed at 77 K converts to ~-~ (4.05 ns) and z2 ( 13.69 ns) at the blue edge of the emission. ~-~ has a larger amplitude at the blue edge and a negative amplitude at the red edge. The slower component r 2 is more towards the red. The sudden decrease in ~-, at 228 K from 13.6 to 4.05 ns may thus be due to a change from a non-planar to a planar config- uration, resulting in the appearance of CT emission. With increasing temperature beyond 228 K both ~', and ~'2 decrease, until at 340 K the decay becomes mono-exponential and only CT emission is observed.
In less polar and less viscous solvents such as ethyl alcohol at 77 K a mono-exponential decay is observed which changes to a bi-exponential decay near the glass-softening tempera- ture. The bi-exponential behaviour again changes to mono- exponential around 240 K. This is also true for propanol and
206 A. Upadhyay et al. / Journal of Photochemistry and Photobiology A: Chemistry 89 (1995) 201-207
Table 4 Fluorescence decay of 8,I-ANS in glycerol at various temperatures"
Temp. Aem Mono~xponemiM fit (K) (nm)
Bi-exponentiN fit
r x ~ r, r2 ~, ~2 x ~ (ns) (ns) (ns)
Ii h
80 440 13.61 1.02 (0.04)
510 14.66 1.01 (0.03)
218 440 13.68 1.09 (0.03)
228 440 11.96 5.41 4.05 13.69 0.04 0.06 0.875 0.16 0.34 (0.06) (0.16) (0.04)
520 16.84 1.02 3.86 16.64 -0.006 0.092 0.926 (0.03) (1.08) (0.04)
253 440 8.87 10.87 2.88 11.08 0.08 0.06 1.069 0.26 0.74 (0.09) (0.05)
520 13.42 13.42 2.06 13.03 - 0.03 0.13 1.041 (0.04) (0.26) (0.03)
263 440 7.3 14.58 1.94 9.23 0.12 0.09 1.04 0.28 0.71 (0.05) (0.15) (0.03)
510 12.09 1.21 2.67 13.56 -0.017 0.17 1.19 (0.06) (0.33) (0.04)
281 440 4.84 16.2 1.14 6.34 0.16 0.07 1.05 0.29 0.70 (0.05) (0.11 ) (0.02)
540 6.83 1.65 0.82 6.7 - 0.05 0.15 1.11 (0.02) (0.10) (0.04)
303 440 3.22 10.05 0.51 4.01 0.25 0.09 0.99 0.30 0.70 (0.01) (0.09) (0.02)
550 4.15 1.36 0.30 4.11 -0.17 0.18 1.17 (0.02) (0.07) (0.02)
340 440 2.72 1.04 (0.03)
a Quantities in parentheses are standard deviations.
octanol. However, in octanol ( E T o o ) = 4 8 and r / = 8 cp) at 283 K a bi-exponential decay is observed.
To rationalize the observations given above, we propose in accordance with Kosower ' s model that 8,1-ANS has a non- planar configuration in the ground state. In the rigid glass at 77 K the emission is exclusively observed from the NP con- figuration. As the temperature is raised towards the glass- softening temperature, probably owing to large amplitude participation of the medium, a conformational change takes place from the NP to a planar configuration in the excited state. Henceforth the observed emission consists of both NP and CT emissions (Kosower ' s NP and CT bands) and the decay follows a bi-exponential behaviour. At higher temper- atures the emission comes only from the CT state and a mono- exponential decay appears owing to the conversion of the non-planar to the planar configuration at a fast rate. Several other characteristics of the emission are evident: the CT band is more prominent in polar solvents, is broader and shows larger shifts with polarity than the NP band. The solid spec-
imen of 8,1-ANS (Mg salt) also shows two bands with a smaller separation. In the frozen spectra the CT band vanishes
almost completely in all the solvents and reappears rather rapidly rear the melting point - - the emission shifts slightly towards longer wavelengths, possibly owing to solvent re- orientation. A detailed study of the two emissions separately was possible in dioxane-water mixtures and variation in the emission frequency of NP and CT states with E r ( 3 0 ) is possible over the whole F--r(30) range. The results were sim- ilar to those of Kosower and Kanety [ 5 ].
Acknowledgments
This work was supported by grants from the Department of Science and Technology, India under the National Laser Programme and from the University Grant Commission, New Delhi under the Special Assistant Programme (Department
A. Upadhyay et al. / Journal of Photochemistry and Photobiology A: Chemistry 89 (1995) 201-207 207
)f Special Assistance). A.U. is grateful to Dr. P.B. Bisht for )is kind help during the study.
~eferences
[ 1 ] G. Weber and D.J.R. Laurence, Biochim. J., 31 (1954) 56. [2] L. Brand and J.R. Gohlke, Ann. Rev. Biochem., 41 (1972) 843. [3] G.K. Radda and J. Vanderkooi, Biochim. Biophys. Acta, 265 (1972)
509. [4] D, Huppert, H. Kanety and E.M. Kosower, Discuss. Faraday Soc., 74
(1982) 161.
[5] E.M. Kosower and H. Kanety, J. Am. Chem. Soc., 105 (1983) 6236. [6] E.M. Kosower and D. Huppert, Ann. Rev. Phys. Chem., 37 (1986)
127. [7] R.P. DeToma, J.H. Easter and L. Brand, J. Am. Chem. Soc., 98 (1976)
5001. [8] T. Bhatt, H.B. Tripathi and D.D. Pant, Curr. Sci., 59 (1990) 991. [9] T. Bhatt, Ph.D. Thesis, Department of Physics, Kumaun University,
Naini Tal, 1991. [10] D. Huppert, H. Kanety and E.M. Kosower, Chem. Phys. Lett., 84
(1981) 48. [ 11 ] P.J. Sadkowski and G.R. Fleming, Chem. Phys., 54 (1980) 79. [12] D.V. O'Conner and D. Phillips, Time Correlated Single Photon
Counting, Academic, New York, 1984. [13] G.R. Penzer, Eur. J. Biochem., 25 (1972) 218.