Embed Size (px)
Citation preview

Phys. Status Solidi A 206, No. 12, 2715–2722 (2009) / DOI 10.1002/pssa.200925302 p s sa
statu
s
soli
di
www.pss-a.comph
ysi
ca
applications and materials science
Photophysical properties of the
asymmetrically substituted spirobifluorenesspiro-DPO and spiro-MeO-DPOCornelia M. Brendel1, Fernando B. Dias2, Tobat P. I. Saragi1, Andy P. Monkman2, and Josef Salbeck*,1
1Macromolecular Chemistry and Molecular Materials, Institute of Chemistry, Department of Science and Center for Interdisciplinary
Nanostructure Science and Technology (CINSaT), University of Kassel, Heinrich-Plett-Strasse 40, 34132 Kassel, Germany2Durham Photonic Materials Institute, Department of Physics, University of Durham, South Road, Durham DH1 3LE, United Kingdom
Received 8 June 2009, revised 26 August 2009, accepted 8 September 2009
Published online 13 October 2009
PACS 31.70.Hq, 33.50.�j, 34.70.þe, 72.80.Le
* Corresponding author: e-mail [email protected], Phone: þ49 561 804 4425, Fax: þ49 561 804 4555
The photophysical behaviour of the oxadiazolyl (PBD) and
diphenylamino (TAD) substituted spirobifluorenes 20,70-bis-
(N,N-diphenylamino)-2-(5-(4-tert-butylphenyl)-1,3,4-oxadiazol-
2-yl)-9,90-spirobifluoren (spiro-DPO) and 20,70-bis-(N,N-
diphenylamino)-2-(5-(4-tert-butylphenyl)-1,3,4-oxadiazol-2-
yl)-9,90-spirobifluoren (spiro-MeO-DPO) has been investigated
by temperature-dependent steady-state absorption and lumi-
nescence spectroscopy and gated measurements. Fluorescence
and phosphorescence lifetime measurements, relative quantum
yields and dipole moments of the excited states have been
determined. Asymmetrically substituted spirobifluorenes
exhibit charge-transfer (CT) emission due to coupling
(spiroconjugation) between the fluorene fragments of spirobi-
fluorene. They show a considerable ground-state dipole
moment and exist as equilibrating conformeres. Population of
the CT state only occurs after absorption to the locally excited
singlet state. The CT fluorescence is dominated by the emission
of two equilibrating conformeres with similar dipole moments.
At low temperature they planarize in bothmolecular halves and
show strong phosphorescence that is still detectable at room
temperature.
� 2009 WILEY-VCH Verlag GmbH & Co. KGaA, Weinheim
1 Introduction The electronic properties of spiro-linked hydrocarbons have attracted the attention of severalauthors [1–4] since several decades. Spiro-linked hydro-carbons are twisted by 908 to each other and belong to theD2d
point group. The electronic coupling across the spiro linkageis called spiroconjugation. It can only occur if the p orbitalsof the atoms next to the spiro carbon atom are antisymmetricwith respect to the planes of both the spiro-linked hydro-carbons. Spiroconjugation has been subject to electron spinresonance studies [1] as well as to model calculations [4].
Spiro-linked charge-transfer (CT) dyes have beenprepared from a 1,3-indandione acceptor and an aromaticamine as donor [5–7]. These dyes contain nitrogen or sulphuratoms next to the spiro carbon atom so that the p orbitals ofthese heteroatoms take part in the spiroconjugation.
In recent years Lukes et al. [8, 9] have calculated thegeometry of spirobifluorene derivatives using the AM1model and the absorption and fluorescence spectra using thecollective electronic oscillator method [10]. For spiro-linked
oligophenylenes they conclude that the single moietiesplanarize in the excited state, that a CT across the spirocarbon atom is likely, and that optical excitation leads to aconfinement of the energy in only one of the two fluorenefragments. This is in accord with the results of van Dantziget al. [11] who found that coupling between the fluorenefragments of spirobifluorene is also feasible in the groundstate as soon as the D2d symmetry is broken by differentsubstitution patterns of the fluorene fragments. Furthermore,spiroconjugation plays an important role in polyspirobi-fluorene derivatives [12, 13].
Asymmetric-substituted spirobifluorene derivativeswith left-right [14] or top-down asymmetry (see SupportingInformation, Scheme 1) show clearly different propertiesfrom the symmetrically substituted spirobifluorene deriva-tives [15]. Due to the donor–acceptor substitution patternasymmetric bipolar compounds exhibit CT emission andfluorescence lifetimes that are a multiple of those of thesymmetric-substituted spirobifluorenes.
� 2009 WILEY-VCH Verlag GmbH & Co. KGaA, Weinheim

2716 C. M. Brendel et al.: Photophysical properties of spiro-DPO and spiro-MeO-DPOp
hys
ica ssp st
atu
s
solid
i a
Figure 1 The bipolar substituted spirobifluorenes spiro-DPO andspiro-MeO-DPO derive from the evenly substituted compoundsspiro-TAD and spiro-PBD.
In this paper, spiro-DPO (Fig. 1) and its more electron-rich derivative spiro-MeO-DPO are investigated in detail.Both exhibit mainly CT emission, only weak fluorescencefrom the locally excited state and strong, long-livedphosphorescence that originates from the diphenylamine-substituted part (TAD moiety) of the molecule. Thetemperature and polarity dependence of the absorption andluminescence spectra of these compounds will be discussed.Room temperature measurements on spiro-DPO havealready been reported [16].
2 Experimental Spiro-DPO and spiro-MeO-DPOwere synthesized and purified as described elsewhere [17].Only spectroscopic grade solvents were used. 2-Methyl-tetrahydrofuran (methyl-THF) was refluxed over potassiumhydroxide to remove stabilizers, and distilled over sodium.Concentrations of the investigated molecules were alwayswell beneath 10�5M.
� 2009 WILEY-VCH Verlag GmbH & Co. KGaA, Weinheim
Absorption spectra were recorded using PerkinElmerLambda 19 and Lambda 900 UV/VIS/NIR spectrometers.Steady-state luminescence measurements were performedusing a Hitachi F-4500 and a Jobin Yvon Fluorologspectrometer. Fluorescence lifetimes were measured bymeans of a FluoTime 200 spectrometer and deconvolutedusing FluoFit 4.2.1 software (Picoquant).
The relative fluorescence quantum yield is calculated bydividing the integrated emission spectrum by the absorptionat the excitation wavelength. This value is then set intoproportion to the quantum yield of quinine sulphate [18, 19]in 1N sulphuric acid and corrected for the refractive indicesof the different solvents.
Gated luminescence measurements were performedusing a system with a pulsed YAG laser emitting at 355 nm(SL 312 from EKSPLA) as excitation source. Samples wereexcited at 90 degree angle to the detector. The energy of eachpulse was about 50mJ, the beam diameter falling on thesample was about 1 cm. With the help of a spectrograph(TRIAX from JobinYvonHoriba) luminescence was col-lected onto a gated iCCD camera (4 PICOS from StanfordComputer Optics) with sub-nanosecond resolution. Spectrawere corrected for spectral characteristics of the iCCDcamera by calibration with a LLS-1-CAL-220 CalibrationHalogen Lamp from Ocean Optics. For low temperaturemeasurement samples were placed in an OptistatDN (OxfordInstruments) or a VNF-100 (Janis Research Co.) cryostat.Phosphorescence lifetimes weremeasured by integrating theemission measured at linearly successive time delays,plotting the natural logarithm versus time and fitting linearly.The excitation frequency could not be chosen smaller than1Hz, so decays with longer lifetimes could not be observedtotally and the given lifetimes are estimates. In caseswhere the spectra of delayed fluorescence and phosphor-escence are overlapping, decays were measured by integrat-ing the emission measured at successive time delays withlogarithmically increasing integration times. Data wereanalysed according to a procedure in literature [20]. Twolifetimes were obtained of which the longer was attributed tophosphorescence.
Time-resolved fluorescence measurements were per-formed using a FluoTime100 lifetime spectro-fluorometerfrom PicoQuant with a diode laser (375 nm) as excitationsource. As excitation frequencies, 5MHz (200 ns timeframe) and 2.5MHz (400 ns time frame) were chosen. Thechannel widths (resolutions) were 70 and 140 ps andthe impulse response functions 0.42 and 0.55 ns, respec-tively. For each sample fluorescence decays were measuredat various wavelengths and fitted globally by means of theFluoFit 4.2.1 software (PicoQuant).
3 Results and discussion3.1 Temperature-dependent absorption The
absorption spectrum of spiro-DPO (Fig. 2) features asuperposition of the absorption signals of the TAD (around380 nm) and the PBD (peaks 300–355 nm) moiety (seeSupporting Information, Figs. 1 and 2), it is analogous for
www.pss-a.com
Phys. Status Solidi A 206, No. 12 (2009) 2717
Original
Paper
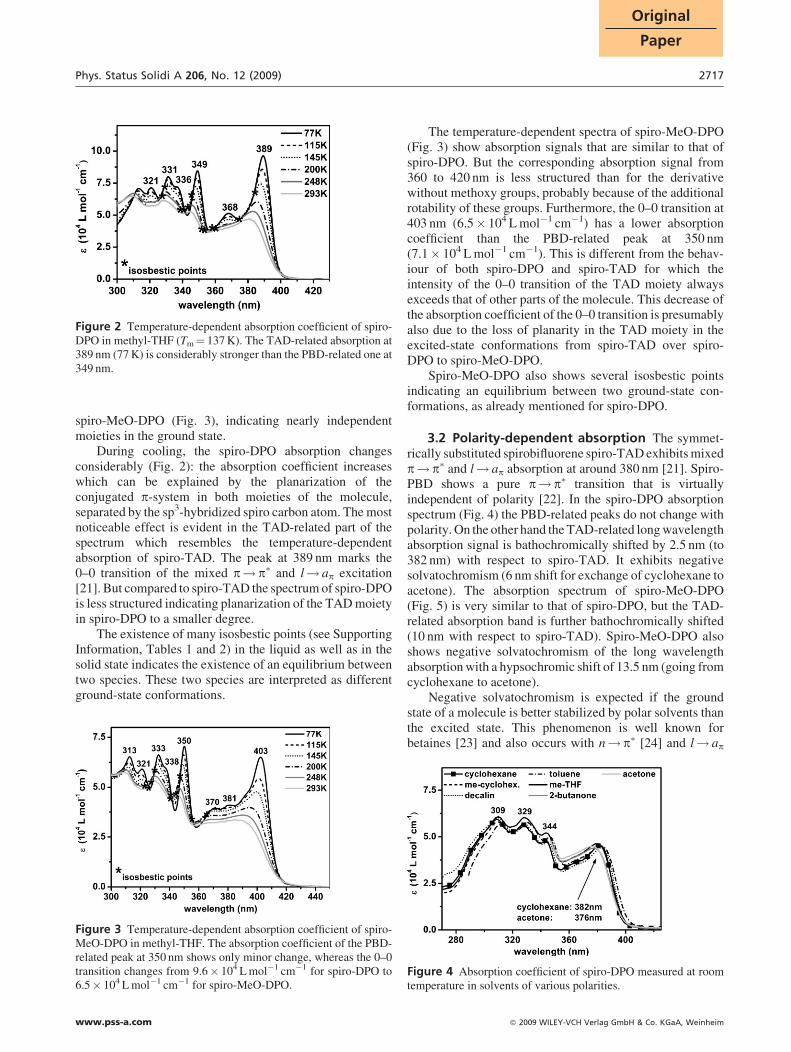
Figure 2 Temperature-dependent absorption coefficient of spiro-DPO in methyl-THF (Tm¼ 137K). The TAD-related absorption at389 nm (77K) is considerably stronger than the PBD-related one at349 nm.
spiro-MeO-DPO (Fig. 3), indicating nearly independentmoieties in the ground state.
During cooling, the spiro-DPO absorption changesconsiderably (Fig. 2): the absorption coefficient increaseswhich can be explained by the planarization of theconjugated p-system in both moieties of the molecule,separated by the sp3-hybridized spiro carbon atom. Themostnoticeable effect is evident in the TAD-related part of thespectrum which resembles the temperature-dependentabsorption of spiro-TAD. The peak at 389 nm marks the0–0 transition of the mixed p! p� and l! ap excitation[21]. But compared to spiro-TAD the spectrum of spiro-DPOis less structured indicating planarization of the TADmoietyin spiro-DPO to a smaller degree.
The existence of many isosbestic points (see SupportingInformation, Tables 1 and 2) in the liquid as well as in thesolid state indicates the existence of an equilibrium betweentwo species. These two species are interpreted as differentground-state conformations.
Figure 3 Temperature-dependent absorption coefficient of spiro-MeO-DPO in methyl-THF. The absorption coefficient of the PBD-related peak at 350 nm shows only minor change, whereas the 0–0transition changes from 9.6� 104 Lmol�1 cm�1 for spiro-DPO to6.5� 104 Lmol�1 cm�1 for spiro-MeO-DPO.
www.pss-a.com
The temperature-dependent spectra of spiro-MeO-DPO(Fig. 3) show absorption signals that are similar to that ofspiro-DPO. But the corresponding absorption signal from360 to 420 nm is less structured than for the derivativewithout methoxy groups, probably because of the additionalrotability of these groups. Furthermore, the 0–0 transition at403 nm (6.5� 104 Lmol�1 cm�1) has a lower absorptioncoefficient than the PBD-related peak at 350 nm(7.1� 104 Lmol�1 cm�1). This is different from the behav-iour of both spiro-DPO and spiro-TAD for which theintensity of the 0–0 transition of the TAD moiety alwaysexceeds that of other parts of the molecule. This decrease ofthe absorption coefficient of the 0–0 transition is presumablyalso due to the loss of planarity in the TAD moiety in theexcited-state conformations from spiro-TAD over spiro-DPO to spiro-MeO-DPO.
Spiro-MeO-DPO also shows several isosbestic pointsindicating an equilibrium between two ground-state con-formations, as already mentioned for spiro-DPO.
3.2 Polarity-dependent absorption The symmet-rically substituted spirobifluorene spiro-TADexhibitsmixedp! p� and l! ap absorption at around 380 nm [21]. Spiro-PBD shows a pure p! p� transition that is virtuallyindependent of polarity [22]. In the spiro-DPO absorptionspectrum (Fig. 4) the PBD-related peaks do not change withpolarity. On the other hand the TAD-related longwavelengthabsorption signal is bathochromically shifted by 2.5 nm (to382 nm) with respect to spiro-TAD. It exhibits negativesolvatochromism (6 nm shift for exchange of cyclohexane toacetone). The absorption spectrum of spiro-MeO-DPO(Fig. 5) is very similar to that of spiro-DPO, but the TAD-related absorption band is further bathochromically shifted(10 nm with respect to spiro-TAD). Spiro-MeO-DPO alsoshows negative solvatochromism of the long wavelengthabsorptionwith a hypsochromic shift of 13.5 nm (going fromcyclohexane to acetone).
Negative solvatochromism is expected if the groundstate of a molecule is better stabilized by polar solvents thanthe excited state. This phenomenon is well known forbetaines [23] and also occurs with n! p� [24] and l! ap
Figure 4 Absorption coefficient of spiro-DPO measured at roomtemperature in solvents of various polarities.
� 2009 WILEY-VCH Verlag GmbH & Co. KGaA, Weinheim

2718 C. M. Brendel et al.: Photophysical properties of spiro-DPO and spiro-MeO-DPOp
hys
ica ssp st
atu
s
solid
i a
Figure 5 Absorption coefficient of spiro-MeO-DPO measured atroom temperature in solvents of various polarities.
Figure 6 Steady-state luminescence of spiro-DPO measured inmethyl-THF (77–145K). The conformation relaxes, and the phos-phorescence shifts bathochromically as soon as the glass point atabout 92K is reached.
Figure 7 Steady-state luminescence of spiro-DPO measured inmethyl-THF (182–290K). The isoemissive point at 531 nm (220–290K) indicates an equilibrium between two CT states.
[25] transitions because their ground states have largerdipole moments than the excited states as well.
Accordingly, the dipole moment of the unsymmetricspiro-compounds in the ground state is higher than in thelocally excited state. Additionally the solvatochromicbehaviour of spiro-DPO and spiro-MeO-DPO indicates anincrease of the ground-state dipole moment by the additionof methoxy substituents. For reasons of symmetry, spiro-TAD should have no ground-state dipole moment. Incontrast, spiro-DPO and spiro-MeO-DPO are unsymmetricmolecules and therefore have ground-state dipole moments.The absorption which shows the negative solvatochromismis assigned to a transition in the TAD moiety. The ground-state dipole in the TAD moiety can be explained bya symmetry break in the conformation of the unsymmetricspiro-DPO and spiro-MeO-DPO. Coupling across the spiro-linkage in the ground state is allowed as soon as the D2d
symmetry of the molecule is broken by uneven substitutionof the fluorene fragments [11].
The absorption leads to a locally excited state with adipole moment smaller than in the ground state. This locallyexcited state then further transfers to a CT state as shown inthe following. An absorption directly into the CT state hasnot been observed.
3.3 Temperature-dependent luminescence Inthe CT process an electron is transferred from the electron-rich TAD to the electron withdrawing PBD moiety in spiro-DPO. The room temperature emission of spiro-DPO isobserved as one broad CT fluorescence signal withmaximum intensity at 510 nm in methyl-THF.
With decreasing temperature the luminescence spectrumchanges drastically: at 77K spiro-DPO exhibits locallyexcited fluorescence at 400 nm and emission from anunrelaxed CT state at about 446 nm (Fig. 6). With highestintensity, phosphorescence is detected at 514 nm and longerwavelengths. Phosphorescence originates from the TADmoiety of spiro-DPO. The electron lone-pair at the nitrogenatom is involved in an intramolecular CT to the adjoiningp-systems (so called l! ap transition [25]). Thereby the
� 2009 WILEY-VCH Verlag GmbH & Co. KGaA, Weinheim
electron moves between non-parallel orbitals creating aspin–orbit coupling that intensifies the phosphorescence.The phosphorescence is presumably of mixed p! p� andl! ap character [21].
Above the melting point of the solvent (at 137K) thephosphorescence slowly diminishes. In the liquid solvent theCT state is able to relax and emits at longer wavelengths thanin the supercooled liquid (temperature region between themelting point and the glass transition temperature at �91K[26]) or the glassy matrix. In the liquid solvent also thequantum yield of the CT emission decreases considerably.With increasing temperature the bathochromic shift of theCT band results in an overlap with the phosphorescenceemission.
With further increasing temperature (Fig. 7) thephosphorescence fades away and leaves the CT emissionthat shifts hypsochromically to 510 nm at room temperature.An isoemissive point at 531 nm indicates an equilibriumbetween two emissive states, presumably two CT states withdiffering conformations, as described by Maus and Rettig[27, 28] for sterically hindered biphenyls. The hypsochromicshift with increasing temperature is probably due to a shift of
www.pss-a.com

Phys. Status Solidi A 206, No. 12 (2009) 2719
Original
Paper
Figure 8 Steady-state luminescenceofspiro-MeO-DPOmeasuredin methyl-THF (77–145K). As for spiro-DPO the phosphorescenceshifts bathochromically due to conformational relaxation above theglass point.
this equilibrium towards the less planar conformation,reducing the conjugation.
Spiro-MeO-DPO shows room temperature emission inmethyl-THF as one broad CT fluorescence signal withmaximum intensity at 539 nm. The CT emission of spiro-MeO-DPO in methyl-THF can only be detected at highertemperatures in the liquid sample above themelting point. Atlower temperatures in the solid and supercooled sample theCT emission overlaps completely with the phosphorescence(Fig. 8). The phosphorescence lifetime of spiro-MeO-DPOdecreases faster with increasing temperature than in the caseof spiro-DPO (see Supporting Information, Tables 5 and 6).Thus in the liquid sample (Fig. 9) steady-state spectra showalmost pure fluorescence that shifts hypsochromically withincreasing temperature, showing an isoemissive point thatimplies a similar interplay of the CT conformations as forspiro-DPO.
A difference in luminescence intensity between spiro-DPO and spiro-MeO-DPO is in the temperature dependence:above themelting point spiro-DPOshows a first decrease andfollowing increase of luminescence intensity with increasingtemperature whereas spiro-MeO-DPO exhibits first an
Figure 9 Steady-state luminescence of spiro-MeO-DPO meas-ured in methyl-THF (145–295K).
www.pss-a.com
increase and then a decrease of intensity (Figs. 8 and 9).The intensity decrease of the emission of spiro-DPO is due tothe decrease of the overlapping phosphorescence. Thefollowing increase can be caused by the different propertiesof the equilibrating CT-state conformeres of spiro-DPO.With increasing temperature the less planar conformereshould be favoured. This conformere should have a higherquantum yield than the more planar conformere. For the lessplanar conformere resembles the (non-planar) ground-stateconformation. In contrast, for spiro-MeO-DPO there is nophosphorescence overlap for the temperatures in question,and the increasing intensity can be accounted for by themechanism mentioned above.
Going from methyl-THF to methyl-cyclohexane assolvent, the phosphorescence of spiro-DPO shifts from 514to 518 nm and that of spiro-MeO-DPO from 522 to 529 nm,exhibiting negative solvatochromism (see Supporting Infor-mation, Figs. 3 and 4). Negative solvatochromism thatincreases from spiro-DPO to spiro-MeO-DPO was alsofound for the absorption spectra, as mentioned above. At77K the vibronic structure of the phosphorescence signalresembles the mirror image of the absorption. Additionally,the vibronic structures of both phosphorescence andabsorption are sensitive to temperature in the same way.
So the locally excited triplet state does not only show asmaller dipole moment than the ground state, similar to thelocally excited singlet state. It is also comparable to thecorresponding singlet state concerning localization andconformation.
3.4 Polarity-dependent fluorescence In steady-state fluorescence measurements local emission of spiro-DPO (Fig. 10) can only be detected at about 400 nm in lowpolarity solvents such as cyclohexane and decalin. The mostintensive fluorescence signal is sensitive to polarity andshifts bathochromically ca. 104 nm when the solvent ischanged from cyclohexane to acetone (for peak values andcorresponding polarities, see Supporting Information,Tables 3 and 4). The fluorescence spectra can be fitted bythree Gaussian peaks for each polarity: local excited-state
Figure 10 Fluorescence spectra of spiro-DPO measured insolvents of various polarities.
� 2009 WILEY-VCH Verlag GmbH & Co. KGaA, Weinheim
2720 C. M. Brendel et al.: Photophysical properties of spiro-DPO and spiro-MeO-DPOp
hys
ica ssp st
atu
s
solid
i a
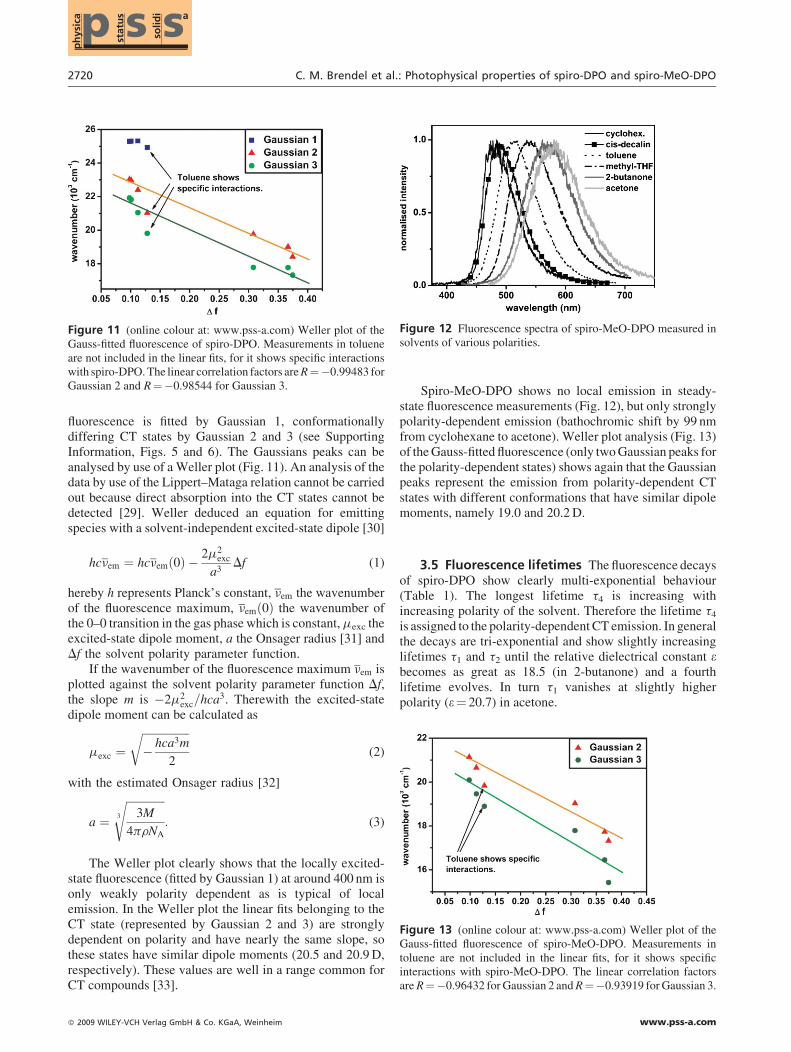
Figure 11 (online colour at: www.pss-a.com) Weller plot of theGauss-fitted fluorescence of spiro-DPO. Measurements in tolueneare not included in the linear fits, for it shows specific interactionswith spiro-DPO.The linear correlation factors areR¼�0.99483 forGaussian 2 and R¼�0.98544 for Gaussian 3.
Figure 12 Fluorescence spectra of spiro-MeO-DPO measured insolvents of various polarities.
fluorescence is fitted by Gaussian 1, conformationallydiffering CT states by Gaussian 2 and 3 (see SupportingInformation, Figs. 5 and 6). The Gaussians peaks can beanalysed by use of a Weller plot (Fig. 11). An analysis of thedata by use of the Lippert–Mataga relation cannot be carriedout because direct absorption into the CT states cannot bedetected [29]. Weller deduced an equation for emittingspecies with a solvent-independent excited-state dipole [30]
� 20
hcnem ¼ hcnemð0Þ �2m2
exc
a3Df (1)
hereby h represents Planck’s constant, nem the wavenumberof the fluorescence maximum, nemð0Þ the wavenumber ofthe 0–0 transition in the gas phase which is constant,mexc theexcited-state dipole moment, a the Onsager radius [31] andDf the solvent polarity parameter function.
If the wavenumber of the fluorescence maximum nem isplotted against the solvent polarity parameter function Df,the slope m is �2m2
exc=hca3. Therewith the excited-state
dipole moment can be calculated as
mexc ¼ffiffiffiffiffiffiffiffiffiffiffiffiffiffiffiffiffi� hca3m
2
r(2)
with the estimated Onsager radius [32]
a ¼ffiffiffiffiffiffiffiffiffiffiffiffiffiffi3M
4prNA
3
s: (3)
Figure 13 (online colour at: www.pss-a.com) Weller plot of theGauss-fitted fluorescence of spiro-MeO-DPO. Measurements intoluene are not included in the linear fits, for it shows specificinteractions with spiro-MeO-DPO. The linear correlation factorsareR¼�0.96432 for Gaussian 2 andR¼�0.93919 forGaussian 3.
The Weller plot clearly shows that the locally excited-state fluorescence (fitted by Gaussian 1) at around 400 nm isonly weakly polarity dependent as is typical of localemission. In the Weller plot the linear fits belonging to theCT state (represented by Gaussian 2 and 3) are stronglydependent on polarity and have nearly the same slope, sothese states have similar dipole moments (20.5 and 20.9D,respectively). These values are well in a range common forCT compounds [33].
09 WILEY-VCH Verlag GmbH & Co. KGaA, Weinheim
Spiro-MeO-DPO shows no local emission in steady-state fluorescence measurements (Fig. 12), but only stronglypolarity-dependent emission (bathochromic shift by 99 nmfrom cyclohexane to acetone). Weller plot analysis (Fig. 13)of theGauss-fitted fluorescence (only twoGaussian peaks forthe polarity-dependent states) shows again that the Gaussianpeaks represent the emission from polarity-dependent CTstates with different conformations that have similar dipolemoments, namely 19.0 and 20.2 D.
3.5 Fluorescence lifetimes The fluorescence decaysof spiro-DPO show clearly multi-exponential behaviour(Table 1). The longest lifetime t4 is increasing withincreasing polarity of the solvent. Therefore the lifetime t4is assigned to the polarity-dependent CT emission. In generalthe decays are tri-exponential and show slightly increasinglifetimes t1 and t2 until the relative dielectrical constant ebecomes as great as 18.5 (in 2-butanone) and a fourthlifetime evolves. In turn t1 vanishes at slightly higherpolarity (e¼ 20.7) in acetone.
www.pss-a.com

Phys. Status Solidi A 206, No. 12 (2009) 2721
Original
Paper
Table 1 Fluorescence lifetimes of spiro-DPO at room tempera-ture in various solvents (c< 10�5M, lex¼ 375 nm).
spiro-DPO t1 (ns) t2 (ns) t3 (ns) t4 (ns)
cyclohexane 0.60 4.52 14.31cis-decalin 0.93 4.67 14.42methyl-THF 0.95 5.53 21.792-butanone 0.60 4.00 9.68 36.05acetone 3.23 10.17 38.95
Spiro-MeO-DPO exhibits even longer lifetimes t4(Table 2), than spiro-DPO with up to 53.29 ns for thesolution in acetone. Again, t4 is assigned to the CT emission.The usually tri-exponential decays show similar tendenciesas those of spiro-DPO. A fourth exponential shows only forsolutions in 2-butanone and decalin.
3.6 Discussion Due to the equilibria in the conforma-tion of the ground-state and the CT-state spiro-DPO andspiro-MeO-DPOexhibit quite complex photophysics. This isespecially evident in the tri- or quarter-exponential fluo-rescence decays.
Following photoexcitation from the ground state to thelocally excited singlet-state electron transfer within themolecules happenswith a rate constant of 2.32� 1012 s�1 [16].
This rate constant is higher than the rate of fluorescencefrom the locally excited state, being in the range of1� 109 s�1 [34]. Locally excited-state fluorescence is stillobserved for spiro-DPO in unpolar solvents, so at least inthese solvents there should be an equilibrium betweenlocally excited state and CT state.
Direct intersystem crossing from the locally excitedsinglet to the triplet state of the TAD moiety is not probablealthough it would explain the strong phosphorescenceobserved in the steady-state spectra. The rate of intersystemcrossing (28� 107 s�1 in diphenylamine at 77K [35]) cannotcompete with the electron transfer rate. The triplet state istherefore probably populated by radical pair intersystemcrossing (RP-ISC) via the CT states [36]. This implies aquenching of the CT fluorescence that can explain the lowroom temperature quantum yields of less than 5% for spiro-DPO and spiro-MeO-DPO (see Supporting Information,Table 7).
Table 2 Fluorescence lifetimes of spiro-MeO-DPO at roomtemperature in various solvents (c< 10�5M, lex¼ 375 nm).
spiro-MeO-DPO t1 (ns) t2 (ns) t3 (ns) t4 (ns)
cyclohexane 0.40 3.72 19.01cis-decalin 0.57 2.59 7.35 23.00methyl-THF 0.62 5.65 45.702-butanone 0.51 4.04 9.96 51.26acetone 3.00 35.13 53.29
www.pss-a.com
4 Conclusion Spiro-DPO and spiro-MeO-DPO shownegative solvatochromism in the absorption and phosphor-escence spectra, different from symmetrically substitutedspiro-bifluorene derivatives as spiro-TAD.
This means that the ground states of spiro-DPO andspiro-MeO-DPO have larger dipole moments than thelocally excited singlet and triplet states. Temperature-dependent absorption spectra suggest a planarization ofthe molecules with decreasing temperature and showisosbestic points that indicate an equilibrium between twoground-state conformations. The room temperature emissionhas generally less than 5% quantum yield and originatesmainly from CT states (lifetimes up to 53 ns) that are onlypopulated via the Franck–Condon excited state as theabsorption spectra do not show any CT absorption band.The steady-state emission can be fitted with three Gaussiansignals for the locally excited-state emission and two CTstates which equilibrate and differ in conformation. Thisequilibrium may explain the temperature-dependent fluo-rescence shifts and intensity changes. Weller plot analysisshows that dipole moments of the CT states are around 20D.
Absorption and phosphorescence spectra showmatchingfeatures such as vibronic structure of the spectrum,sensitivity to temperature and negative solvatochromismthat are variably pronounced for spiro-DPO and spiro-MeO-DPO. Concerning location and conformation the phosphor-escence (lifetimes well beyond 1 s at 77K) thereforeprobably originates from a similar locally excited state inthe TAD moiety as the locally excited singlet state. Overall,the asymmetrically substituted spirobifluorenes exhibit aphotophysical behaviour that is dominated by the stronginfluence of temperature on the conformation of thesemolecules.
In which way the population of CT states influences theperformance of organic solar cells based on the describedcompounds is currently under investigation.
Acknowledgements C. M. B. thanks Dr. T. Fuhrmann-Lieker for fruitful discussions and the University of Kassel and theDAAD for a fellowship.
References
[1] R. D. Cowell, G. Urry, and S. I. Weissman, J. Chem. Phys. 38,2028 (1963).
[2] H. E. Simmons and T. Fukunaga, J. Am. Chem. Soc. 89, 5208(1967).
[3] R. Hoffmann, A. Imamura, and G. D. Zeiss, J. Am. Chem.Soc. 89, 5215 (1967).
[4] H. Durr and R. Gleiter, Angew. Chem. Int. Ed. Engl. 17, 559(1978).
[5] P. Maslak and A. Chopra, J. Am. Chem. Soc. 115, 9331(1993).
[6] P. Maslak, Adv. Mater. 6, 405 (1994).[7] P. Maslak, A. Chopra, C. R. Moylan, R. Wortmann, S. Lebus,
A. L. Rheingold, and G. P. A. Yap, J. Am. Chem. Soc. 118,1471 (1996).
[8] V. Lukes and M. Breza, J. Mol. Struct. 699, 93 (2004).
� 2009 WILEY-VCH Verlag GmbH & Co. KGaA, Weinheim

2722 C. M. Brendel et al.: Photophysical properties of spiro-DPO and spiro-MeO-DPOp
hys
ica ssp st
atu
s
solid
i a
[9] V. Lukes, R. Solc, F. Milota, J. Sperling, and H. F.Kauffmann, Chem. Phys. 349, 226 (2008).
[10] V. Lukes, T. Palszegi, F. Milota, J. Sperling, and H. F.Kauffmann, J. Phys. Chem. A 110, 1775 (2006).
[11] N. A. van Dantzig, D. H. Levy, C. Vigo, and P. Piotrowiak,J. Chem. Phys. 103, 4894 (1995).
[12] S. M. King, S. I. Hintschich, D. Dai, C. Rothe, and A. P.Monkman, J. Phys. Chem. C 111, 18759 (2007).
[13] S. I. Hintschich, C. Rothe, S. M. King, S. J. Clark, and A. P.Monkman, J. Phys. Chem. B 112, 16300 (2008).
[14] R. Pudzich and J. Salbeck, Synth. Met. 138, 21 (2003).[15] T. P. I. Saragi, T. Spehr, A. Siebert, T. Fuhrmann-Lieker, and
J. Salbeck, Chem. Rev. 107, 1011 (2007).[16] K.-T. Wong, S.-Y. Ku, Y.-M. Cheng, X.-Y. Lin, Y.-Y. Hung,
S.-C. Pu, P.-T. Chou, G.-H. Lee, and S.-M. Peng, J. Org.Chem. 71, 456 (2006).
[17] R. Pudzich, PhD thesis, University of Kassel (2002).[18] J. N. Demas and G. A. Crosby, J. Phys. Chem. 75, 991
(1971).[19] W. H. Melhuish, J. Phys. Chem. 65, 229 (1961).[20] C. Rothe and A. P. Monkman, Phys. Rev. B 68, 075208
(2003).[21] C. M. Brendel, C. Bruhn, A. P. Monkman, and J. Salbeck (in
preparation).[22] S. Lunak, Jr. and M. Nepas, Chem. Phys. 170, 67 (1993).[23] T. Kolev, B. Stamboliyska, and D. Yancheva, Chem. Phys.
324, 489 (2006).
� 2009 WILEY-VCH Verlag GmbH & Co. KGaA, Weinheim
[24] N. J. Turro, Modern Molecular Photochemistry (UniversityScience Books, Sausalito, 1991), p. 134.
[25] M. Kasha and H. R. Rawls, Photochem. Photobiol. 7, 561(1968).
[26] M. Goes, M. de Grot, M. Koeberg, J. W. Verhoeben, N. R.Lokan, M. J. Shephard, and M. N. Paddon-Row, J. Phys.Chem. A 106, 2129 (2002).
[27] M. Maus and W. Rettig, Phys. Chem. Chem. Phys. 3, 5430(2001).
[28] M. Maus and W. Rettig, J. Phys. Chem. A 106, 2104 (2002).[29] B. Valeur, Molecular Fluorescence (Wiley-VCH, Weinheim,
2002), p. 212.[30] A.Weller and H. Beens, in: Organic Molecular Photophysics,
Vol. 2, edited by J. B. Birks (John Wiley & Sons, London,1975), Chapter 4.
[31] L. Onsager, J. Am. Chem. Soc. 58, 1486 (1936).[32] M. M. Karelson and M. C. Zerner, J. Phys. Chem. 96, 6949
(1992).[33] Z. R. Grabowski, K. Rotkiewicz, and W. Rettig, Chem. Rev.
103, 3899 (2003).[34] S. Lunak, Jr., M. Nepras, A. Kurfurst, and J. Kuthan, Chem.
Phys. 170, 67 (1993).[35] H. J. Haink and J. R. Huber, Chem. Phys. Lett. 44, 117
(1976).[36] P. Borowicz, J. Herbich, A. Kapturkiewicz, R.
Anulewicz-Ostrowska, J. Nowacki, and G. Grampp, Phys.Chem. Chem. Phys. 2, 4275 (2000).
www.pss-a.com


![Comparative photodegradation study between spiro[indoline-oxazine] and spiro[indoline-pyran] derivatives in solution](https://img.pdfslide.us/doc/110x75/577c80301a28abe054a79d42/comparative-photodegradation-study-between-spiroindoline-oxazine-and-spiroindoline-pyran.jpg)