Embed Size (px)
Citation preview
Photonic Validation Methods
Handbook
D-18230
by
George Lutes
with assistance from
Meirong Tu
1999NASA Electronics Packaging Program (NEPP)
September 27, 1999
i
Contents
1. Introduction to Photonic Test and Measurement 1
2. Optical Measurements 2
2.1 Optical Power Measurements 2
2.2 Optical Loss Measurements 2
2.2.1 Optical Fiber Loss (cutback method) 2
2.2.2 General Considerations for Measuring the Loss in Devices 3
2.2.3 Fiber Optic Connector Losses 3
2.2.4 Cladding Modes 3
2.2.5 Cleaning Fiber Optic Connectors 4
2.2.6 Optical Losses in Two Terminal Devices 4
2.2.7 Optical Losses in Multi-port Devices 5
2.2.8 Optical Return Loss Measurements 6
2.3 Optical Time Domain Reflectometry (OTDR) 8
2.3.1 Precision Optical Time Domain Reflectometer 10
2.4 Polarization 12
2.4.1 Polarization Dependent Loss 12
2.4.2 Polarization Mode Dispersion 12
2.4.3 Polarization Test Instruments 12
2.5 Photonic Network Analysis 13
2.6 Optical Spectrum Analysis 14
2.6.1 LED Spectrum Measurements 14
2.6.2 DFB Laser Spectrum Measurements 14
2.6.3 Spectral Response Measurements 14
ii
2.6 Thermal Coefficient of Delay (TCD) of optical fibers and fiber optic cables and how to measure it 16
2.7.1 Introduction 16
2.7.2 Fundamentals 16
2.7.3 Test System Description 17
2.7.4 Analysis 19
2.7.5 System Calibration 20
2.7.6 Preliminary Fiber Delay Measurement 21
2.7.7 Calculating the Nominal Delay of the Fiber Under Test 21
2.7.8 Measuring TCD 21
2.7.9 Test Results 22
2.7.10 Conclusion 24
3. Standards Related to Photonic Measurements 25
4. References 27
1
1. Introduction to Photonic Tests and Measurements
This manual is meant to be a starting place for those who are not well versed in photonics but have a needfor basic knowledge about how to test photonic devices and systems. More detailed information about howto make a particular measurement are available from the manufacturers of the test equipment and varioustesting standards.
Unless otherwise stated the information in this manual is limited to either free space systems using TEM-00 modes or closed systems using single-mode optical fibers. Although much of the information alsorelates to multimode systems there are some special problems that are unique to multimode systems. Thismanual does not discuss these problems. However, the literature published by the manufactures of the testequipment and the various standards cover this subject in depth.
2
2 Optical Measurements
2.1 Optical Power Measurements
Optical power is the most fundamental parameter to be measured in a photonic system. It is usuallymeasured with an optical power meter or an optical multi-meter. The measurement accuracy for thesemeters is typically ±2.0 % to ±2.5% (0.09dB to 0.11dB).
Most optical power meters use a semiconductor photodetector as the sensing element. The sensitivity ofthese devices varies with wavelength. Therefore, they must be calibrated for the wavelength to be used.Fortunately, there are only three wavelengths in common use in photonic system. They are 850 nm, 1310nm, and 1550 nm. Most optical power meters are calibrated at all three wavelengths. Many of them comewith tables of correction factors for other wavelengths between 850 nm and 1550 nm.
The wavelength of the test source must match the wavelength that the device under test is designed tooperate at. For instance, if the device under test is designed to operate at 1550 nm wavelength and the testequipment is designed or calibrated for 850 nm wavelength a large measurement error is likely to result.
When making optical power measurements care must be taken that all of the optical power to be measuredis incident on the photodetector. This is achieved by using either a photodetector which is large enough tointercept all of the optical power or by precisely controlling the shape and size of the optical source so allof the optical power is incident on the photodetector.
The photodetector must be shielded from all external light sources which are not to be included in theoptical power measurement. Some materials appear to the eye to be effective optical shields when inreality some wavelengths of light will penetrate them to some degree. This will result in erroneousmeasurements.
Many photodetectors are polarization sensitive so the power reading is slightly higher for onepolarization than for others. For precise measurements the polarization should be scrambled or thepolarization should be rotated and the average reading measured. Error due to polarization sensitivity ofthe detector is small and is most often neglected.
2.2 Optical Loss Measurements
Optical loss measurements consist of multiple optical power measurements to determine the optical loss ina device. In this section we will talk about special considerations and techniques for measuring the loss ina number of devices including optical fiber.
2.2.1 Optical Fiber Loss (cutback method)
Optical loss in optical fiber is usually measured using a unique method called the cutback method. In thismethod light of the desired wavelength is launched into a long piece of optical fiber and the optical outputpower at the far end of the fiber is measured with an optical power meter. Then a precisely known lengthof optical fiber is cut off the far end of the fiber and the optical power is measured at the end of theremaining length. The difference between the two measurements is the loss in the fiber for the length thatwas cut off. This loss is nearly always normalized to a 1 km length of fiber and is stated in dB/km.
The equation for determining the average attenuation per km of an optical fiber using the cutback methodis,
3
⋅=
2
1log410
P
P
cA
ll , (1)
where,
=cl the length of fiber cutback,
P1 = the power measured at the output of the long fiber, and
P2 = the power measured at the output of the remaining fiber after it is cut back.
The cutback method for measuring optical fiber loss eliminates the errors associated with connector losses(see below) and losses due coupling mismatches between the optical fiber and the test source. However,this method requires that sufficient fiber be cut off to obtain an accurate measurement. When the fiber iscutback the change in optical power must be much larger than the useable resolution of the power meter toget an accurate measurement.
2.2.2 General Considerations for Measuring the Loss in Devices
You measure the optical loss through a device by measuring the optical power launched into it and thenmeasuring the optical power emitted from the output of the device. This sounds simple but there are anumber of pitfalls that can result in inaccurate measurements.
These pitfalls have to do with mode mismatches at the interfaces, cladding modes, reflections,misalignment of interfaces, obstructed optical paths, optical wavelength, and stray light. It will be pointedout in the text where these pitfalls are likely to occur and what can be done about them.
Before making any measurement you must make sure that the wavelength being used is correct for thedevice being measured, that there is no significant stray light incident on the photodetector, and thatpolarization errors are considered.
2.2.3 Fiber Optic Connector Losses
In systems that use fiber optic interfaces the most likely source of error is the fiber optic connector thatinterfaces with the optical power source. There is no reasonable way to precisely determine the loss in thisconnector. All you can do is to make sure the connector is installed correctly, is clean, and is properlymated. You can gain some confidence in the integrity of the connector if you connect about 30 meters offiber optic cable from the source connector to the input to the optical power meter. The loss should be nomore than the maximum specified loss for a mated pair of the type of connector being used. The opticalfiber loss should be negligible for this length of cable.
The 30 meters of fiber optic cable should be left on the optical source. It will assure a good launchcondition and it will save the connector on the optical source since it will only be de-mated when theconnector on the far end of the cable is worn out.
2.2.4 Cladding Modes
When two fiber optic connectors are mated some of the light will leak into the cladding of the fiber and ifit is sufficiently large could result in measurement error. The light in the cladding is referred to ascladding modes. This light will leak out of the cladding in a few tens of meters. This is the reason in theprevious paragraph I suggest using a thirty meter length of fiber optic cable. Nearly all of the optical
4
power that leaked into the cladding at the connector will be lost before it gets to the end of the 30 metercable. If the cable is too short the power meter will measure the light in the cladding as well as the desiredlight in the core of the fiber. This will result in an error when a device is measured.The 30 meter length of optical cable should always be left on the optical source to save the connector andto reduce cladding modes at the input to the device being measured. A 30 meter length of fiber optic cableshould also be connected to the optical power meter. This cable will assure that cladding modes generatedin the device being measured will be lost before they reach the power meter.
The specified mean loss of the best fiber optic connectors is about 0.2 dB for a clean connector which hasbeen properly installed. A nine micron spec of dust on the end of the fiber can completely block the opticalsignal. It is essential to keep the connector clean.
Fiber optic connectors should always be protected with a cover when not connected. Virtually every fiberoptic connector comes with a cover designed to keep it clean. A cover should be attached to the cable ateach connector and it should be used if the connector is de-mated.
2.2.5 Cleaning Fiber Optic Connectors
Installation personnel should clean every connector every time prior to mating. The following cleaningprocedure should be used. If the connector adapter is not fresh out of the package, it should be cleanedalso.
1. Soak a clean cotton swab or special cleaning pad designed for this purpose in pure isopropyl alcohol.
2. Gently wipe the end of the connector to rinse away any grit which could scratch the connector end.
3. Soak a fresh cotton swab or pad and rub the end of the connector firmly. Use a fresh dry cotton swabto dry the connector end. Do not let it air dry as it may leave a film.
4. Examine the end of the connector with a microscope designed for this purpose to assure that it isclean.
5. If it is not clean, go back to step 3.
6. When the connector is clean insert it into the connector adapter carefully without touching the end ofthe connector on anything particularly the adapter. If the end of the connector comes in contact withthe adapter it may be damaged and become unusable. Insert the connector as straight into the adapteras possible so as not to scrape any material from the adapter which could contaminate the connectorend.
2.2.6 Optical Losses in Two Terminal Devices
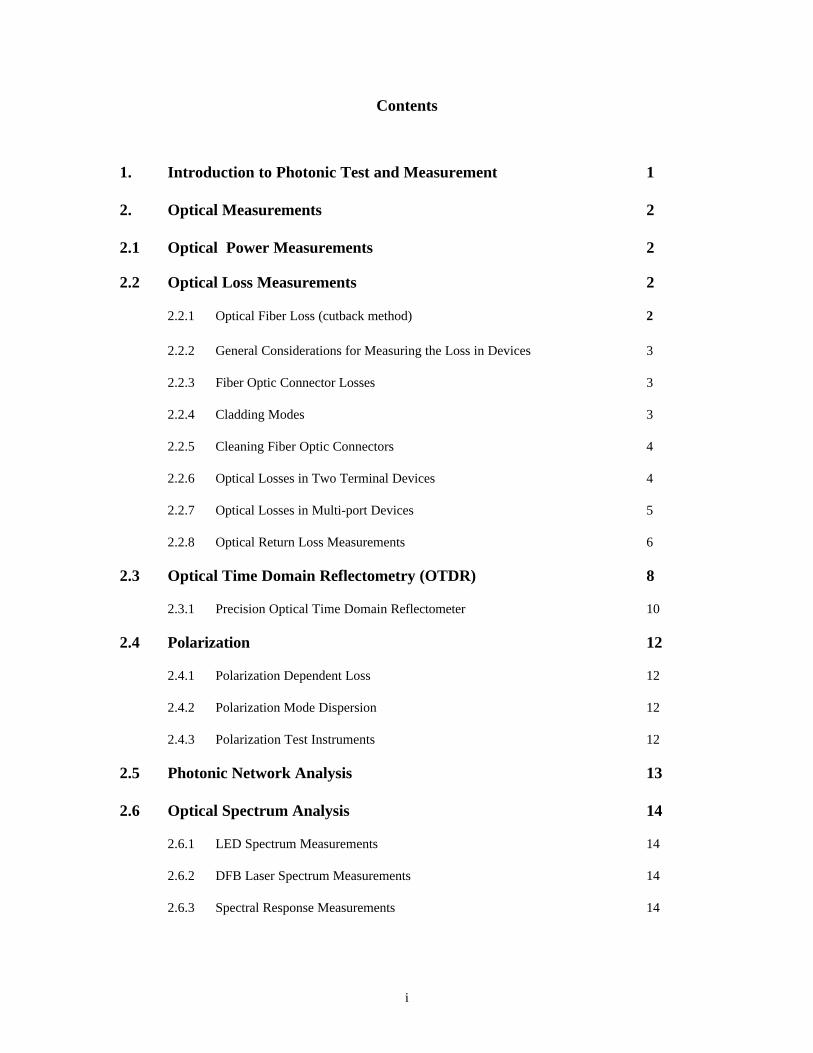
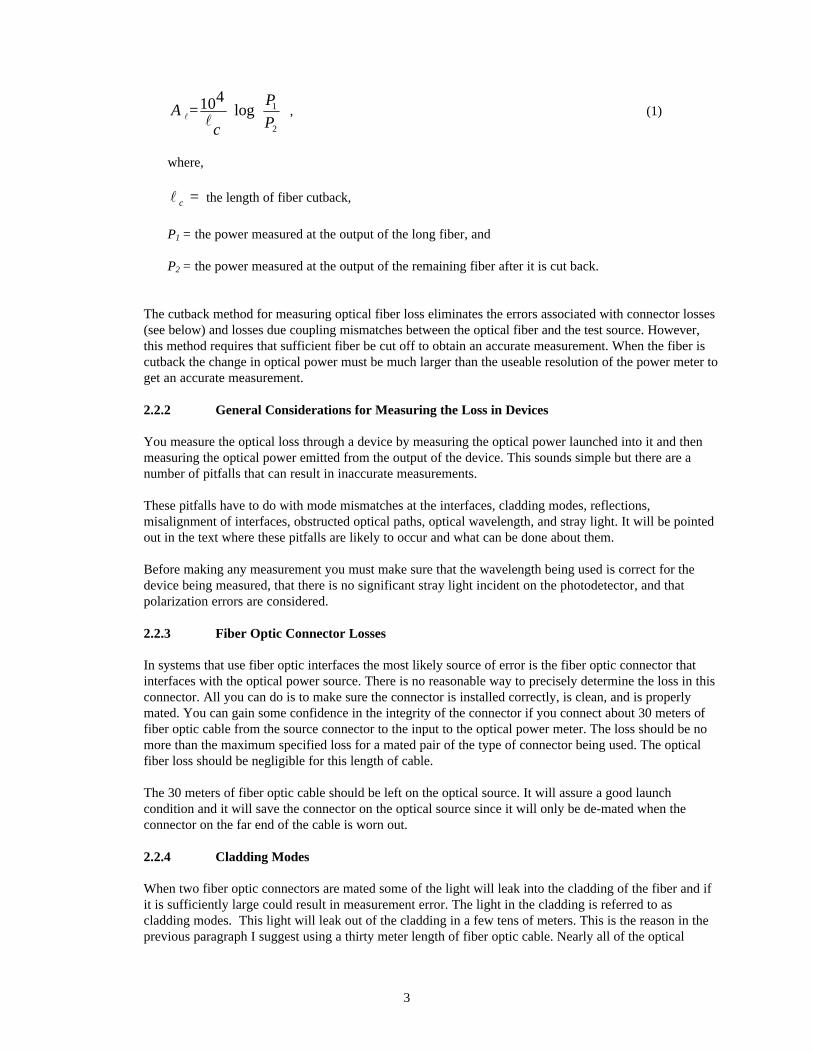
To measure the optical attenuation of a two terminal device first connect the two 30 meter test cablestogether and measure the power with the optical power meter. This reading serves as a reference. Nextconnect the device under test as shown in Fig. 1 and measure the optical power. These measurementsshould be made as close together in time as possible so any drifts will be minimized. The attenuation ofthe device under test is the power difference in dB between these two measurements. The equation is,
12 AAAs −= (2)
where,
A1 = the power in dB measured with the two 30 meter lengths of cable connected, and
5
A2 = the power in dB measured with the device under test inserted.
Fig. 1 - Setup for two port device loss measurement.
2.2.7 Optical Losses in Multi-port Devices
In many multi-terminal devices such as optical couplers there is an additional loss term called excess loss.It is the loss over and above the loss in an ideal device. For instance if the device is a 4 port coupler (4way power splitter) the power at each output port should be one-fourth (-6 dB) of the input power. Theequation for ideal loss to each port in such a device is,
⋅=
nAi
1log10 , (3)
where,
n = the number of equal outputs.
Any loss greater than this is called excess loss.
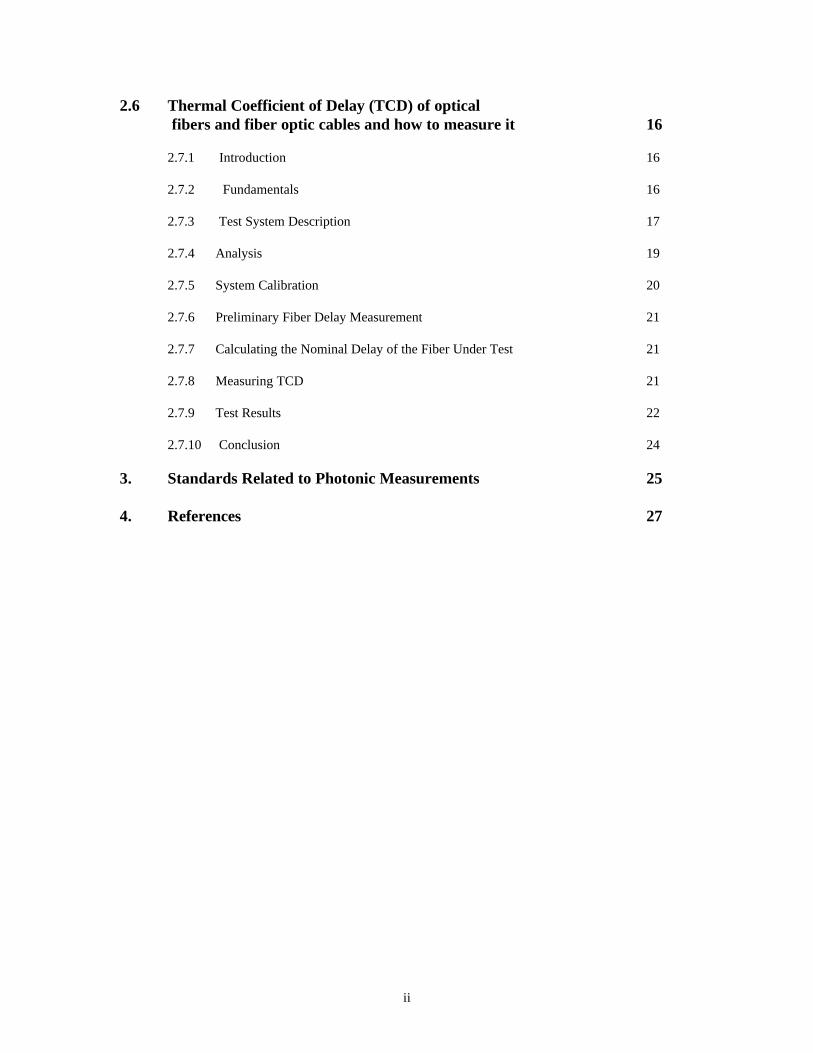
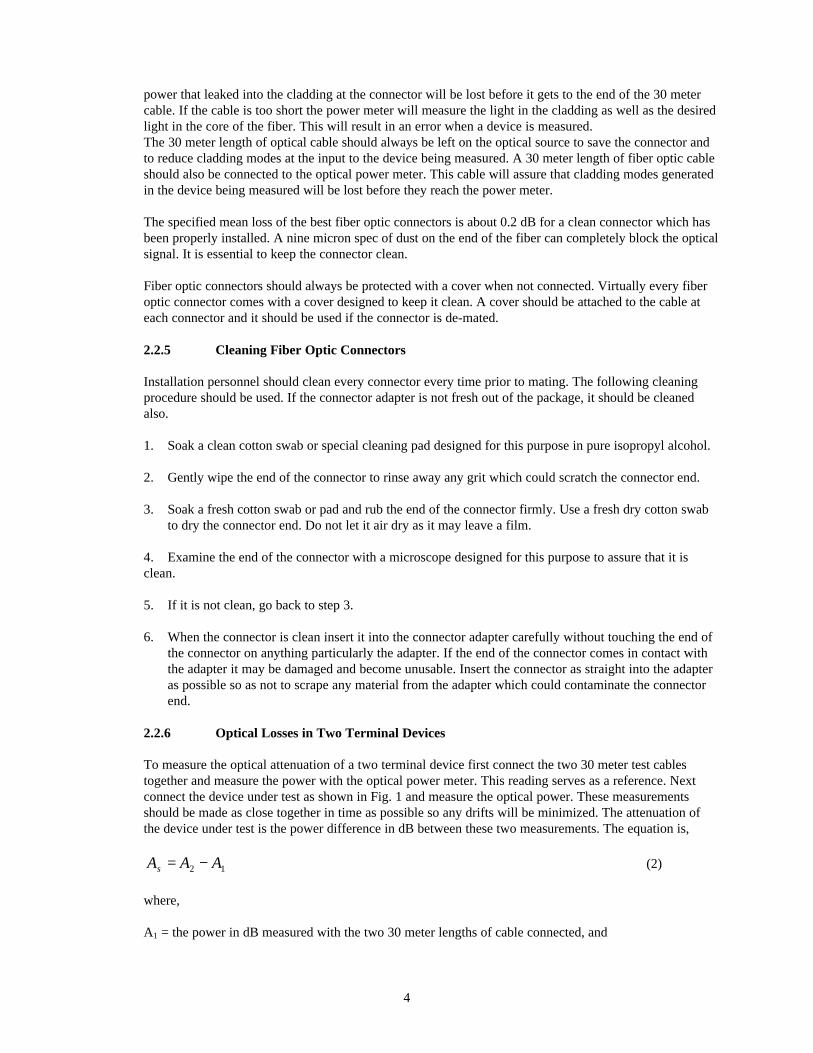
A block diagram of the measurement setup for multi-port devices is shown in Fig. 2.
Fig. 2- Setup for multi-terminal device loss measurement.
OPTICALSOURCE
OPTICALPOWERMETER
30 METERS
30 METERS
FIBER OPTIC CONNECTORS
DEVICEUNDERTEST
OPTICALSOURCE
OPTICALPOWERMETER
30 METERS
30 METERS
FIBER OPTIC CONNECTORS DEVICE
UNDERTEST
input
output 1
output 2
output 3
output 4
6
The loss to each port is measured separately as follows. First measure the optical power with the two30 meter long test cables connected together. This is the reference. Then with the 30 meter cable fromthe source connected to the input of the device under test measure the optical power at each outputport. Use equation 2 to calculate the loss in dB for each output port. The equation for excess loss from(2) and (3) is,
⋅−−=
nAAAe
1log10)( 12 (4)
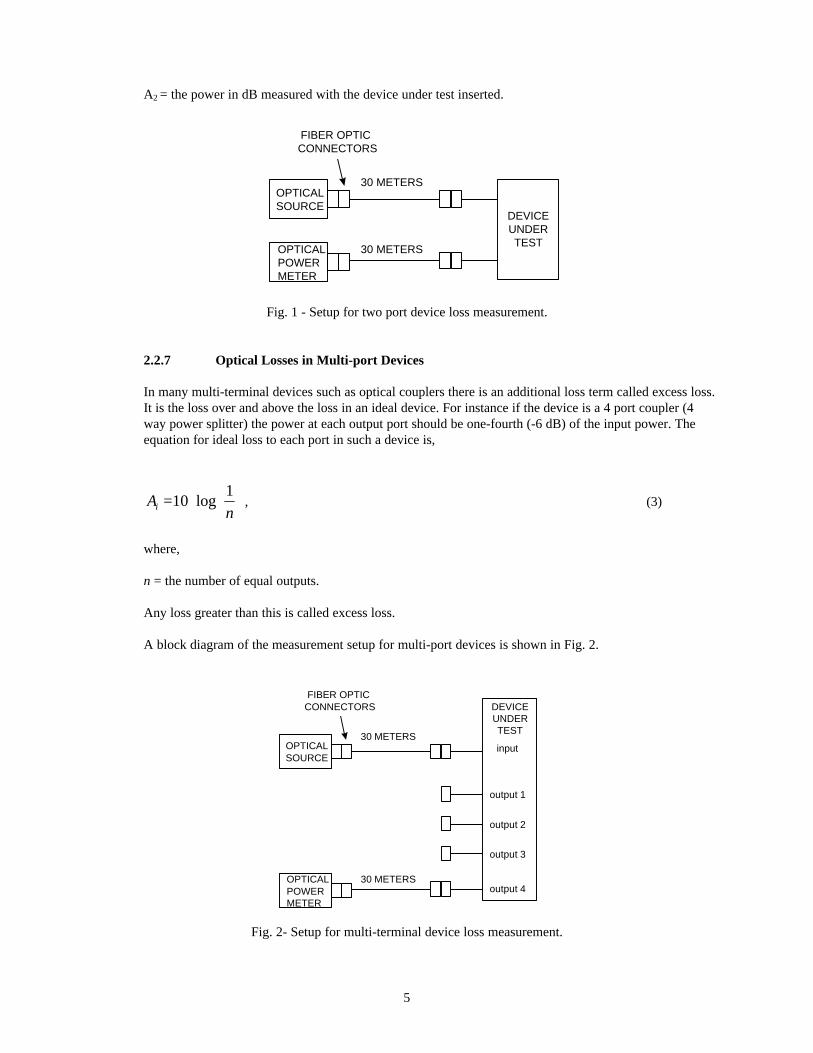
Another measurement of multi-terminal devices is port-to-port isolation. This is a loss measurementbetween output ports. The port-to-port loss of an optical coupler should be very high, on the order of 50 to60 dB. Port-to-port isolation will degraded if there is a reflection at the input port of the coupler. Areflection can be the result of a scratched or dirty input connector.
A block diagram of the setup for measuring port-to-port isolation is shown in Fig. 3.
Fig. 3 - Setup for multi-terminal device port-to-port isolation.
In this test first measure the optical power with the two 30 meter long test cables connected together. Thisis the reference. Then with the 30 meter cable from the source connected to one of the output portsmeasure the optical power at the other output ports. Every combination of output ports should bemeasured. Use equation (2) to determine the isolation between each port.
2.2.8 Optical Return Loss Measurements
Reflections cause interferometric noise and laser instability in photonic systems. The performance ofanalog fiber optic systems, such as CATV transmission links, can be seriously degraded by the noiseresulting from reflections. In order to control reflections it is necessary to measure them. This is done withan optical reflection meter or optical multi-meter with a return loss function.
A block diagram of a reflection meter is shown in Fig. 4. It consists of an optical source, a two way fifty-fifty coupler (an optical coupler that splits the input signal into two equal output signals), and an opticalpower meter.
OPTICALSOURCE
OPTICALPOWERMETER
30 METERS
30 METERS
FIBER OPTIC CONNECTORS
DEVICEUNDERTEST
input
output 1
output 2
output 3
output 4
7
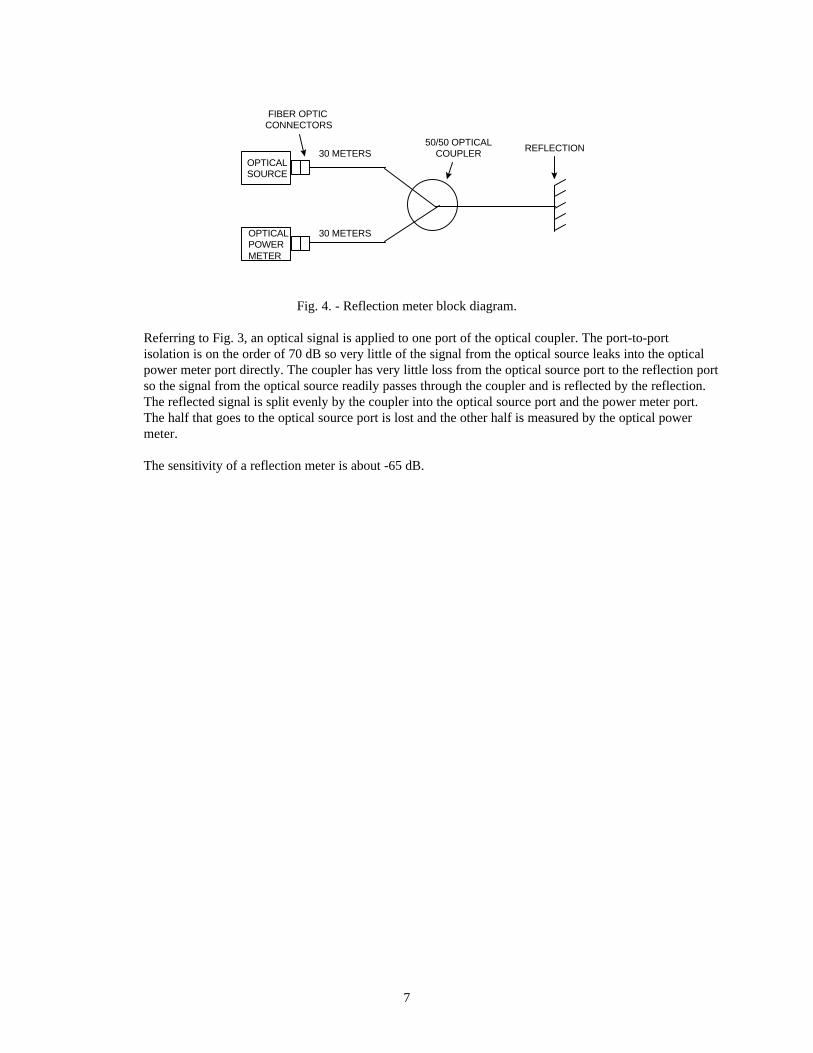
Fig. 4. - Reflection meter block diagram.
Referring to Fig. 3, an optical signal is applied to one port of the optical coupler. The port-to-portisolation is on the order of 70 dB so very little of the signal from the optical source leaks into the opticalpower meter port directly. The coupler has very little loss from the optical source port to the reflection portso the signal from the optical source readily passes through the coupler and is reflected by the reflection.The reflected signal is split evenly by the coupler into the optical source port and the power meter port.The half that goes to the optical source port is lost and the other half is measured by the optical powermeter.
The sensitivity of a reflection meter is about -65 dB.
OPTICALSOURCE
OPTICALPOWERMETER
30 METERS
30 METERS
FIBER OPTIC CONNECTORS
50/50 OPTICALCOUPLER REFLECTION
8
2.3 Optical Time Domain Reflectometry (OTDR)
When light from an optical source is launched into an optical fiber some of it is reflected back toward thesource. This reflected light is due to imperfections in the optical fiber such as variations in the index ofrefraction. This reflection is called Raleigh-scattering.
The optical time domain reflectometer (OTDR) uses this effect to measure losses and reflections in a longoptical fiber. Fiber optic cable installers used OTDRs extensively because they measure the fiber loss,connector losses, microbend losses, splice losses, reflections, and the distance to each imperfection thatcreates a loss or reflection.
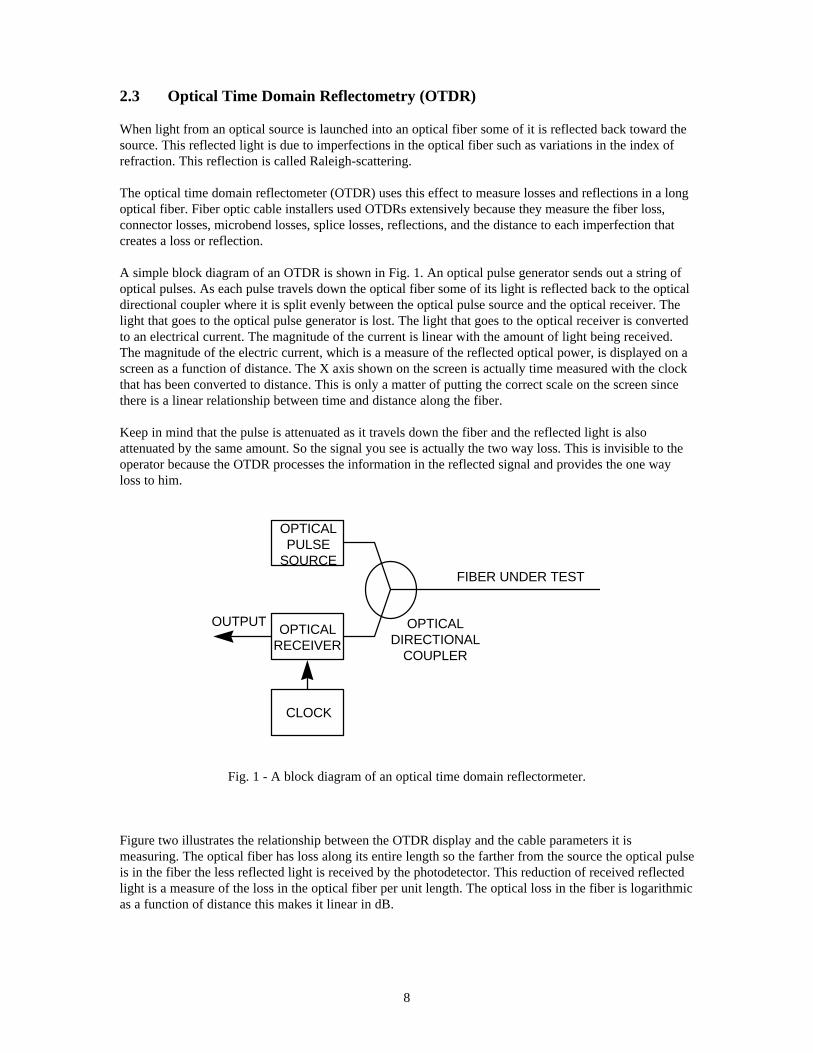
A simple block diagram of an OTDR is shown in Fig. 1. An optical pulse generator sends out a string ofoptical pulses. As each pulse travels down the optical fiber some of its light is reflected back to the opticaldirectional coupler where it is split evenly between the optical pulse source and the optical receiver. Thelight that goes to the optical pulse generator is lost. The light that goes to the optical receiver is convertedto an electrical current. The magnitude of the current is linear with the amount of light being received.The magnitude of the electric current, which is a measure of the reflected optical power, is displayed on ascreen as a function of distance. The X axis shown on the screen is actually time measured with the clockthat has been converted to distance. This is only a matter of putting the correct scale on the screen sincethere is a linear relationship between time and distance along the fiber.
Keep in mind that the pulse is attenuated as it travels down the fiber and the reflected light is alsoattenuated by the same amount. So the signal you see is actually the two way loss. This is invisible to theoperator because the OTDR processes the information in the reflected signal and provides the one wayloss to him.
Fig. 1 - A block diagram of an optical time domain reflectormeter.
Figure two illustrates the relationship between the OTDR display and the cable parameters it ismeasuring. The optical fiber has loss along its entire length so the farther from the source the optical pulseis in the fiber the less reflected light is received by the photodetector. This reduction of received reflectedlight is a measure of the loss in the optical fiber per unit length. The optical loss in the fiber is logarithmicas a function of distance this makes it linear in dB.
OPTICALPULSE
SOURCE
OPTICALRECEIVER
CLOCK
OUTPUT
FIBER UNDER TEST
OPTICALDIRECTIONAL
COUPLER
9
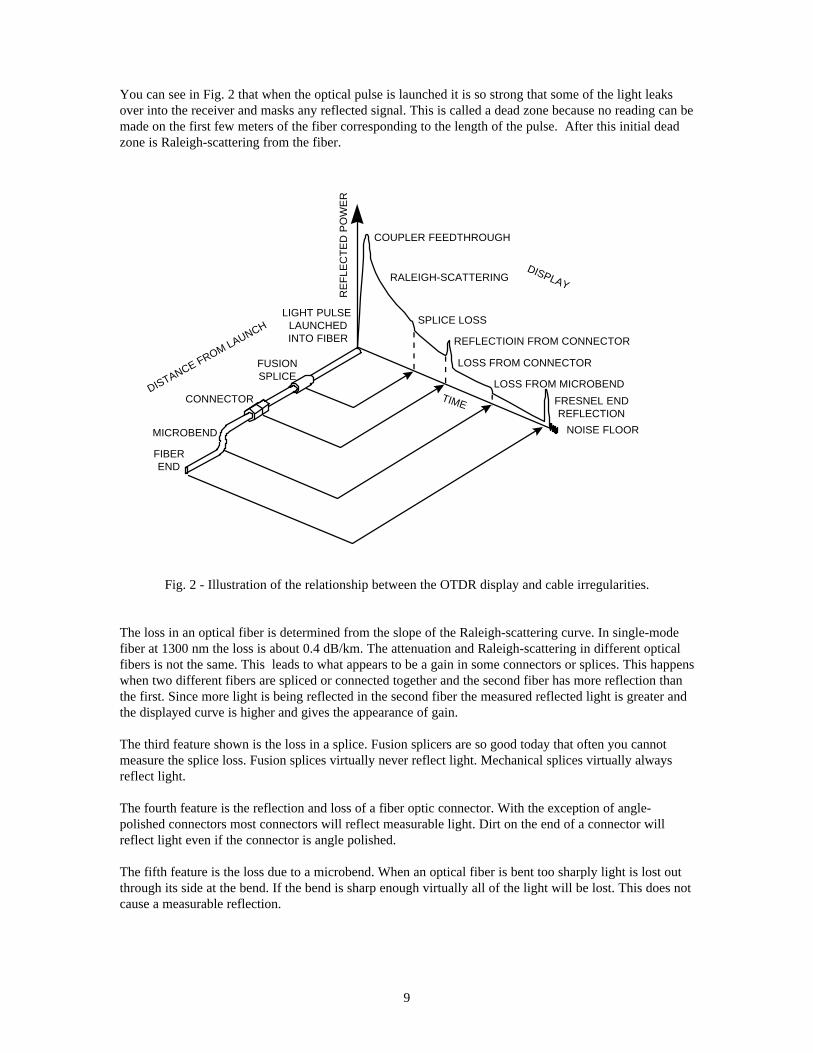
You can see in Fig. 2 that when the optical pulse is launched it is so strong that some of the light leaksover into the receiver and masks any reflected signal. This is called a dead zone because no reading can bemade on the first few meters of the fiber corresponding to the length of the pulse. After this initial deadzone is Raleigh-scattering from the fiber.
Fig. 2 - Illustration of the relationship between the OTDR display and cable irregularities.
The loss in an optical fiber is determined from the slope of the Raleigh-scattering curve. In single-modefiber at 1300 nm the loss is about 0.4 dB/km. The attenuation and Raleigh-scattering in different opticalfibers is not the same. This leads to what appears to be a gain in some connectors or splices. This happenswhen two different fibers are spliced or connected together and the second fiber has more reflection thanthe first. Since more light is being reflected in the second fiber the measured reflected light is greater andthe displayed curve is higher and gives the appearance of gain.
The third feature shown is the loss in a splice. Fusion splicers are so good today that often you cannotmeasure the splice loss. Fusion splices virtually never reflect light. Mechanical splices virtually alwaysreflect light.
The fourth feature is the reflection and loss of a fiber optic connector. With the exception of angle-polished connectors most connectors will reflect measurable light. Dirt on the end of a connector willreflect light even if the connector is angle polished.
The fifth feature is the loss due to a microbend. When an optical fiber is bent too sharply light is lost outthrough its side at the bend. If the bend is sharp enough virtually all of the light will be lost. This does notcause a measurable reflection.
DISTANCE FROM LAUNCH
DISPLAY
FUSIONSPLICE
CONNECTOR
MICROBEND
FIBEREND
LIGHT PULSE LAUNCHEDINTO FIBER
RE
FLE
CT
ED
PO
WE
R
COUPLER FEEDTHROUGH
RALEIGH-SCATTERING
SPLICE LOSS
REFLECTIOIN FROM CONNECTOR
LOSS FROM CONNECTOR
LOSS FROM MICROBEND
FRESNEL ENDREFLECTION
NOISE FLOOR
TIME
10
Finally if the fiber end is flat and at right angles to the fiber there will be a large (14%) reflection. This iscalled a Fresnel reflection and is caused by the abrupt change in index of refraction at the glass to airinterface. If the fiber end is not perpendicular to the fiber there may not be a reflection and the signal willjust fall off into the noise.
There is no more reflection after the end of the fiber so the system noise is displayed.
However, if there are multiple reflections in the fiber under test the light from a pulse will be reflectedback and forth in the fiber and displayed more than once. The OTDR will display these multiplereflections after the end of the fiber and give the appearance that there is a reflection after the end of thefiber.
2.3.1 Precision Optical Time Domain Reflectometer
Hewlett-Packard manufactures a precision OTDR that has high precision and gets rid of the dead zone. Itis designed to be used over short spans from 1 mm to 270 mm. The span can be offset in distance as longas the attenuation in the offset fibers does not exceed the dynamic range of the instrument. Its purpose isto measure reflections internal to optical devices.
This device uses a different technique from the normal OTDR. A block diagram of it is shown in Fig. 3.
Fig. 3 - Block diagram of the precision OTDR.
This OTDR uses a Michelson interferometer. Light from the wideband light source goes to the opticalcoupler where it is split evenly between two outputs. One output goes to the device under test and theother output goes to a reference mirror. Light from both the device under test and the reference mirror arereflected back toward the wideband light source and the detector. The reflected light is evenly split by thecoupler and half of it goes to the wideband light source where it is lost. The other half of the reflectedlight goes to the detector where it generates a current that is proportional to the amount of reflected light.
The reflected light from the device under test and the reference mirror are combined at the output of thecoupler and interfere if they are coherent. When the interference is constructive the reflected light fromthe two paths adds and when it is destructive they subtract. When they add the photodetector output islarge and when they subtract the photodetector output is small.
However, since the light from the wideband light source has a very short coherence length the light fromthe two reflections is only coherent over a very short difference in distance, less than 25 microns. In other
WIDEBANDLIGHT
SOURCE
DETECTOR
DISPLAY
REFERENCEEXTENSION
REFERENCEMIRROR
DEVICEUNDERTEST
OPTICALCOUPLER
11
words, the distance from the output of the coupler to each of the reflections must be exactly the samewithin a few microns to get coherent interference and a response from the detector.
In operation the reference mirror is slowly moved. When the distance from the coupler to a reflection inthe device under test is exactly the same as the distance from the coupler to the reference mirror the tworeflections will constructively interfere and a response will show up on the display.
This instrument will distinguish between two reflections as close as 25 microns apart and display them. Itwill only display discrete reflections so it will not see the Raleigh-scattering in a fiber because it is adistributed reflection.
12
2.4 Polarization
Polarization is explained in the Photonics Handbook which is a part of this series so this discussion will belimited to some thoughts about the effects of polarization and how it is measured.
Most light signals are only partially polarized. The part of the light that is not polarized is referred to asrandomly polarized or unpolarized. The degree of polarization (DOP) is,
100⋅=powertotal
powerpolarizedDOP (1)
2.4.1 Polarization Dependent Loss
Some optical components have polarization dependent loss (PDL). The loss in these components dependson the polarization state to some degree. The range of PDL is from 0.5 dB for connectors and standardoptical fibers to greater than 30 dB for optical polarizers.
Optical power meters, lightwave polarization analyzers, and optical spectrum analyzers can all be used tomeasure PDL. All that is required is a means to rotate the polarization of the light signal over the entirerange of possible polarization states, a polarization analyzer, and a piece of test equipment that canmeasure optical power.
One way to alleviate problems with PDL is to scramble the polarization of the optical signal. Another wayis to transmit the signal using polarization preserving optical fiber or polarizing optical fiber which keepthe polarization state from changing.
2.4.2 Polarization Mode Dispersion
As stated before, all light signals consist of two orthogonally polarized modes. Each of these modes travelat a different speed through an optical fiber. When the information in one of them gets out of phase withthe information in the other one the information being transmitted gets distorted. This is calledpolarization mode dispersion (PMD). If the information gets near or at 180 degrees the signal fades. Thiscan be a problem with high speed fiber optic communications systems.
PMD is specified at one wavelength in picoseconds or as the average PMD over a range of wavelengths.
2.4.3 Polarization Test Instruments
Test instruments are available that fully characterize the polarization state of an optical signal. Theseinstruments will measure the state of polarization, PMD, PDL, and polarization maintaining fiber launchconditions. Most of them operate over a wavelength range of 1200 to 1600 nm. The accuracy rangesaround 2% to 5%.
13
2.5 Photonic Network Analysis
Photonic network analyzers measure the “S” parameters of photonic systems that utilize photoniccomponents such as fiber optic transmitters and receivers, fiber optic amplifiers, fiber optic modulators,fiber optic attenuators, and fiber switches. Another name for this instrument is “lightwave componentanalyzer”.
Much like the electrical equivalent, photonic network analyzers measure the forward gain, reverseisolation, and input and output reflections. These instruments are standard radio frequency (RF) networkanalyzers with optical to electrical and electrical to optical converters so any combination of electrical andoptical inputs and outputs can be measured..
Photonic network analyzers are very handy for measuring the gain and phase characteristics of analog RFfiber optic links.
14
2.6 Optical Spectrum Analysis
Optical spectrum analyzers are used to measure the spectrum of optical signals. They can be used tomeasure the spectrums of LEDs, lasers and other light sources and the response of couplers, fibers, filters,isolators, and wavelength division multiplexing components.
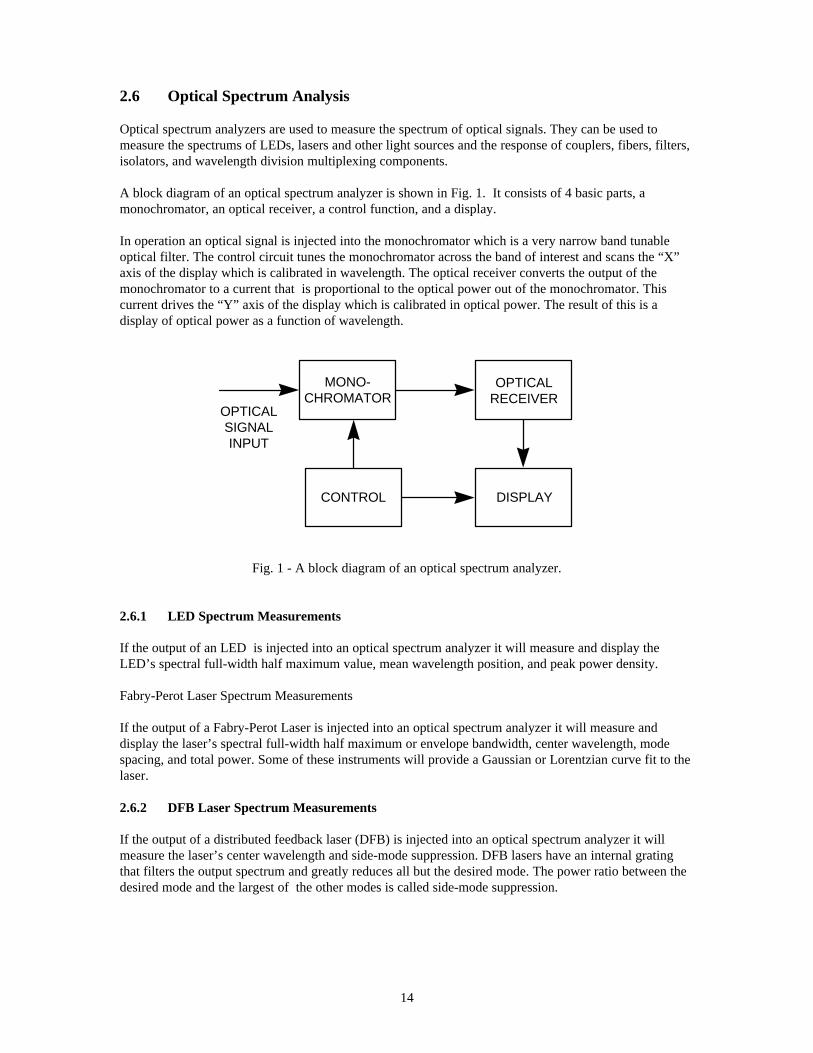
A block diagram of an optical spectrum analyzer is shown in Fig. 1. It consists of 4 basic parts, amonochromator, an optical receiver, a control function, and a display.
In operation an optical signal is injected into the monochromator which is a very narrow band tunableoptical filter. The control circuit tunes the monochromator across the band of interest and scans the “X”axis of the display which is calibrated in wavelength. The optical receiver converts the output of themonochromator to a current that is proportional to the optical power out of the monochromator. Thiscurrent drives the “Y” axis of the display which is calibrated in optical power. The result of this is adisplay of optical power as a function of wavelength.
Fig. 1 - A block diagram of an optical spectrum analyzer.
2.6.1 LED Spectrum Measurements
If the output of an LED is injected into an optical spectrum analyzer it will measure and display theLED’s spectral full-width half maximum value, mean wavelength position, and peak power density.
Fabry-Perot Laser Spectrum Measurements
If the output of a Fabry-Perot Laser is injected into an optical spectrum analyzer it will measure anddisplay the laser’s spectral full-width half maximum or envelope bandwidth, center wavelength, modespacing, and total power. Some of these instruments will provide a Gaussian or Lorentzian curve fit to thelaser.
2.6.2 DFB Laser Spectrum Measurements
If the output of a distributed feedback laser (DFB) is injected into an optical spectrum analyzer it willmeasure the laser’s center wavelength and side-mode suppression. DFB lasers have an internal gratingthat filters the output spectrum and greatly reduces all but the desired mode. The power ratio between thedesired mode and the largest of the other modes is called side-mode suppression.
MONO-CHROMATOR
OPTICALRECEIVER
DISPLAYCONTROL
OPTICALSIGNALINPUT
15
2.6.3 Spectral Response Measurements
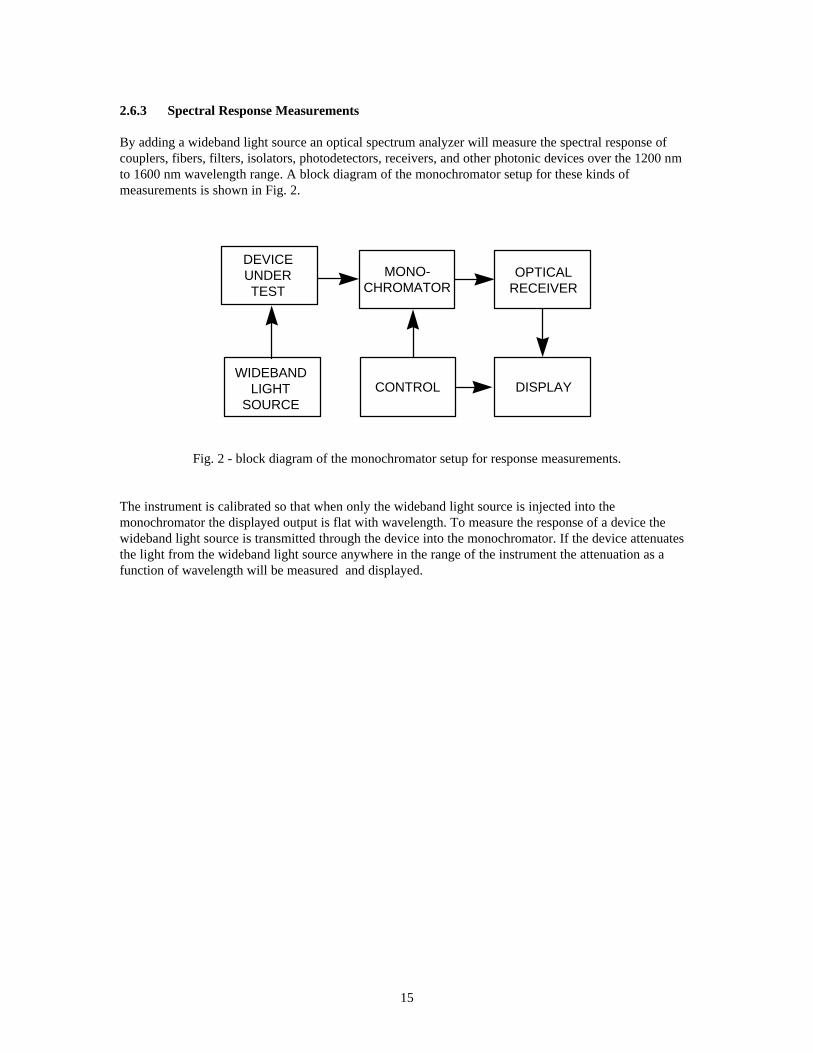
By adding a wideband light source an optical spectrum analyzer will measure the spectral response ofcouplers, fibers, filters, isolators, photodetectors, receivers, and other photonic devices over the 1200 nmto 1600 nm wavelength range. A block diagram of the monochromator setup for these kinds ofmeasurements is shown in Fig. 2.
Fig. 2 - block diagram of the monochromator setup for response measurements.
The instrument is calibrated so that when only the wideband light source is injected into themonochromator the displayed output is flat with wavelength. To measure the response of a device thewideband light source is transmitted through the device into the monochromator. If the device attenuatesthe light from the wideband light source anywhere in the range of the instrument the attenuation as afunction of wavelength will be measured and displayed.
MONO-CHROMATOR
OPTICALRECEIVER
DISPLAYCONTROLWIDEBAND
LIGHTSOURCE
DEVICEUNDERTEST
16
2.7 Thermal Coefficient of Delay (TCD) of optical fibers and fiber optic cablesand how to measure it
In this section we discuss thermal coefficient of delay (TCD) of cables, why it is important in someapplications, and how to measure it. The discussion is focused on the TCD of single-mode optical fiberand fiber optic cable.
2.7.1 Introduction
Fiber optic cables with high delay stability are used for a growing number of applications,such as optical and radio wave interferometers, synthetic aperture radar, radio science, andprecision navigation of spacecraft. In general the delay in fiber optic cables is much morestable with changing temperature than coaxial cables are. Fiber optic cables can also carryhigh frequency signals over much greater distances than coaxial cables.
The NASA/JPL Deep Space Network uses stable fiber optic cables to connect widelyseparated antennas for long baseline interferometery measurements. This technique wasused to measure the bending of a radio wave by the gravitational field of Jupiter. Theresults agreed with the predictions of Einstein’s theory of general relativity.
The Shuttle Radar Topography Mission (SRTM), a spaceborne imaging radar system,which will map the entire earth’s surface in 10 days uses a stable fiber optic cable. It ispart of a fiber optic system that provides an extremely stable reference signal to a receiverat the end of a 60 meter mast.
The Keck Observatory on Mauna Kea volcano in Hawaii uses stable fiber optic cables toconnect multiple antennas together to form an interferometer which is used to detectplanets around other stars.
It is important for system designers of these highly stable electronic/photonic systems toknow the stability of various cables they can select from. However, this information isusually not provided by the manufacturer and must be measured by the user. This sectionexplains how to make these measurements.
2.7.2 Fundamentals
A cable’s thermal coefficient of delay (TCD) is the slope of its change of group delayversus temperature. The TCDs of cables vary depending on their construction and thematerials used. The TCD is also a good indication of the stresses on an optical fiberenclosed in a cable when the cable is stressed by a large change in temperature.Differences in thermal coefficients of expansion of the various materials in a cable causethese stresses.
17
Although this discussion is limited to measuring the TCD of an optical fiber or fiber opticcable the general procedure can be used to measure the TCD of any type of transmissionline.
In optical fiber or fiber optic cable the change of group delay resulting from a temperaturechange is generally a smooth function. Abrupt changes in group delay sometimes occur incoaxial cables. It is caused by sudden slippage between the center conductor and thesurrounding dielectric material brought on by differences in thermal coefficient ofexpansion of the materials.
For the rest of this discussion the cable under test will be referred to as optical fiber ormerely as fiber. In this section group delay will be denoted by τ, and refers to the end toend delay in an optical fiber.
Thermal coefficient of delay (TCD) is the normalized derivative of the delay with respectto temperature. For convenience a symbol β has been introduced to denote TCD, whichcan be expressed as,
(1)
where, τ is the delay through the signal path. The factor of 106 is introduced for theconventional expression of β in units of parts-per-million per degree Celsius (ppm/oC).Since the change of delay is small compared to the total delay in the optical fiber path, andfor testing purposes the temperature is changed in steps, β can also be written as,
(2)
where, το is the nominal group delay through the optical fiber, commonly measured atroom temperature, 25 oC.
The TCD of a cable is determined in a three step process.
1. The system is calibrated.2. The nominal delay is measured.3. The TCD is measured.
In an ideal measurement system the phase measurement device (vector voltmeter orphase detector) would be connected directly to each end of the cable to be measured withno additional delays. However, in practice there are always extraneous delays such as,
dT
dττ
β)10( 6
=
To ∆∆
=τ
τβ
)10( 6
18
test cables and fiber optic receivers, in both signal paths. Calibrating the measurementsystem minimizes the affect of these delays.
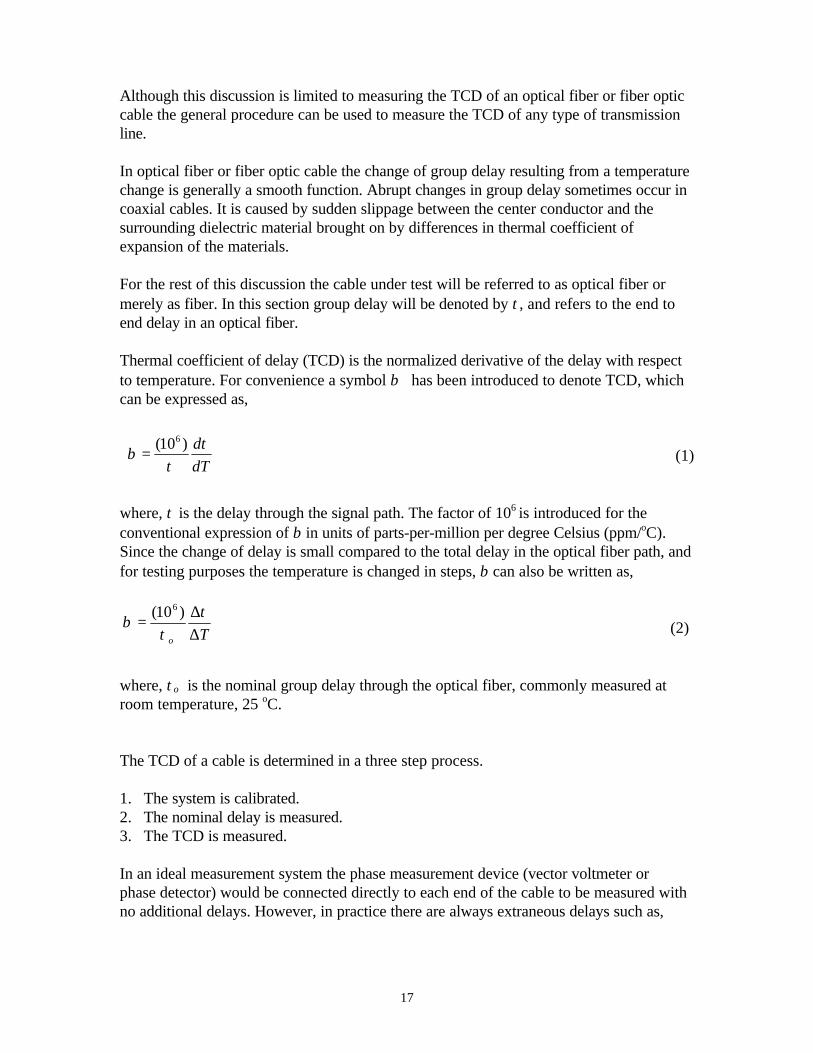
Figure 1 – Block diagram of the measurement system.
2.7.3 Test System Description
Referring to Fig. 1, a synthesizer generates an RF signal which is used to modulate anoptical carrier emitted by the fiber optic transmitter. This optical signal passes through afiber optic attenuator that limits the optical power to a level that is safe for the fiber opticreceivers.
A fiber optic coupler splits the signal from the fiber optic attenuator into two equalsignals. One signal follows Path 1 and the other signal follows Path 2 as shown in Fig. 1.Path 1 consists of a test system cable, the optical fiber under test, and another test systemcable that goes to a fiber optic receiver. Path 2 is a test system cable connected directly toa fiber optic receiver. During system calibration the two test system cables in Path 1 areconnected together bypassing the optical fiber under test as shown with a dotted line inFig. 1. Path 1 and Path 2 should have equal lengths when the cable under test is notconnected.
The fiber optic receivers convert the modulated optical signals back into electrical signalsthat are applied to the two probes of a vector voltmeter. In Fig. 1, “R” designates thevector voltmeter’s reference probe. It is important that the reference probe is alwaysconnected as shown. The vector voltmeter measures the phase difference between the twosignal paths at the output of the receivers. This phase difference information is used to,calibrate the measurement system, and determine the nominal delay and TCD of the fiberunder test.
SYNTHESIZER
FIBER OPTICXMTR
FIBER OPTICATTENUATOR
50/50 FIBER OPTICCOUPLER
OPTICALFIBER
UNDER TEST
VECTORVOLTMETER
R
τ1
τ2
FORCVR
FORCVR
Path 1
Path 2
19
This test configuration minimizes the effect of delay variations in the synthesizer, fiberoptic transmitter, fiber optic attenuator, fiber optic receivers, and connecting cables.
The optical fiber or cable under test is enclosed in a test chamber whose temperature mustbe controllable to cover the desired range. The test fiber or cable must be enclosed in apaper box or other container within the test chamber to keep air from the circulating fansfrom blowing directly on it. The reason for this is that the temperature of the air in thechamber is not homogeneous so the fiber would be subjected to rapid variations oftemperature if not covered. Because of the small mass of the optical fiber or cable itstemperature will follow these rapid variations in air temperature and the delay in the fiberwill vary accordingly. This generates noise in the measurement.
A test chamber’s temperature controller is usually not accurate enough for goodmeasurements. It is prudent to suspend a thermocouple in the chamber to measure the airtemperature and place another thermocouple on the optical fiber to monitor itstemperature.
If test temperatures will be below the dew point the oven should be purged with drynitrogen to keep the cable dry. Alternatively you could use a vacuum chamber.
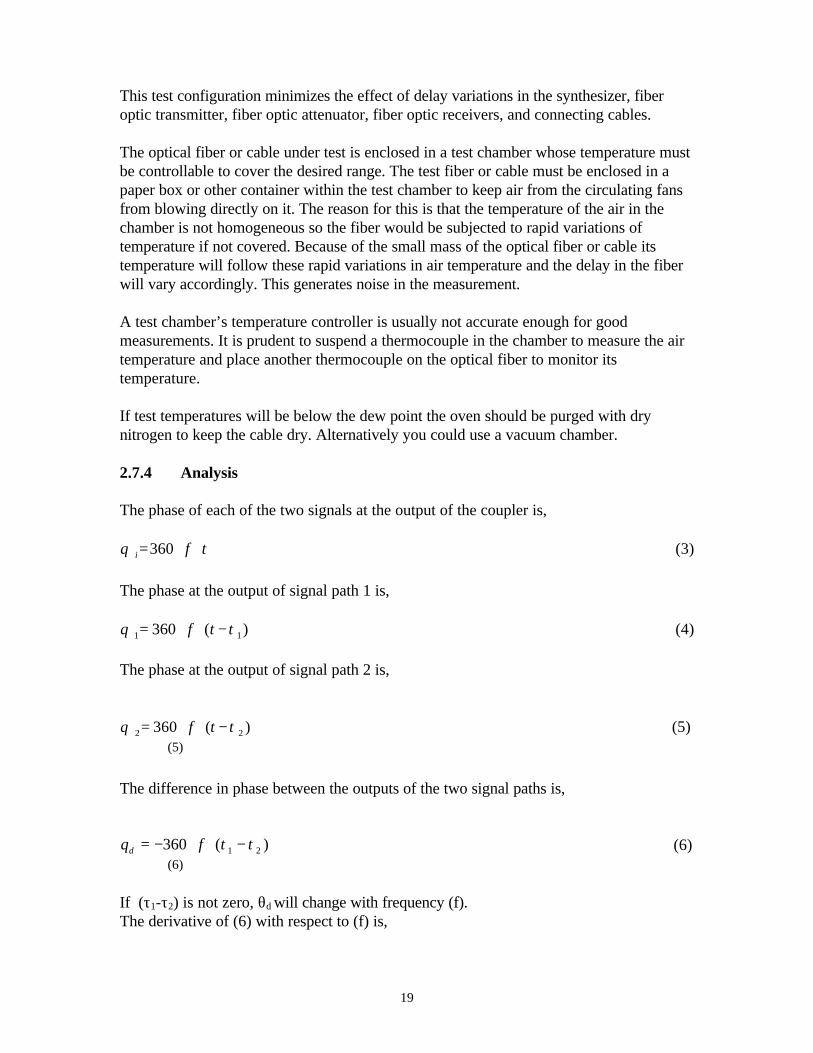
2.7.4 Analysis
The phase of each of the two signals at the output of the coupler is,
tfi ⋅⋅=360θ (3)
The phase at the output of signal path 1 is,
)(360 11 τθ −⋅⋅= tf (4)
The phase at the output of signal path 2 is,
)(360 22 τθ −⋅⋅= tf (5)
The difference in phase between the outputs of the two signal paths is,
(6)
If (τ1-τ2) is not zero, θd will change with frequency (f).The derivative of (6) with respect to (f) is,
(5)
θ τ τd f= − ⋅ ⋅ −360 1 2( )(6)
20
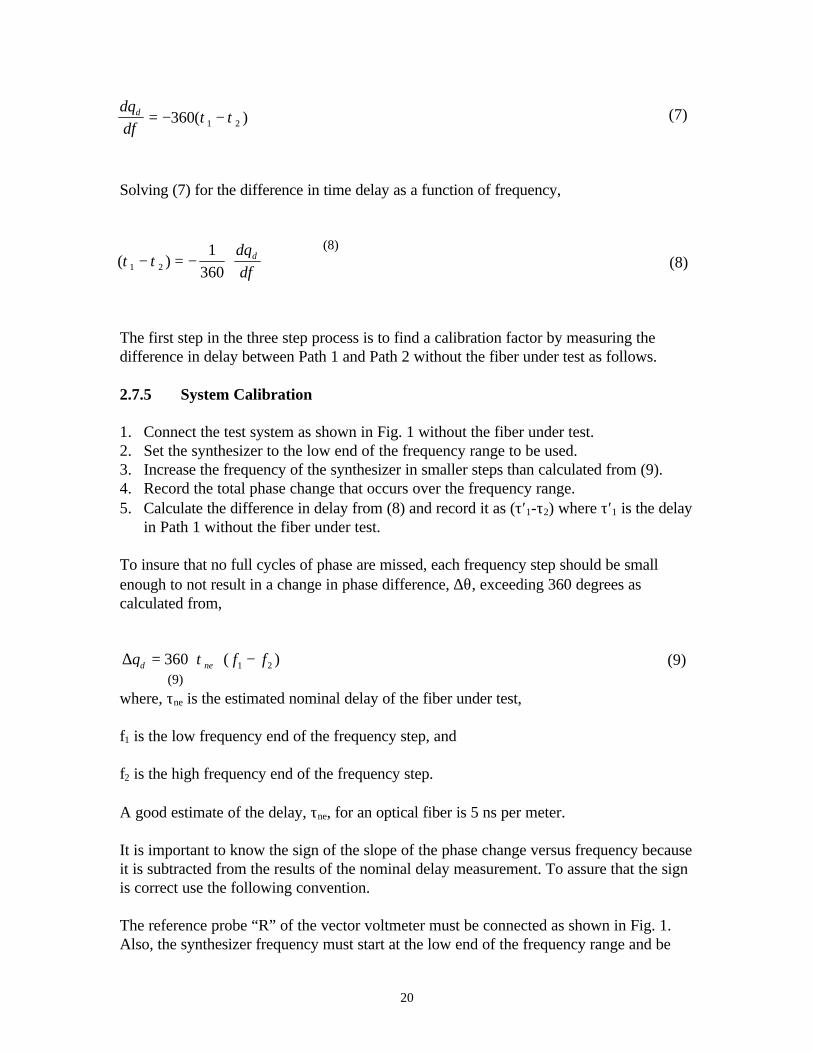
(7)
Solving (7) for the difference in time delay as a function of frequency,
(8) (8)
The first step in the three step process is to find a calibration factor by measuring thedifference in delay between Path 1 and Path 2 without the fiber under test as follows.
2.7.5 System Calibration
1. Connect the test system as shown in Fig. 1 without the fiber under test.2. Set the synthesizer to the low end of the frequency range to be used.3. Increase the frequency of the synthesizer in smaller steps than calculated from (9).4. Record the total phase change that occurs over the frequency range.5. Calculate the difference in delay from (8) and record it as (τ′1-τ2) where τ′1 is the delay
in Path 1 without the fiber under test.
To insure that no full cycles of phase are missed, each frequency step should be smallenough to not result in a change in phase difference, ∆θ, exceeding 360 degrees ascalculated from,
(9)
where, τne is the estimated nominal delay of the fiber under test,
f1 is the low frequency end of the frequency step, and
f2 is the high frequency end of the frequency step.
A good estimate of the delay, τne, for an optical fiber is 5 ns per meter.
It is important to know the sign of the slope of the phase change versus frequency becauseit is subtracted from the results of the nominal delay measurement. To assure that the signis correct use the following convention.
The reference probe “R” of the vector voltmeter must be connected as shown in Fig. 1.Also, the synthesizer frequency must start at the low end of the frequency range and be
d
dfdθ
τ τ= − −360 1 2( )
( )τ τθ
1 2
1
360− = − ⋅
d
dfd
∆θ τd ne f f= ⋅ ⋅ −360 1 2( )(9)
21
increased. Under these conditions if τ1 is greater than τ2 the slope will be negative. If τ2 isgreater than τ1 the slope will be positive. If the reference probes on the vector voltmeterare reversed or the synthesizer frequency is changed from high to low the slope of (6) willbe reversed.
Without the fiber under test, delays τ1 and τ2 should be as nearly identical as practical.With the fiber under test, τ1 should always be longer than τ2 and the slope of (4) should benegative.
The second step in the three step process is to determine the nominal delay of the fiber.
2.7.6 Preliminary Fiber Delay Measurement
1. Insert the fiber under test into the test system as shown in Fig. 1.2. Set the synthesizer to the low end of the frequency range to be used.3. Increase the frequency of the synthesizer in smaller steps than calculated from (9).4. Record the total phase change that occurs over the frequency range.5. Calculate the difference in delay (τ1-τ2) from (8).
2.7.7 Calculating the Nominal Delay of the Fiber Under Test
The nominal delay of the fiber under test is calculated from the delay measured in thesystem calibration measurement and the delay measured in the preliminary fiber delaymeasurement, and is,
τ τ τ τ τn = − − −( ) ( ' )1 2 1 2 . (10)
Now that we have calibrated the system and determined the nominal delay in the fiberunder test we are ready to measure its TCD.
2.7.8 Measuring TCD
1. Leave the test setup as it was for the preliminary fiber delay measurement with thefiber under test installed.
2. Set the synthesizer to a frequency in the test range that results in a vector voltmeterreading of zero degrees.
3. Change the temperature of the test chamber in steps and record the difference phasefor each temperature step.
4. Calculate the TCD for each temperature step using (2).
22
Although the size of the temperature steps are arbitrary, the authors usually change thetemperature in steps of 5o C. Each temperature step should be held until the phase, as readon the vector voltmeter, is stable. This may take more than 30 minutes.
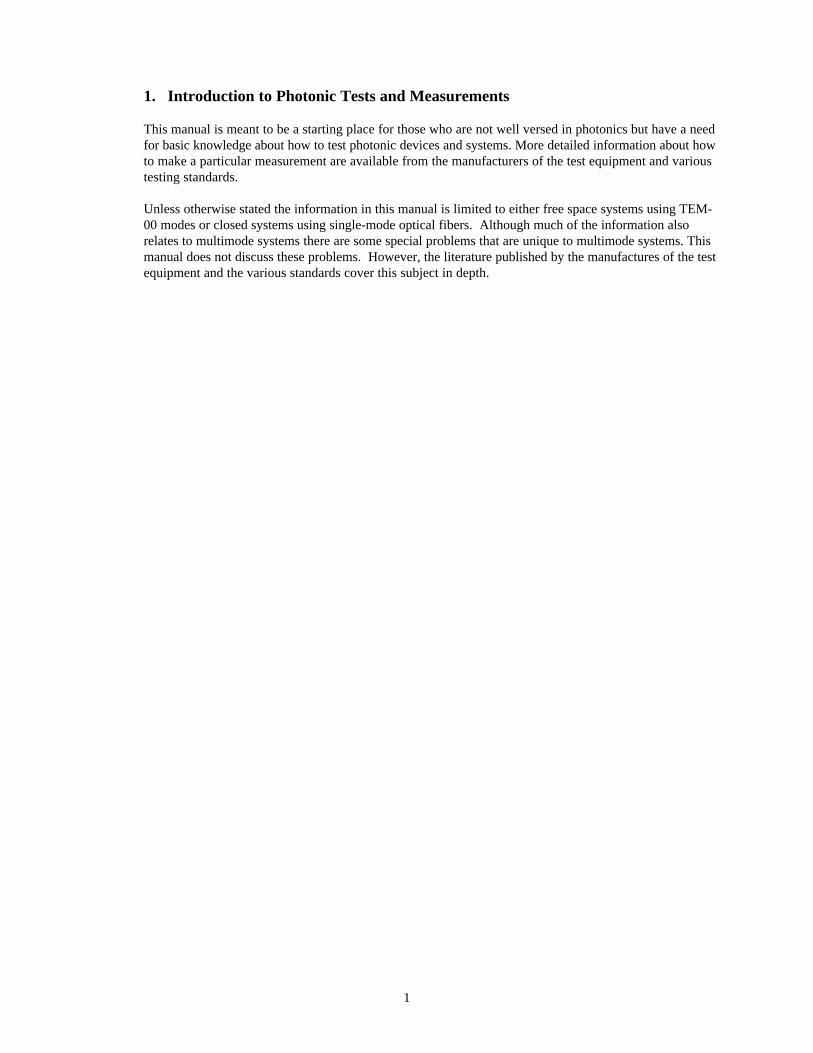
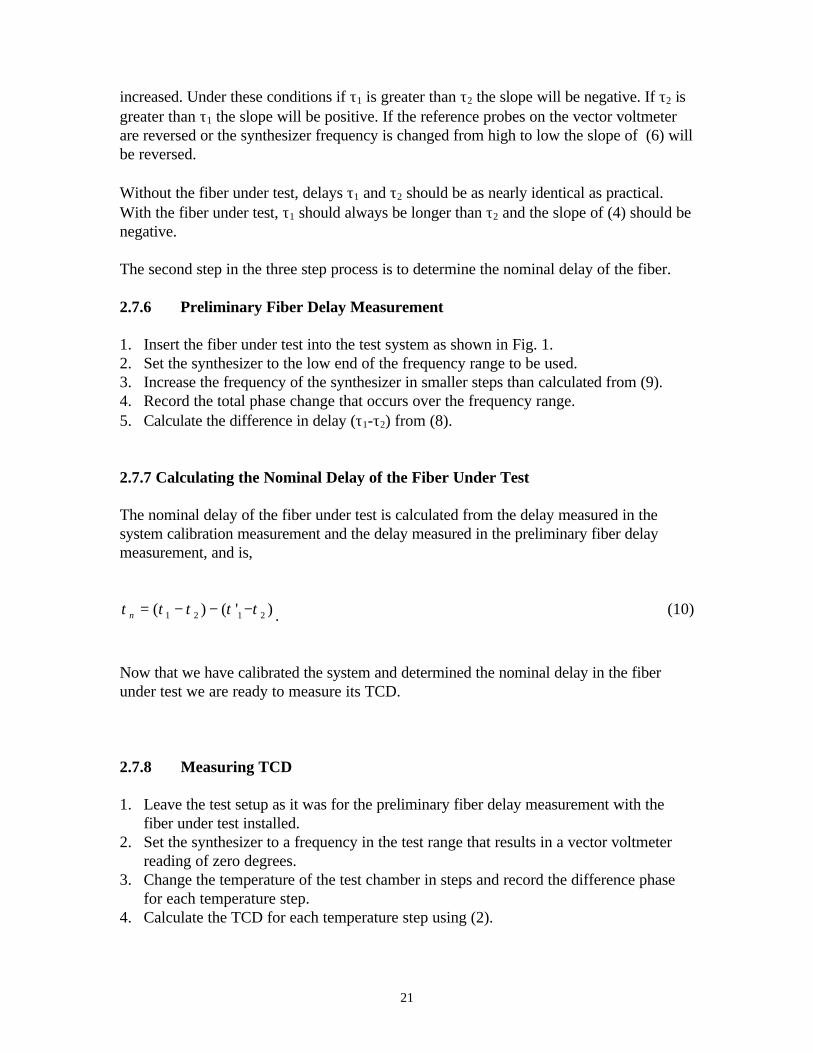
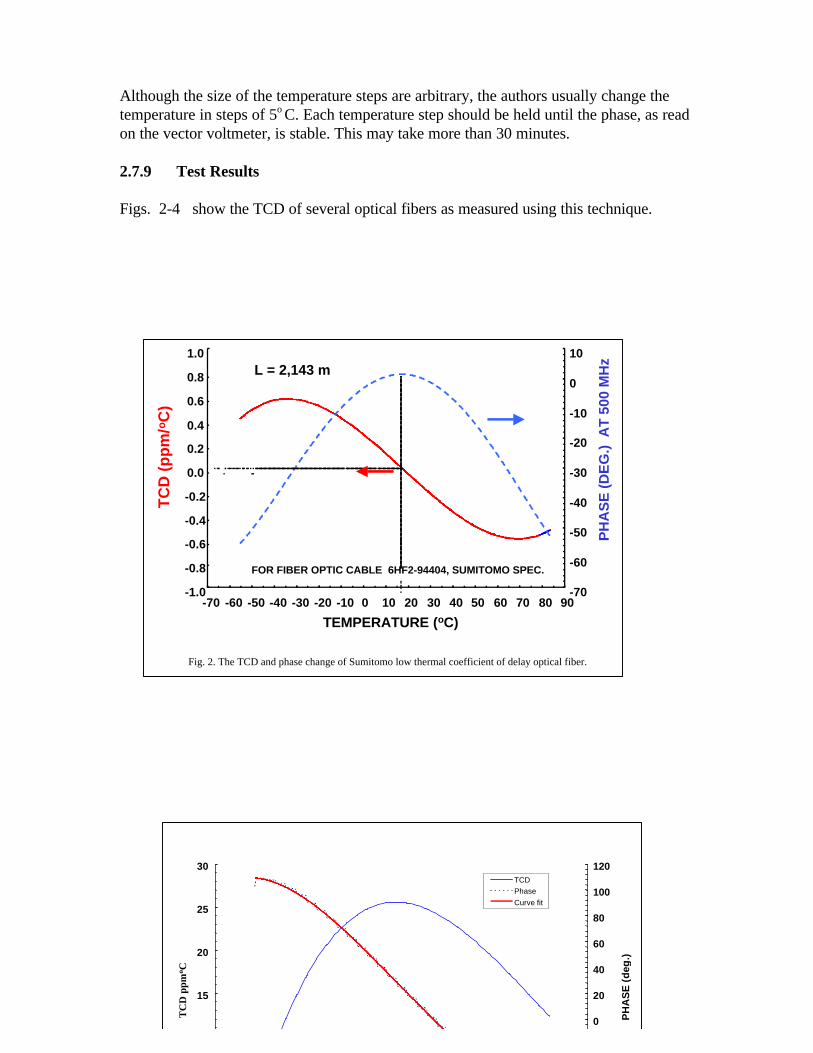
2.7.9 Test Results
Figs. 2-4 show the TCD of several optical fibers as measured using this technique.
-1.0
-0.8
-0.6
-0.4
-0.2
0.0
0.2
0.4
0.6
0.8
1.0
-70 -60 -50 -40 -30 -20 -10 0 10 20 30 40 50 60 70 80 90
TEMPERATURE (oC)
TC
D (
pp
m/o
C)
-70
-60
-50
-40
-30
-20
-10
0
10
PH
AS
E (
DE
G.)
AT
500
MH
z
FOR FIBER OPTIC CABLE 6HF2-94404, SUMITOMO SPEC.
L = 2,143 m
Fig. 2. The TCD and phase change of Sumitomo low thermal coefficient of delay optical fiber.
15
20
25
30
0
20
40
60
80
100
120
PH
AS
E (
deg
.)
TCD
Phase
Curve fit
TC
D p
pmo C

23
24
2.7.10 Conclusion
We have discussed why the TCD of cables is important in some applications.
We described in detail how to accurately measure the TCD of cables that have a very lowTCD. Although the description of this measurement technique is focused on single-modeoptical fiber and fiber optic cable, the technique is applicable to any transmission medium.
Measurement results are given for some cables designed for use in spacecraft applications.The TCD of one of these cables is < 1ppm/oC over the temperature range of –60oC to+80oC.
25
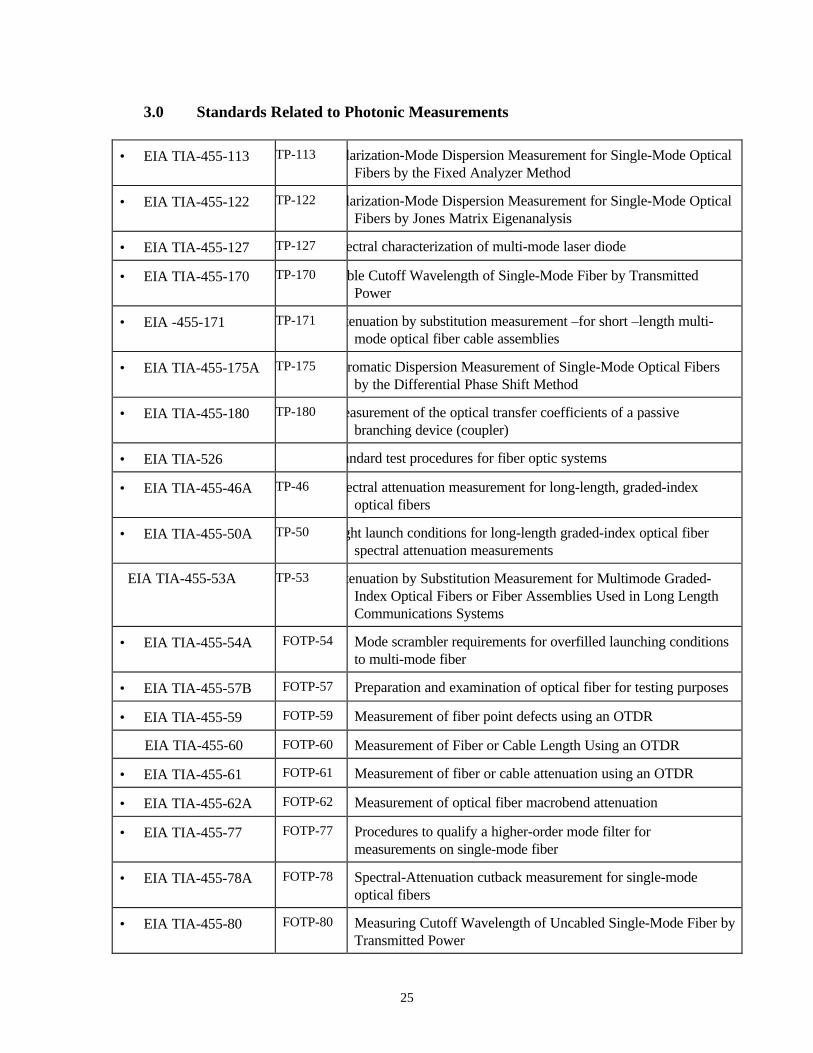
3.0 Standards Related to Photonic Measurements
• EIA TIA-455-113 TP-113 larization-Mode Dispersion Measurement for Single-Mode OpticalFibers by the Fixed Analyzer Method
• EIA TIA-455-122 TP-122 larization-Mode Dispersion Measurement for Single-Mode OpticalFibers by Jones Matrix Eigenanalysis
• EIA TIA-455-127 TP-127 ectral characterization of multi-mode laser diode
• EIA TIA-455-170 TP-170 ble Cutoff Wavelength of Single-Mode Fiber by TransmittedPower
• EIA -455-171 TP-171 tenuation by substitution measurement –for short –length multi-mode optical fiber cable assemblies
• EIA TIA-455-175A TP-175 romatic Dispersion Measurement of Single-Mode Optical Fibersby the Differential Phase Shift Method
• EIA TIA-455-180 TP-180 easurement of the optical transfer coefficients of a passivebranching device (coupler)
• EIA TIA-526 andard test procedures for fiber optic systems
• EIA TIA-455-46A TP-46 ectral attenuation measurement for long-length, graded-indexoptical fibers
• EIA TIA-455-50A TP-50 ght launch conditions for long-length graded-index optical fiberspectral attenuation measurements
EIA TIA-455-53A TP-53 tenuation by Substitution Measurement for Multimode Graded-Index Optical Fibers or Fiber Assemblies Used in Long LengthCommunications Systems
• EIA TIA-455-54A FOTP-54 Mode scrambler requirements for overfilled launching conditionsto multi-mode fiber
• EIA TIA-455-57B FOTP-57 Preparation and examination of optical fiber for testing purposes
• EIA TIA-455-59 FOTP-59 Measurement of fiber point defects using an OTDR
EIA TIA-455-60 FOTP-60 Measurement of Fiber or Cable Length Using an OTDR
• EIA TIA-455-61 FOTP-61 Measurement of fiber or cable attenuation using an OTDR
• EIA TIA-455-62A FOTP-62 Measurement of optical fiber macrobend attenuation
• EIA TIA-455-77 FOTP-77 Procedures to qualify a higher-order mode filter formeasurements on single-mode fiber
• EIA TIA-455-78A FOTP-78 Spectral-Attenuation cutback measurement for single-modeoptical fibers
• EIA TIA-455-80 FOTP-80 Measuring Cutoff Wavelength of Uncabled Single-Mode Fiber byTransmitted Power
26
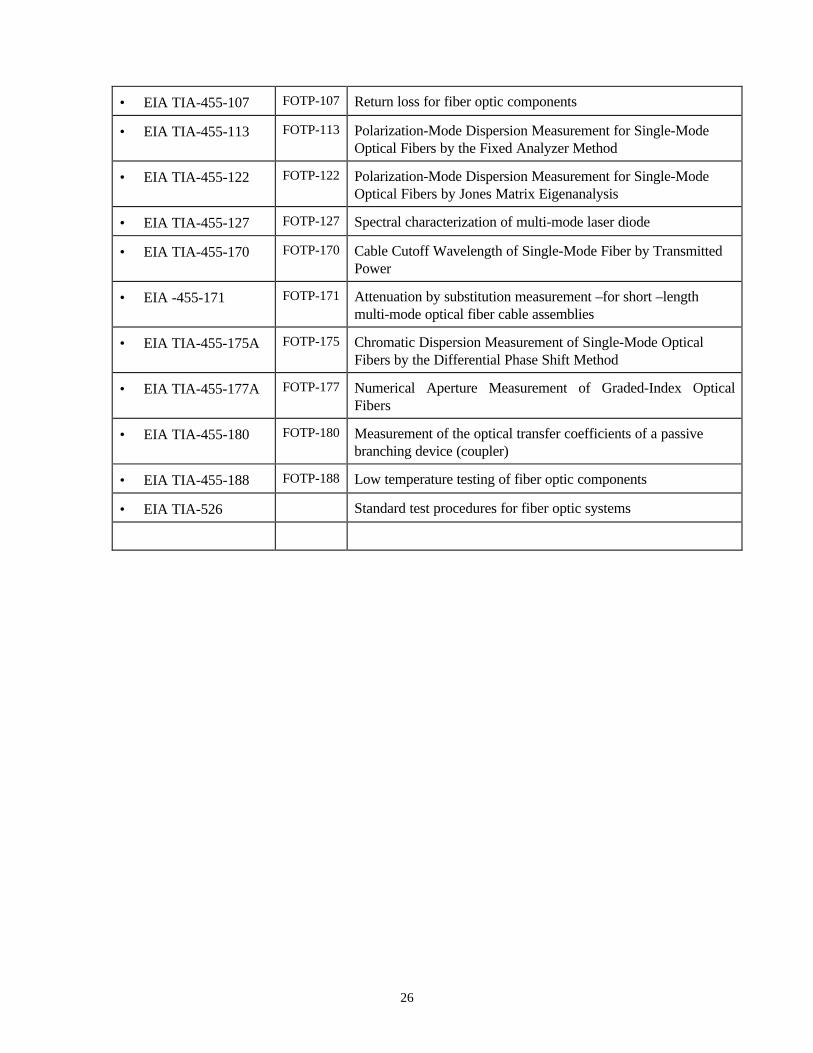
• EIA TIA-455-107 FOTP-107 Return loss for fiber optic components
• EIA TIA-455-113 FOTP-113 Polarization-Mode Dispersion Measurement for Single-ModeOptical Fibers by the Fixed Analyzer Method
• EIA TIA-455-122 FOTP-122 Polarization-Mode Dispersion Measurement for Single-ModeOptical Fibers by Jones Matrix Eigenanalysis
• EIA TIA-455-127 FOTP-127 Spectral characterization of multi-mode laser diode
• EIA TIA-455-170 FOTP-170 Cable Cutoff Wavelength of Single-Mode Fiber by TransmittedPower
• EIA -455-171 FOTP-171 Attenuation by substitution measurement –for short –lengthmulti-mode optical fiber cable assemblies
• EIA TIA-455-175A FOTP-175 Chromatic Dispersion Measurement of Single-Mode OpticalFibers by the Differential Phase Shift Method
• EIA TIA-455-177A FOTP-177 Numerical Aperture Measurement of Graded-Index OpticalFibers
• EIA TIA-455-180 FOTP-180 Measurement of the optical transfer coefficients of a passivebranching device (coupler)
• EIA TIA-455-188 FOTP-188 Low temperature testing of fiber optic components
• EIA TIA-526 Standard test procedures for fiber optic systems
27
4.0 References
BS EN 167 Personal Eye Protection- Optical Test Methods
EIA 455-162 Fiber Optic Cable Temperature - Humidity Cycling
EIA 455-33A Fiber Optic cable Tensile Loading and Bending Test
EIA SP2824 Procedure for Measuring Tadiation Induced Attenuation in Optical Fibers and OpticalCables
EIA SP3401 Optical Fiber Cable Temperature-Humidity Cycling
EIA SP3455A Measurement of Optical Fiber Ribbon Dimensions
EIA/TIA 455-107 Return Loss for fiber Optic Components
EIA/TIA 455-3A Procedure to Measure Temperature Cycling Effects on Optical Fiber , Optical Cable,and Other Passive fiber Optic Components
EIA/TIA 455-42A Optical Crosstalk in Fiber Optic Components
EIA/TIA 455-62A Measurement of Optical Fiber Macrobend Attenuation
EIA/TIA 544-4B Fiber Optics Component Temperature Life Test
IEC 61315 Calibration of Fiber Optic Power Meters
ISO 10109-6 Optics and Optical Instruments - Environmental Requirements - Part 6 Test Requirements
ISO 10109-8 Optics and Optical Instruments - Environmental Requirements - Part 8 Test Requirements
ISO 11421 Optics and Optical Instruments- Accuracy of Optical Transfer Function (OTF) Measurement
ISO 12857-1 Optics and Optical Instruments - Geodetic Instruments - Field Procedures for DeterminingAccurately - Part 1: levels
ISO 12857-2 Optics and Optical Instruments - Geodetic Instruments - - Field Procedures for DeterminingAccurately - Part 2: Theodolites
ISO 7944 Optics and Optical Instruments - Reference Wavelengths
ISO 8721 Measurement Techniques in Impact Tests-Optical Instrumentation
ISO 9022-1 Optics and Optical Instruments - Environmental Test Methods - Part 1: Definitions, Extentof Testing
ISO 9022-11 Optics and Optical Instruments - Environmental Test Methods - Part 11: Mold growth
ISO 9022-12 Optics and Optical Instruments - Environmental Test Methods - Part 12: Contamination
ISO 922-14 Optics and Optical Instruments - Environmental Test Methods - Part14: Dew, Hoarfrost, Ice
28
ISO 9022-17 Optics and Optical Instruments - Environmental Test Methods - Part17: CombinedContamination, Solar Radiation
ISO 9022-2 Optics and Optical Instruments - Environmental Test Methods - Part 2: Cold, Heat, Humidity
ISO 9022-3 Optics and Optical Instruments - Environmental Test Methods - Part 3: Mechanical Stress
ISO 9022-4 Optics and Optical Instruments - Environmental Test Methods - Part 4: Salt Mist
ISO 9022-5 Optics and Optical Instruments - Environmental Test Methods - Part 5: Combined Cold, LowAir Pressure
ISO 9022-6 Optics and Optical Instruments - Environmental Test Methods - Part 6: Dust
ISO 9022-7 Optics and Optical Instruments - Environmental Test Methods - Part 7: Drip, Rain
ISO 9022-8 Optics and Optical Instruments - Environmental Test Methods - Part 8: High Pressure, LowPressure, Immersion
ISO 9022-9 Optics and Optical Instruments - Environmental Test Methods - Part 9: Soar Radiation
ISO 9039 Optics and Optical Instruments - Quality Evaluation of Optical Systems - Determination ofDistortion
ISO 9335 Optics and Optical Instruments - Optical Transfer Function - Principles and Procedures ofMeasurement
ISO/DIS 9022-20 Optics and Optical Instruments - Environmental Test Methods - Part 20: HumidAtmosphere Containing Sulfur Dioxide or Hydrogen Sulfide
ISO/DIS 9211-4 Optics and Optical Instruments - Optical Coatings - Part 4: Specific Test Methods
JIS K7105 Testing Methods for Optical Properties of Plastics
JIS Z8714 Retroreflectors - Optical Properties - Measuring Method
MIL DOD -STD-1678 Fiber Optics Test Methods and Instrumentation
TIA/EIA 455-11B Vibration test Procedure for Fiber Optic Components and Cables
TIA/EIA 455-2C Impact Test Measurements for Fiber Optic Devices
TIA/EIA 455-35A Fiber Optic Component Dust (Fine Sand) Test
TIA/EIA 455-4B Fiber Optics - Component Temperature Life Test
TIA/EIA 455-5B Humidity Test Procedure for Fiber Optic Components
TIA/EIA 455-64 Procedure for Measuring Radiation Induced Attenuation in Optical Fibers and OpticalCables
ASTM D5424-98 Standard test Method for Smoke Obscuration of Insulating Materials Contained inElectrical or Optical Fiber Cables when Burning in a Vertical Cable Tray Configuration
29
ASTM D5537-97 Standard Test Method for Heat Release, Flame Spread and Mass Loss Testing ofInsulating Materials Contained in Electrical of Optical Fiber Cables when Burning in a Vertical CableTray Configuration
ASTM D6113-97 Standard test Method for Using a Calorimeter to Determine Fire-Test-ResponseCharacteristics of Insulating Materials Contained in electrical or Optical Fiber Cables
ASTM E1614-94 Standard Guide for Procedure for Measuring Ionizing Radiation-Induced Attenuationin Silica-Based Optical Fibers and Cables for Use in Remote Fiber-Optic Spectroscopy and BroadbandSystems
ASTM E1654-94 Standard guide of Measuring Ionizing Radiation -Induced Spectral Changes in OpticalFibers and Cables for Use in Remote Raman Fiber-Optics Spectroscopy
ASTM D5424-98 Standard Test Method for Smoke Obscuration of Insulating Materials Contained inelectrical or Optical Fiber cables when Burning in a Vertical Cable Tray Configuration
ASTM D5537-97 Standard test Method for Heat Release, Flame Spread and Mass Loss testing ofInsulating Materials Contained in Electrical or Optical Fiber Cables When Burning in a Vertical CableTray Configuration
EIA SP3538 Polarization Mode Dispersion Measurement for Single-Mode Optical Fibers byInterferometric Method
EIA/TIA 455-100A Gas Leakage Test for Gas-Blocked fiber Optic Cables
EIA/TIA 455-187 Engagement and Separation Force Measurement of Fiber Optic Connector Sets
EIA/TIA 455-190 Low Pressure (High Altitude) testing of Fiber Optic Components
EIA/TIA 455-30 Frequency Domain Measurement of Multimode Optical Fiber InformationTransmission Capacity
EIA/TIA 455-51A Pulse Distortion Measurement of Multimode Glass Optical Fiber InformationTransmission Capacity
EIA/TIA 455-55C End-View Methods for Measuring Coating and Buffer Geometry of Optical Fibers
EIA/TIA455-69A Test Procedure for Evaluating the Effect of Minimum and Maximum ExposureTemperatures on the Optical Performance of Optical Fibers
EIA/TIA 455-71 Procedure to Measure Temperature - Shock Effects on Fiber Optic Components
EIA/TIA 526-11 Measurement of Single-Reflection Power for Fiber Optic Terminal Equipment
TIA/EIA 455-132 FOTP-132 Measurement of the Effective Area of Single-Mode Optical Fiber
TIA/EIA 455-50B Light Launch Conditions for Long-Length Graded Index Optical Spectral AttenuationMeasurements - FOTP 50
TIA/EIA 455-7 Numerical Aperture of Step-Index Multimode Optical Fibers by output Far-FieldRadiation Pattern Measurement
30
TIA/EIA 455B Standard test Procedure for Fiber Optic Fibers, Cables, Transducers, Sensors,Terminating Devices, and Other Fiber Optic Components
UL 1666 Test for Flame Propagation Height of Electrical and Optical fiber Cables Installed Vertically inShafts
UL 1685 Vertical-Tray Fire Propagation and Smoke-Release Test for Electrical and Optical Fiber Cables
UL 910 Test for Cable Flame-Propagation and Smoke-Density Values for Electrical and Optical FiberCables Used in Spaces Transporting Environmental Air
ASTM F524-77 (R1992) Tentative test Methods for Measurng Beam Divergence of Pulsed Lasers by theApertured-Detector Technique
EIA/TIA 455A Standard Test Procedure for Fiber Optic Fibers, Cables, Transducers, Sensors,Connecting and Terminating Devices, and other Fiber Optic Components
EIA/TIA 455-6B FOTP -6 Cable Retention Test Procedure for Fiber Optic Cable InterconnectingDevices
EIA/TIA 455-20A FOTP-20 Measurement of Change in Optical Transmittance
EIA/TIA 455-25B FOTP-25 Repeated Impact testing of Fiber Optic Cables and Cable Assemblies
EIA/TIA 455-28B FOTP-28 Method for Measuring Dynamic Tensile Strength of Optical Fiber
EIA/TIA 455-29A FOTP-29 Refractive Index Profile, Transverse Interference Method
EIA/TIA 455-30B FOTP-30 Frequency domain Measurement of Multimode Optical Fiber InformationTransmission Capacity
EIA/TIA 455-31 FOTP-31 Proof Testing Optical Fibers by Tension
EIA/TIA 455-32A FOTP-32 Fiber Optic Circuit Discontinuities
EIA/TIA 455-34 FOTP-34 Interconnection Device Insertion Loss Test
EIA/TIA 455-37A FOTP-37 Low or High Temperature Bend Test for Fiber Optic Cable
EIA/TIA 455-41 FOTP-41 Compressive Loading resistance of Fiber Optic Cables
EIA/TIA 455-43 FOTP-43 Output Near-Field Radiation Pattern Measurement of Optical WaveguideFibers
EIA/TIA 455-44B FOTP-44 Refractive Index Profile, Refracted Ray Method
EIA/TIA 455-45B FOTP-45 Method for Measuring Optical Fiber Geometry Using a LaboratoryMicroscope
EIA/TIA 455-46A FTOp-46 Spectral Attenuation Measurement for Long-Length, Graded Index OpticalFiber
EIA/TIA 455-47B FOTP-47 Output Far Field Radiation Pattern Measurement
31
EIA/TIA 455-53A FOTP-53 Attenuation by Substitution Measurement for Multimode Graded-IndexOptical Fibers or Fiber Assemblies Used in Long Length Communication Systems
EIA/TIA 455-56B FOTP-56 Test Method for Evaluating Fungus Resistance of Optical Fiber and Cable
EIA/TIA 455-58A FOTP-58 Core Diameter Measurement of Graded-Index Optical Fibers
EIA/TIA 455-67 FOTP-67 Procedure for Assessing High Temperature Exposure of Optical Fibers
EIA/TIA 455-76 FOTP-76 Method for Measuring Dynamic Fatigue of Optical Fibers by Tension
EIA/TIA 455-81A FOTP-81 Compound Flow (Drip) Test for Filled Fiber Optic Cable
EIA/TIA 455-82B FOTP-82 Fluid Penetration Test for Fluid-Blocked Fiber Optic Cable
EIA/TIA 455-84B FOTP-84 Jacket Self-Adhesion (Blocking) Test for Fiber Optic Cable
EIA/TIA 455-93 FotP-93 Test Method for Optical Fiber Cladding Diameter and Noncircularity byNoncontacting Michelson Interferometry
EIA/TIA 455-106 FOTP-106 Procedure for Measuring the Near-Infrared Absorbance of Fiber OpticCoating Materials
EIA/TIA 455-119 FOTP-119 Coating Geometry Measurement for Optical Fiber by Grayscale Analysis
EIA/TIA 455-165A FOTP-165 Mode-Field Diameter Measurement by Near-Field Scanning Technique
EIA/TIA 455-176 FOTP-176 Method for Measuring Optical Fiber Cross-Sectional Geometry byAutomated Grey-Scale Analysis
EIA/TIA 455-178A FOTP-178 Measurements of Strip Force for Mechanically Removing CoatingsFrom Optical Fibers
ANSI/EIA 455-95-1986 Absolute Optical Power Test for Optical Fibers and Cables
ISO 9342:1996 Optics and Optical Instruments - Test Lenses for Calibration of Focimeters
ISO 13653:1996 Optics and Optical Instruments - General Optical Test Methods - Measurement ofRelative Irradiance in the Image Field
ISO 10345-1:1992 Glass- Determination of Stress-Optical Coefficient - Part 1: Tensile Strength
ISO 10345-2:1992 Glass- Determination of Stress-Optical Coefficient Part 2: Bending Test
IEC 61290-2-3 Ed. 1.0 b:1998 Optical Fiber Amplifiers - Basic Specification - Part 2-3: Test Methodsfor Optical Power Parameters - Optical Power Meter
ISO 11551:1997 Optics and Optical Instruments - Laser and Laser-Related Equipment - Test Methodfor Absorptance of Optical Laser components
IEC 61290-2-1 Ed. .0 b:1998 Optical Fiber amplifiers - Basic Specification - Part 2-1: Test Methods forOptical Power Parameters - Optical spectrum Analyzer
ANSI/TIA/EIA 455-75A-1996 Fluid Immersion Test for Optical Waveguide Fiber
32
IEC 61290-1-1 Ed. 1.0 b:1998 Optical Fiber Amplifiers - Basic specification - Part 1-1: Test Methods forGain Parameters - Optical Spectrum AnalyzerIEC 61290-6-1 Ed. 1.0 b:1998 Optical Fiber Amplifiers - Basic Specification - Part 6-1: Test Methodsfor Pump Leakage Parameters - Optical Demultiplexer
IEC 61290-2-2 Ed. 1.0 b:1998 Optical Fiber Amplifiers - Basic Specification - Part 2-2: Test Methods forOptical Power Parameters - Electrical Spectrum Analyzer
IEC 61290-7-1 Ed. 1.0 b:1998 Optical Fiber Amplifiers - Basic Specification - Part 7-1: Test Methods forOut-Of-Band Insertion Losses - Filtered Optical Power Meter
IEC 61280-1-1 Ed. 1.0 b:1998 Fiber Optic communication Subsystem Basic Test Procedures - Part 1-1:Test Procedures for General communication Subsystems - Transmitter Output Optical PowerMeasurement for Single-Mode Optical Fiber Cable
ANSI/EIA 455-36A-1987 Twist Test for Fiber Optic Connecting Devices
ANSI/EIA/TIA 455-87B-1993 Knot Test for Fiber Optic Cable
ANSI/EIA/TIA 455-85A-1992 Fiber Optic Cable Twist Test
ANSI/EIA 455-98-1983 External Fiber Optic Cable External Freezing Test
ANSI/TIA/EIA 455-2C-1998 Impact Test Measurements for Fiber Optic Devices
ANSI/TIA/EIA 455-39A-1989 Fiber Optic Cable Water Wicking Test
ANSI/TIA/EIA 455-14A-1992 Fiber Optic Shock Test (Specified Pulse)
ANSI/TIA/EIA 455-104A-1993 Fiber Optic Cable Cyclic Flexing Test
ANSI/TIA/EIA 455-91-1985 (R1996) Fiber Optic Cable Twist-Bend Test
ANSI/TIA/EIA 455-16A-1991 Salt Spray (Corrosion) Test for Fiber Optic Components
ANSI/TIA/EIA 455-A-1991 standard test Procedure for Fiber Optic Fibers, Cables, Transducers,Sensors, Connecting and Terminating Devices, and Other Fiber Optic Components
ANSI/TIA/EIA 455-184-1991 (R1995) Coupling Proof Overload Test, Fiber Optic InterconnectingDevices
ANSI/TIA/EIA 455-99-1983 (R1993) Gas Flame Test for Special Purpose Fiber Optic Cable
ANSI/TIA/EIA 455-21A-1988 Fibre Optics - Mating Durability for fiber Optic Interconnecting Devices
ANSI/TIA/EIA 455-1A-1988 Cable Flexing for Fiber Optic Interconnecting Devices


![Nearfield Optical Interactions of Nano-Plasmonic Particle ...€¦ · with resonances depending on the wire length. [19] In plasmonic devices, ohmic losses are a challenging drawback,](https://img.pdfslide.us/doc/110x75/606319b28599027a3559470b/nearfield-optical-interactions-of-nano-plasmonic-particle-with-resonances-depending.jpg)