Embed Size (px)
Citation preview
Anna Ayvazyan
Yerevan State University of Armenia
The Photo-Electron Spectrometer (PES). Making scene of the PES system by Karabo
Supervisor:
Dr. Joakim Laksman
Scientist, X-ray Photon Diagnostics Group
European XFEL, Schenefeld, Germany
September 6, 2017
Photon Emission Spectrometer for SASE3
beamline of European XFEL diagnostics
2
Abstract
This report, in the context of the DESY Summer Student Program 2017, presents the concept
of The Photo-Electron Spectrometer (PES) and scene of the PES system made by using Karabo
software, performed at European XFEL between August 28th and September 7th 2017.
The European X-ray free electron laser (European XFEL) is an international project to create
the world's largest free electron laser designed to monitor the course of molecular chemical reactions,
and resolve the atomic structure of biomolecules and viruses, as well as many more applications in
science and technology. European XFEL provides high average brilliance in the soft and hard X-ray
mode. The high average brilliance is achieved due to acceleration of up to 27,000 electron bunches per
second by the super-conducting electron accelerator. The European XFEL with its[ used at the end
station for various experimental techniques. For commissioning and of course during research photon
beam diagnostic is necessary because of the statistical nature of SASE (Self-Amplified Spontaneous
Emission). One of the most flexible photon beam diagnostics instruments is the Photo-Electron
Spectrometer (PES). The photo-electron spectrometer (PES) measures the spectrum and polarization
of the photon pulse based on an angular resolved time-of-flight measurement of photo-electrons. At
the SASE3 FEL source, it is planned to use variable polarization schemes, so polarization
measurements and monitoring is required. For supposed higher requirements for volumes and data
rates of modern photon science facilities suchfigure as the software framework of free electron X-ray
lasers called Karabo was written from scratch. Karabo is written in C ++, which uses the programming
mechanisms for templates and the boost. Karabo is in fact a flexible application management system.
3
Contents
1. Introduction to European XFEL...………………………………….. 3
2. Photon Diagnostics Systems…..……………………………………. 4
3. Online Photon Diagnostic Systems …………………………………… 5
4. Photoelectron Spectrometer………………………………………… 5
5. PES work structure…………………………………………….….… 6
6. Helmholtz-coils with magnetometer and MCP detector results....…. 7-8
7. Introduction to XFEL Control system and Karabo Scenes……........ 9-11
8. Acknowledgement………………………………………………….. 11
9. Conclusion………………………………………………………….. 11
4
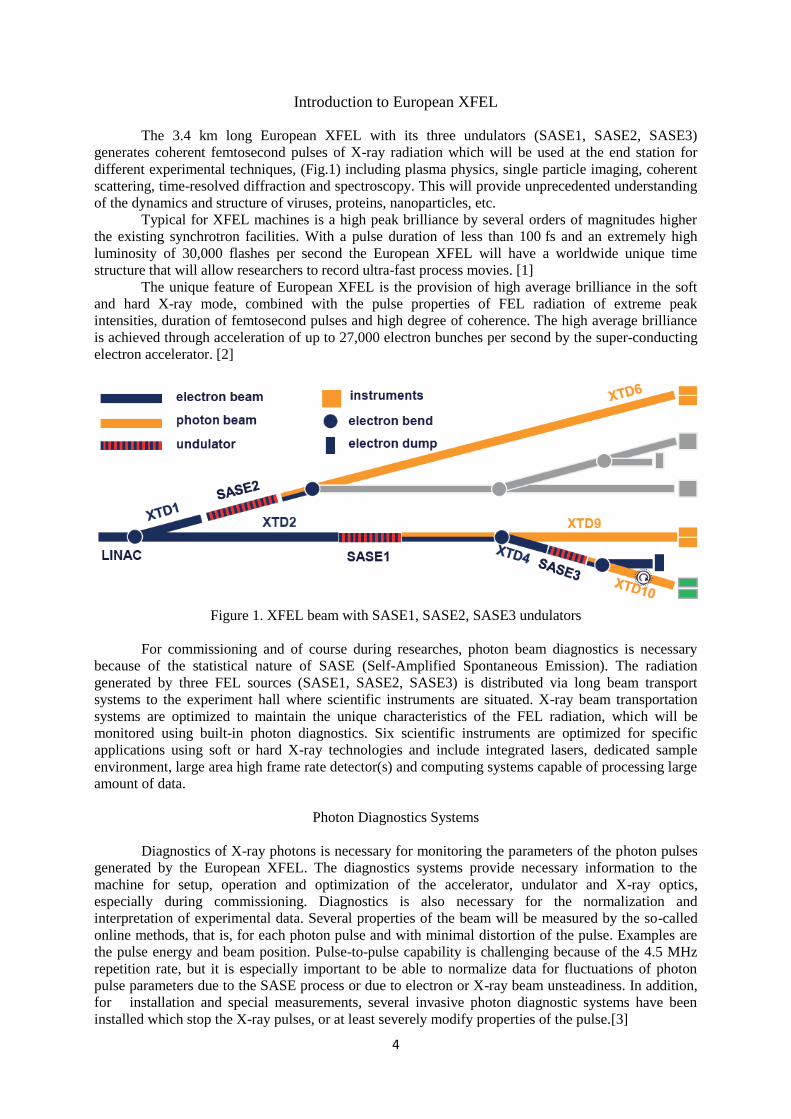
Introduction to European XFEL
The 3.4 km long European XFEL with its three undulators (SASE1, SASE2, SASE3)
generates coherent femtosecond pulses of X-ray radiation which will be used at the end station for
different experimental techniques, (Fig.1) including plasma physics, single particle imaging, coherent
scattering, time-resolved diffraction and spectroscopy. This will provide unprecedented understanding
of the dynamics and structure of viruses, proteins, nanoparticles, etc.
Typical for XFEL machines is a high peak brilliance by several orders of magnitudes higher
the existing synchrotron facilities. With a pulse duration of less than 100 fs and an extremely high
luminosity of 30,000 flashes per second the European XFEL will have a worldwide unique time
structure that will allow researchers to record ultra-fast process movies. [1]
The unique feature of European XFEL is the provision of high average brilliance in the soft
and hard X-ray mode, combined with the pulse properties of FEL radiation of extreme peak
intensities, duration of femtosecond pulses and high degree of coherence. The high average brilliance
is achieved through acceleration of up to 27,000 electron bunches per second by the super-conducting
electron accelerator. [2]
Figure 1. XFEL beam with SASE1, SASE2, SASE3 undulators
For commissioning and of course during researches, photon beam diagnostics is necessary
because of the statistical nature of SASE (Self-Amplified Spontaneous Emission). The radiation
generated by three FEL sources (SASE1, SASE2, SASE3) is distributed via long beam transport
systems to the experiment hall where scientific instruments are situated. X-ray beam transportation
systems are optimized to maintain the unique characteristics of the FEL radiation, which will be
monitored using built-in photon diagnostics. Six scientific instruments are optimized for specific
applications using soft or hard X-ray technologies and include integrated lasers, dedicated sample
environment, large area high frame rate detector(s) and computing systems capable of processing large
amount of data.
Photon Diagnostics Systems
Diagnostics of X-ray photons is necessary for monitoring the parameters of the photon pulses
generated by the European XFEL. The diagnostics systems provide necessary information to the
machine for setup, operation and optimization of the accelerator, undulator and X-ray optics,
especially during commissioning. Diagnostics is also necessary for the normalization and
interpretation of experimental data. Several properties of the beam will be measured by the so-called
online methods, that is, for each photon pulse and with minimal distortion of the pulse. Examples are
the pulse energy and beam position. Pulse-to-pulse capability is challenging because of the 4.5 MHz
repetition rate, but it is especially important to be able to normalize data for fluctuations of photon
pulse parameters due to the SASE process or due to electron or X-ray beam unsteadiness. In addition,
for installation and special measurements, several invasive photon diagnostic systems have been
installed which stop the X-ray pulses, or at least severely modify properties of the pulse.[3]
5
Online Photon Diagnostic Systems
These systems can be separated into residual gas systems, naturally interfering only minimally
with the X-ray beam, and systems using very thin solid films or crystals, thereby absorbing only a
small fraction of the FEL pulse. This latter method is applicable only to hard X-ray radiation,
otherwise the absorption is too strong.
For the diagnostic systems of the residual gas, photoionization of rare gases (Xe, Ne, Ar or Kr)
or nitrogen is used, and this makes these devices inviolable and highly translucent. This non-invasive
diagnostic method is best suited for high peak energies and high average flux since in this case there is
no issue with damage or heating due to the absorbed energy of X-ray pulse. At European XFEL, these
systems are used in the transportation of the beam to measure pulse energy, the polarization of the X-
ray pulse and position of the beam. Residual gas monitors can continuously operate up to very high
pulse repetition rates limited by the flight time of ions and electrons, which are used to measure
impulse properties, and work even for hard X- if sufficient sensitivity is able to compensate for the
reduction in cross section. [3]
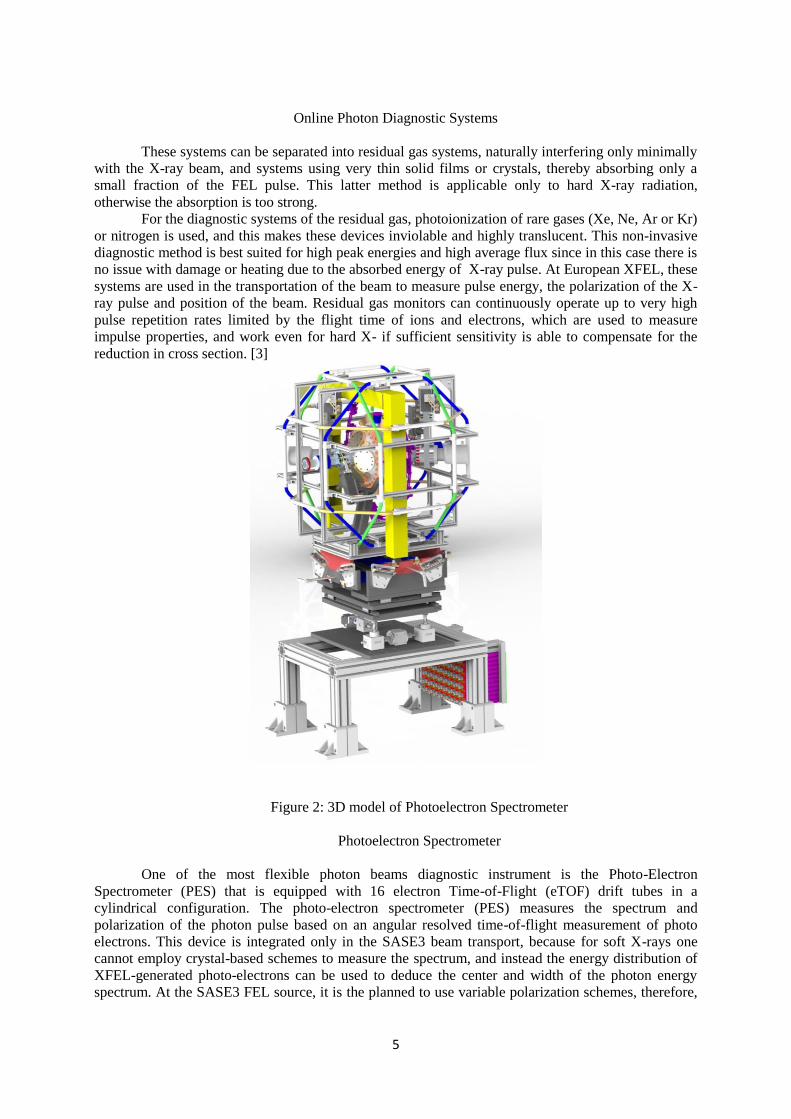
Figure 2: 3D model of Photoelectron Spectrometer
Photoelectron Spectrometer
One of the most flexible photon beams diagnostic instrument is the Photo-Electron
Spectrometer (PES) that is equipped with 16 electron Time-of-Flight (eTOF) drift tubes in a
cylindrical configuration. The photo-electron spectrometer (PES) measures the spectrum and
polarization of the photon pulse based on an angular resolved time-of-flight measurement of photo
electrons. This device is integrated only in the SASE3 beam transport, because for soft X-rays one
cannot employ crystal-based schemes to measure the spectrum, and instead the energy distribution of
XFEL-generated photo-electrons can be used to deduce the center and width of the photon energy
spectrum. At the SASE3 FEL source, it is the planned to use variable polarization schemes, therefore,
6
polarization state measurements and monitoring are necessary. The PES has a spectral resolving power
of ∆𝐸
E ≤ 10-4 and the polarization direction and degree can be measured with an accuracy of 1%.[3]
In the TOF technique, kinetic energies are determined by measuring flight times of electrons
traveling a fixed distance between an interaction region and a detector, typically up to several hundred
nanoseconds. The method is based on the coincidence between a timing pulse and an electron signal;
background noise is suppressed and distributed evenly through the entire time spectrum, which greatly
simplifies data analysis. Another advantage of the TOF technique is that an entire electron spectrum
can simultaneously be collected. Compared with electrostatic analysis, simultaneous collection of the
whole spectrum eliminate fluctuation effects and can increase the measurement efficiency of the
electron-TOF method. This electron-TOF system is capable to efficiently slow down high-kinetic-
energy electrons and is convenient in situ analyzer alignment.
PES work structure
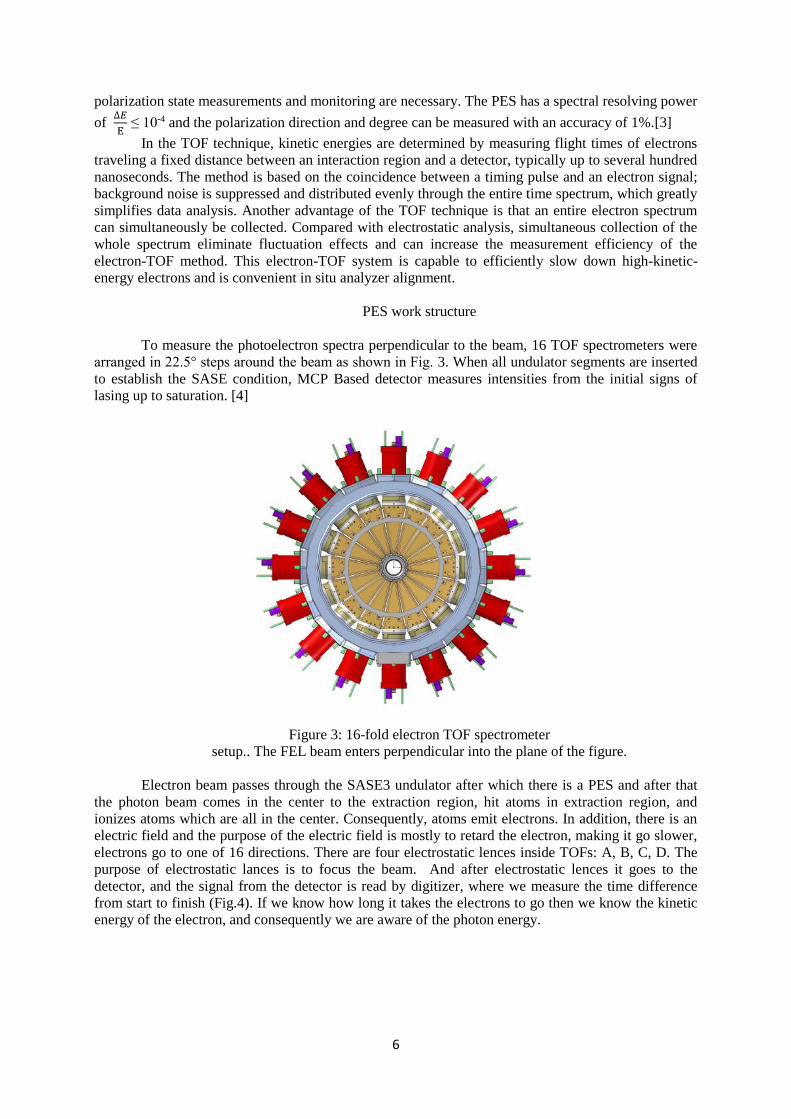
To measure the photoelectron spectra perpendicular to the beam, 16 TOF spectrometers were
arranged in 22.5° steps around the beam as shown in Fig. 3. When all undulator segments are inserted
to establish the SASE condition, MCP Based detector measures intensities from the initial signs of
lasing up to saturation. [4]
Figure 3: 16-fold electron TOF spectrometer
setup.. The FEL beam enters perpendicular into the plane of the figure.
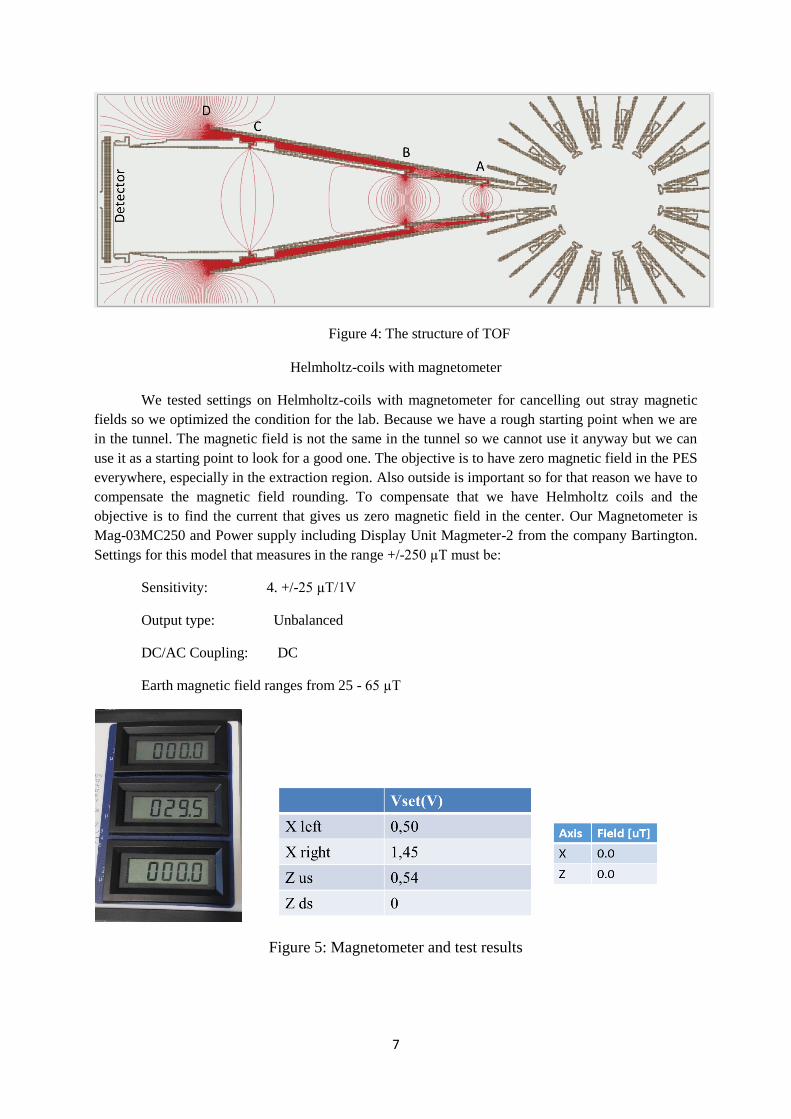
Electron beam passes through the SASE3 undulator after which there is a PES and after that
the photon beam comes in the center to the extraction region, hit atoms in extraction region, and
ionizes atoms which are all in the center. Consequently, atoms emit electrons. In addition, there is an
electric field and the purpose of the electric field is mostly to retard the electron, making it go slower,
electrons go to one of 16 directions. There are four electrostatic lences inside TOFs: A, B, C, D. The
purpose of electrostatic lances is to focus the beam. And after electrostatic lences it goes to the
detector, and the signal from the detector is read by digitizer, where we measure the time difference
from start to finish (Fig.4). If we know how long it takes the electrons to go then we know the kinetic
energy of the electron, and consequently we are aware of the photon energy.
7
Figure 4: The structure of TOF
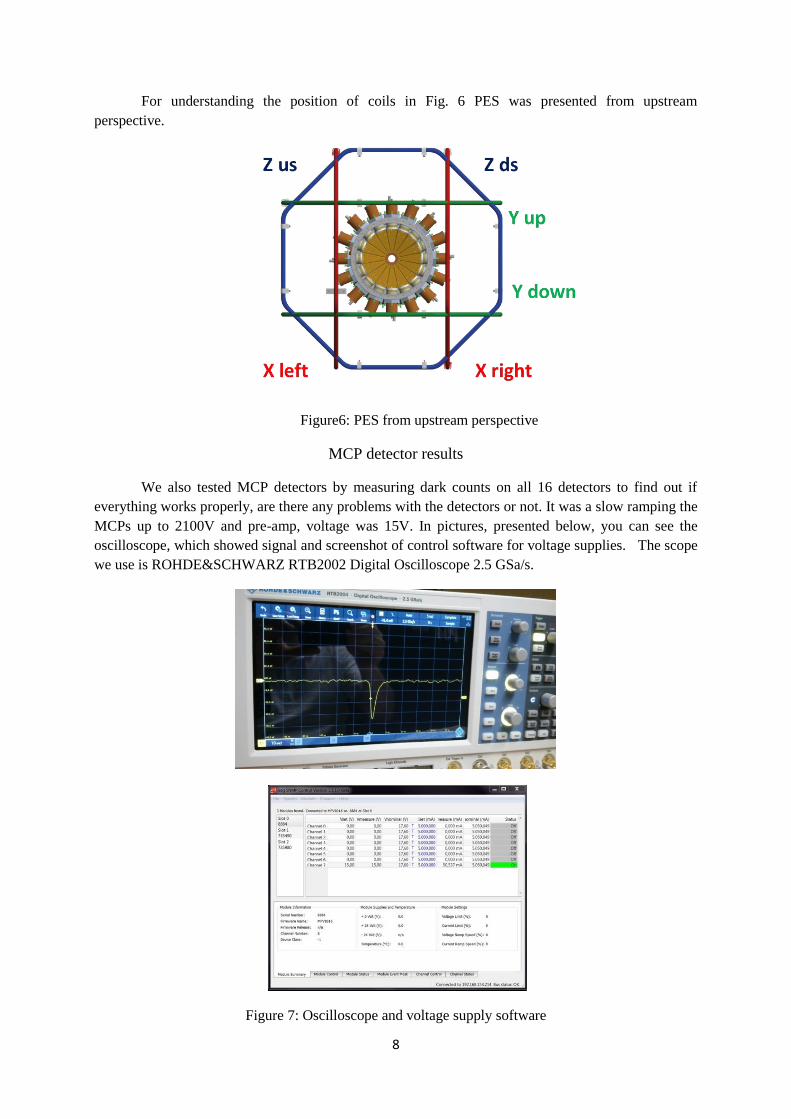
Helmholtz-coils with magnetometer
We tested settings on Helmholtz-coils with magnetometer for cancelling out stray magnetic
fields so we optimized the condition for the lab. Because we have a rough starting point when we are
in the tunnel. The magnetic field is not the same in the tunnel so we cannot use it anyway but we can
use it as a starting point to look for a good one. The objective is to have zero magnetic field in the PES
everywhere, especially in the extraction region. Also outside is important so for that reason we have to
compensate the magnetic field rounding. To compensate that we have Helmholtz coils and the
objective is to find the current that gives us zero magnetic field in the center. Our Magnetometer is
Mag-03MC250 and Power supply including Display Unit Magmeter-2 from the company Bartington.
Settings for this model that measures in the range +/-250 µT must be:
Sensitivity: 4. +/-25 µT/1V
Output type: Unbalanced
DC/AC Coupling: DC
Earth magnetic field ranges from 25 - 65 µT
Figure 5: Magnetometer and test results
8
For understanding the position of coils in Fig. 6 PES was presented from upstream
perspective.
Figure6: PES from upstream perspective
MCP detector results
We also tested MCP detectors by measuring dark counts on all 16 detectors to find out if
everything works properly, are there any problems with the detectors or not. It was a slow ramping the
MCPs up to 2100V and pre-amp, voltage was 15V. In pictures, presented below, you can see the
oscilloscope, which showed signal and screenshot of control software for voltage supplies. The scope
we use is ROHDE&SCHWARZ RTB2002 Digital Oscilloscope 2.5 GSa/s.
Figure 7: Oscilloscope and voltage supply software
9
Introduction to XFEL Control system
Karabo Scenes
For intended higher requirements for volumes and data rates of modern photon science
facilities, such as free electron X-ray lasers, software framework called Karabo was written from
scratch. Karabo is written in C ++, which uses the programming mechanisms for templates and the
boost. By its design, it contains data collection, management, data management and scientific
computing tasks into one homogeneous software framework. It relies on modern programming
language technologies and it has a purpose to provide users and developers intuitive access to data,
hardware and computing resources. Karabo and all its elements are available to the Python
programming language. Karabo runs on Linux operating systems (Ubuntu, Scientific Linux) and under
Mac OS X and is distributed as a software bundle including all necessary dependencies. Karabo is
actually a pluggable, distributed flexible application control system. All Karabo applications have a
standardized interface for self-description, program-flow organization, logging and communication.
Central services exist for user management, data logging, configuration management, access control,
etc. The design provides a very scalable but still maintainable system that at the same time can act as a
fully-fledged control. It permits simple integration and adaption to changing control requirements and
the addition of new scientific analysis algorithms, making them automatically and instantly available
to experimenters. [5]
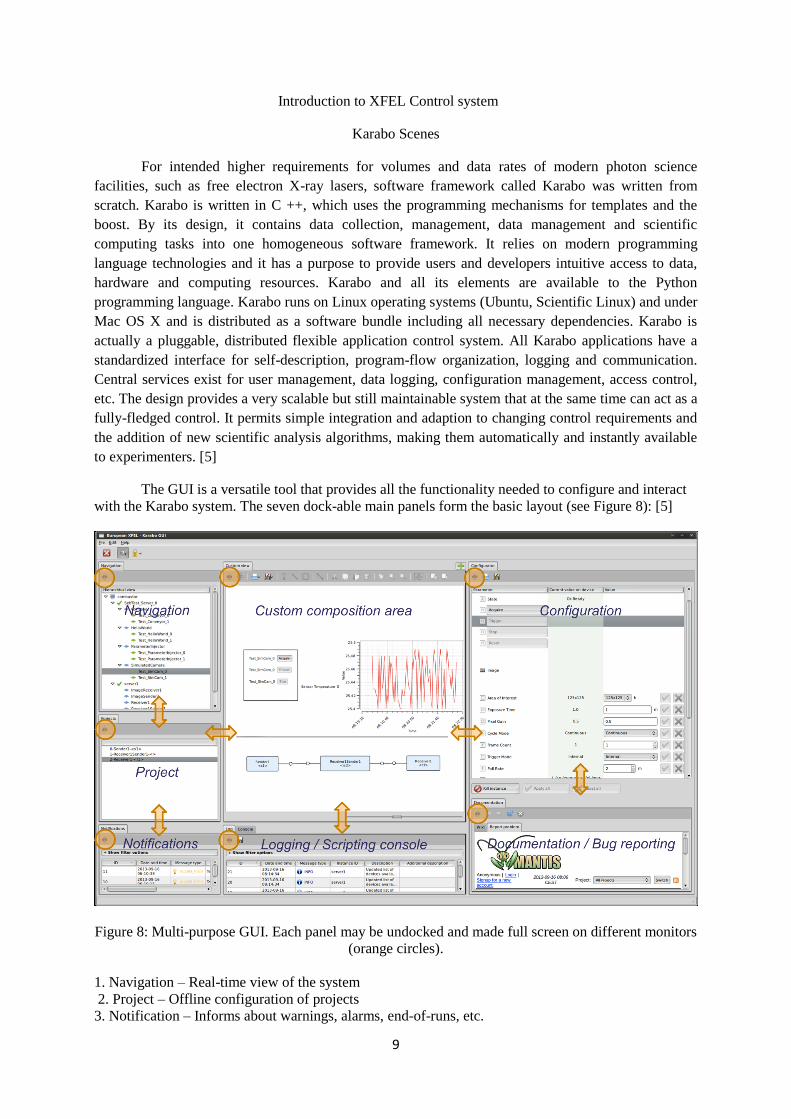
The GUI is a versatile tool that provides all the functionality needed to configure and interact
with the Karabo system. The seven dock-able main panels form the basic layout (see Figure 8): [5]
Figure 8: Multi-purpose GUI. Each panel may be undocked and made full screen on different monitors
(orange circles).
1. Navigation – Real-time view of the system
2. Project – Offline configuration of projects
3. Notification – Informs about warnings, alarms, end-of-runs, etc.
10
4. Custom – PowerPoint like page allowing to build expert panels from a mixture of online and layout
widgets
5. Logging – Accumulated logging information of all currently running devices
6. Configuration – Auto-generated panel giving access to properties/commands of the currently
clicked device
7. Documentation – Integrated internet-browser allowing wiki-page editing for device documentation
and also bug-reporting
Prior to using GUI control interface users must log in with username, password and
authentication provider. This information gets automatically extended with data describing the broker
and the local machine. The authentication service is connected to a central database, which controls
the current access levels for the requesting user from the context of the provided information. The
following properties are taken into account: 1) users role 2) IP address of the user 3) Karabo sub-
system used and 4) current time. The web-service subsequently sends back a global access level and a
list of device instance specific exceptions. Presently, five different access levels are used: observer,
user, operator, expert, and admin. GUIs do not directly communicate with the broker, but connect via
TCP (Transmission Control Protocol) to a GUI-Server device, which forwards the communication to
the broker. This architecture facilitates a server side pre-processing of data reducing each client’s
computing time. During operation, the GUI always keeps track which properties are currently visible,
and passes this information to the GUI server, which then sends only the data that is currently needed,
which greatly reduces the load on the network.
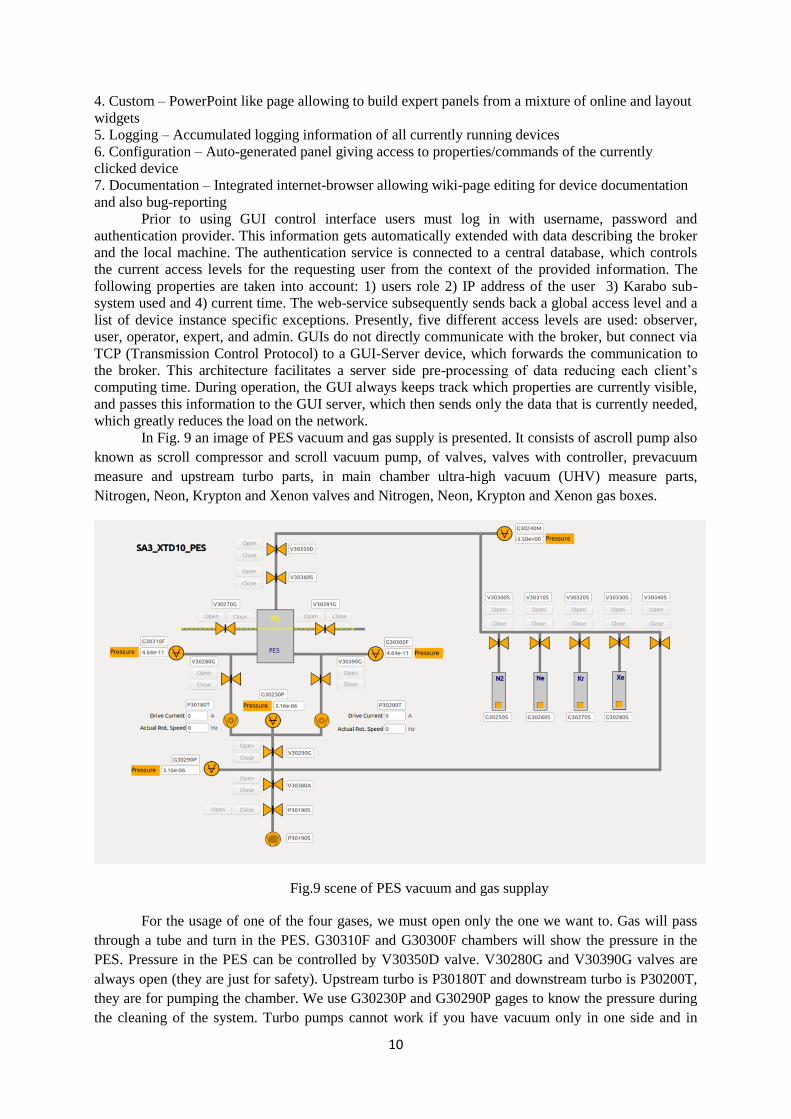
In Fig. 9 an image of PES vacuum and gas supply is presented. It consists of ascroll pump also
known as scroll compressor and scroll vacuum pump, of valves, valves with controller, prevacuum
measure and upstream turbo parts, in main chamber ultra-high vacuum (UHV) measure parts,
Nitrogen, Neon, Krypton and Xenon valves and Nitrogen, Neon, Krypton and Xenon gas boxes.
Fig.9 scene of PES vacuum and gas supplay
For the usage of one of the four gases, we must open only the one we want to. Gas will pass
through a tube and turn in the PES. G30310F and G30300F chambers will show the pressure in the
PES. Pressure in the PES can be controlled by V30350D valve. V30280G and V30390G valves are
always open (they are just for safety). Upstream turbo is P30180T and downstream turbo is P30200T,
they are for pumping the chamber. We use G30230P and G30290P gages to know the pressure during
the cleaning of the system. Turbo pumps cannot work if you have vacuum only in one side and in
11
other side air pressure. Pre vacuum is required that pre vacuum can done by P30190S pre vacuum
scroll. P30190S is a scroll pump, it is used to pump gases. For cleaning the system, we have to close
the valve of gas, which we used. We must close V30290G valve, then we have to open V30340S
valve. It is necessary to know that for cleaning the system, we have to open evacuation line, but it can
only be opened if V30290G is closed. Only one gas line can be open at the same time G30250s or
G30260S or G30270S or G30280S.
Acknowledgement
I would like to express my special thanks of gratitude to my superviser Dr. Joakim Laksman I
am grateful for his patience and support in overcoming numerous obstacles I have been facing through
my research, as well as “DESY Summer Student program 2017” organizators, who gave me the
golden opportunity to do this wonderful project, which also helped me in doing a lot of research and I
came to know about so many new things I am really thankful to them. I would also like to thank the
Photon Diagnostics group who helped me a lot in finalizing this project within the limited time frame.
Also I would like to express my gratitude for Ehsan Wajid from Control & Analysis Software group
for supporting and spending their time during my study of Karabo.
Conclusion
To conclude, we have tested 16 MCP detectors, as a result we can suppose that they basically
work well. As a result, having tested the Helmholtz Coyle for cancelling out stray magnetic fields to
compensate the magnetic field rounding, we have a starting point. For some reason we have a result
only for the x and z components. To do this, it was necessary to impart the following voltage to the
Helmholtz coil components. X left – 0.50 V, X right – 1.45 V, Z us – 0.54 V, Z ds – 0 V. As a result,
having studied the Karabo software framework, we have obtained the images for vacuum and gas
supply.
12
Reference
1- The adaptive gain integrating pixel detector AGIPD a detector for the European XFEL,
B.Henrich, J.Becker, R.Dinapoli, May 2011,
2- Photon Beam Transport and Scientific Instruments at the European XFEL. Thomas
Tschentscher, Christian Bressler, Jan Grünert. June 2017
3- "Online Photoemission Time-of-Flight Spectrometer for X-ray Photon Diagnostics ",
XFEL.EU technical report TR-2012-003.(2012). J. Buck.
4- E. Allaria et.al., “Control of the Polarization of a Vacuum-Ultraviolet, High-Gain, Free-
Electron Laser”, Phys.Rev. X 4, 041040 (2014).
5- KARABO: An integrated software framework combining control, data management, and
scientific computing tasks. B. C. Heisen, D. Boukhelef, S. Esenov, S. Hauf, I. Kozlova, L.
Maia, A. Parenti, J. Szuba, K. Weger, K. Wrona, C. Youngman, European XFEL GmbH,
22761 Hamburg, Germany