Embed Size (px)
Citation preview
EMBLA 2002 An Optical and Ground Survey
in Hessdalen
Massimo Teodorani, Ph.D.
Astrophysicist
CNR – Istituto di Radioastronomia Via Fiorentina – Medicina (BO) – North ITALY E-mail : [email protected] and [email protected]
Gloria Nobili
Physicist
Museum of the Physics Department – Bologna University Bologna – North ITALY
E-mail: [email protected]
Abstract. A two-weeks scientific expedition to Hessdalen, aimed at investigating on field mysterious atmospheric light-phenomena, was carried out in August 2002 by the physics section of an italian team of scientists. Results are presented and discussed. Photometric analysis shows that the light-phenomenon is able to produce a luminous power of up-to 100 kW. A 3-D analysis of photo frames shows that the luminous phenomenon doesn’t resemble canonical plasma features (a sharply gaussian PSF) unless the light phenomenon is caused by one recently discovered natural light-ball of BL type whose light-distribution (PSF) might be able to simulate an uniformly illuminated solid. A comparison of the light-distribution in different time-sequential frames shows that apparent slightly exponential wings of the PSF features are probably due to variations of atmospheric turbulence and transparency and not to intrinsic properties. Maximum phases of luminosity of the radiating surface are demonstrated to be due to the sudden apparition of a cluster of co-existing light-balls at constant temperature, while the inflation of light-balls is ruled out. Spectra show no resolved lines but a three-peaked feature which might be attributed both to some kind of artificial illumination system and to a mixture of many blended lines due to several chemical elements (more possibly: silicon). The results of a lab analysis of ground samples shows that some powder which was collected near a river contains an anomalous iron sphere of micrometric dimensions. A biophysical research-proposal aimed at studying the relation between the EM field produced by the phenomenon and the electrical activity of the human body is also presented. On the basis of this third explorative experience, the importance of having at disposal a sophisticated opto-electronic portable station (missing at present) is stressed for the future.
1. INTRODUCTION In the period 5-18 August 2002 a new italian mission to Hessdalen was carried out. It was the third of a series started in August 2000. This time the scientific expedition consisted of two groups: an engineering group and a physics group. The engineering group was composed of Stelio Montebugnoli, chief of the CNR-IRA radioastronomic station in Medicina (Bologna-Italy) and his assistant Marco Poloni. The physics group was composed by the authors of this paper. The two groups could efficiently collaborate together. The researchers of the engineering group mainly dedicated their efforts to using a pulse-radar (power = 40 watts, frequency = 439.3 MHz), which was projected by them [18], and to preparing new operations for the forthcoming winter to be carried out by engineer Jader Monari [17]. The radar, which permitted to record some transient tracks [19], was permanently installed at the Aspåskjolen spot and was constantly pointed towards south, a position where the Hessdalen light-phenomenon was seen most often during the previous years. The physics group was mainly devoted to five kinds of activities: 1) taking photographs of the light-phenomenon, 2) taking spectra of the light-phenomenon, 3) measuring the radiation field with a Geiger counter in some places, 4) collecting ground-samples which were suspected to be approached by the light-phenomenon, 5) proposing biophysical investigation (see Appendix 1). This paper is an essential description and discussion of the results which came out after the experimental data were post-processed and analyzed. 2. INSTRUMENTATION & SOFTWARE Three cameras mounted on tripod were used: 1) a Praktica BX-20 reflex camera equipped with a 135 mm lens connected with a tele-extender which increased the focal length to 270 mm, used both for imaging and spectroscopy; 2) a Yashica 107 Multiprogram reflex camera equipped with a 35-70 mm zoom lens which was constantly used with a focal length of 70 mm, used for imaging; 3) a Rollei 6x6 Twin Reflex camera equipped with a 35 mm lens, used for panoramic imaging. In the case of the first two cameras a 100 ASA Kodak Ektachrome dia-film was always employed [12], while in the case of the third camera both 50 and 100 ASA dia-films were used. A transmission grating of the Rainbow Optics Spectroscope (ROS) [16] type was directly attached to the lens of the first camera most of the time. The obtained camera+lens+spectroscope configuration permitted to use the ROS, a diffraction holographic grating characterized by 200 lines/mm, at its maximum performance, by obtaining long spectra in the view-field and a good spatial resolution due to the small grain dimensions of the 100 ASA film. Photographs were taken by always using the “B” option (by means of a mechanical wire in the case of the Praktica and Rollei cameras, and an electronic wire in the case of the Yashica camera), both by launching long exposures before the light phenomenon appeared towards a well-known direction, and by taking exposures exactly at the moment in which the light-phenomenon appeared. Spectra were taken, always by using the “B” option, first by aiming at the light-phenomenon and then by moving the camera to a position (to the right) in which the spectrum was visible inside the view-field: these movements were necessarily very fast. The spectrum was previously focused by aiming at streetlights, which were also used as wavelength-calibration lamps. Photographs were post-processed by using sequentially the Adobe Photoshop 5.5 [24] and the Iris [24] softwares. Spectra were post-processed by using sequentially the Adobe Photoshop 5.5, the Iris and the Visual Spec [24] softwares. General plots were subsequently done by using the Microsoft Excel 2000 software. 3. SIGHTINGS & GROUND-SURVEYS Several light-phenomena were recorded in different positions of the Hessdalen valley. Most of them, which were also often photographed, remained unidentified objects and are not included in this report. Only the pictures of a blinking light seen towards south from the Aspåskjolen spot, were confirmed to be due to the “Hessdalen Phenomenon” and therefore were considered for analysis: 15 photos in total of this type of light were taken, of which 6 were used for analysis. The light-
2
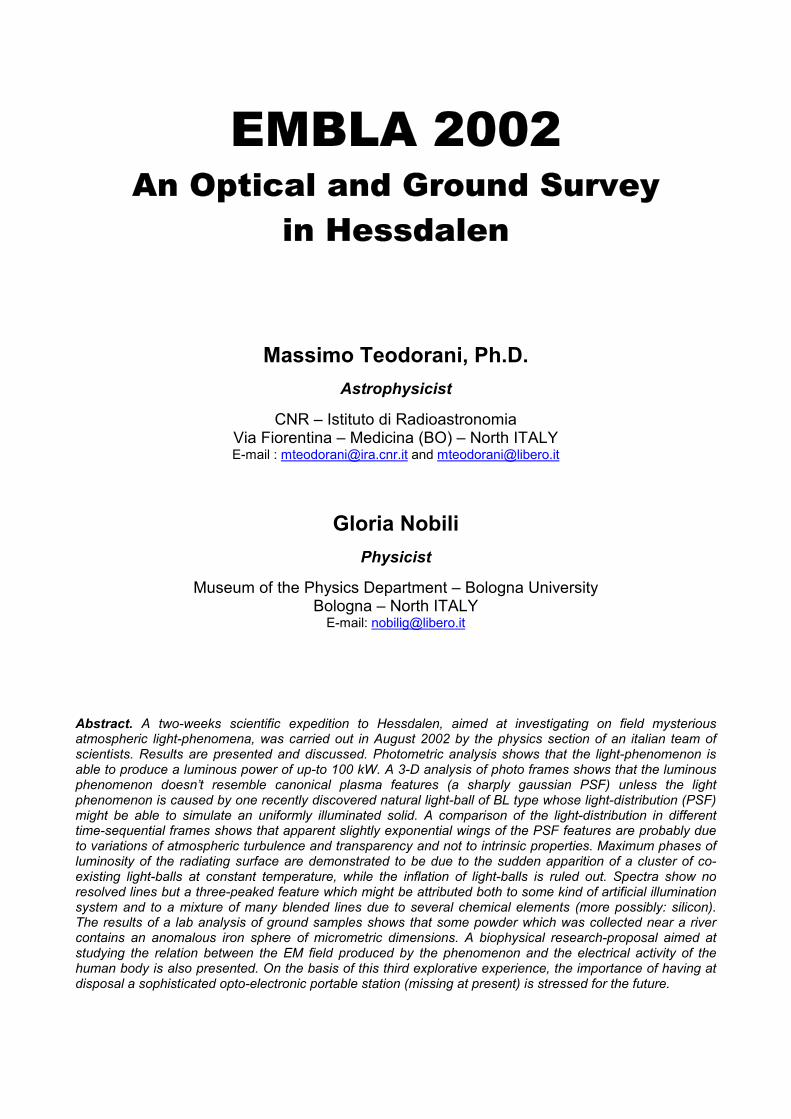
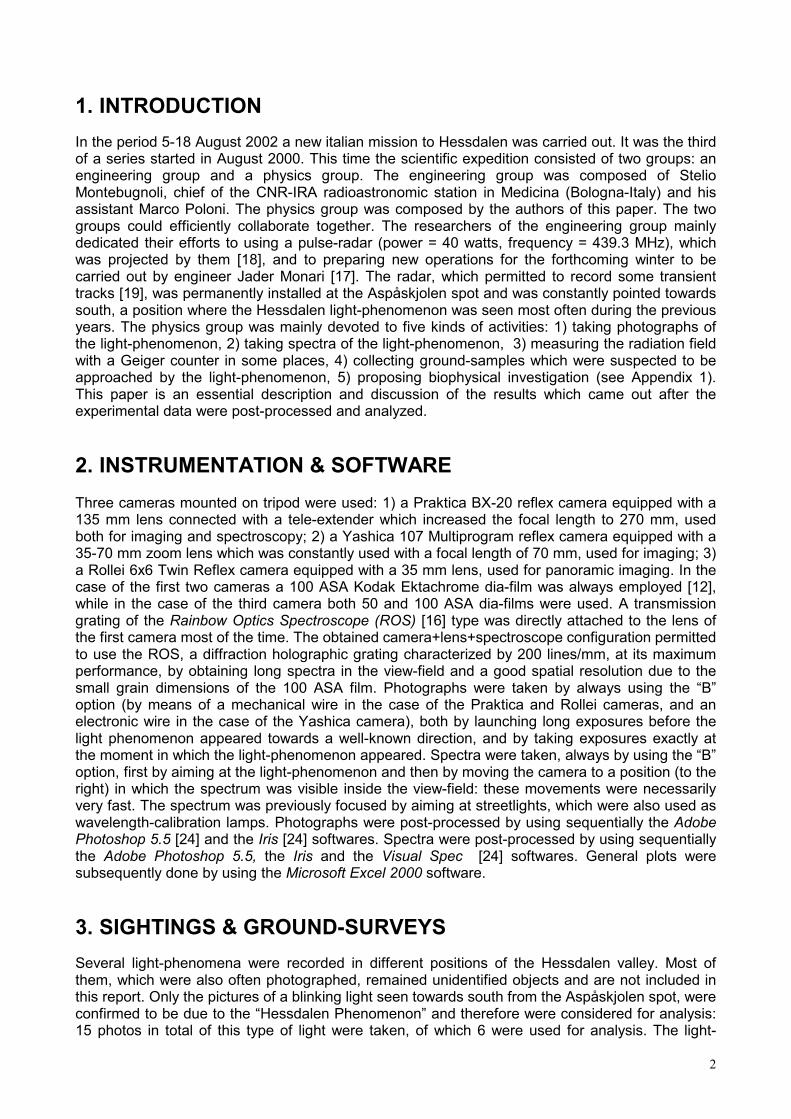
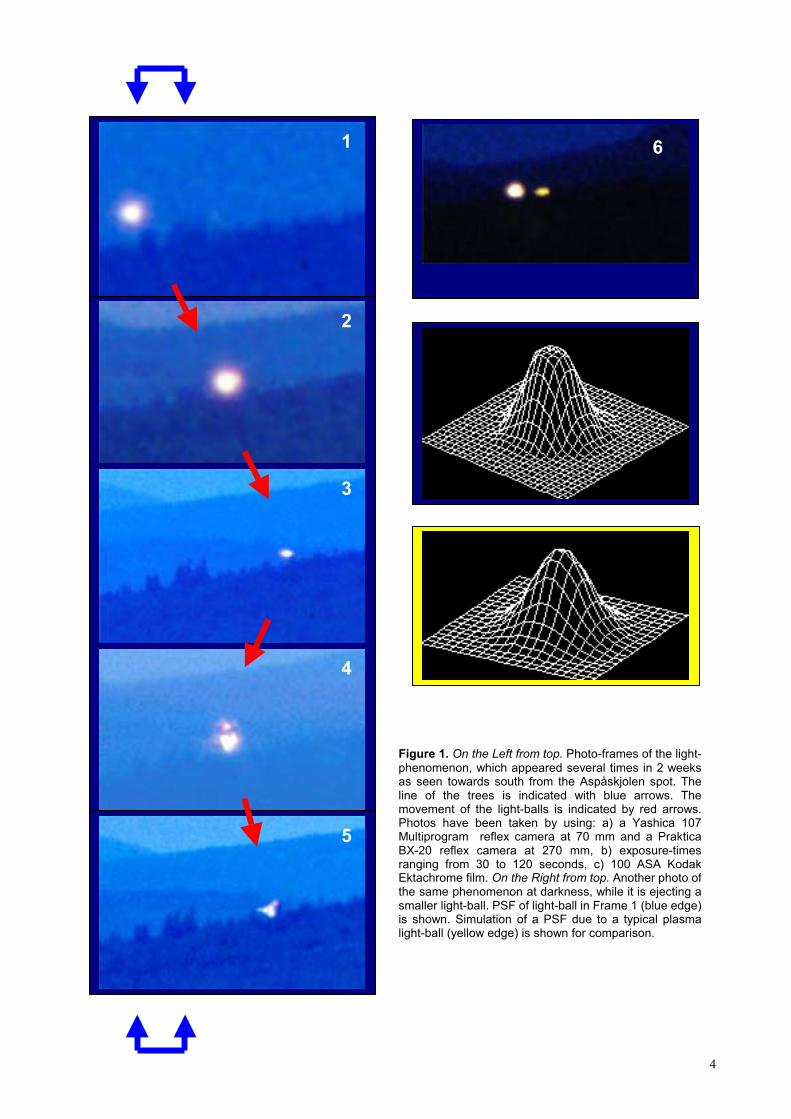
phenomenon at this precise position was seen almost every evening/night, mostly between 10 p.m. and midnight. In almost all cases the light appeared very close to the ground, it blinked very fastly with a pulsation-rate of less than one half second and the entire performance lasted from 1 up-to 30 seconds, most frequently 5 seconds. This behaviour, sometimes, was reported more times during a single night. The processing shows that the light-phenomenon was occasionally seen up to several tenths of meters above the ground. In Figure 1 it is possible to see the phenomenon movements near the trees. Reported movements come from frames taken in different days, just to show that the light-phenomenon was not appearing always in the same exact position: the excursion of the phenomenon movements can be evaluated as about 100 meters orthogonally to the observer. In one case (see Figure 1 – Frame 6) the light-phenomenon showed to eject a smaller light-ball: this behaviour was very well observed and studied in a previous mission too [34]. In another case the light phenomenon is clearly constituted by a cluster of light-balls (see Figure 1 – Frame 5, and Figure 2); this phenomenology may be due to two possible behaviours: a) several stable light-balls which are co-existing together, b) only one light ball which is turning on and off by moving to slightly different positions during the exposure. The light-phenomenon of Figure 2, appears like a triangle seen from far away, and it reminds several similar shapes which were sometimes recorded by the wide-field videocamera of the Automatic Measurement Station in the period 1998-2002 [26]: therefore it can be that explanation a) is more appropriate. Other kinds of light-phenomena were reported and sometimes recorded in the valley. Like last year, sudden “flashes” were seen everywhere in the valley, both in the sky and on the ground. The duration of such flashes was just a fraction of second. Several long exposures were taken in all directions in order to try to get a recording of them on photograph. In one case a photograph could be taken of such a flash (see Figure 3). It was seen from the Aspåskjolen observation spot towards east direction: the distance can be estimated to be few hundreds meters. In three cases, fixed and blinking lights were seen in the sky (between 10 and 45 degrees over horizon). In two cases (an average of 3 witnesses for each) the light, with a magnitude comparable to Jupiter planet, was coming from south towards north probably going up, lasted about 30 seconds, made a big flash and disappeared: the tracks in the sky have been photographed in one case but do not offer sufficient elements to carry out a significant analysis. In another case, a strong blinking double red light was seen while it was going very low in the sky towards south by apparently descending in the direction of Øyungen lake: this light (3 witnesses) was recorded by geophysical researcher Marsha Adams of Time Research (USA) by using her videocamera in IR mode [2]. The date of appearance of the light-phenomena in general, has not been considered a relevant parameter for analysis, as the light phenomenon, which is of no “ufological” relevance, is normally seen almost all the days. Furthermore, by being the parameter “time” reported (in such a case) as a mere eye-witnesses, it is not at all objective from a real statistical point of view in the same way in which video data are acquired all the time in automated mode by the Automatic Measurement Station [26]. In one case, the physics group took ground and powder samples at the edge of a river near Vårhus where a big light-ball was reported in previous months by norwegian witnesses. By using a Geiger counter it was discovered that the powder deposited on some rocks near the river, presented a level of radioactivity slightly higher than the average (normally: 0,004-0,009 mR/h): around 0,020 mR/h at the distance of 30 cm. It is well known that up to a value of 0,050 mR/h natural radioactivity is not considered dangerous. Anyway the recorded value was taken as a criterion in order to choose ground-samples for microscopic and spectroscopic lab-analysis. The results of this analysis are described in Chapter 6.
3
1 6
2
3
Figure 1. On the Left from top. Photo-frames of the light-phenomenon, which appeared several times in 2 weeksas seen towards south from the Aspåskjolen spot. Theline of the trees is indicated with blue arrows. Themovement of the light-balls is indicated by red arrows.Photos have been taken by using: a) a Yashica 107
4
MuBXranEktthesmis sligh
5
4
ltiprogram reflex camera at 70 mm and a Praktica-20 reflex camera at 270 mm, b) exposure-timesging from 30 to 120 seconds, c) 100 ASA Kodakachrome film. On the Right from top. Another photo of same phenomenon at darkness, while it is ejecting aaller light-ball. PSF of light-ball in Frame 1 (blue edge)hown. Simulation of a PSF due to a typical plasmat-ball (yellow edge) is shown for comparison.
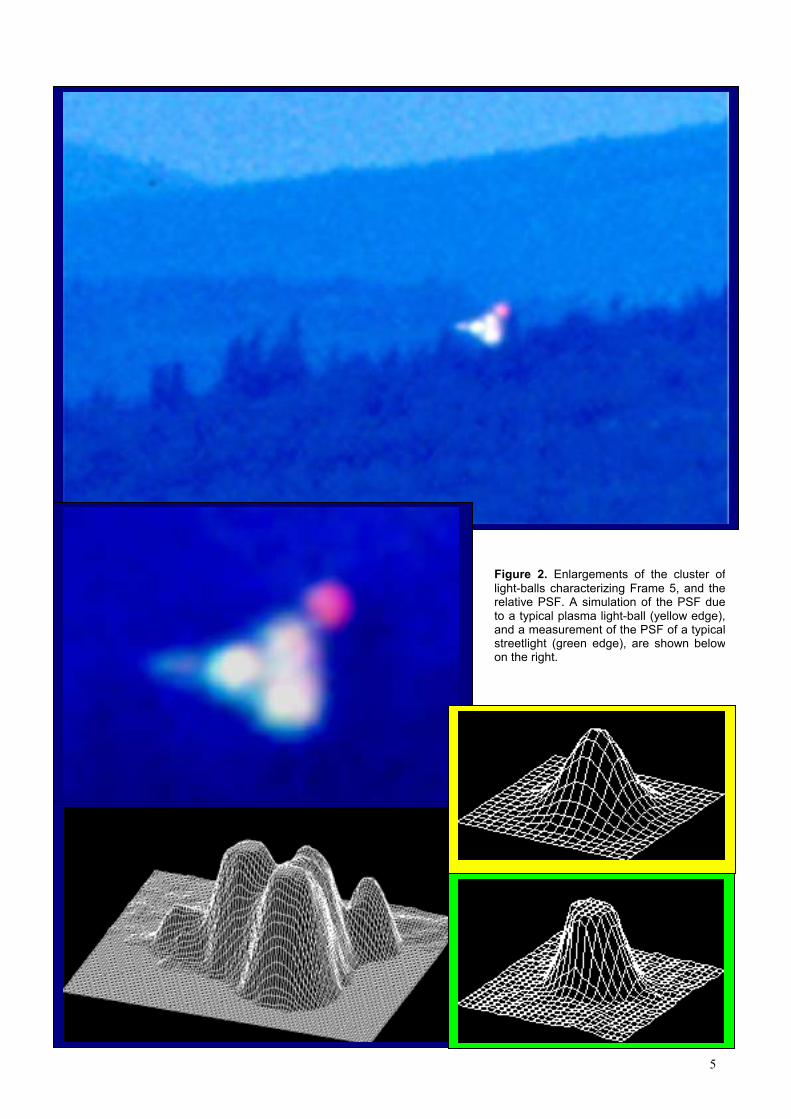
Figure 2. Enlargements of the cluster oflight-balls characterizing Frame 5, and therelative PSF. A simulation of the PSF dueto a typical plasma light-ball (yellow edge),and a measurement of the PSF of a typicalstreetlight (green edge), are shown belowon the right.
5
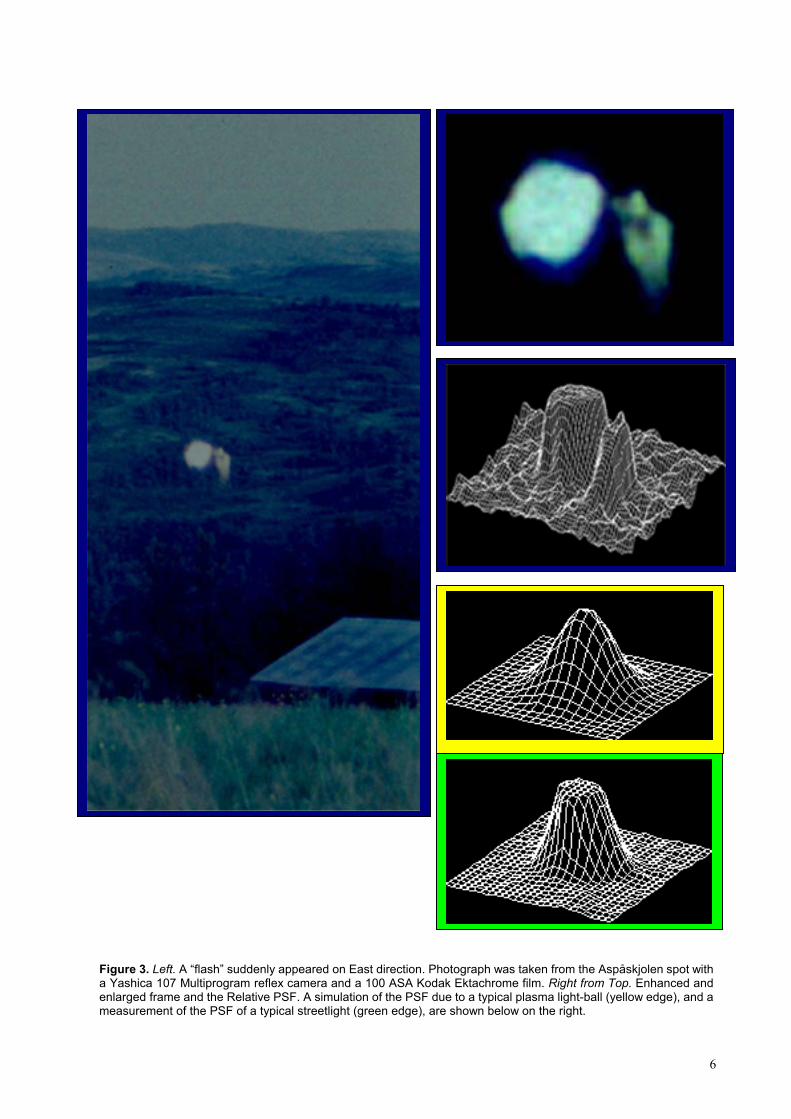
Figure 3. Left. A “flash” suddenly appeared on East direction. Photograph was taken from the Aspåskjolen spot witha Yashica 107 Multiprogram reflex camera and a 100 ASA Kodak Ektachrome film. Right from Top. Enhanced andenlarged frame and the Relative PSF. A simulation of the PSF due to a typical plasma light-ball (yellow edge), and ameasurement of the PSF of a typical streetlight (green edge), are shown below on the right.
6
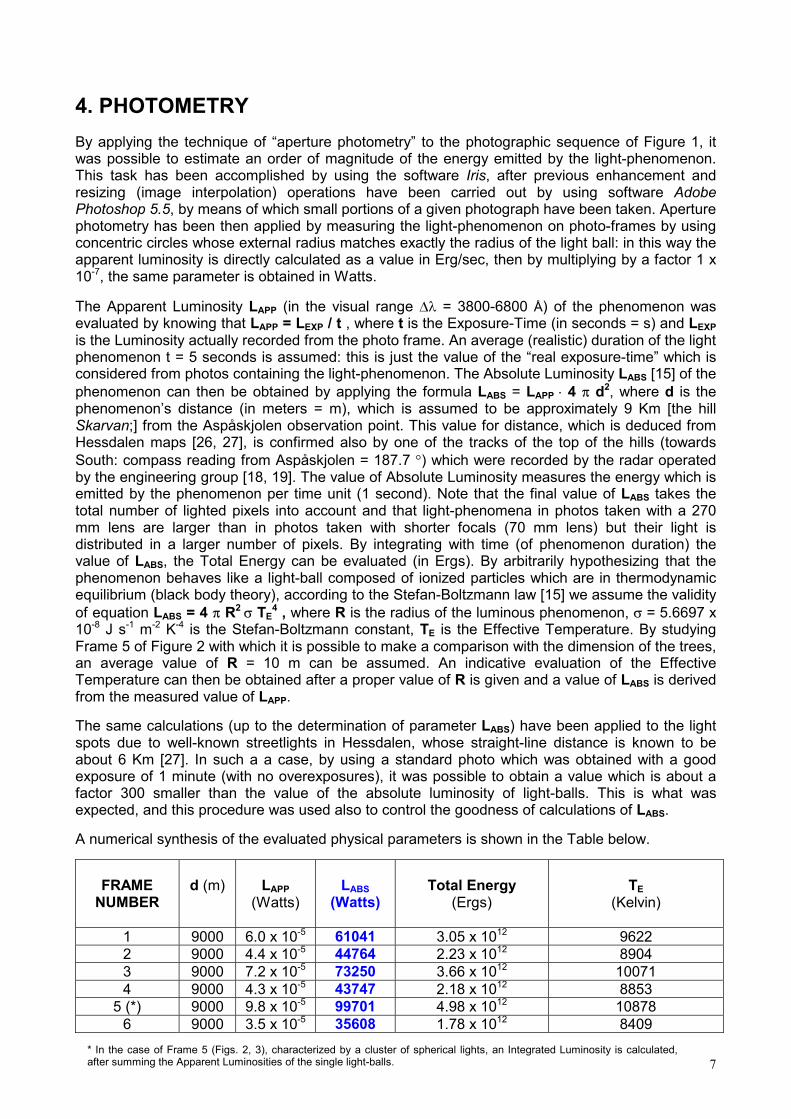
4. PHOTOMETRY By applying the technique of “aperture photometry” to the photographic sequence of Figure 1, it was possible to estimate an order of magnitude of the energy emitted by the light-phenomenon. This task has been accomplished by using the software Iris, after previous enhancement and resizing (image interpolation) operations have been carried out by using software Adobe Photoshop 5.5, by means of which small portions of a given photograph have been taken. Aperture photometry has been then applied by measuring the light-phenomenon on photo-frames by using concentric circles whose external radius matches exactly the radius of the light ball: in this way the apparent luminosity is directly calculated as a value in Erg/sec, then by multiplying by a factor 1 x 10⁻⁷, the same parameter is obtained in Watts. The Apparent Luminosity LAPP (in the visual range �� = 3800-6800 Å) of the phenomenon was evaluated by knowing that LAPP = LEXP / t , where t is the Exposure-Time (in seconds = s) and LEXP is the Luminosity actually recorded from the photo frame. An average (realistic) duration of the light phenomenon t = 5 seconds is assumed: this is just the value of the “real exposure-time” which is considered from photos containing the light-phenomenon. The Absolute Luminosity LABS [15] of the phenomenon can then be obtained by applying the formula LABS = LAPP � 4 � d2, where d is the phenomenon’s distance (in meters = m), which is assumed to be approximately 9 Km [the hill Skarvan;] from the Aspåskjolen observation point. This value for distance, which is deduced from Hessdalen maps [26, 27], is confirmed also by one of the tracks of the top of the hills (towards South: compass reading from Aspåskjolen = 187.7 �) which were recorded by the radar operated by the engineering group [18, 19]. The value of Absolute Luminosity measures the energy which is emitted by the phenomenon per time unit (1 second). Note that the final value of LABS takes the total number of lighted pixels into account and that light-phenomena in photos taken with a 270 mm lens are larger than in photos taken with shorter focals (70 mm lens) but their light is distributed in a larger number of pixels. By integrating with time (of phenomenon duration) the value of LABS, the Total Energy can be evaluated (in Ergs). By arbitrarily hypothesizing that the phenomenon behaves like a light-ball composed of ionized particles which are in thermodynamic equilibrium (black body theory), according to the Stefan-Boltzmann law [15] we assume the validity of equation LABS = 4 � R2
� TE4 , where R is the radius of the luminous phenomenon, � = 5.6697 x
10-8 J s-1 m-2 K-4 is the Stefan-Boltzmann constant, TE is the Effective Temperature. By studying Frame 5 of Figure 2 with which it is possible to make a comparison with the dimension of the trees, an average value of R = 10 m can be assumed. An indicative evaluation of the Effective Temperature can then be obtained after a proper value of R is given and a value of LABS is derived from the measured value of LAPP. The same calculations (up to the determination of parameter LABS) have been applied to the light spots due to well-known streetlights in Hessdalen, whose straight-line distance is known to be about 6 Km [27]. In such a a case, by using a standard photo which was obtained with a good exposure of 1 minute (with no overexposures), it was possible to obtain a value which is about a factor 300 smaller than the value of the absolute luminosity of light-balls. This is what was expected, and this procedure was used also to control the goodness of calculations of LABS. A numerical synthesis of the evaluated physical parameters is shown in the Table below.
FRAME NUMBER
d (m)
LAPP
(Watts)
LABS
(Watts)
Total Energy
(Ergs)
TE
(Kelvin)
1 9000 6.0 x 10⁻⁵ 61041 3.05 x 10¹² 9622 2 9000 4.4 x 10⁻⁵ 44764 2.23 x 10¹² 8904 3 9000 7.2 x 10⁻⁵ 73250 3.66 x 10¹² 10071 4 9000 4.3 x 10⁻⁵ 43747 2.18 x 10¹² 8853
5 (*) 9000 9.8 x 10⁻⁵ 99701 4.98 x 10¹² 10878 6 9000 3.5 x 10⁻⁵ 35608 1.78 x 10¹² 8409
7
* In the case of Frame 5 (Figs. 2, 3), characterized by a cluster of spherical lights, an Integrated Luminosity is calculated,after summing the Apparent Luminosities of the single light-balls.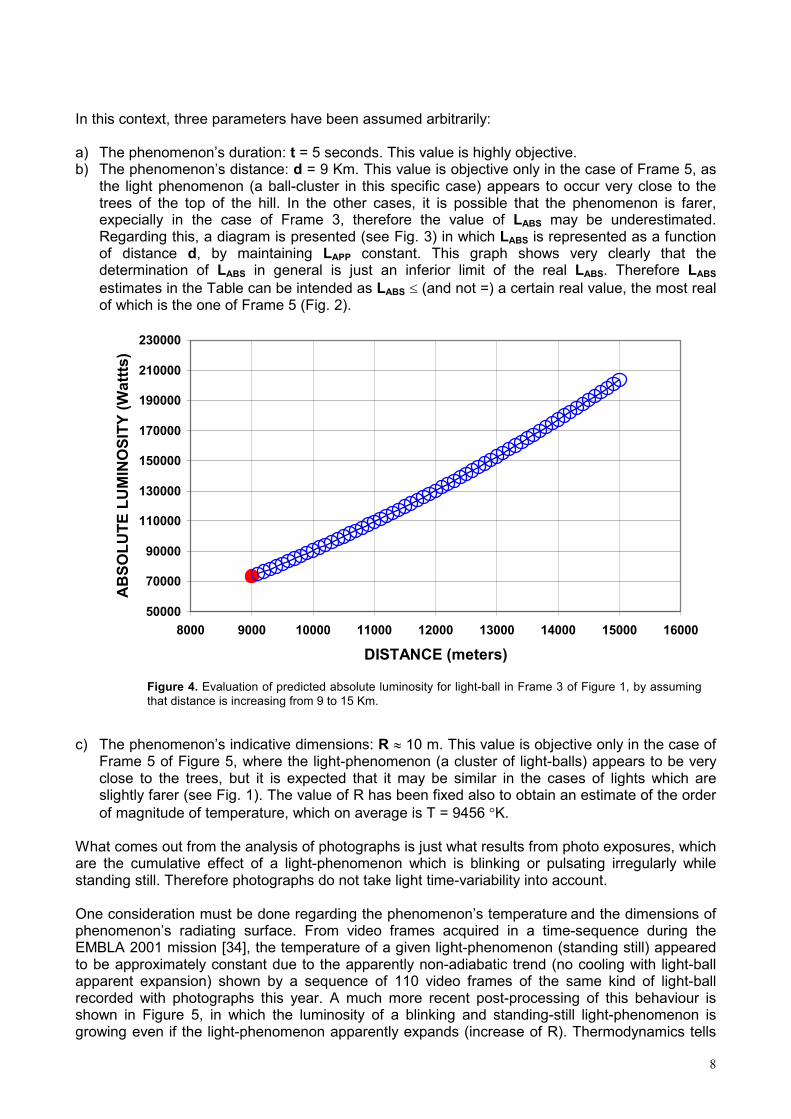
In this context, three parameters have been assumed arbitrarily: a) The phenomenon’s duration: t = 5 seconds. This value is highly objective. b) The phenomenon’s distance: d = 9 Km. This value is objective only in the case of Frame 5, as
the light phenomenon (a ball-cluster in this specific case) appears to occur very close to the trees of the top of the hill. In the other cases, it is possible that the phenomenon is farer, expecially in the case of Frame 3, therefore the value of LABS may be underestimated. Regarding this, a diagram is presented (see Fig. 3) in which LABS is represented as a function of distance d, by maintaining LAPP constant. This graph shows very clearly that the determination of LABS in general is just an inferior limit of the real LABS. Therefore LABS estimates in the Table can be intended as LABS � (and not =) a certain real value, the most real of which is the one of Frame 5 (Fig. 2).
50000
70000
90000
110000
130000
150000
170000
190000
210000
230000
8000 9000 10000 11000 12000 13000 14000 15000 16000
DISTANCE (meters)
AB
SOLU
TE L
UM
INO
SITY
(Wat
tts)
c) The ph
Frameclose slightlyof mag
What comare the custanding s One consphenomenEMBLA 20to be appapparent recorded shown in growing e
Figure 4. Evaluation of predicted absolute luminosity for light-ball in Frame 3 of Figure 1, by assumingthat distance is increasing from 9 to 15 Km.
enomenon’s indicative dimensions: R � 10 m. This value is objective only in the case of 5 of Figure 5, where the light-phenomenon (a cluster of light-balls) appears to be very to the trees, but it is expected that it may be similar in the cases of lights which are farer (see Fig. 1). The value of R has been fixed also to obtain an estimate of the order nitude of temperature, which on average is T = 9456 �K.
es out from the analysis of photographs is just what results from photo exposures, which mulative effect of a light-phenomenon which is blinking or pulsating irregularly while till. Therefore photographs do not take light time-variability into account.
ideration must be done regarding the phenomenon’s temperature and the dimensions of on’s radiating surface. From video frames acquired in a time-sequence during the 01 mission [34], the temperature of a given light-phenomenon (standing still) appeared
roximately constant due to the apparently non-adiabatic trend (no cooling with light-ball expansion) shown by a sequence of 110 video frames of the same kind of light-ball with photographs this year. A much more recent post-processing of this behaviour is Figure 5, in which the luminosity of a blinking and standing-still light-phenomenon is ven if the light-phenomenon apparently expands (increase of R). Thermodynamics tells
8
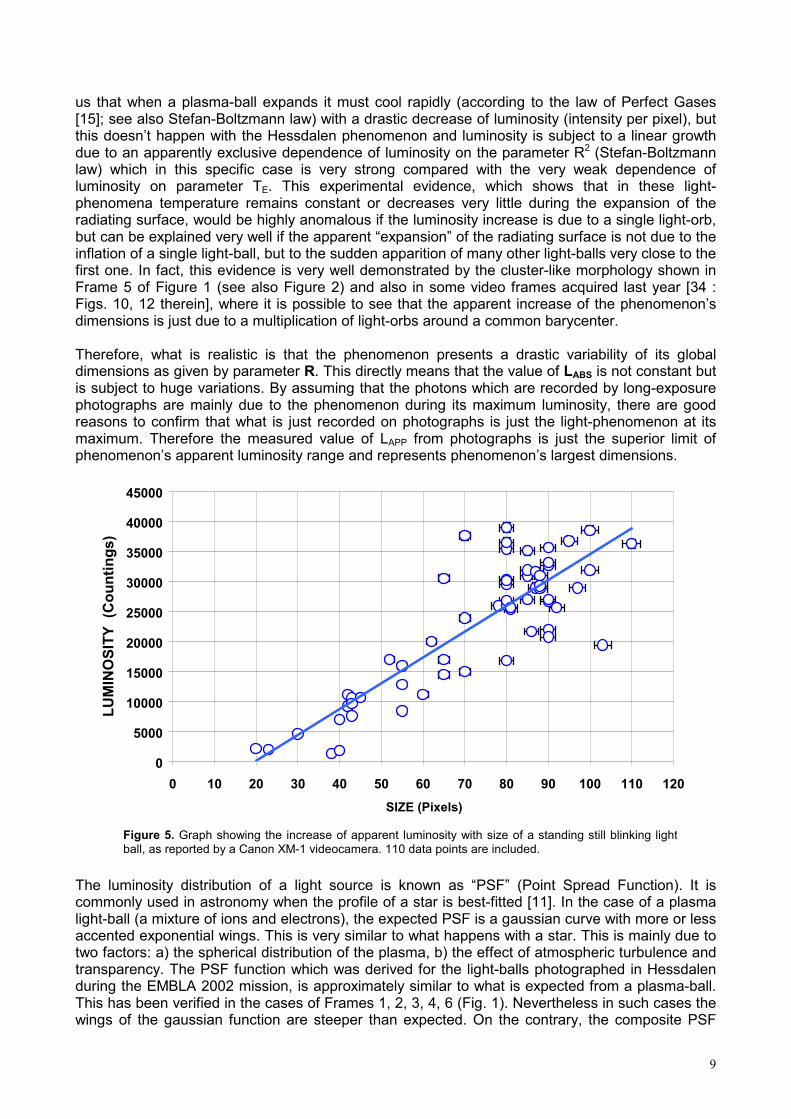
us that when a plasma-ball expands it must cool rapidly (according to the law of Perfect Gases [15]; see also Stefan-Boltzmann law) with a drastic decrease of luminosity (intensity per pixel), but this doesn’t happen with the Hessdalen phenomenon and luminosity is subject to a linear growth due to an apparently exclusive dependence of luminosity on the parameter R2 (Stefan-Boltzmann law) which in this specific case is very strong compared with the very weak dependence of luminosity on parameter TE. This experimental evidence, which shows that in these light-phenomena temperature remains constant or decreases very little during the expansion of the radiating surface, would be highly anomalous if the luminosity increase is due to a single light-orb, but can be explained very well if the apparent “expansion” of the radiating surface is not due to the inflation of a single light-ball, but to the sudden apparition of many other light-balls very close to the first one. In fact, this evidence is very well demonstrated by the cluster-like morphology shown in Frame 5 of Figure 1 (see also Figure 2) and also in some video frames acquired last year [34 : Figs. 10, 12 therein], where it is possible to see that the apparent increase of the phenomenon’s dimensions is just due to a multiplication of light-orbs around a common barycenter. Therefore, what is realistic is that the phenomenon presents a drastic variability of its global dimensions as given by parameter R. This directly means that the value of LABS is not constant but is subject to huge variations. By assuming that the photons which are recorded by long-exposure photographs are mainly due to the phenomenon during its maximum luminosity, there are good reasons to confirm that what is just recorded on photographs is just the light-phenomenon at its maximum. Therefore the measured value of LAPP from photographs is just the superior limit of phenomenon’s apparent luminosity range and represents phenomenon’s largest dimensions.
0
5000
10000
15000
20000
25000
30000
35000
40000
45000
0 10 20 30 40 50 60 70 80 90 100 110 120 SIZE (Pixels)
LUM
INO
SITY
(C
ount
ings
)
The lucommlight-baccenttwo fatranspduringThis hwings
Figure 5. Graph showing the increase of apparent luminosity with size of a standing still blinking lightball, as reported by a Canon XM-1 videocamera. 110 data points are included.
minosity distribution of a light source is known as “PSF” (Point Spread Function). It is only used in astronomy when the profile of a star is best-fitted [11]. In the case of a plasma all (a mixture of ions and electrons), the expected PSF is a gaussian curve with more or less ed exponential wings. This is very similar to what happens with a star. This is mainly due to ctors: a) the spherical distribution of the plasma, b) the effect of atmospheric turbulence and arency. The PSF function which was derived for the light-balls photographed in Hessdalen the EMBLA 2002 mission, is approximately similar to what is expected from a plasma-ball. as been verified in the cases of Frames 1, 2, 3, 4, 6 (Fig. 1). Nevertheless in such cases the of the gaussian function are steeper than expected. On the contrary, the composite PSF
9
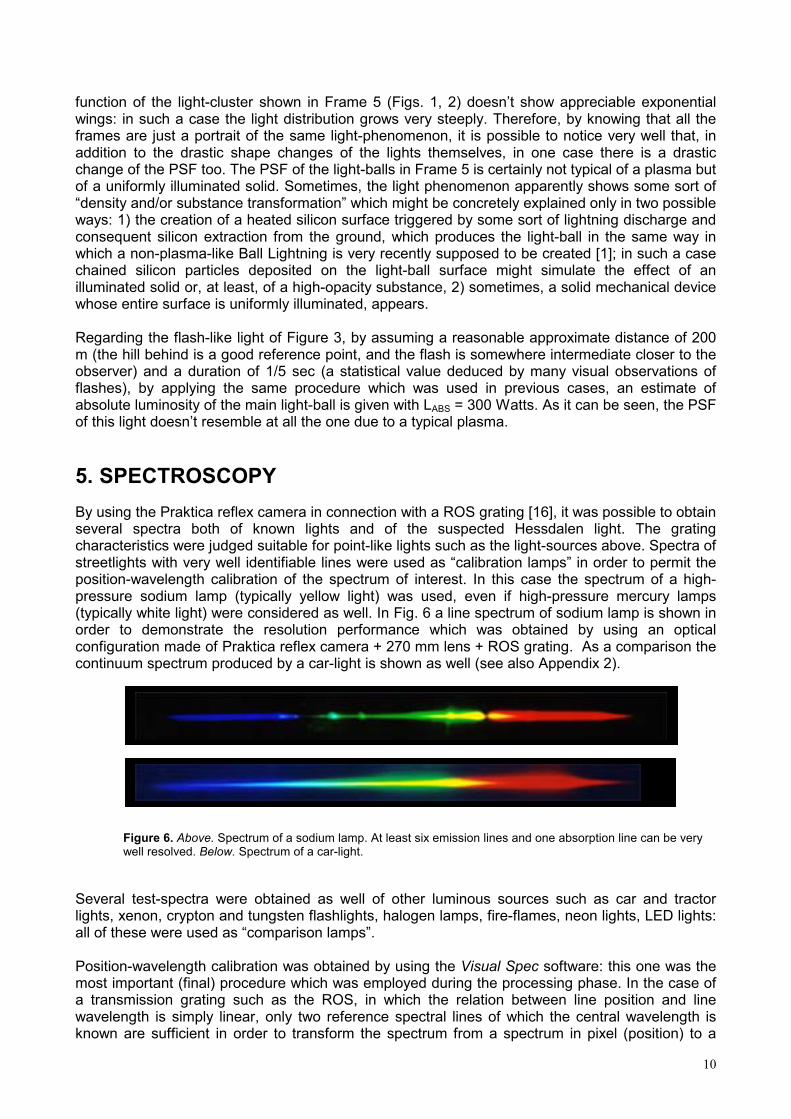
function of the light-cluster shown in Frame 5 (Figs. 1, 2) doesn’t show appreciable exponential wings: in such a case the light distribution grows very steeply. Therefore, by knowing that all the frames are just a portrait of the same light-phenomenon, it is possible to notice very well that, in addition to the drastic shape changes of the lights themselves, in one case there is a drastic change of the PSF too. The PSF of the light-balls in Frame 5 is certainly not typical of a plasma but of a uniformly illuminated solid. Sometimes, the light phenomenon apparently shows some sort of “density and/or substance transformation” which might be concretely explained only in two possible ways: 1) the creation of a heated silicon surface triggered by some sort of lightning discharge and consequent silicon extraction from the ground, which produces the light-ball in the same way in which a non-plasma-like Ball Lightning is very recently supposed to be created [1]; in such a case chained silicon particles deposited on the light-ball surface might simulate the effect of an illuminated solid or, at least, of a high-opacity substance, 2) sometimes, a solid mechanical device whose entire surface is uniformly illuminated, appears. Regarding the flash-like light of Figure 3, by assuming a reasonable approximate distance of 200 m (the hill behind is a good reference point, and the flash is somewhere intermediate closer to the observer) and a duration of 1/5 sec (a statistical value deduced by many visual observations of flashes), by applying the same procedure which was used in previous cases, an estimate of absolute luminosity of the main light-ball is given with LABS = 300 Watts. As it can be seen, the PSF of this light doesn’t resemble at all the one due to a typical plasma. 5. SPECTROSCOPY By using the Praktica reflex camera in connection with a ROS grating [16], it was possible to obtain several spectra both of known lights and of the suspected Hessdalen light. The grating characteristics were judged suitable for point-like lights such as the light-sources above. Spectra of streetlights with very well identifiable lines were used as “calibration lamps” in order to permit the position-wavelength calibration of the spectrum of interest. In this case the spectrum of a high-pressure sodium lamp (typically yellow light) was used, even if high-pressure mercury lamps (typically white light) were considered as well. In Fig. 6 a line spectrum of sodium lamp is shown in order to demonstrate the resolution performance which was obtained by using an optical configuration made of Praktica reflex camera + 270 mm lens + ROS grating. As a comparison the continuum spectrum produced by a car-light is shown as well (see also Appendix 2). F
w Several lights, xeall of the Positionmost ima transmwavelenknown a
igure 6. Above. Spectrum of a sodium lamp. At least six emission lines and one absorption line can be very ell resolved. Below. Spectrum of a car-light.
test-spectra were obtained as well of other luminous sources such as car and tractor non, crypton and tungsten flashlights, halogen lamps, fire-flames, neon lights, LED lights: se were used as “comparison lamps”.
-wavelength calibration was obtained by using the Visual Spec software: this one was the portant (final) procedure which was employed during the processing phase. In the case of
ission grating such as the ROS, in which the relation between line position and line gth is simply linear, only two reference spectral lines of which the central wavelength is re sufficient in order to transform the spectrum from a spectrum in pixel (position) to a
10
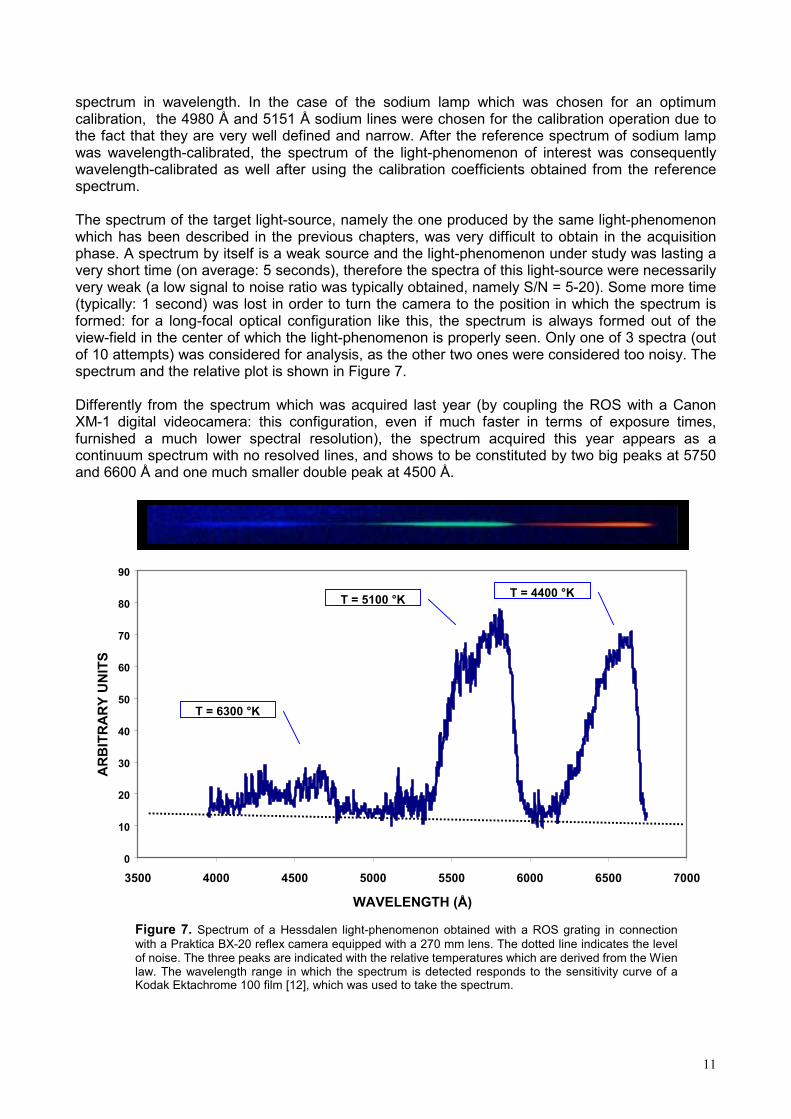
spectrum in wavelength. In the case of the sodium lamp which was chosen for an optimum calibration, the 4980 Å and 5151 Å sodium lines were chosen for the calibration operation due to the fact that they are very well defined and narrow. After the reference spectrum of sodium lamp was wavelength-calibrated, the spectrum of the light-phenomenon of interest was consequently wavelength-calibrated as well after using the calibration coefficients obtained from the reference spectrum. The spectrum of the target light-source, namely the one produced by the same light-phenomenon which has been described in the previous chapters, was very difficult to obtain in the acquisition phase. A spectrum by itself is a weak source and the light-phenomenon under study was lasting a very short time (on average: 5 seconds), therefore the spectra of this light-source were necessarily very weak (a low signal to noise ratio was typically obtained, namely S/N = 5-20). Some more time (typically: 1 second) was lost in order to turn the camera to the position in which the spectrum is formed: for a long-focal optical configuration like this, the spectrum is always formed out of the view-field in the center of which the light-phenomenon is properly seen. Only one of 3 spectra (out of 10 attempts) was considered for analysis, as the other two ones were considered too noisy. The spectrum and the relative plot is shown in Figure 7. Differently from the spectrum which was acquired last year (by coupling the ROS with a Canon XM-1 digital videocamera: this configuration, even if much faster in terms of exposure times, furnished a much lower spectral resolution), the spectrum acquired this year appears as a continuum spectrum with no resolved lines, and shows to be constituted by two big peaks at 5750 and 6600 Å and one much smaller double peak at 4500 Å.
0
10
20
30
40
50
60
70
80
90
350
AR
BIT
RA
RY
UN
ITS
FwolaK
0 4000 4500 5000 5500 6000 6500 7000
WAVELENGTH (Å)
T = 6300 °K
T = 5100 °K T = 4400 °K
igure 7. Spectrum of a Hessdalen light-phenomenon obtained with a ROS grating in connectionith a Praktica BX-20 reflex camera equipped with a 270 mm lens. The dotted line indicates the levelf noise. The three peaks are indicated with the relative temperatures which are derived from the Wienw. The wavelength range in which the spectrum is detected responds to the sensitivity curve of aodak Ektachrome 100 film [12], which was used to take the spectrum.
11
By arbitrarily assuming that the spectrum is due to some kind of ionized and/or excited gas of ions and electrons in thermodynamic equilibrium (blackbody radiator), by applying the Wien law [15] given by �MAXT = 0.29, where �MAX is the wavelength at which a Planck peak occur, and T the corresponding temperature, three values of temperature are obtained: 6300 �K, 5100 �K and 4400 �K. This is only an arbitrary assumption, as the three peaks do not resemble a typical Planck curve, which is normally much broader, but it can be lawfully assumed as a “color temperature”. At a first glimpse, the presence of three different peaks seems to suggest that the light-phenomenon is composed of three different light-sources (the blue one is very weak). By making a comparison with the color temperatures of three different kinds of lamps it might be possible to establish the following similarities [13]: 1) the weak peak at T = 6300 �K is just typical of a fluorescent tube or a Xenon burner, 2) the strong peak at T = 5100 �K may be typical of a white flame carbon arc or a fluorescent illuminator, 3) the second strong peak at T = 4400 �K may approach the color temperature of flashbulbs and/or 'daylight' cool white tubes. The color temperature which is deduced spectroscopically doesn’t match the “effective temperature” which is deduced from photometry. The established qualitative similarities 1-3 do not solve the problem at all, except for making one notice that the recorded spectrum might be due to several composite light-sources, which may be more or less similar to common artificial illumination, but not necessarily the same devices which produce such an illumination from a chemical-physical point of view. This means that any kind of device and/or natural phenomenon able to produce some specific spectrum, must show exactly the same kind of features. But there is also another key of interpretation, which is possibly more realistic. If we assume that the three peaks are due to a blend of many very close emission lines, due to the excitation of some chemical element or several chemical elements together, there are reasons to suspect that the strongest peak at T = 5100 �K (namely at � = 5750 Å) may be well due mostly to Silicon mixed up with Neon [25], even if it is not easy to find its multiplets in the other two peaks. The interpretation of the other two peaks as a blend of lines is much more tentative and uncertain: Oxygen, Nitrogen, Neon, Argon and Sodium cannot be excluded to be present in the weak blue peak, while Calcium and Sodium might mix up with Silicon in the red strong peak. The only way to make a precise line identification, when many lines blend together like in this specific case, is just using very high-resolution spectroscopy [33], but unfortunately this was not allowed by the performances of the ROS grating, whose spectral resolution is at least a factor 100 lower than what is necessary for line identification in this specific case. It is useless to say that in this case, a photographic spectrum like this is just the result of the total light which is recorded of the phenomenon during exposure. Therefore, differently from the case of videocamera-spectroscopy (furnishing sequentially several spectral frames per 1/30 sec, even if with much lower spectral and spatial resolution), in the case of photographic spectroscopy no detailed study of time-variability of a given light-phenomenon is possible. Nevertheless, by knowing that the other two spectra (due to separate light-events, not included here) are, like the best one which is presented here, the integrated result of time-exposure which is directly proportional to the phenomenon’s apparent luminosity as LEXP = LAPP � t , it is concluded that they are weaker than the one of Figure 7 because LEXP has a lower value. This is just due to a lower LAPP and/or to a lower phenomenon’s duration (coinciding with exposure-time t of pulsations): this produces much weaker spectra. In spite of this, it is possible to verify that the two bigger peaks are still well visible and with the same morphology (deduced from the ratio: peak intensity / continuum baseline) and what is interesting is that they occur exactly at the same wavelength as in the case of spectrum in Figure 7. This shows that when the phenomenon’s duration and/or apparent luminosity decrease, its color temperature seems to remain constant.
12
6. GROUND-SAMPLE ANALYSIS Three ground-samples were collected close to a river near Vårhus , where a very close sighting of a light-orb was reported by norwegian people. They consisted of: A. Target Sample. Some grams of powder deposited on a rock which was showing to be slightly
radioactive (0,020 mR/h). B. Control Sample 1. Some grams of powder from a rock with no radioactivity which was about 10
meters far from the first rock. C. Control Sample 2. About 1 Kg of earth which was extracted by means of the “carroting
technique” at about 10 meters from the target sample and at a depth of about 10 cm. The laboratory analysis, which was carried out at the SACMI Imola industry [see Acknowledgements], is described as follows.
Analyst: Dr. Stefano Maretti, SACMI Imola Control Sample 2 has been subject to chemical and mineralogical analysis by using plasma spectrometry and X-ray diffraction. This ground-sample is composed of: Quartz (60%), Albite (15%), Anfibol (Riebeckite and Tremolite: 13%) and of Micae and clay minerals (12%). Target Sample and Control Sample 1 have been subdivided, and any portion subject to morphological analysis and chemical particle analysis by using optical and electronic (SEM) microscopy. Observations obtained by means of an optical microscope have confirmed the mineralogical nature of the ground and proved a strong presence of organic material of both vegetal and animal (Krill) nature. From the point-by-point micro-analysis which was carried out by means of the electronic microscope three reliable results have come out: �� The presence of particles of Zirconium Silicate which might be the main cause of the weak
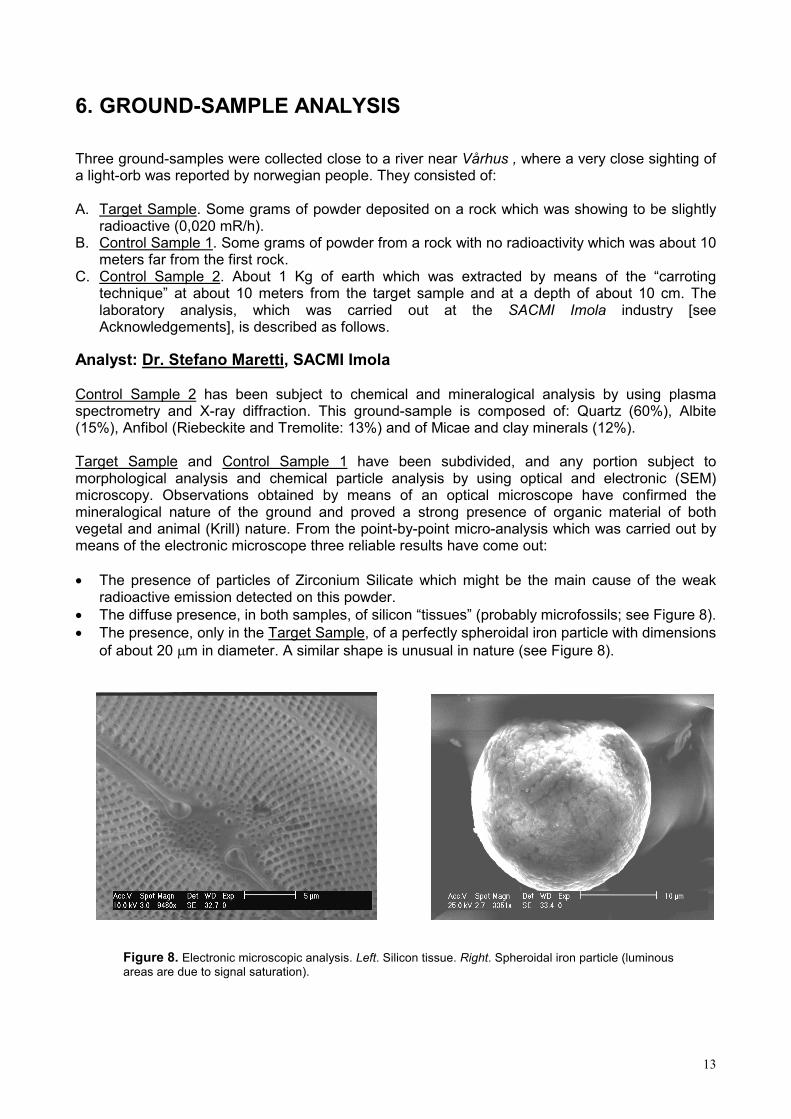
radioactive emission detected on this powder. �� The diffuse presence, in both samples, of silicon “tissues” (probably microfossils; see Figure 8). �� The presence, only in the Target Sample, of a perfectly spheroidal iron particle with dimensions
of about 20 �m in diameter. A similar shape is unusual in nature (see Figure 8).
Figure 8. Electronic microscopic analysis. Left. Silicon tissue. Right. Spheroidal iron particle (luminous areas are due to signal saturation).
13
7. DISCUSSION By comparing the results which came out from our photometry and spectroscopy, several considerations must be pointed out. By taking into account the fact that the phenomenon is highly variable and that in some cases the distance to the observer might be a little underestimated, it can be declared with a good approximation that the light-phenomenon generates a luminous power of the order of 100 kW. This means 1-10 times more than the light which is produced by a typical helicopter searchlight, for instance, the same as a mini electric central and 100 times less than a big electric central. It is also confirmed that the entire Hessdalen valley is characterized by the continuous apparition (both on the ground and in the sky) of small “flashes” with a typical duration of 1/5-1/2 second and whose intrinsic power has been evaluated to be in the range from 10 [10] to 300 Watts. As in the case of the video observations obtained the previous year it is definitively confirmed that the light-phenomenon shows a drastic morphological variation and that this is due to the fact that the light-phenomenon shifts from a single ball-like profile to a multiple ball-like one: this means that suddenly many light-balls start to surround a sort of “seed” which is rapidly growing in time. This behaviour, if seen from far away results in an, often drastic, increase of the luminous surface. Therefore the increase of luminosity is not due to a light-ball expansion but to the creation of a cluster of light-balls, whose integrated surface luminosity (the light-cluster cannot be resolved when seen from far away) increases the parameter R of the Stefan-Boltzmann equation [15]. After verifying that the main spectral peaks do not change position in wavelength and shape (the third one is too week to be seen in faint spectra) in 3 different spectra taken at different times of separate light-events, we have another demonstration of the fact that R, the radius of the light-emitting area, is the only parameter which is responsible of luminosity variations, and not the temperature T. Therefore, the constancy of color temperature is an ascertained fact. How can this happen with a plasma? A plasma light-ball should expand and cool very rapidly: this would shift drastically the color peaks to the longer wavelengths and/or decrease the power of peaks (de-excitation of possible line blends) due to cooling. But if we hypothesize that we are dealing with a “self-confined plasma”, namely a mixture of ions and electrons which is trapped by a strong magnetic field and self-maintaned by a strong central force similar to gravity, it might be assumed that heat loss and transfer outside by electron conduction is avoided (see Appendix 3) and constancy of temperature guaranteed for all the phenomenon’s duration. This is just a work-hypothesis if the “plasma nature” of the main “light bricks” (the light-spheres) of the Hessdalen phenomenon is assumed to be true. On the contrary, if we assume that the light emission-mechanism is not due to a plasma but to an artificial illumination system, the problem caused by the “constancy of temperature” is completely solved by the nature of lamps of general kind. If we look at the PSF of the recorded lights, what comes out is that the light-balls behave only apparently as a plasma - even if the exponential wings of the gaussian profile are much steeper than in the case of a standard plasma-model - almost all the time except for once in which the PSF shows very clearly that sometimes the light-phenomenon behaves like a sort of solid illuminated body. Of course this doesn’t demonstrate that the Hessdalen phenomenon is just characterized by solid self-illuminated devices, it only shows that the optical depth of the illuminated surface may change drastically. The apparently solid nature which is occasionally deduced from a peculiar PSF, may be due only to one kind of natural causes of recent discovery regarding Ball Lightnings (BL). In such a case the formation of a BL would occur in the following sequential way [1]: a) a very strong electric discharge hits the ground (or even a tree, or a building), and the struck object must have a metallic or an oxide component; b) the silicon-oxide which is contained in the soil is vaporized and a vortexed silicon ball-like cloud is formed, c) the vapor is condensed to form silicon nanospheres, which collect together in long strings and burn on the light-ball surface. This kind of BL is not a plasma at all but a sort of electro-heating mechanism of silicon particles, which might simulate an illuminated solid. There are two reasons why this model might match the specific observational features of the Hessdalen light-phenomenon: i) there were no lightning discharges
14
when the light-balls were recorded, but some other type of electric discharge may occur in the valley due to a strong abundance of copper and quartz of which the Hessdalen area is very rich and which can cause piezoelectricity very efficiently [21, 38]; ii) the presence of excited silicon in the spectra is suspected indeed [see chapter 5]. On the other side, the drastic changement of the PSF which is sometimes recorded can be explained in another way, if it is assumed that the Hessdalen light-balls are really solid illuminated bodies of artificial nature. An uniformly illuminated solid, which in the vacuum would produce a very steep PSF, is normally seen through atmospheric air whose turbulence and transparency varies with time, position and altitude. Therefore air turbulence or even fog is able to smooth greatly the PSF at its base and induce the growth of exponential wings in the PSF of an illuminated solid body. Air turbulence is one of the two most important causes of the broad exponential wings which we expect to observe from a plasma-ball which is seen through the filter of our atmosphere: in such a case a plasma-ball, whose PSF is intrinsically a gaussian in the vacuum, when seen inside our atmosphere produces a PSF with even more broadened exponential wings. Therefore it might also be that the Hessdalen lights, in spite of the smoothing effect of atmospheric turbulence, are just illuminated solids, and that their PSF turns into a slightly exponential shape in the wings of the gaussian only due to variations of atmospheric turbulence, transparency and density. This happens normally with the light of the stars (the most typical plasma objects) when they are observed through the atmospheric layers: in such a case the “seeing disk” is as larger as greater the atmospheric turbulence is and this makes so that the exponential wings of the gaussian shape of their PSF are much more broadened. In few words it is possible to say that: a) in the case of stars (typical plasma objects) the shape of their PSF is just intrinsically a gaussian which is broadened even more when the stars are seen through our atmosphere; b) in the case of ball-shaped uniformly illuminated solids the PSF is not intrinsically a gaussian at all but it shows an almost rectilinear profile (steep trend), which may anyway be broadened in a more or less gaussian-exponential shape only when the air-turbolence and density is considerable. In conclusion, with the Hessdalen case and the question of PSF shown by light-balls, there are just two possibilities of interpretation: a silicon electro-heated BL-like light ball (simulating a solid) or an uniformly illuminated solid, but not a plasma in any case. The possibility of a solid nature (namely a sort of illuminated device) is also hypothesized by the characteristics of the spectrum which was obtained this year, from which the evidence of some kind of (not easily identifiable) illumination device can be also suspected, even if noone can exclude that the chemical elements which produce such an illumination (such as silicon and other elements) are a just a “natural feature” of a “plasma” of very exotic type which can be synthetized for unknown reasons by purely natural mechanisms. Genuine plasma characteristics (namely: free ions and electrons) cannot be in principle excluded from a high-temperature solid illuminated body of particular nature which is able to excite and/or ionize the surrounding atmospheric air. In such a case the mark of a plasma would be an additional feature. Atmospheric spectral lines due to nitrogen and oxygen should be expected, and maybe the weak peak at T = 4400 �K is due to them too. Regarding the motion of the Hessdalen light-balls which were observed by us, it can be now ascertained that a track during exposure (except for the case of a strange light in the sky) is rarely recorded. The light-balls turn on at one point, turn off, and turn on at another point, by appearing like “flashes of a higher class”. This is very well seen in the photographs which were always taken by using a fixed tripod. What is the exact reason of the finding of an iron microsphere in the analyzed ground samples? These ones are not known to be spontaneously created in usual natural physico-chemical processes unless some kind of BL-like phenomenon is able to produce them in the same way in which silicon nanospheres are produced after an electrically-induced “extraction process” from the ground is activated [1]. Also iron is a very abundant element in the Hessdalen underground indeed. Nevertheless, a micrometeoritic component in the soil cannot be excluded.
15
Is this kind of light-phenomenon a very sophisticated joke or experiment which is carried out by someone who is very terrestrial in order to make maybe a sort of “social reaction test”? Surely the preparation of such a fake must be extremely expensive. Nevertheless, in theory it is possible indeed to reproduce almost exactly the lights which are seen by simply aiming a strong (1-10 kW type) searchlight at a parabolic reflecting surface which is facing exactly the observer (Aspåskjolen, in our case), and then by increasing the opening angle of the searchlight beam in order to simulate an inflating light-ball. The shift from a single light-ball mode to a multiple light-ball one, could be obtained by using hollows on the parabolic reflecting surface and then by changing simultaneously the opening angle and the direction of the light-beam. The invisibility of the reflecting surface might be obtained by using a semi-transparent glass material. The movements of the light-balls could be obtained by moving the reflecting surface along a 100-m long narrow wire or so, and the (observed) short ascensions to the sky could be obtained by quickly lifting the reflecting surface by using a telescopic tube which is 100 m high or so. In few words: it is not easy to make such a monumental fake, unless some annoyed billionary had decided to pass his free time in an alternative way. But the only way in which the recorded lights could be artificially created is just this one or something very similar. In few words: the creation of such a joke is simply nonsensic. But who has money and time could try to make such a simulation: it might be very useful. Is the SETV hypothesis a well-founded hypothesis regarding the specific Hessdalen lights? SETV is very well scientifically founded as a concept in general [3, 22, 28, 30, 31, 35, 36]. But, during the observational campaign of summer 2002 as well as during the ones in 2000 and 2001, light-orbs were seen almost every night but in no case any deliberate “intelligent behaviour” was recorded in real time. Nevertheless some strange flying devices with an apparently normal rectilinear movement were seen in the sky indeed, whose main anomaly was due to light-colors which are totally out of the FAA rules for airplanes [4, 5]: in one case only white lights were observed and then the flying target suddenly disappeared just after a flash, in another case the lights were only blinking double red lights [2]. Is this a sort of scarcely succeeded mimicry? In several other cases some kind of small-size and low-luminosity light-phenomenon approached the observer (at least 5 ascertained cases in 3 years [29, 34], 1 of which visual, 1 of which visual and photographic, 3 of which only photographic). Should be this behaviour considered as a “silent attempt” of approach or a pure chance? This will never be ascertained from the data which are available so far. Whatever these things are, if some “alien intelligence” is behind the Hessdalen phenomenon, that hypothetical intelligence has shown no interest in searching a direct, continuative and structurally evolved communication with mankind and went on behaving in such a way that the light-phenomenon itself appears to be totally elusive. Is such an hypothetical intelligence worth trusting? If this is the real case the answer, so far, is only one: No. If the evolution of intelligence in this material universe has the only goal of being driven towards pragmatic necessities (such as survivability, and consequent predation) and not noble finalities, there is no wonder if someone is not interested in communicating with us except of controlling our actions without anyone of us realizes in real time. In such a case the only intelligent manifestations which must be expected by such a typology are just deception and mimicry. Therefore by now, the problem remains open. Whatever regards “Ufo subjects” is not only an extremely risky path for physical scientists (it is just annoying in most cases), but also a source of so ambiguous and uncertain data that none of them can be treated with the scientific method in an appropriate way. The problems with ufology can be studied scientifically (by aseptically looking at them from up) only by using a detached and episthemological method, by treating this subject from the “mythopoietic” point of view. This has already been done successfully [7]. On the other side, the concrete and scientific possibility of “alien visitation”, which is founded on a lot of statistical calculations on interstellar migration which introduce a new term in the Drake’s formula [20], can only be treated with methods which are anthitetic to the ones of classical ufology: this is just the SETV project [28]. This initiative, in spite of some controversy which is going on a little nowadays [37], is just a part of SETI, and SETI belongs to official physical sciences. The possibility that Earth is being visited is not so remote as the possibility that mankind is deliberately contacted by another intelligence which is currently here. But the SETV initiative has the potential means and the appropriate research projects to make an
16
attempt of unmasking this intelligence if it is here, and has the means as well to unmask any kind of attempt of prosaic humans to construct fakes, and, conversely, to unmask fakes by allegedly “mimicring aliens”. Parallely, recent and/or future theories on the formation of Ball Lightning [1, 6, 38] and similar light-phenomena such as “Earthligts” might be able to explain as a natural phenomenon what apparently is not. Which one is the right theory, natural or artificial, will depend on the willingness to construct an interdisciplinary and open collaboration between SETV scientists and physicists of the proper expecialization. In particular the natural possibility of “silicon-triggered lights” and their strict connection between the Ball Lightning phenomenon and ground piezoelectricty, must be carefully investigated, also with deep geophysical surveys in the valley. 8. CONCLUSIONS From the experience which was obtained during the three EMBLA missions which were preceded by a massive analysis of the data acquired by the norwegian AMS in 1998-02 [29, 32] and by the 40-days norwegian campaign in 1984 [9, 26], the following certainties on the light-phenomenon can be well fixed: �� Its luminosity is time-variable with a 1-sec rate or less [34], and it is able to produce a power of
the order of 100 kW in the maximum phases. In most cases (semi-regular) pulsations are terminated in only a single cycle (average duration: 5 seconds), in other cases many cycles are continued for a period as long as half an hour or more.
�� It is able to increase luminosity in a drastic way due to a “photometrically multiplicative effect” caused by many light-spheroids (some of which may be ejected from a central body) surrounding an initial “light-seed”. In such a case luminosity increases because of an increase of a total illuminated surface formed by a cluster of light-spheroids [34].
�� It brights by apparently maintaining a constant (color) temperature and following a “lamp-like mode” (turn on and off) [34].
�� It shows a light-distribution which is very different (steep PSF) from the one expected from a standard plasma (broad PSF), but which resembles the one of an uniformly illuminated solid seen through a level of air turbulence and transparency of variable character. Therefore it can be explained as a natural phenomenon of the BL-type only if light-balls are electro-heated formations due to burning silicon triggered by strong electric discharge [1].
�� It turns on and off in different positions, by showing a jerkily motion in general along very short distances (� 100 m) and around a given barycenter. The motion from a point to another one is almost instantaneous. It appears very often some tens of meters over the top of the hills.
�� When it is seen turned on for several seconds, it is always accompanied, preceded and followed by very short-lasting (a fraction of second) flashes of light which appear everywhere in the valley and which emit a power ranging from 10 to 300 W, some of which are photographed at a very brief distance from the observer (up to 5 m) [10, 34].
�� It occurs mostly at night, more often in the winter season and with a peak around midnight [26, 29, 32].
�� It doesn’t show preferential trajectories, but it is distributed everywhere in the sky and on the ground [26, 29], being characterized mostly by white color and sometimes by red color [26].
�� It shows a very strong IR track (from a non-recording Night Vision System) also when it is very faint in the optical range or invisible [34].
�� It is often accompanied by a magnetic perturbation of pulsating type (few Hz) and by small and very short-duration pulsating “spikes” in the HF and VLF radio ranges [8, 29], sometimes by showing doppler features (VLF) [29].
�� It often shows strong radar tracks also when it is not visible or faint [19, 26]. In some case in which it is visible, it shows no radar track.
17
�� In most cases (at high level of luminosity) if seen from far away it has the appearance of a glowing light-ball with no structure, in few cases (at low level of luminosity) it explicitly shows visually some kind of geometric structure [26, 29, 34].
�� The, once suspected [23, 32], “solar origin” of the Hessdalen phenomenon has been recently rejected [see Appendix 4] after analyzing statistically the optical data coming from the AMS station.
In spite of these results, this light phenomenon shows to be highly elusive and its behaviour most often unpredictable. The measurement instruments which were used so far to study this phenomenon are at least 2 orders of magnitude less sophisticated than the ones which should be really needed in order to obtain strong and definitive results. Very detailed projects of sophisticated instrumentation of the opto-electronic type [29, 30, 33] and extensive research proposals, have been prepared and updated since 7 years indeed, but the money-funds (at least 1 million Euro, comparable to an astronomical observing station of medium size) which are absolutely necessary in order to make significant steps in this research go on lacking. The experience which was acquired in this study on the field demonstrates once for all that there is no sensible reason to continue this research if an appropriate and complete Mobile Monitoring Station (MMS) will not be finally available. All what can be done in further phases by using the usual ridiculous budget can be useful only to expand with little steps a work which maintains a “preliminary character” while the ratio given by “results / human effort” remains inexorably low (namely: the exact nature of the phenomenon is not known yet). Nevertheless, we think that the large mess of preliminary observational data which have been obtained so far (even if by means of generally low-sophistication instruments) are able to justify exactly the request of such a money fund. On the basis of the acquired experience, it is now impossible to make without a military-like technology consisting in this specific case of a totally automated radar-guided and laser-telemetric sensor platform (TV monitor, very high-resolution multifilter CCD camera, high-resolution spectrograph, multifilter photon-counting photometer, IRST detector, microwave parabolic antenna and spectrometer, Lidar, polarimeter, electrostatic detector) strictly used in connection with a portable VLF-ULF antenna & spectrometer, and a portable atmospheric station which registers moment by moment all relevant parameters. Off-the-shelf instrumentation is objectively judged as insufficient. Our efforts so far demonstrate that this research requests for the highest level of sophistication and alert-readiness. And the automation of the requested instrumentation is a prerequisite which doesn’t substitute the presence of personnel on the field, but which supports some personnel which is constantly present in the various spots which are chosen for monitoring operations and in the areas in which the phenomenon is known to occur in a recurrent way. A collaboration between physical scientists, geophysicists and engineers might be very useful for several reasons
18

Acknowledgements The authors of this paper are deeply indebted with the following societies, persons and groups: 1. Director Eng. Giulio Cicognani and Dr. Andrea Bresciani of the SACMI Imola industry, for
strongly supporting the scientific importance of our mission to Norway, for supplying all the necessary money funds for travel which were necessary to carry out this expedition, and for the laboratory equipment which was devoted to the spectrometric and microscopic analysis of ground samples. Analyst Dr. Stefano Maretti for carrying out a very accurate lab analysis of ground samples.
2. A
Ear
3. W
i4. U
a5. M
h6. U
aCw
ssistant Professors Erling P. Strand and Bjørn Gitle Hauge of the Østfold College of ngineering, for the noticeable hospitality and friendship in Hessdalen, and for inviting us to the nnual joint Italian-Norwegian Workshop 2002, and for providing important informations egarding the distance and locations of light-phenomena.
http://www.sacmi.com/
http://hessdalen.hiof.no/ http://www.sciencecamp.no/ http://hessdalen.hiof.no/news/Workshop-20020810.shtml
riter and journalist Peder Skogaas for his exquisite hospitality and for important and nice nitiatives in Hessdalen. S researcher Marsha Adams of Time Research for the several fruitful scientific discussions nd idea exchanges in Hessdalen and for sending us her video frames for analysis. r. Renzo Cabassi of the Italian Committee for Project Hessdalen (ICPH, ttp://www.itacomm.net/PH/ ) for lending us the ROS (Rainbow Optics Spectroscope) grating. S scientific journalist Linda Moulton Howe of Earthfiles (http://www.earthfiles.com/ ) for giving strong moral support to our research and for making it known in USA. Irish TV documentarist olum Stapleton, the Norwegian National TV and the Hessdalen TV for having emphasized our ork in Hessdalen.
19
REFERENCES [1] Abrahamson, J. & Dinniss, J., Ball lightning caused by oxidation of nanoparticle networks from normal lightning
strikes on soil, Nature, 403, 519 (2000). / News at: http://news.bbc.co.uk/1/hi/sci/tech/628709.stm
[2] Adams M., Paper in preparation on her measurements in Hessdalen in summer 2002.
[3] Ansbro E. & Overhauser C. (2001) SETV: Opportunity for european initiative in the search for extraterrestrial intelligence, Conf. Proc. on “First European Workshop on Exo/Astrobiology”, 21-23 May 2001, ESRIN, Frascati (Rome), Italy, ESA SP-496, pp. 285-288.
[4] Cornet B., The Transformation, http://www.monmouth.com/~bcornet/transfor.htm
[5] FAA Regulations, http://www1.airweb.faa.gov/Regulatory_and_Guidance_Library/rgFAR.nsf/MainFrame?OpenFrameSet
http://www1.airweb.faa.gov/Regulatory_and_Guidance_Library/rgFAR.nsf/0/2B07C1D97CA06C1A85256613006E104C?OpenDocument&Highlight=lights
[6] Fryberger D. (1997), A Model for Ball Lightning, ØIH Rapport, n. 5, Høgskolen i Østfold (Norway), pp. 1-82.
[7] Genovese S. (2001), UFO: Complessità ed Anomalie di un Mito (UFO: Complexities and Anomalies of a Myth), Edizioni Segno.
[8] Gori F. (2001), Hessdalen EMBLA 2001: VLF Radio Report and some further proposals for the next Missions, CIPH, Articoli, http://www.itacomm.net/PH/
[9] Hauge B. G., Project EMBLA, Proceedings of the “International Conference on Engineering Education”, August 6-10, 2001, Oslo, Norway, 8D7-6. / Also in: : http://fie.engrng.pitt.edu/icee/papers/297.pdf
[10] Hauge B., Private Communication (photograph taken in Summer 2002 at “Science Camp”), August 2002.
[11] Introduction to Imaging, http://www.astro.ubc.ca/courses/astr405/imaging_lab_proc.html#psf
[12] Kodak Ektachrome 100 Professional Film, http://www.kodak.com/global/en/professional/support/techPubs/e27/e27.shtml
[13] Illuminations Systems and Lamps of various types
http://www.stockeryale.com/illumination/fluorescents/faqs.htm#various
http://cybaea.com/photo/color-correction.html
http://www.highend.com/news/colortemp.html
http://www.photo.net/photo/edscott/cf000030.htm
[14] Jarvis J., Orbwatch, http://www.orbwatch.com/
[15] Lang K. R. (1998), Astrophysical Formulae: A Compendium for the Physicist and Astrophysicist, 3rd ed., New York: Springer Verlag.
[16] Malpas B., Rainbow Optics Star Spectroscope – A Review, http://users.erols.com/njastro/barry/bar-page/starspec.htm
[17] Monari J., Montebugnoli S., Poloni M., Teodorani M., Righini S. (2002), ICPH Articles, Internet publication on the web site: http://www.itacomm.net/PH/ .
[18] Montebugnoli S., Cattani A., Bortolotti C., Fiocchi F., Liberati F., Monari J., Maccaferri A., Mariotti S., Orlati A., Perini F., Righini S., Poloni M., Roma M., Scalambra A., Teodorani M., Tittarelli F., Cevolani G., Bortolotti G., Pupillo G., Trivellone G., Hauge B. G., Strand E.P. (2002), Low power pulsed radar for induced atmospheric phenomena investigation, CNR Technical Report, IRA 321/02.
[19] Montebugnoli S., Righini S., Analysis of radar data from Hessdalen, In preparation.
[20] Newman W. I. & Sagan C. (1981), Galactic Civilizations: Population Dynamics and Interstellar Diffusion, Icarus, 46, p. 293.
20
[21] Persinger M. A., The Tectonic Strain Theory as an Explanation of UFO, http://laurentian.ca/NEUROSCI/TECTONIC.HTM
[22] SETV (A Scientific Search for Extraterrestrial Visitation), http://www.setv.org/
[23] SIDC, Sunspot Data, http://sidc.oma.be/index.php3
[24] Software used for this research:
Adobe Photoshop 5.5 : http://acomp.stanford.edu/acpubs/Docs/ps55tutorial/
Iris : http://www.astrosurf.com/buil/us/iris/iris.htm
Visual Spec : http://valerie.desnoux.free.fr/vspec/
[25] Spectra of Gas Discharges , http://home.achilles.net/~jtalbot/data/elements/
[26] Strand E. P, Project Hessdalen, http://hessdalen.hiof.no .
[27] Strand E. P., Private Communication, 19 September 2002.
[28] Stride S. L. (2001), An Instrument-Based Method to Search for Extraterrestrial Interstellar Robotic Probes, JBIS, 54, No. 1/2, p. 2.
[29] Teodorani, S. Montebugnoli, J. Monari (2000), The Embla 2000 Mission in Hessdalen, NIDS (National Institute for Discovery Science), http://www.nidsci.org . (Specifically see: http://198.63.56.18/pdf/hessdalen.pdf ).
[30] Teodorani M. (2000), Physical data acquisition and analysis of possible flying extraterrestrial probes by using opto-electronic devices, Extraterrestrial Physics Review, Vol. 1, No. 3, pp. 32-37.
[31] Teodorani M. (2001), Instrumented Search for Exogenous Robotic Probes on Earth, Conf. Proc. on “First European Workshop on Exo/Astrobiology”, 21-23 May 2001, ESRIN, Frascati (Rome), Italy, ESA SP-496, pp. 413-416.
[32] Teodorani M. & Strand E.P. (2001), Data Analysis of Anomalous Luminous Phenomena in Hessdalen, ICPH Articles, Internet publication on the web site: http://www.itacomm.net/PH/ .
[33] Teodorani M. (2001), Physics from UFO Data, ICPH Articles, Internet publication (20 pages) on the web site: http://www.itacomm.net/PH/ .
[34] Teodorani M., Strand E.P., Hauge B.G. (2001), EMBLA 2001: The Optical Mission, ICPH Articles, Internet publication on the web site http://www.itacomm.net/PH/ .
[35] Teodorani M., The physical study of atmospheric luminous anomalies and the SETV Hypothesis, Open SETI, Articles, http://www.zeitlin.net/OpenSETI/Docs/EuroSETI2002_OSI.htm
[36] Zeitlin G., Open SETI, http://www.zeitlin.net/OpenSETI/Opening.shtml , and http://www.zeitlin.net/OpenSETI/NewSearches.html
[37] Zeitlin G. (2002), SETI, SETV and UFOs, New Frontiers of Science, http://www.newfrontiersinscience.com/Abstracts/index.shtml
[38] Zou You-Suo (1995), Some Physical Considerations for Unusual Atmospheric Lights Observed in Norway, Physica Scripta, Vol. 52, 1995, p. 726.
Copyright (2002) Massimo Teodorani, Ph.D. ; Gloria Nobili, Ms.Sc. Copyright (2002) Project Hessdalen As an expression of intellectual activity by the author, this material is protected by the international laws on copyright. All rights reserved. No reproduction, copy or transmission of this material may be made without written permission by the authors. No paragraph, table, graph or photo of this article may be reproduced, copied or transmitted save without written permission by the authors. Any person who does any unauthorized act in relation to this material may be liable to criminal prosecution and civil calims for damages.
21
APPENDIX 1.
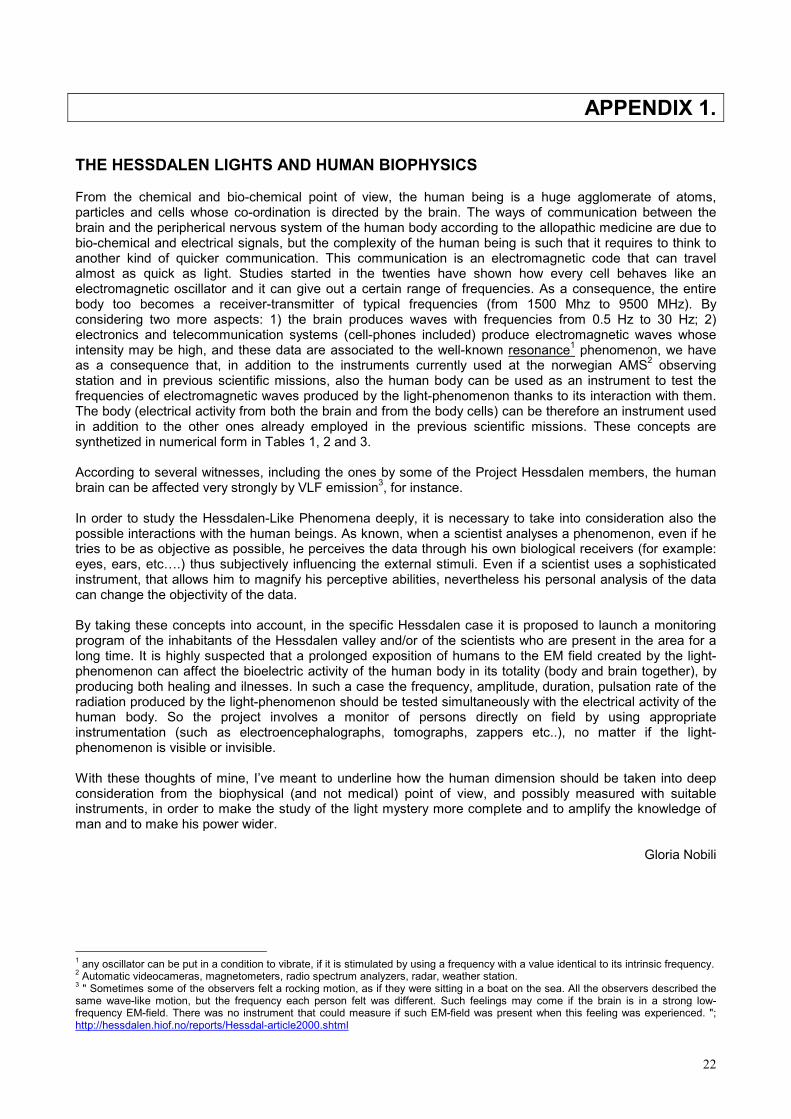
THE HESSDALEN LIGHTS AND HUMAN BIOPHYSICS From the chemical and bio-chemical point of view, the human being is a huge agglomerate of atoms, particles and cells whose co-ordination is directed by the brain. The ways of communication between the brain and the peripherical nervous system of the human body according to the allopathic medicine are due to bio-chemical and electrical signals, but the complexity of the human being is such that it requires to think to another kind of quicker communication. This communication is an electromagnetic code that can travel almost as quick as light. Studies started in the twenties have shown how every cell behaves like an electromagnetic oscillator and it can give out a certain range of frequencies. As a consequence, the entire body too becomes a receiver-transmitter of typical frequencies (from 1500 Mhz to 9500 MHz). By considering two more aspects: 1) the brain produces waves with frequencies from 0.5 Hz to 30 Hz; 2) electronics and telecommunication systems (cell-phones included) produce electromagnetic waves whose intensity may be high, and these data are associated to the well-known resonance1 phenomenon, we have as a consequence that, in addition to the instruments currently used at the norwegian AMS2 observing station and in previous scientific missions, also the human body can be used as an instrument to test the frequencies of electromagnetic waves produced by the light-phenomenon thanks to its interaction with them. The body (electrical activity from both the brain and from the body cells) can be therefore an instrument used in addition to the other ones already employed in the previous scientific missions. These concepts are synthetized in numerical form in Tables 1, 2 and 3. According to several witnesses, including the ones by some of the Project Hessdalen members, the human brain can be affected very strongly by VLF emission3, for instance. In order to study the Hessdalen-Like Phenomena deeply, it is necessary to take into consideration also the possible interactions with the human beings. As known, when a scientist analyses a phenomenon, even if he tries to be as objective as possible, he perceives the data through his own biological receivers (for example: eyes, ears, etc….) thus subjectively influencing the external stimuli. Even if a scientist uses a sophisticated instrument, that allows him to magnify his perceptive abilities, nevertheless his personal analysis of the data can change the objectivity of the data. By taking these concepts into account, in the specific Hessdalen case it is proposed to launch a monitoring program of the inhabitants of the Hessdalen valley and/or of the scientists who are present in the area for a long time. It is highly suspected that a prolonged exposition of humans to the EM field created by the light-phenomenon can affect the bioelectric activity of the human body in its totality (body and brain together), by producing both healing and ilnesses. In such a case the frequency, amplitude, duration, pulsation rate of the radiation produced by the light-phenomenon should be tested simultaneously with the electrical activity of the human body. So the project involves a monitor of persons directly on field by using appropriate instrumentation (such as electroencephalographs, tomographs, zappers etc..), no matter if the light-phenomenon is visible or invisible. With these thoughts of mine, I’ve meant to underline how the human dimension should be taken into deep consideration from the biophysical (and not medical) point of view, and possibly measured with suitable instruments, in order to make the study of the light mystery more complete and to amplify the knowledge of man and to make his power wider.
Gloria Nobili
1 any oscillator can be put in a condition to vibrate, if it is stimulated by using a frequency with a value identical to its intrinsic frequency. 2 Automatic videocameras, magnetometers, radio spectrum analyzers, radar, weather station. 3 " Sometimes some of the observers felt a rocking motion, as if they were sitting in a boat on the sea. All the observers described the same wave-like motion, but the frequency each person felt was different. Such feelings may come if the brain is in a strong low-frequency EM-field. There was no instrument that could measure if such EM-field was present when this feeling was experienced. "; http://hessdalen.hiof.no/reports/Hessdal-article2000.shtml
22
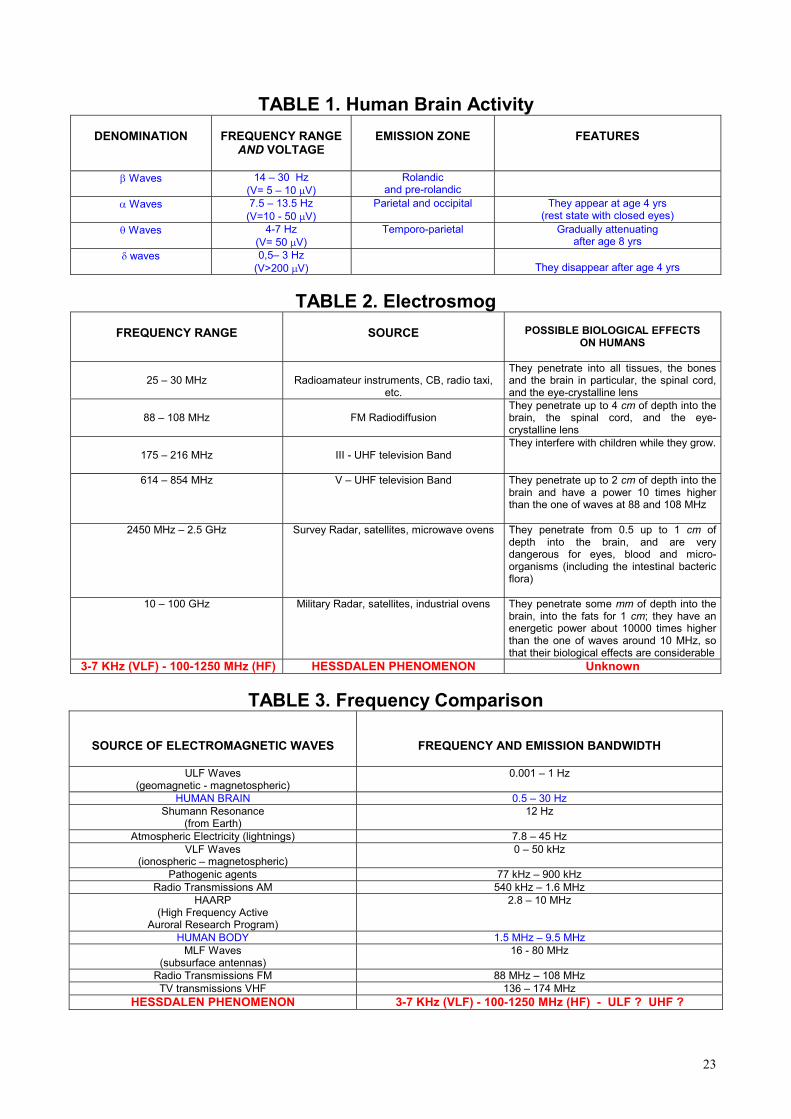
TABLE 1. Human Brain Activity
DENOMINATION
FREQUENCY RANGE
AND VOLTAGE
EMISSION ZONE
FEATURES
� Waves 14 – 30 Hz (V= 5 – 10 �V)
Rolandic and pre-rolandic
� Waves 7.5 – 13.5 Hz (V=10 - 50 �V)
Parietal and occipital They appear at age 4 yrs (rest state with closed eyes)
� Waves 4-7 Hz (V= 50 �V)
Temporo-parietal Gradually attenuating after age 8 yrs
� waves 0,5– 3 Hz (V>200 �V)
They disappear after age 4 yrs
TABLE 2. Electrosmog
FREQUENCY RANGE
SOURCE
POSSIBLE BIOLOGICAL EFFECTS
ON HUMANS
25 – 30 MHz
Radioamateur instruments, CB, radio taxi,
etc.
They penetrate into all tissues, the bones and the brain in particular, the spinal cord, and the eye-crystalline lens
88 – 108 MHz
FM Radiodiffusion
They penetrate up to 4 cm of depth into the brain, the spinal cord, and the eye-crystalline lens
175 – 216 MHz
III - UHF television Band
They interfere with children while they grow.
614 – 854 MHz V – UHF television Band They penetrate up to 2 cm of depth into the brain and have a power 10 times higher than the one of waves at 88 and 108 MHz
2450 MHz – 2.5 GHz Survey Radar, satellites, microwave ovens They penetrate from 0.5 up to 1 cm of depth into the brain, and are very dangerous for eyes, blood and micro-organisms (including the intestinal bacteric flora)
10 – 100 GHz Military Radar, satellites, industrial ovens They penetrate some mm of depth into the brain, into the fats for 1 cm; they have an energetic power about 10000 times higher than the one of waves around 10 MHz, so that their biological effects are considerable
3-7 KHz (VLF) - 100-1250 MHz (HF) HESSDALEN PHENOMENON Unknown
TABLE 3. Frequency Comparison
SOURCE OF ELECTROMAGNETIC WAVES
FREQUENCY AND EMISSION BANDWIDTH
ULF Waves (geomagnetic - magnetospheric)
0.001 – 1 Hz
HUMAN BRAIN 0.5 – 30 Hz Shumann Resonance
(from Earth) 12 Hz
Atmospheric Electricity (lightnings) 7.8 – 45 Hz VLF Waves
(ionospheric – magnetospheric) 0 – 50 kHz
Pathogenic agents 77 kHz – 900 kHz Radio Transmissions AM 540 kHz – 1.6 MHz
HAARP (High Frequency Active
Auroral Research Program)
2.8 – 10 MHz
HUMAN BODY 1.5 MHz – 9.5 MHz MLF Waves
(subsurface antennas) 16 - 80 MHz
Radio Transmissions FM 88 MHz – 108 MHz TV transmissions VHF 136 – 174 MHz
HESSDALEN PHENOMENON 3-7 KHz (VLF) - 100-1250 MHz (HF) - ULF ? UHF ?
23
APPENDIX 2.
The typical and most diffused spectrum of an Hessdalen streetlight produced by a lamp of the mercury vapor type (white light). The spectrum was obtained by using an instrument set-up made of: Praktica BX-20 reflex camera, 270 mm lens and ROS grating.
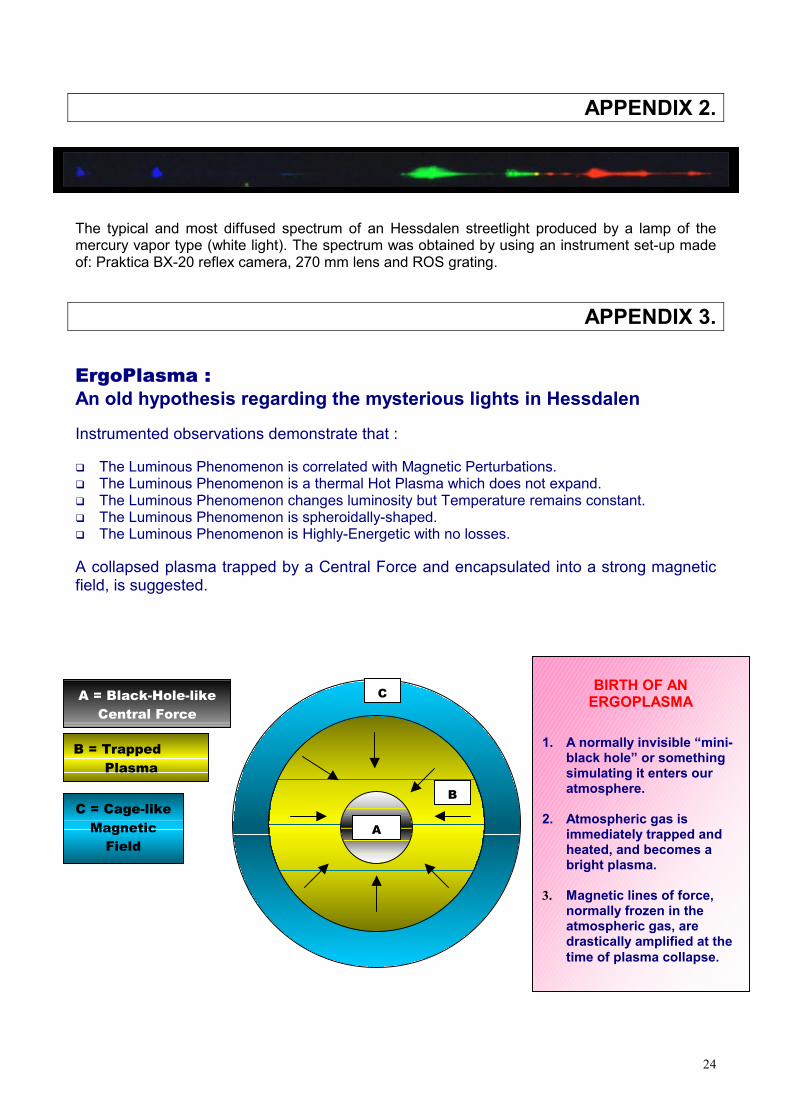
APPENDIX 3.
ErgoPlasma : An old hypothesis regarding the mysterious lights in Hessdalen Instrumented observations demonstrate that : �� The Luminous Phenomenon is correlated with Magnetic Perturbations. �� The Luminous Phenomenon is a thermal Hot Plasma which does not expand. �� The Luminous Phenomenon changes luminosity but Temperature remains constant. �� The Luminous Phenomenon is spheroidally-shaped. �� The Luminous Phenomenon is Highly-Energetic with no losses. A collapsed plasma trapped by a Central Force and encapsulated into a strong magnetic field, is suggested.
C
BIRTH OF AN
ERGOPLASMA 1. A normally invisible “mini-
black hole” or something simulating it enters our atmosphere.
2. Atmospheric gas is
C = Cage-like Magnetic
Field
A
B
A = Black-Hole-like Central Force
B = Trapped Plasma
immediately trapped and heated, and becomes a bright plasma.
3. Magnetic lines of force,
normally frozen in the atmospheric gas, are drastically amplified at the time of plasma collapse.
24
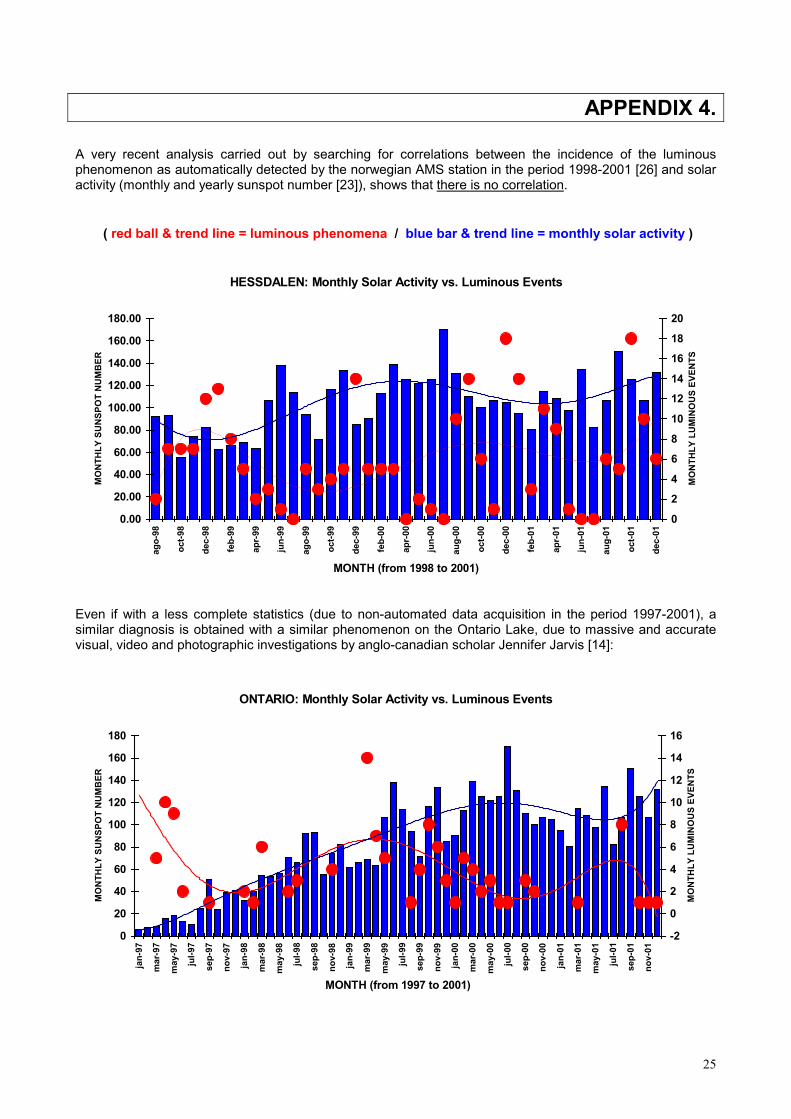
APPENDIX 4. A very recent analysis carried out by searching for correlations between the incidence of the luminous phenomenon as automatically detected by the norwegian AMS station in the period 1998-2001 [26] and solar activity (monthly and yearly sunspot number [23]), shows that there is no correlation.
( red ball & trend line = luminous phenomena / blue bar & trend line = monthly solar activity )
HESSDALEN: Monthly Solar Activity vs. Luminous Events
0.00
20.00
40.00
60.00
80.00
100.00
120.00
140.00
160.00
180.00
ago-
98
oct-9
8
dec-
98
feb-
99
apr-
99
jun-
99
ago-
99
oct-9
9
dec-
99
feb-
00
apr-
00
jun-
00
aug-
00
oct-0
0
dec-
00
feb-
01
apr-
01
jun-
01
aug-
01
oct-0
1
dec-
01
MONTH (from 1998 to 2001)
MO
NTH
LY S
UN
SPO
T N
UM
BER
0
2
4
6
8
10
1214
16
18
20
MO
NTH
LY L
UM
INO
US
EVEN
TS
Even if with a less complete statistics (due to non-automated data acquisition in the period 1997-2001), a similar diagnosis is obtained with a similar phenomenon on the Ontario Lake, due to massive and accurate visual, video and photographic investigations by anglo-canadian scholar Jennifer Jarvis [14]:
ONTARIO: Monthly Solar Activity vs. Luminous Events
0
20
40
60
80
100
120
140
160
180
jan-
97
mar
-97
may
-97
jul-9
7
sep-
97
nov-
97
jan-
98
mar
-98
may
-98
jul-9
8
sep-
98
nov-
98
jan-
99
mar
-99
may
-99
jul-9
9
sep-
99
nov-
99
jan-
00
mar
-00
may
-00
jul-0
0
sep-
00
nov-
00
jan-
01
mar
-01
may
-01
jul-0
1
sep-
01
nov-
01
MONTH (from 1997 to 2001)
MO
NTH
LY S
UN
SPO
T N
UM
BER
-2
0
2
4
6
8
10
12
14
16
MO
NTH
LY L
UM
INO
US
EVEN
TS
25
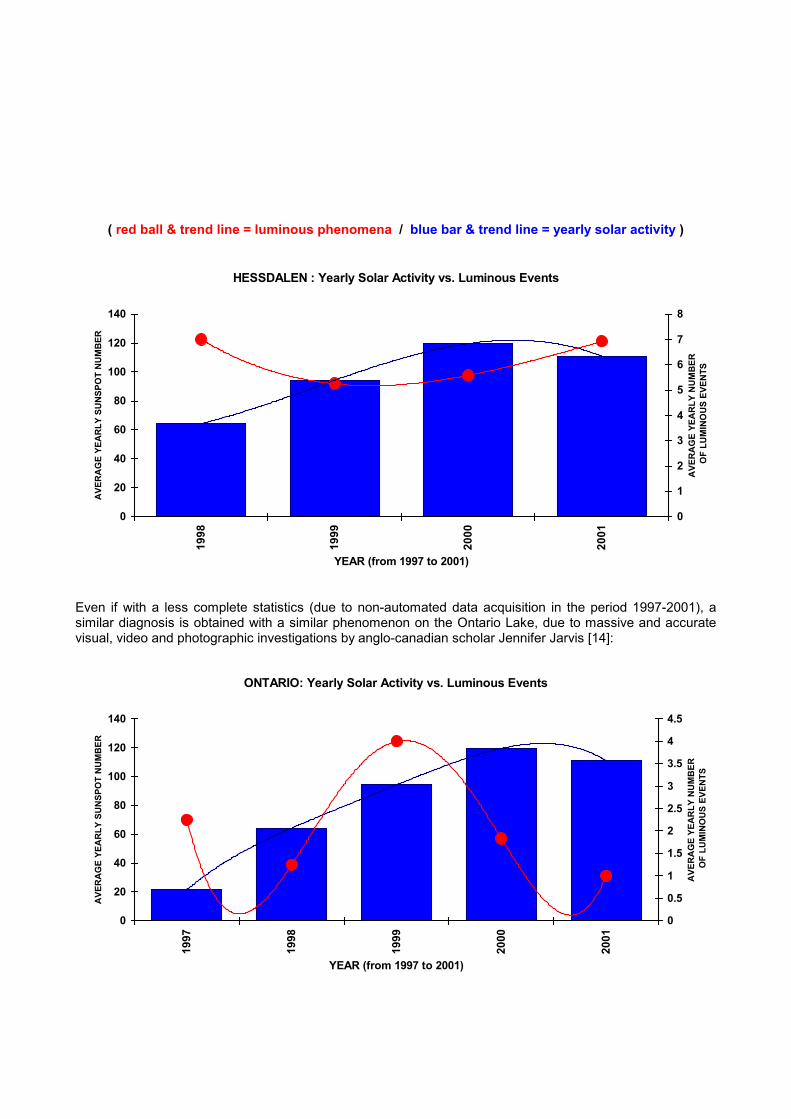
( red ball & trend line = luminous phenomena / blue bar & trend line = yearly solar activity )
HESSDALEN : Yearly Solar Activity vs. Luminous Events
0
20
40
60
80
100
120
140
1998
1999
2000
2001
YEAR (from 1997 to 2001)
AVE
RA
GE
YEA
RLY
SU
NSP
OT
NU
MB
ER
0
1
2
3
4
5
6
7
8
AVE
RA
GE
YEA
RLY
NU
MB
ER O
F LU
MIN
OU
S EV
ENTS
Even if with a less complete statistics (due to non-automated data acquisition in the period 1997-2001), a similar diagnosis is obtained with a similar phenomenon on the Ontario Lake, due to massive and accurate visual, video and photographic investigations by anglo-canadian scholar Jennifer Jarvis [14]:
ONTARIO: Yearly Solar Activity vs. Luminous Events
0
20
40
60
80
100
120
140
1997
1998
1999
2000
2001
YEAR (from 1997 to 2001)
AVE
RA
GE
YEA
RLY
SU
NSP
OT
NU
MB
ER
0
0.5
1
1.5
2
2.5
3
3.5
4
4.5
AVE
RA
GE
YEA
RLY
NU
MB
ER O
F LU
MIN
OU
S EV
ENTS


![Luminaire Photometry External[1]](https://img.pdfslide.us/doc/110x75/55554ff2b4c90530208b4b6b/luminaire-photometry-external1.jpg)