Embed Size (px)
Citation preview
BNL-76947-2006-BC
Photoemission as a Probe of the Collective Excitations in Condensed Matter Systems
Peter D. Johnson and Tonica Valla
To be published in “Photoemission”
July 2006
Condensed Matter Physics & Materials Science Department
Brookhaven National Laboratory P.O. Box 5000
Upton, NY 11973-5000 www.bnl.gov
Notice: This manuscript has been authored by employees of Brookhaven Science Associates, LLC under Contract No. DE-AC02-98CH10886 with the U.S. Department of Energy. The publisher by accepting the manuscript for publication acknowledges that the United States Government retains a non-exclusive, paid-up, irrevocable, world-wide license to publish or reproduce the published form of this manuscript, or allow others to do so, for United States Government purposes. This preprint is intended for publication in a journal or proceedings. Since changes may be made before publication, it may not be cited or reproduced without the author’s permission.

DISCLAIMER
This report was prepared as an account of work sponsored by an agency of the United States Government. Neither the United States Government nor any agency thereof, nor any of their employees, nor any of their contractors, subcontractors, or their employees, makes any warranty, express or implied, or assumes any legal liability or responsibility for the accuracy, completeness, or any third party’s use or the results of such use of any information, apparatus, product, or process disclosed, or represents that its use would not infringe privately owned rights. Reference herein to any specific commercial product, process, or service by trade name, trademark, manufacturer, or otherwise, does not necessarily constitute or imply its endorsement, recommendation, or favoring by the United States Government or any agency thereof or its contractors or subcontractors. The views and opinions of authors expressed herein do not necessarily state or reflect those of the United States Government or any agency thereof.
Photoemission as a probe of the Collective
Excitations in Condensed Matter Systems
Peter D. Johnson and Tonica Valla
Condensed Matter and Materials Science Department, Brookhaven NationalLaboratory, Upton, NY, 11973
1 Introduction
New developments in instrumentation have recently allowed photoemission mea-surements to be performed with very high energy and momentum resolution.[1]This has allowed detailed studies of the self-energy corrections to the lifetimeand mass renormalization of excitations in the vicinity of the Fermi level. Thesedevelopments come at an opportune time. Indeed the discovery of high tempera-ture superconductivity in the cuprates and related systems is presenting a rangeof challenges for condensed matter physics.[2] Does the mechanism of high TC
superconductivity represent new physics? Do we need to go beyond Landau’sconcept of the Fermi liquid?[3] What, if any, is the evidence for the presenceor absence of quasiparticles in the excitation spectra of these complex oxides?The energy resolution of the new instruments is comparable to or better thanthe energy or temperature scale of superconductivity and the energy of manycollective excitations. As such, photoemission has again become recognized asan important probe of condensed matter.
Studies of the high TC superconductors and related materials are aided bythe observation that they are two dimensional. To understand this, we notethat the photoemission process results in both an excited photoelectron and aphotohole in the final state. Thus the experimentally measured photoemissionpeak is broadened to a width reflecting contributions from both the finite lifetimeof the photohole and the momentum broadening of the outgoing photoelectron.The total width Γ is given by [4]
Γ =
(
Γh +vh
ve
Γe
) (∣
∣
∣
∣
1 − vh
ve
∣
∣
∣
∣
)−1
(1)
where Γh is the width of the hole state, Γe the width of the electron state,and vh and ve the respective perpendicular velocities. In a two dimensionalsystem with vh = 0, the width of the photoemission peak is therefore deter-mined entirely by the inverse lifetime or scattering rate of the photohole, Γh.This observation offers the possibility that the technique may be useful as a
1
BNL-76947-2006-BC
probe of the related scattering mechanisms contributing to the electrical trans-port in different materials. Unlike other probes of these transport properties,photoemission has the advantage that it is momentum resolving. In drawingconclusions from such studies, it is important to remember that the single par-ticle scattering rate measured in photoemission is not identical to the scatteringrate measured in transport studies, τtr. However with certain assumptions, thetwo are approximately related and the transport scattering rate can be writ-ten h/τtr = h/τ (1 − 〈cosϑ〉) where h/τ represents the single particle scatteringrate and 〈cosϑ〉 represents the average value of cosϑ with ϑ the scattering angle[5, 6].
In the following sections we first review the photoemission process with par-ticular reference to the role of coupling to many body excitations. We then ex-amine in more detail the coupling to a variety of excitations including phonons,charge density waves (CDW) and magnetic or spin excitations. Finally we re-view studies of the high TC materials with an emphasis on measurements ofself-energy effects. We note that our discussion is heavily concentrated aroundour own work but recognize the many important studies that have been reportedby other groups.
2 The photoemission process
In photoelectron spectroscopy, a photon of known energy, hν, is absorbed andthe outgoing electron’s energy (hν−φ−εk) and angle are measured. These prop-erties determine the binding energy εk and parallel momentum k|| of the holeleft in the occupied valence bands.[7] Interaction effects, including for instanceCoulomb and electron-phonon, cause the sharp line spectrum of independentelectron theory, A0(k, ω) = Im G0(k, ω) = Im 1/(ω− ǫk0− iη), where ǫk0 repre-sents a bare band dispersion, to evolve into Im 1/[ω − ǫk0 − Σ(k, ω)] where thecomplex self-energy Σ(k, ω) contains the effects of the many body interactions.The single-particle spectral function of the hole-state, A(k, ω), then takes theform
A(k, ω) ∝ Σ2(k, ω)
[ω − ǫk0 − Σ1(k, ω)]2 + (Σ2(k, ω))2(2)
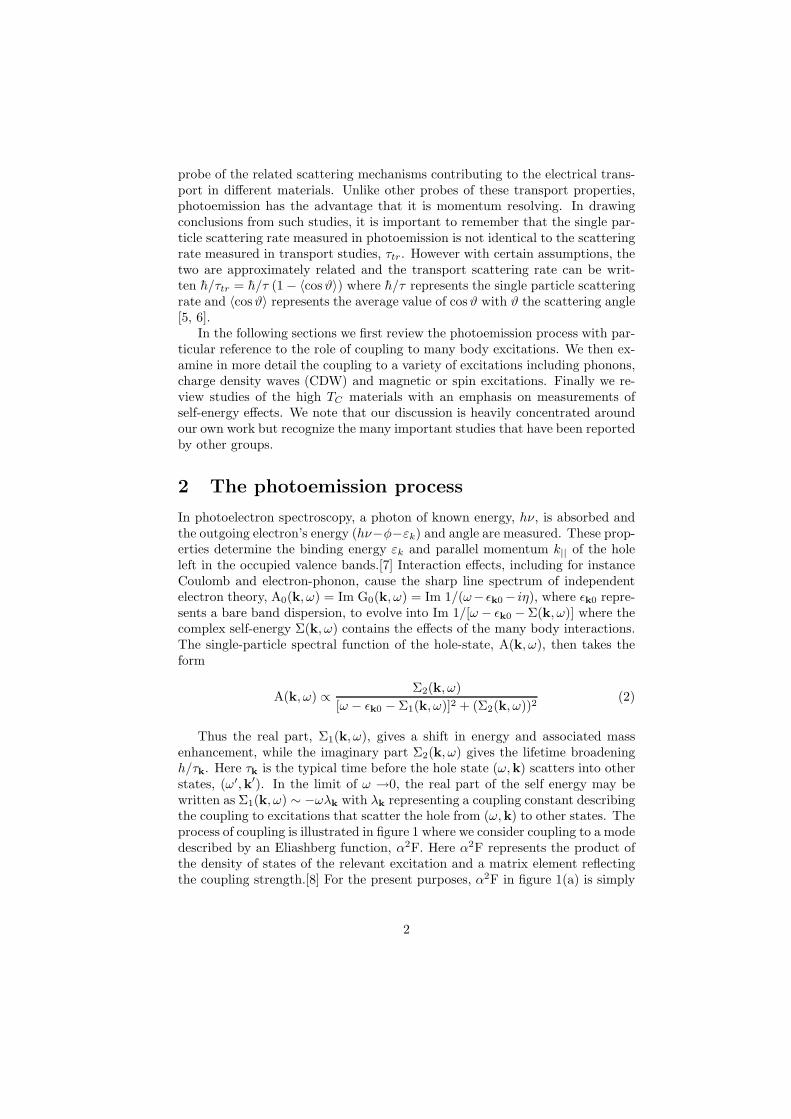
Thus the real part, Σ1(k, ω), gives a shift in energy and associated massenhancement, while the imaginary part Σ2(k, ω) gives the lifetime broadeningh/τk. Here τk is the typical time before the hole state (ω,k) scatters into otherstates, (ω′,k′). In the limit of ω →0, the real part of the self energy may bewritten as Σ1(k, ω) ∼ −ωλk with λk representing a coupling constant describingthe coupling to excitations that scatter the hole from (ω,k) to other states. Theprocess of coupling is illustrated in figure 1 where we consider coupling to a modedescribed by an Eliashberg function, α2F. Here α2F represents the product ofthe density of states of the relevant excitation and a matrix element reflectingthe coupling strength.[8] For the present purposes, α2F in figure 1(a) is simply
2
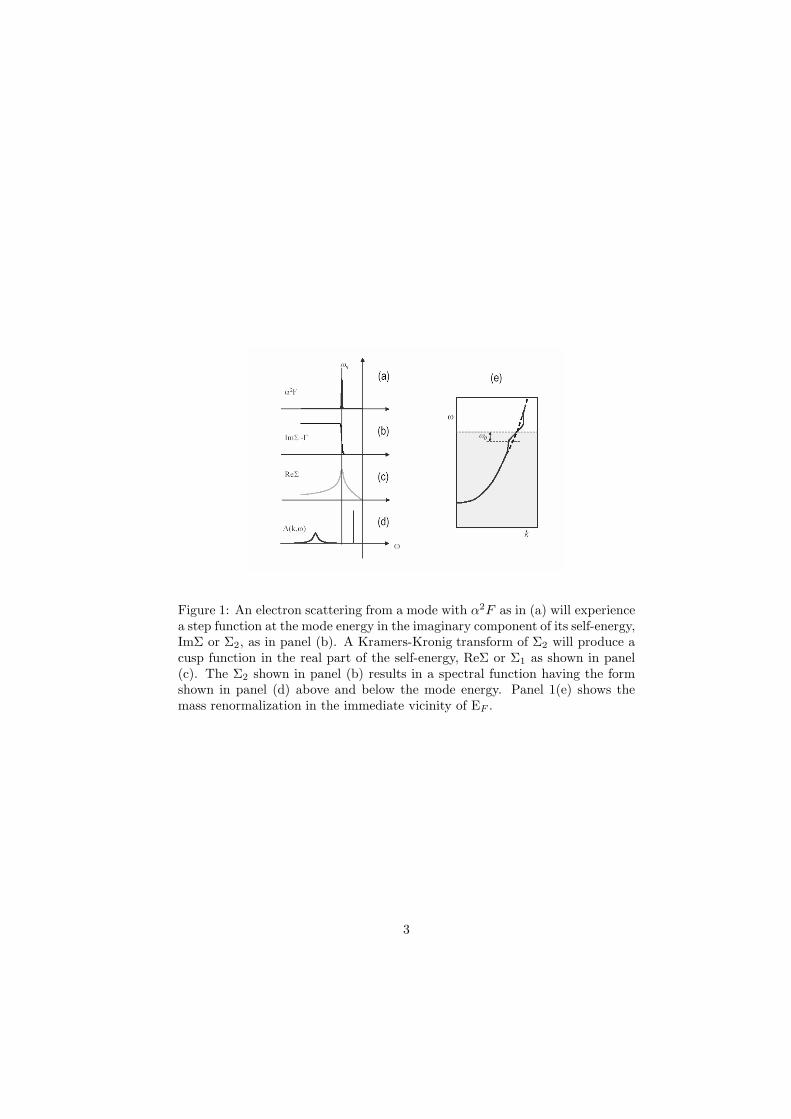
Figure 1: An electron scattering from a mode with α2F as in (a) will experiencea step function at the mode energy in the imaginary component of its self-energy,ImΣ or Σ2, as in panel (b). A Kramers-Kronig transform of Σ2 will produce acusp function in the real part of the self-energy, ReΣ or Σ1 as shown in panel(c). The Σ2 shown in panel (b) results in a spectral function having the formshown in panel (d) above and below the mode energy. Panel 1(e) shows themass renormalization in the immediate vicinity of EF .
3
represented by a single Gaussian peak at energy Ω0. Coupling to such a mode(at T = 0 K) will result in a broadened step function in the scattering rate orimaginary part of the self energy, Σ2. The step function reflects the observationthat when the photohole has enough energy to create the mode (ω ≥ Ω0),scattering from the mode opens up a new decay channel, thereby shorteningthe lifetime. The real and imaginary parts of the self energy are related viacausality through a Kramers Kronig transform. Thus the step function in Σ2
results in a cusp function for Σ1 (panel (c)). Such an energy dependence of theself energy affects the measured spectra in two ways. Above and below the modeenergy there will be a noticeable change in the spectral function as illustratedin panel (d). Secondly, as noted above, the measured dispersion will be given byǫk0 +Σ1(k,ω). Thus with Σ1 taking the form shown in panel (c), the dispersionwill display the mass enhancement observed immediately below the Fermi levelas presented in figure 1(e).
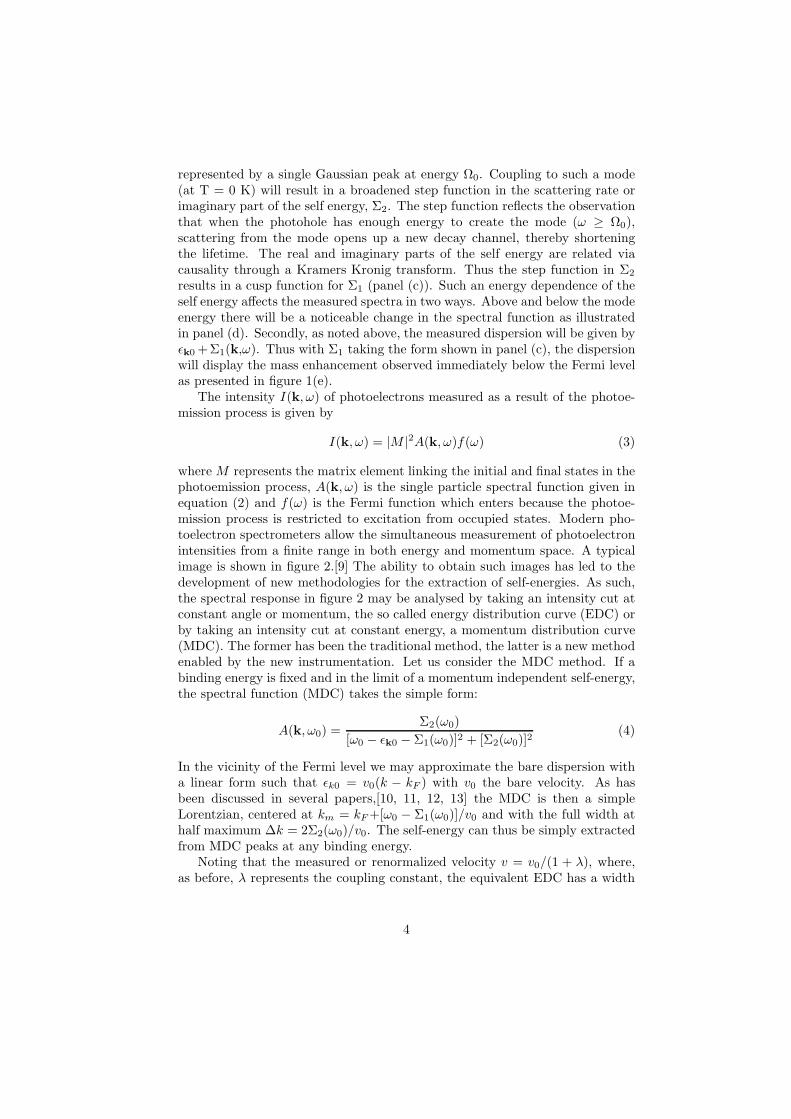
The intensity I(k, ω) of photoelectrons measured as a result of the photoe-mission process is given by
I(k, ω) = |M |2A(k, ω)f(ω) (3)
where M represents the matrix element linking the initial and final states in thephotoemission process, A(k, ω) is the single particle spectral function given inequation (2) and f(ω) is the Fermi function which enters because the photoe-mission process is restricted to excitation from occupied states. Modern pho-toelectron spectrometers allow the simultaneous measurement of photoelectronintensities from a finite range in both energy and momentum space. A typicalimage is shown in figure 2.[9] The ability to obtain such images has led to thedevelopment of new methodologies for the extraction of self-energies. As such,the spectral response in figure 2 may be analysed by taking an intensity cut atconstant angle or momentum, the so called energy distribution curve (EDC) orby taking an intensity cut at constant energy, a momentum distribution curve(MDC). The former has been the traditional method, the latter is a new methodenabled by the new instrumentation. Let us consider the MDC method. If abinding energy is fixed and in the limit of a momentum independent self-energy,the spectral function (MDC) takes the simple form:
A(k, ω0) =Σ2(ω0)
[ω0 − ǫk0 − Σ1(ω0)]2 + [Σ2(ω0)]2(4)
In the vicinity of the Fermi level we may approximate the bare dispersion witha linear form such that ǫk0 = v0(k − kF ) with v0 the bare velocity. As hasbeen discussed in several papers,[10, 11, 12, 13] the MDC is then a simpleLorentzian, centered at km = kF +[ω0 − Σ1(ω0)]/v0 and with the full width athalf maximum ∆k = 2Σ2(ω0)/v0. The self-energy can thus be simply extractedfrom MDC peaks at any binding energy.
Noting that the measured or renormalized velocity v = v0/(1 + λ), where,as before, λ represents the coupling constant, the equivalent EDC has a width
4
Figure 2: Two-dimensional spectral plot showing the intensity of emission inthe (π, π) direction of the Brillouin zone as a function of ω, the binding energy,and k||, the parallel momentum. The photon energy is 21.2 eV and the sampletemperature is 48 K. Clockwise from upper left, the insets show the region of theBrillouin zone sampled in the experiment, a cross section through the intensityat constant energy (ω = 0) as a function of momentum (an MDC), and a crosssection through the intensity at constant angle or momentum (k = kF ) as afunction of ω (an EDC).
5
∆E such that
∆E = v∆k =2Σ2
(1 + λ)=
2Σ2
1 − ∂Σ1/∂ω(5)
If the real part of the self-energy displays no frequency dependence, the width∆E is directly related to the scattering rate. Both EDCs and MDCs will havea Lorentzian line shape. However this is no longer true if the real part of theself-energy is frequency dependent and particularly in the vicinity of a mode,the width of the EDC, ∆E, will be strongly dependent on the renormalization ofthe velocity. This can result in the EDC having a complex two peaked structurethat is more difficult to interpret.
3 Electron-phonon coupling in metallic systems
In this section we focus on photoemission studies of electron-phonon couplingin metallic systems. The electron-phonon coupling contribution, Γe−ph, to thetotal scattering rate may be calculated via the Eliashberg equation such that[5]
Γe−ph (ω, T ) = 2πh
∞∫
0
dω′α2F (ω′) [2n (ω′) + f (ω′ + ω) + f (ω′ − ω)] (6)
where again α2F is the Eliashberg coupling constant and f(ω) and n(ω) are theFermi and Bose-Einstein functions, respectively. Γe−ph increases monotonicallywith energy up to some cut-off defined by the Debye energy. At T = 0 K theelectron-phonon coupling constant is given by [8]
λ = 2
∞∫
0
α2F (ω′)
ω′dω′ (7)
Early photoemission studies focused on the observation that at higher temper-atures, above approximately one third the Debye energy, equation (6) reducesto Γe−ph = πλkBT . Thus a measurement of the width of a photoemission peakas a function of temperature provides direct access to the coupling constant,λ. This approach has been used in several studies including a study of theelectron-phonon contribution to quasiparticle lifetimes of surface states on theCu(111) [14] and Be(0001) [15] surfaces. In the former case the electron-phononcoupling constant for the surface, λ = 0.14 was close to that measured for bulkcopper, λ = 0.15. In the case of Be, the surface was found to have a dramaticallyenhanced value of λ = 1.15, which is to be compared with the bulk value of λ =0.24. Hengsberger et al. found a similar value, λ = 1.18, for the electron-phononcoupling parameter in the surface region of Be by measuring the velocity renor-malization in the surface band.[16] However the most recent study of the samesurface reduced the value λ to 0.7, a value obtained from a determination of therate of change of the real part of the self-energy,− (∂Σ1/∂ω), in the vicinity of
6
Figure 3: ARPES intensity plot of the Mo(110) surface recorded along the Γ−Nline of the surface Brillouin zone at 70 K. Shown in the inset is the spectrum ofthe region around kF taken with special attention to the surface cleanliness.
EF . Enhanced values of λ have led to speculation on the possibility of enhancedsuperconducting transition temperatures in the surface region.[15]
The introduction of the new instrumentation in the nineties allowed the firstdirect imaging of the mass renormalization due to electron-phonon coupling.Fig. 3 shows an image of the spectral intensity excited from a two-dimensionalsurface resonance in the Γ -N azimuth of a Mo(110) crystal with the sampleheld at 70 K.[17] The state shown in the figure corresponds to a surface reso-nance which closes an elliptical hole Fermi orbit around the center of the zone,Γ.[18] In the vicinity of the Fermi level there is a notable change in the rateof dispersion, or mass enhancement, and a rapid change in the width of theband. The self energy corrections resulting in these changes reflect three prin-cipal contributions, electron-electron scattering, electron-phonon scattering andelectron-impurity scattering. These different contributions all add linearly togive the total scattering rate Γ such that
Γ = Γe−e + Γe−ph + Γimp (8)
In a Fermi liquid the electron-electron scattering term is given by Γe−e (ω, T ) =2β
[
(πkBT )2 + ω2]
where, within the Born approximation, 2β = (πU2)/(2W3),with U the on-site Coulomb repulsion and W the bandwidth of the state. Asnoted earlier the electron-phonon contribution may be calculated via the Eliash-berg equation, eq. (6). The final contribution in equation (8), impurity scat-tering, is elastic in that the impurity atoms are considered to have no internalexcitations. Thus the scattering-rate, Γimp, is proportional to the impurity
7
Figure 4: The photohole self-energy as a function of binding energy at 70 K.The real part is obtained from the MDC-derived dispersion shown in the inset.The imaginary part is obtained from the width of the quasiparticle peak. Thesolid line is a quadratic fit to the high-binding energy data (ω < 80 meV). Thedashed (dotted) line shows the calculated electron-phonon contribution to theimaginary (real) part of the self-energy. The dashed line is shifted up by 26meV.
8
Figure 5: The peak width as a function of (a) temperature and (b) exposureto background hydrogen, measured for two binding energies. For the exposuredependence the sample was held at 70 K. Lines in (a) are calculated electron-phonon contributions, shifted up by 26 meV to match the data. Lines in (b)represent fits (see text for details).
concentration, but independent of energy and temperature. At sufficiently lowtemperature, impurity scattering represents the dominant decay mechanism fora hole close to EF .
Figure 4 shows the measured Σ2 of the Mo surface state as a function ofbinding energy. The data points are extracted from the image of fig. 3 intwo ways, either from EDCs or from MDCs. The calculated electron-phononcontribution to the self-energy is indicated in the figure. In the vicinity of theFermi level, the agreement between the calculation using the theoretical α2Fof bulk molybdenum.[19] and the experimentally measured widths is excellent.There is a rapid change in the scattering rate up to the Debye energy at ∼ 30meV. At binding energies greater than this, the electron-phonon contributionsaturates. However, also shown in the figure is a quadratic fit to the measuredwidths at the higher binding energies. The quadratic dependence is an indicationthat electron-electron scattering, as in a Fermi liquid, plays an important role.In a purely two dimensional system there should be a logarithmic correction tothe quadratic term.[20] Thus Γe−e will be proportional to ω2lnω. However thesimple quadratic fit works well as indicated in the figure because the surfacestate shown in figure 3 is, as previously noted, a surface resonance with goodcoupling to bulk states.[18] The quadratic fit is consistent with the prefactorin the expression for Γe−e having U∼0.6 eV, as predicted for molybdenum,[21]and W∼1.3 eV the approximate bandwidth of the surface state. The measuredwidths also have an energy-independent contribution due to scattering fromhydrogen impurity centers.[17]
The calculated real component of the self energy, Σ1, derived through aKramers Kronig transform of Σ2 is also shown in figure 4 where it is compared
9
with the experimentally derived values. From Σ1 it is possible to determine avalue for the electron-phonon coupling constant of 0.4 to be compared with thebulk value of 0.42. As we have already noted the coupling constant can also bederived from the temperature dependence of the peak widths. This is shown infigure 5(a) for two different binding energies, ω = 0 and ω = 100 meV. By doinglinear fits to the experimental data points, values for the coupling constant of0.52 and 0.35 are obtained respectively. These values are again close to the bulkvalue.
The observation that the width of the quasiparticle peak always has a signif-icant constant term indicates the presence of impurity scattering. It is knownthat this surface state is very sensitive to hydrogen adsorption. Fig. 5(b) showshow the width changes with the exposure to residual hydrogen. Note that itsaturates with exposure θ. If the scattering rate is proportional to the concen-tration of adsorbed particles, the experimental points become a measure of theconcentration. Since the number of free adsorption sites decays exponentiallywith exposure, the concentration of adsorbed atoms as a function of exposureshould change as c(θ) = c0 + csat(1 − e−pθ), where p is the adsorption proba-bility and c0 (csat) is the initial (saturation) concentration. The width of thequasiparticle peak can be fitted with the same dependence (lines). It is notablethat extrapolation to zero exposure results in a residual width of 6 ± 5 meV atω = 0. Electron-phonon coupling contributes with ≈ 5 meV for T=70 K. How-ever, we should also note that there is some uncertainty in the initial coveragedue to the change in adsorption conditions between flashing the sample and themeasurement.
4 Studies of the dichalgogenides
The family of layered dichalcogenides provide a range of interesting phenomenafor study. These systems exhibit both charge-density wave (CDW) formationand superconductivity.[22, 23] As shown in figure 6, the fact that the CDWtransition temperature decreases while the superconducting critical tempera-ture, TC , increases on going from TaSe2 through TaS2 and NbSe2 to NbS2
suggests that the two order parameters represent competing ground states. In-deed, it has been found that in TaS2 and NbSe2, TC increases under pressurewhile TCDW decreases [24, 25] While these studies suggested that after CDWorder disappears, TC remains approximately constant, a more recent study ofNbSe2 indicates that as a function of pressure, TC at first increases up to somemaximum vale and then decreases.[26] In NbS2, the system with no CDW order,TC is insensitive to pressure. Although various anomalies, including an appar-ent anisotropy of the superconducting gap, have been observed, [27, 28, 29, 30]it is generally believed that superconductivity in the dichalcogenides is of theconventional BCS character, mediated by strong electron-phonon coupling [29].However, consensus on the exact mechanism that drives the system into theCDW state has still not been reached. Some authors [22, 23, 31, 32] argue, inanalogy with a Pierels transition in one- dimensional systems, that the CDW
10
0.270 0.272 0.274 0.276 0.278 0.280
0
20
40
60
80
100
120
140
NbS2
NbSe2
TaS2
TaSe2
a/c
TC
DW
(K
)
CDW
0
5
10
15
20
SC
TC (
K)
Figure 6: A comparison of the CDW transition temperature TCDW and thesuperconducting transition temperature TC for the dichalcogenides plotted as afunction of the ratio of lattice parameters a/c.(Reproduced from Ref. [23])
transition is driven by a Fermi surface instability or nesting, with some portionsof the Fermi surface spanned by a CDW vector- qCDW . In another scenario, theCDW instability is induced by the nesting of van Hove singularities or saddlepoints in the band structure if they are within a few kBTCDW of the Fermienergy.[33]
The Fermi surface of the 2H dichalcogenides is rather complicated, beingdominated by several open (2D-like) sheets and one small 3D S(Se)-derivedpancake-like Fermi surface.[29] In such a situation, one may anticipate anisotropicproperties and in particular, an anisotropic electron-phonon coupling. The re-sistivity anisotropy, of the order of 10-50, is much smaller than in layered oxides,indicating a substantial inter-layer hopping.[34] Transport properties show rel-atively small anomalies at TCDW , suggesting that only a small portion of theFermi surface becomes gapped in the CDW state. In addition, the 2H dichalco-genides become better conducting in the CDW state, indicating a higher degreeof coherence.
Several ARPES studies of the dichalcogenides have measured the form orshape of the Fermi surface, the focus being on the identification of the appro-priate nesting vector associated with the CDW. In figure 7 we reproduce theresults of a recent study showing the measured Fermi surfaces of both TaSe2
and NbSe2.[35] The figure also shows superimposed the results of a simple tightbinding fit by the authors of the study to the electronic structure.
Our own study of TaSe2 [12] found, as in earlier studies, [36, 37, 38]that thehole pocket at the center of the zone remains ungapped even in the CDW state.However the studies of the electronic states forming this Fermi surface foundstrong evidence of the formation of the CDW state as shown in figure 8. The
11
Figure 7: EF -ARPES intensity maps of (a) 2H-TaSe2 and (b) 2H-NbSe2, mea-sured in the normal states at 125 and 65 K, respectively (hν =100 eV). Rawdata are shown in the upper right quadrants. The rest of the data is obtainedby mirror symmetry operations. The intensity value at each k point is normal-ized by the intensity integrated over the occupied transition-metal d bandwidth(∼400 meV). The darker grayscale indicates higher photoemission intensity. Thesmall-dotted hexagons are the Brillouin-zone scheme for the 3 × 3 superlattice.Short and long dashed lines: Simulated Fermi contours of two transition-metald-derived bands. Solid lines in the lower right quadrants: Umklapp shiftedFermi contours. (reproduced from Ref. [35])
12
Figure 8: The photoemission intensity in the CDW state (T = 34 K) as afunction of binding energy and momentum along the line indicated in the insetby the double-headed arrow. The intensity is represented by a false color map,with yellow and white representing the highest intensity. The dispersing stateis a part of the hole like Fermi surface SC , centered at Γ. This Fermi surfaceis not gapped in the CDW state. (b) EDCs, measured for several momenta asdiscussed in the text.
figure shows the photoemission intensity, recorded in the CDW state at T = 34K, as a function of binding energy and momentum along the line through thetwo-dimensional Brillouin zone indicated in the inset of the figure. A band isobserved crossing the Fermi level at a point on the hole-like Fermi surface SC ,centered at Γ. The Fermi surface of dichalgogenides is double walled, suggestingthat every band should be split into two.[36, 37] Indeed, in our own study [12]we detected both bands and observed that the splitting, as well as the relativeintensity of the two bands, is strongly dependent on momentum, photon energy,polarization and surface quality. In some circumstances, only one band canbe observed. However, when both bands are well resolved, they show similarbehavior in the vicinity of the Fermi level and similar self-energy corrections.Therefore the presence (or absence) of the second band would appear irrelevant.The most remarkable feature in figure 8 is the ”kink” in the band’s dispersion,accompanied by a sharpening in the vicinity of the Fermi level. The figure alsoshows EDC cuts through the intensity at constant momenta. In this energyrange, the EDCs show a two-peaked structure, behavior that is again charac-teristic of the interaction of the photohole with some excitation of the systemwith energy range limited approximately to the energy scale of the kink. Asdiscussed earlier and presented in equation (4), the real and imaginary com-ponents of the self-energy, Σ1(ω) and Σ2(ω), can be extracted directly froma momentum-distribution curve. The fitting is possible without imposing anyparticular model for the interaction. The non- interacting dispersion in figure 8
13
Figure 9: MDCs, measured at different binding energies (symbols), fitted with amomentum-independent spectral function (solid lines) as discussed in the text.
14
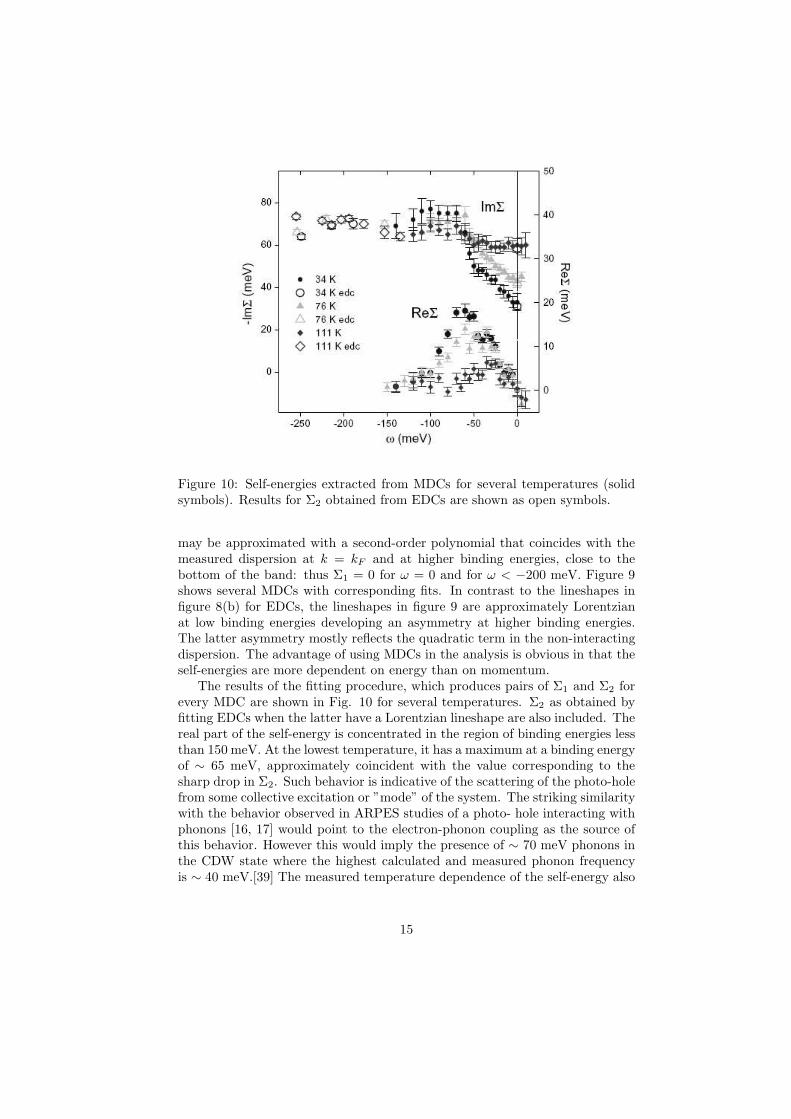
Figure 10: Self-energies extracted from MDCs for several temperatures (solidsymbols). Results for Σ2 obtained from EDCs are shown as open symbols.
may be approximated with a second-order polynomial that coincides with themeasured dispersion at k = kF and at higher binding energies, close to thebottom of the band: thus Σ1 = 0 for ω = 0 and for ω < −200 meV. Figure 9shows several MDCs with corresponding fits. In contrast to the lineshapes infigure 8(b) for EDCs, the lineshapes in figure 9 are approximately Lorentzianat low binding energies developing an asymmetry at higher binding energies.The latter asymmetry mostly reflects the quadratic term in the non-interactingdispersion. The advantage of using MDCs in the analysis is obvious in that theself-energies are more dependent on energy than on momentum.
The results of the fitting procedure, which produces pairs of Σ1 and Σ2 forevery MDC are shown in Fig. 10 for several temperatures. Σ2 as obtained byfitting EDCs when the latter have a Lorentzian lineshape are also included. Thereal part of the self-energy is concentrated in the region of binding energies lessthan 150 meV. At the lowest temperature, it has a maximum at a binding energyof ∼ 65 meV, approximately coincident with the value corresponding to thesharp drop in Σ2. Such behavior is indicative of the scattering of the photo-holefrom some collective excitation or ”mode” of the system. The striking similaritywith the behavior observed in ARPES studies of a photo- hole interacting withphonons [16, 17] would point to the electron-phonon coupling as the source ofthis behavior. However this would imply the presence of ∼ 70 meV phonons inthe CDW state where the highest calculated and measured phonon frequencyis ∼ 40 meV.[39] The measured temperature dependence of the self-energy also
15
-0.2
-0.1
0.0
k
ω (
eV
)
3
-0.2
-0.1
0.0
k
ω (
eV
)
1 2
-0.2
-0.1
0.0
k
ω (
eV
)
-0.2
-0.1
0.0
k
ω (
eV
)
6 8 97
-0.2
-0.1
0.0
k
ω (
eV
)
4 5
Γ→Γ→
Γ→←Κ
←M
Γ(A)
K(H)
M(L)23
5
4 1
6 7 8 9
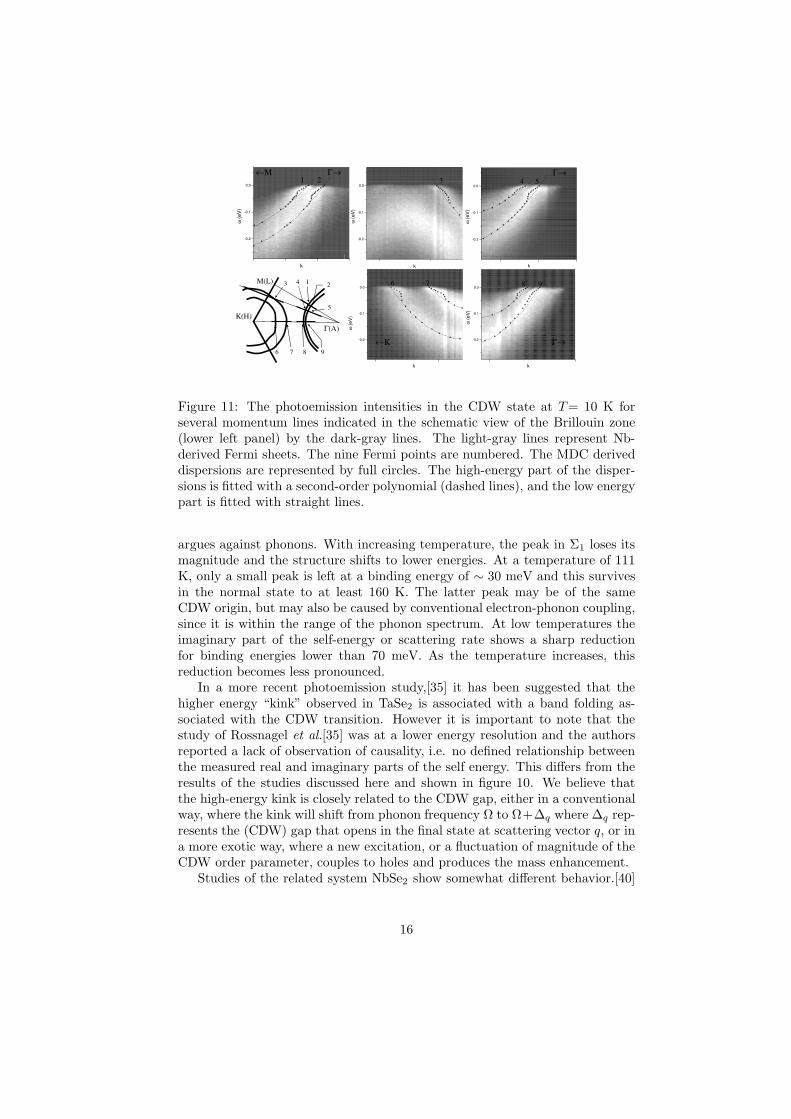
Figure 11: The photoemission intensities in the CDW state at T= 10 K forseveral momentum lines indicated in the schematic view of the Brillouin zone(lower left panel) by the dark-gray lines. The light-gray lines represent Nb-derived Fermi sheets. The nine Fermi points are numbered. The MDC deriveddispersions are represented by full circles. The high-energy part of the disper-sions is fitted with a second-order polynomial (dashed lines), and the low energypart is fitted with straight lines.
argues against phonons. With increasing temperature, the peak in Σ1 loses itsmagnitude and the structure shifts to lower energies. At a temperature of 111K, only a small peak is left at a binding energy of ∼ 30 meV and this survivesin the normal state to at least 160 K. The latter peak may be of the sameCDW origin, but may also be caused by conventional electron-phonon coupling,since it is within the range of the phonon spectrum. At low temperatures theimaginary part of the self-energy or scattering rate shows a sharp reductionfor binding energies lower than 70 meV. As the temperature increases, thisreduction becomes less pronounced.
In a more recent photoemission study,[35] it has been suggested that thehigher energy “kink” observed in TaSe2 is associated with a band folding as-sociated with the CDW transition. However it is important to note that thestudy of Rossnagel et al.[35] was at a lower energy resolution and the authorsreported a lack of observation of causality, i.e. no defined relationship betweenthe measured real and imaginary parts of the self energy. This differs from theresults of the studies discussed here and shown in figure 10. We believe thatthe high-energy kink is closely related to the CDW gap, either in a conventionalway, where the kink will shift from phonon frequency Ω to Ω+∆q where ∆q rep-resents the (CDW) gap that opens in the final state at scattering vector q, or ina more exotic way, where a new excitation, or a fluctuation of magnitude of theCDW order parameter, couples to holes and produces the mass enhancement.
Studies of the related system NbSe2 show somewhat different behavior.[40]
16
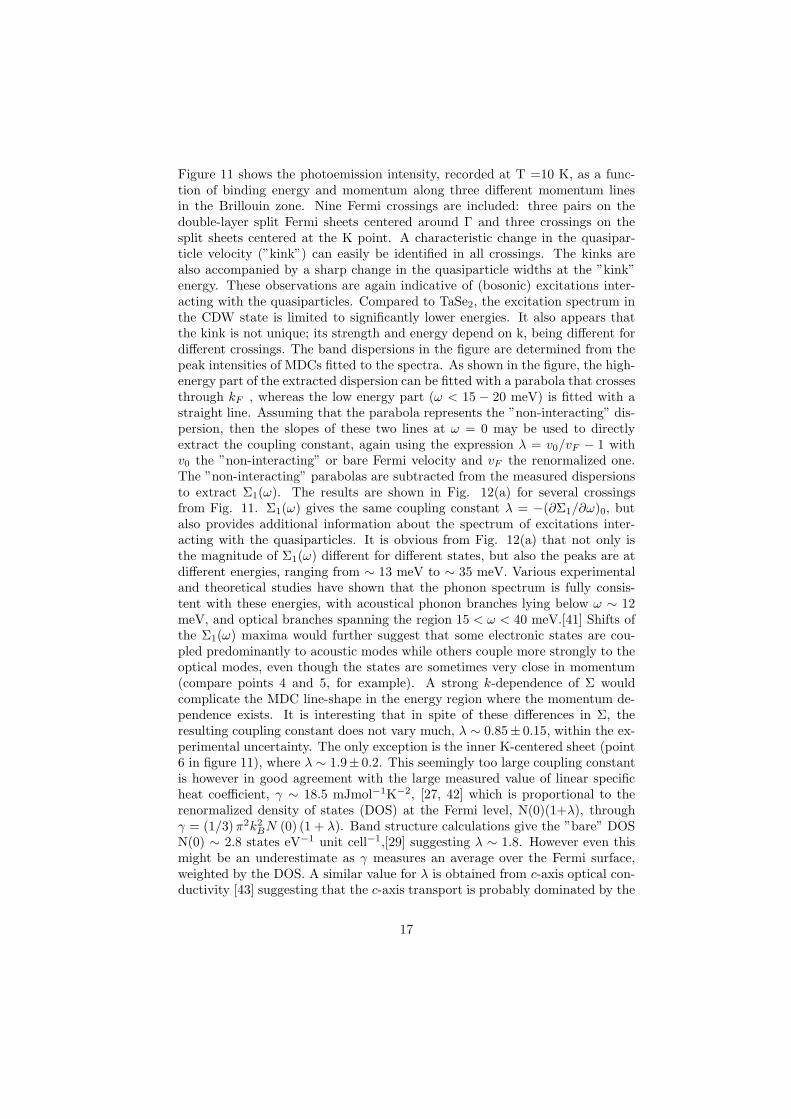
Figure 11 shows the photoemission intensity, recorded at T =10 K, as a func-tion of binding energy and momentum along three different momentum linesin the Brillouin zone. Nine Fermi crossings are included: three pairs on thedouble-layer split Fermi sheets centered around Γ and three crossings on thesplit sheets centered at the K point. A characteristic change in the quasipar-ticle velocity (”kink”) can easily be identified in all crossings. The kinks arealso accompanied by a sharp change in the quasiparticle widths at the ”kink”energy. These observations are again indicative of (bosonic) excitations inter-acting with the quasiparticles. Compared to TaSe2, the excitation spectrum inthe CDW state is limited to significantly lower energies. It also appears thatthe kink is not unique; its strength and energy depend on k, being different fordifferent crossings. The band dispersions in the figure are determined from thepeak intensities of MDCs fitted to the spectra. As shown in the figure, the high-energy part of the extracted dispersion can be fitted with a parabola that crossesthrough kF , whereas the low energy part (ω < 15 − 20 meV) is fitted with astraight line. Assuming that the parabola represents the ”non-interacting” dis-persion, then the slopes of these two lines at ω = 0 may be used to directlyextract the coupling constant, again using the expression λ = v0/vF − 1 withv0 the ”non-interacting” or bare Fermi velocity and vF the renormalized one.The ”non-interacting” parabolas are subtracted from the measured dispersionsto extract Σ1(ω). The results are shown in Fig. 12(a) for several crossingsfrom Fig. 11. Σ1(ω) gives the same coupling constant λ = −(∂Σ1/∂ω)0, butalso provides additional information about the spectrum of excitations inter-acting with the quasiparticles. It is obvious from Fig. 12(a) that not only isthe magnitude of Σ1(ω) different for different states, but also the peaks are atdifferent energies, ranging from ∼ 13 meV to ∼ 35 meV. Various experimentaland theoretical studies have shown that the phonon spectrum is fully consis-tent with these energies, with acoustical phonon branches lying below ω ∼ 12meV, and optical branches spanning the region 15 < ω < 40 meV.[41] Shifts ofthe Σ1(ω) maxima would further suggest that some electronic states are cou-pled predominantly to acoustic modes while others couple more strongly to theoptical modes, even though the states are sometimes very close in momentum(compare points 4 and 5, for example). A strong k-dependence of Σ wouldcomplicate the MDC line-shape in the energy region where the momentum de-pendence exists. It is interesting that in spite of these differences in Σ, theresulting coupling constant does not vary much, λ ∼ 0.85± 0.15, within the ex-perimental uncertainty. The only exception is the inner K-centered sheet (point6 in figure 11), where λ ∼ 1.9± 0.2. This seemingly too large coupling constantis however in good agreement with the large measured value of linear specificheat coefficient, γ ∼ 18.5 mJmol−1K−2, [27, 42] which is proportional to therenormalized density of states (DOS) at the Fermi level, N(0)(1+λ), throughγ = (1/3)π2k2
BN (0) (1 + λ). Band structure calculations give the ”bare” DOSN(0) ∼ 2.8 states eV−1 unit cell−1,[29] suggesting λ ∼ 1.8. However even thismight be an underestimate as γ measures an average over the Fermi surface,weighted by the DOS. A similar value for λ is obtained from c-axis optical con-ductivity [43] suggesting that the c-axis transport is probably dominated by the
17
-200 -150 -100 -50 0
0
5
10
15
20
ω (meV)
34 K
76 K
112 K
Re
Σ (
me
V)
0
5
10
15
20
8 K
49 K
TaSe2
NbSe2
c)
b)
-150 -100 -50 0
0
10
20
30
point 1
point 3
point 4
point 5
point 6
point 7
Re
Σ (
me
V)
ω (meV)
a)
Figure 12: (a) Real parts of self-energies, ReΣ, extracted from measured disper-sions from Fig. 11 for several Fermi points. Temperature dependence of Σ1(ω)for (b) NbSe2 for point 1 from Fig. 11 and for (c) TaSe2 near the same regionon the Γ-centered Fermi surface reproduced from figure 10 for comparison.
K-H centered cylinders with largest warping.It is instructive that in TaSe2 the CDW gap opens up in the same region
of the Fermi surface,[35, 37, 44] while the Γ-A centered Fermi cylinders remainungapped, and gain coherence in the CDW state.[12] It therefore seems plausiblethat both the superconductivity and the CDW state originate from the inner Ksheet and are driven by strong electron-phonon coupling. This seems to be inline with the original suggestion of Wilson [31] that the self-nesting of the innerK sheet drives the CDW in the 2H-dichalcogenides. A lack of CDW gap on theΓ centered sheets in all the 2H-dichalcogenides studied in ARPES suggests thatthese sheets support neither the self-nesting nor the nesting which would mixthem with the K-centered sheets. In particular, a proposed f -wave symmetryfor the CDW gap [23] may be ruled out. The relative strength of the CDWand superconducting ordering is determined by the nesting properties of theinner K cylinder, while the upper limit for TC (when the CDW is destroyed byapplying pressure, for example) is given by λ. Nesting weakens with increasing3D character (increased warping with kZ) under pressure and on moving fromTaSe2 to NbS2. The coupling constant, λ increases from TaSe2 to NbSe2 andis only weakly pressure dependent. ARPES studies of NbSe2,[30] [45] [46] haveshown no evidence of a CDW gap suggesting that the nested portion of theFermi surface is small and not sampled. However as there is a non-trivial kZ-dispersion or warping in this material, it is possible that the in-plane kF mightbe tuned into a nesting configuration and that the gap opens only near certainkZ . Note that the energy splitting between the double walled sheets is largerfor K-centered sheets. A similar k -dependence is also expected for the interlayer
18
hopping, t⊥, that produces the warping. Additionally, as the Fermi velocitiesare larger for Γ- centered sheets, it is reasonable to expect that the in-plane kF
varies with kZ much less on the Γ-cylinders than on the K-cylinders (the changein the in-plane Fermi momentum is approximately given by ∆kF ∝ t⊥/vF ).The measured Fermi surfaces centered at Γ are too large at the sampled kZ ,and are therefore not expected to ever reach the self-nesting condition 2kF =qCDW . On the other hand, the inner K-centered sheet seems to be very close toproducing the required nesting. It is interesting to note that according to STMstudies,[47] the CDW gap is large (∆CDW ∼ 35 meV) and should be easilymeasurable in ARPES. The overall electronic properties in NbSe2 are muchless sensitive to the CDW transition than in TaSe2. Even the CDW inducedstructure in the self-energy that existed in TaSe2 is absent in NbSe2. Both the”kink” and the scattering rate are remarkably insensitive to the CDW (See Fig.12 b), an observation that is consistent with the relative positions of NbSe2 andTaSe2 in figure 6.
5 Magnetic systems
In magnetic systems, aside from phonon scattering, the possibility also existsfor scattering from spin excitations. Such effects have been found in photoemis-sion studies of gadolinium[48] [49] and of iron.[50] The spin dependent electronicstructure of these materials has been studied with spin-resolved photoemission.[51]However there has only been one such study with sufficiently high energy reso-lution to examine in detail the spin resolved self-energy effects. That is a studyof gadolinium.[49]
The ground state of gadolinium is ferromagnetic with a Curie temperatureTC of 293 K. The (0001) surface of this material has been shown both theoret-ically [52] and experimentally [53] to support a surface state derived from theGd 5d orbitals. The state, which is spin polarized through an exchange interac-tion with the localized 4f orbitals has an important history and indeed it wasspin-resolved photoemission studies of the surface state that finally confirmedthat the surface moments were ferromagnetically aligned with the bulk of thematerial.[54]
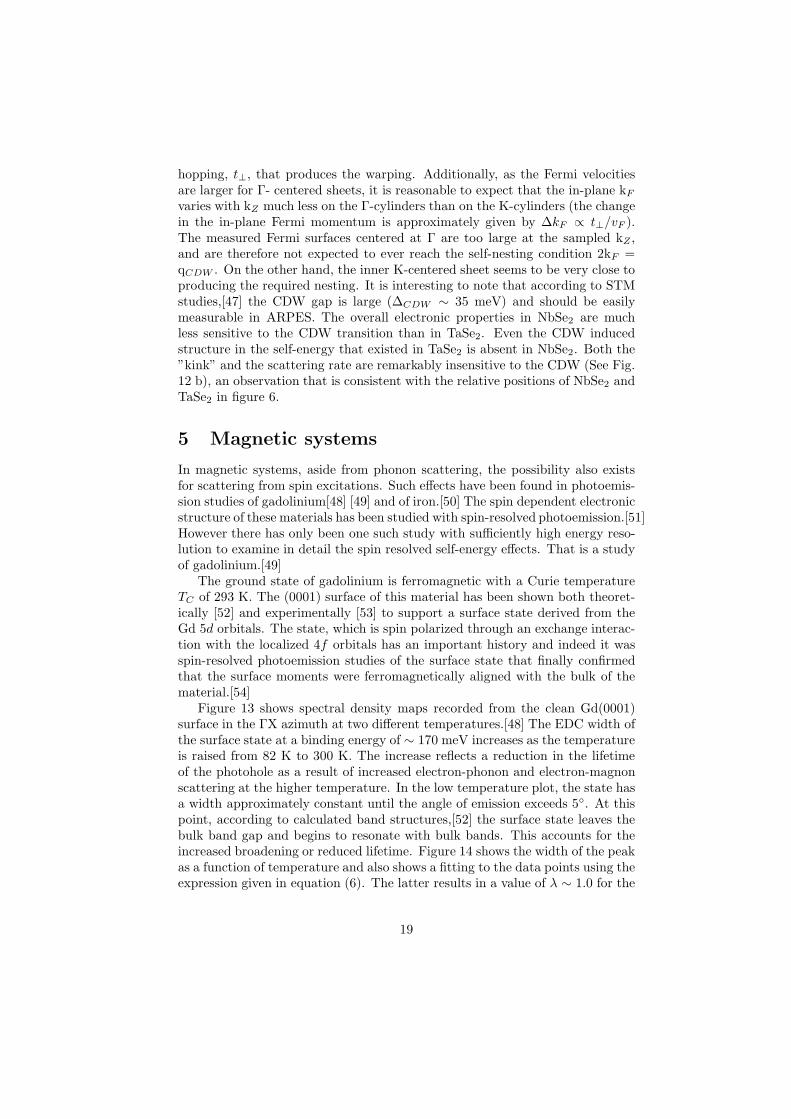
Figure 13 shows spectral density maps recorded from the clean Gd(0001)surface in the ΓX azimuth at two different temperatures.[48] The EDC width ofthe surface state at a binding energy of ∼ 170 meV increases as the temperatureis raised from 82 K to 300 K. The increase reflects a reduction in the lifetimeof the photohole as a result of increased electron-phonon and electron-magnonscattering at the higher temperature. In the low temperature plot, the state hasa width approximately constant until the angle of emission exceeds 5. At thispoint, according to calculated band structures,[52] the surface state leaves thebulk band gap and begins to resonate with bulk bands. This accounts for theincreased broadening or reduced lifetime. Figure 14 shows the width of the peakas a function of temperature and also shows a fitting to the data points using theexpression given in equation (6). The latter results in a value of λ ∼ 1.0 for the
19
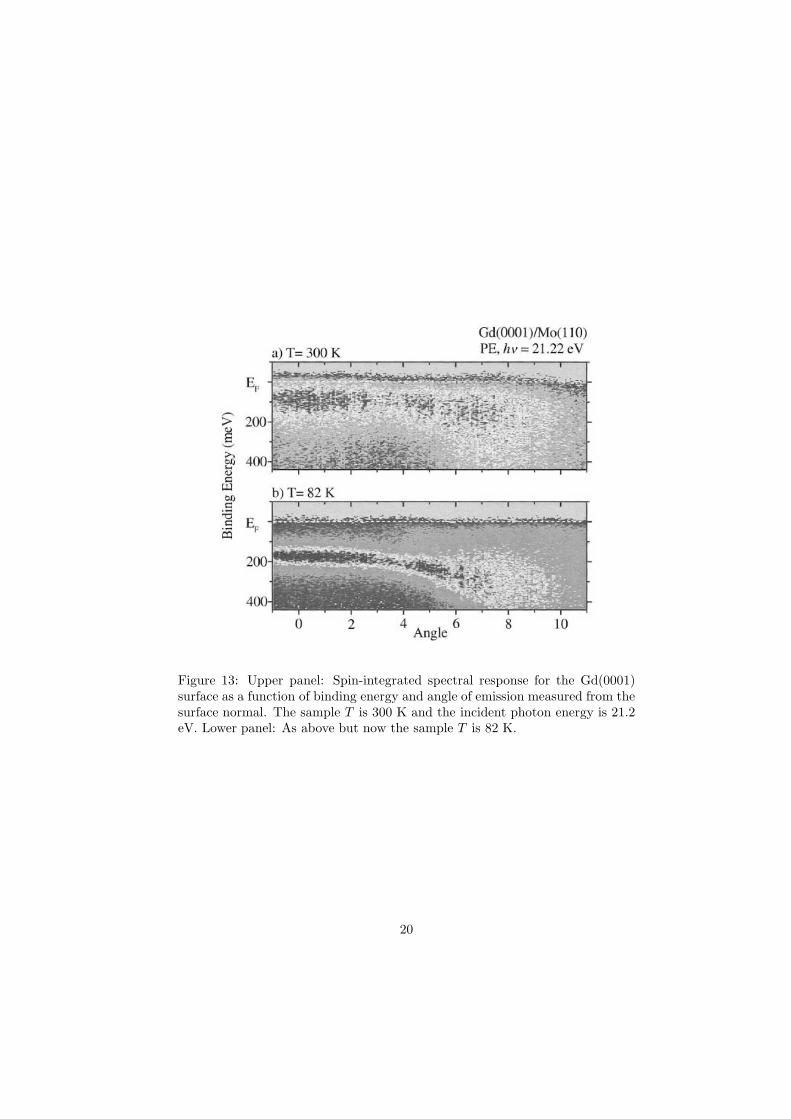
Figure 13: Upper panel: Spin-integrated spectral response for the Gd(0001)surface as a function of binding energy and angle of emission measured from thesurface normal. The sample T is 300 K and the incident photon energy is 21.2eV. Lower panel: As above but now the sample T is 82 K.
20
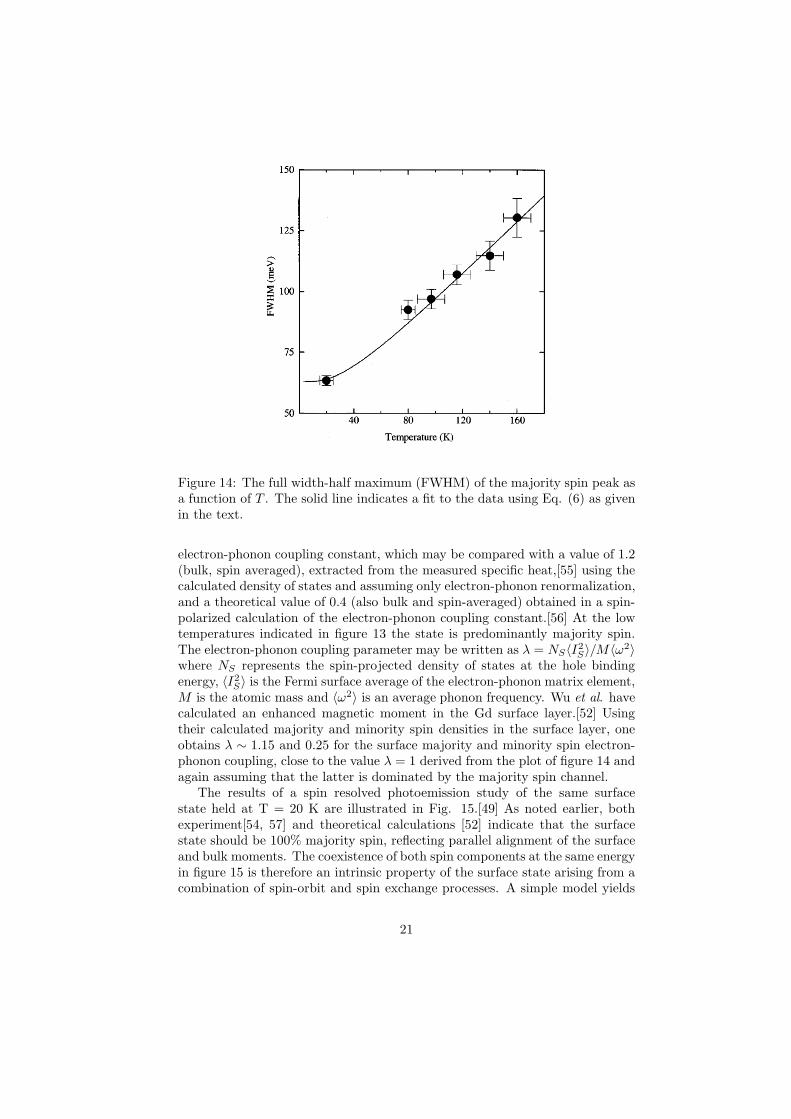
Figure 14: The full width-half maximum (FWHM) of the majority spin peak asa function of T . The solid line indicates a fit to the data using Eq. (6) as givenin the text.
electron-phonon coupling constant, which may be compared with a value of 1.2(bulk, spin averaged), extracted from the measured specific heat,[55] using thecalculated density of states and assuming only electron-phonon renormalization,and a theoretical value of 0.4 (also bulk and spin-averaged) obtained in a spin-polarized calculation of the electron-phonon coupling constant.[56] At the lowtemperatures indicated in figure 13 the state is predominantly majority spin.The electron-phonon coupling parameter may be written as λ = NS〈I2
S〉/M〈ω2〉where NS represents the spin-projected density of states at the hole bindingenergy, 〈I2
S〉 is the Fermi surface average of the electron-phonon matrix element,M is the atomic mass and 〈ω2〉 is an average phonon frequency. Wu et al. havecalculated an enhanced magnetic moment in the Gd surface layer.[52] Usingtheir calculated majority and minority spin densities in the surface layer, oneobtains λ ∼ 1.15 and 0.25 for the surface majority and minority spin electron-phonon coupling, close to the value λ = 1 derived from the plot of figure 14 andagain assuming that the latter is dominated by the majority spin channel.
The results of a spin resolved photoemission study of the same surfacestate held at T = 20 K are illustrated in Fig. 15.[49] As noted earlier, bothexperiment[54, 57] and theoretical calculations [52] indicate that the surfacestate should be 100% majority spin, reflecting parallel alignment of the surfaceand bulk moments. The coexistence of both spin components at the same energyin figure 15 is therefore an intrinsic property of the surface state arising from acombination of spin-orbit and spin exchange processes. A simple model yields
21
Figure 15: Spin-resolved photoemission spectra recorded from the Gd(0001) sur-face at 20 K. The upper and lower spectra represent the emission in the majority-and minority-spin channels, respectively. The lines indicate Lorentzian fits tothe spectra superimposed on appropriate backgrounds. The inset shows therelative intensities in the two spin channels.
a polarization P = ∆/√
∆2 + ξ2 for each quasiparticle state. With a spin-orbitparameter ξ = 0.3 eV and an exchange splitting ∆ = 0.7 eV at 0 K, we get aspin-orbit induced mixing R = (n+/n−) = (1-P)/(1+P) ∼ 5%. Here n+ andn− represent the number of electrons with spin-up and spin-down, respectively.R increases to 8% at T=150 K as the exchange splitting between the occupiedand unoccupied surface states gets smaller.[58]
Fitting the spectra in figure 15 with Lorentzian line shapes shows that theminority spin peak has a larger width than its majority spin counterpart, 116meV as opposed to 86 meV. Removing the contribution from the experimentalresolution, these widths become approximately 105 meV in the minority spinchannel and 70 meV in the majority channel. Electron-phonon, electron-magnonand electron-electron scattering each give distinct spin dependent contributionsto the scattering rate. Electron-electron scattering by exchange processes favorsthe two holes in the final state being of opposite spin.[59] From considerationof the total density of states in the spin channels, we estimate the scatteringrate from this process to be equal for a majority spin hole and a minority spin
22
hole. The electron-phonon and impurity scattering rate are proportional tothe density of states at the hole binding energy for the same spin while theelectron-magnon rate is proportional to the density of states for the oppositespin. Since the majority-spin density of states is large while the minority-spinpart is small, impurity and electron-phonon scattering should be more importantin the majority spin channel. The observation that the minority spin channel isbroader suggests electron-magnon scattering is the dominant decay mechanism.At T=0 K, the minority-spin component of a photo-hole can scatter to themajority spin component of a hole state higher in the surface band by emitting aspin wave (tilting the spins of the localized f -electrons). The corresponding spin-flip process is not available to the majority-spin component of the photo-holeat T=0 because the localized f -spins have saturated magnetization and are notable to tilt upwards when the hole tilts down. At higher temperatures, inelasticscattering can occur back and forth between the two spin channels mediatedby the emission or absorption of magnons, but the minority-spin componentalways has the higher density of final states to scatter into. An approximatetreatment[60] using the “s − f ” Hamiltonian[61] found the result
h/τ(↓) =
√3
4
P ′(↑)m∗
S
(
2JSa
h
)2
(9)
for the decay of the minority (↓) spin component due to spin flip scatteringwith magnon emission. Here J is the s − f exchange parameter giving theexchange splitting 2JS = 0.65 eV measured for the surface state,[58] m∗ =1.21me is the effective mass measured for the surface band, and P ′ (↑)= 0.87is the experimentally measured majority component of the band. With S =7/2 and a = 3.6 A, h/τ (↓) ≈ 0.095 eV. Conversely, replacement of P ′(↑) byP ′(↓) = 1 − P ′(↑) gives h/τ (↓) ≈ 0.014 eV for the majority spin component.Thus at low T , the majority spin channel is dominated by electron-phononscattering whereas the minority spin channel is dominated by electron-magnonscattering. Based on the relative spin-dependent densities of states it is possibleto provide estimates of the contribution of phonon scattering in the two spinchannels. These would be 46 meV in the majority spin channel and 10 meV inthe minority spin channel, leaving approximately 10 meV in each channel dueto impurity scattering, probably from hydrogen as in the case of molybdenumdiscussed earlier.
It is interesting to note that when looking at unoccupied states the converseshould be true.[62] At low temperatures, an electron added to an unoccupiedminority spin band should decay preferentially via phonon scattering and anadditional excited electron in a majority spin band should decay preferentiallyvia magnon scattering.
Although non-spin resolved, another study has examined the possibility ofscattering from spin excitations in the ferromagnetic material iron.[50] In studiesof the Fe(001) surface Schafer et al identified a mass renormalization up to abinding energy of 120 meV. The latter energy was too large to be associatedwith phonons (Debye energy, θD ∼ 39 meV) and thus the authors identified the
23
T
x
AF Superconductivity
Pseudogap
Cu O
(a) (b)
Figure 16: A schematic phase diagram showing the different ground states en-countered in the cuprates as a function of temperature and doping. (b) Theatomic layout of the copper oxygen planes that are thought to be responsiblefor the superconductivity in the cupartes.
self-energy corrections with scattering from spin excitations.
6 Studies of the High TC Superconductors
In this final section we discuss studies of the high TC superconductors andrelated compounds. As we have already noted, these materials discovered in1986 [63] have presented and continue to present some of the biggest chal-lenges in materials science today. ARPES with high energy and momentumresolution has emerged as one of the leading techniques for the study of suchmaterials. Indeed it was the drive to understand the high TC superconduc-tors that led to a renaissance in the use of ARPES. The technique has mademany important contributions to our understanding of these materials includingmeasurements of the anisotropy of both the superconducting gap [64] [65] andthe normal state “pseudogap”. [66, 67] More recently, the discovery of a massrenormalization,[9] evident in the dispersion in the vicinity of the Fermi level ofthe cuprate, Bi2Sr2CaCu2O8+δ, has led to renewed speculation about the ori-gin of high temperature superconductivity and the possibility that the observedrenormalization reflects coupling to some boson involved in the pairing.
Before discussing the renormalization effects in more detail we first reviewsome aspects of the high TC superconductors. It is generally accepted thatthe superconductivity in the cuprates evolves from a parent insulating state bydoping carriers into the 2-dimensional CuO2 planes. With half-filled band, theground state of the parent compound is an antiferromagnetic Mott insulator.With doping, the systems move from the antiferromagnetic state through toa regime where superconductivity is possible. The commonly accepted phasediagram for the cuprates is shown in figure 16(a). The materials exhibit super-
24
conductivity in the region under the dome. However in the underdoped region agap or “pseudogap” is observed in the normal state at temperatures well abovethe superconducting transition temperature, TC . At optimal doping correspond-ing to the maximum TC the materials are considered non-Fermi liquids in thenormal state. The structure of the Cu-O plane is shown in figure 16(b). In thesuperconducting state the order parameter has d-wave symmetry. In terms ofthe Cu-O plane, the d-wave symmetry is reflected in the gap being maximumin the copper oxygen bond direction and non-existent in the direction alongthe diagonal or copper-copper direction. The latter corresponding to the (π, π)direction of the Brillouin zone is commonly referred to as the nodal directionand the former in the (π, 0) direction of the Brillouin zone as the anti-nodaldirection.
The first photoemission studies of the high TC superconductors [68] [69]identified the copper d-bands and in the case of YBa2Cu3O6+x, a Fermi level.[68]With improved crystals the superconducting gap was identified [70] followed bymeasurements of the anisotropy of the gap in the a-b plane associated with the d-wave symmetry.[64, 65] These studies were extended to similar measurements ofthe anisotropy of a pseudogap observed in the normal state in the underdopedmaterials.[66, 67] There have also been a number of studies of the spectralfunction in the vicinity of the (π, 0) direction. In the superconducting state thisis characterized by a “peak dip hump” structure similar to that in the vicinityof the gap in a BCS like superconductor. As such, the observation has promotedconsiderable discussion along the lines of the BCS mechanism. Reviews of muchof this and previous work have been presented elsewhere.[71, 72]
In the present discussion we focus our attention on studies of the nodalregion, primarily because a mass renormalization observed in spectra recordedin that direction has all the hallmarks of the mass renormalizations that wehave discussed in earlier sections in this chapter. However, while we restrictour discussion to this region, observations in the nodal direction clearly haveimplications for observations throughout the zone.
The first high resolution study of the electronic structure in the nodal di-rection revealed a new feature, a mass enhancement of the low energy excita-tions immediately below the Fermi level.[9] The relevant spectral intensity plothas been shown earlier in figure 2. With certain assumptions about the non-interacting dispersion, the authors reported an increased effective mass m∗ suchthat m∗/mb ∼ 1.6 where mb represents the observed mass at higher bindingenergies. This observation has potentially important implications for the mech-anism driving high TC superconductivity and an obvious question is whether ornot it points to a BCS like mechanism whereby the electrons or renormalizationand associated ”kink” have become central issues in subsequent ARPES workwith considerable controversy regarding their source.[73, 74, 75, 76, 77] Are theyrelated to the presence of spin excitations or do they reflect an interaction withphonons or indeed any other collective mode? In the case of the cuprates, thisis not an easy issue to resolve as the various energy scales are nearly identical.However, there is broad agreement on the experimental observations.
All studies agree that the “coupling” is largest in the underdoped regime
25
OP91
0.00 0.05 0.10
70 K
130 K
k-kF (A
-1)
-200
-100
0
ω (
meV
)
UD69
0.00 0.05 0.10
-200
-100
0
45 K
108 K
k-kF (A
-1)
OD55
0.00 0.05 0.10
22 K
121 K
k-kF (A
-1)
Figure 17: Upper panels: two dimensional photoemission intensities observedfrom (a) underdoped (UD), (b) optimally doped (OP), and (c) overdoped (OD)samples. The superconducting transition temperatures are indicated. Lowerpanels: the dotted lines indicate the MDC deduced dispersions for both the su-perconducting (blue dots) and normal states (open red diamonds) correspondingto the different samples in the panels above.
as is evident in the spectra of figure 17.[76] By coupling we mean, as discussedabove, that the measured velocity is decreased compared to the bare velocityin the absence of coupling. However it has also been noted that the measuredFermi velocity shows little variation as a function of doping.[76] [78] Thus thebiggest change is not in the measured velocity, rather it is in the assumed barevelocity, i.e. the “bare” velocity is largest in the underdoped regime. This iscounterintuitive in that the underdoped regime is more insulating like and onewould naively anticipate that the velocity would be less. Experimentally theobservation of constant Fermi velocity is evident in spectra obtained from boththe Bi2Sr2CaCu2O8+δ [76] and L2−xSrxCuO4 [78] families. It is also reproducedin certain theoretical calculations.[79]
In examining the mass enhancement some groups have focused more closelyon the associated “kink” in the dispersion and suggested that its presence ata similar energy in studies of all of the different cuprates is an indication ofcoupling to a phonon mode.[75] Indeed neutron studies do indicate the presenceof phonon modes at similar energies.[80] The authors of these studies have alsosuggested that an “unconventional isotope effect” is an indication of the roleof phonons in that the substitution of O18 for O16 results in a change in thevelocity of the higher energy electrons as opposed to the lower energy electronsin the vicinity of the Fermi level.[81] If the phonons play any role in the su-perconductivity, this observation is again counterintuitive. However we notethat subsequent attempts to reproduce this effect have failed.[82] More recently,
26
0,π π,π
π,0
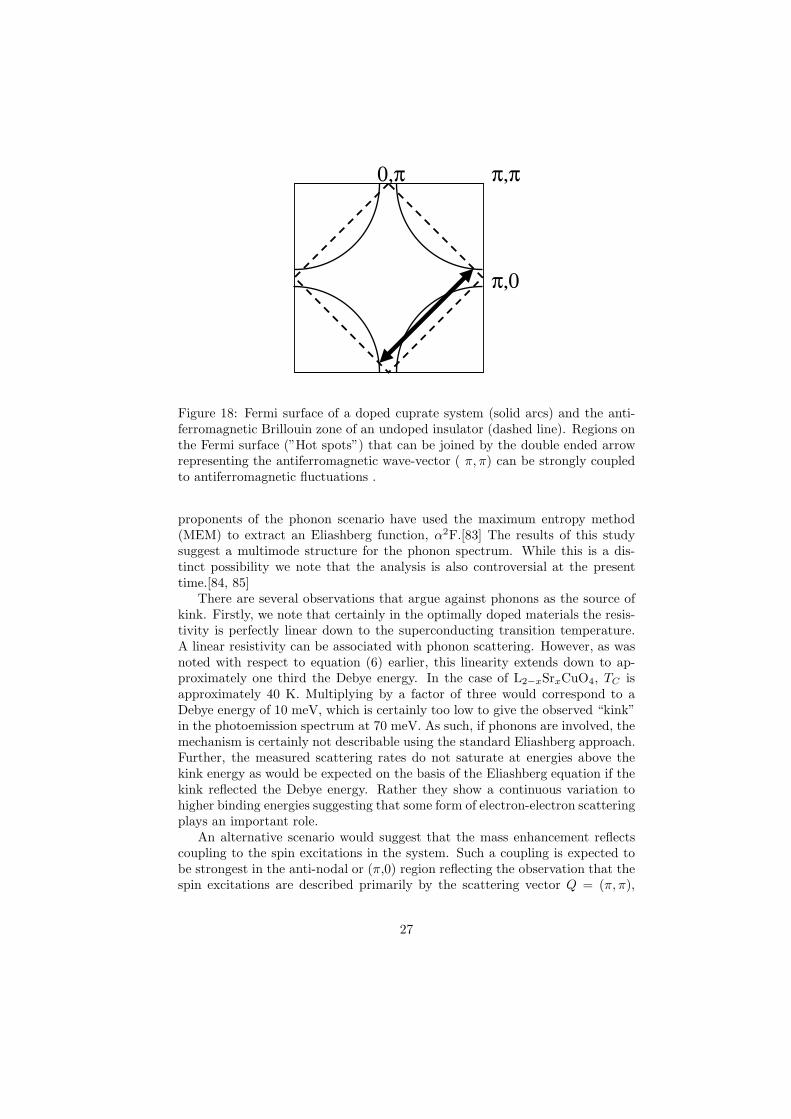
Figure 18: Fermi surface of a doped cuprate system (solid arcs) and the anti-ferromagnetic Brillouin zone of an undoped insulator (dashed line). Regions onthe Fermi surface (”Hot spots”) that can be joined by the double ended arrowrepresenting the antiferromagnetic wave-vector ( π, π) can be strongly coupledto antiferromagnetic fluctuations .
proponents of the phonon scenario have used the maximum entropy method(MEM) to extract an Eliashberg function, α2F.[83] The results of this studysuggest a multimode structure for the phonon spectrum. While this is a dis-tinct possibility we note that the analysis is also controversial at the presenttime.[84, 85]
There are several observations that argue against phonons as the source ofkink. Firstly, we note that certainly in the optimally doped materials the resis-tivity is perfectly linear down to the superconducting transition temperature.A linear resistivity can be associated with phonon scattering. However, as wasnoted with respect to equation (6) earlier, this linearity extends down to ap-proximately one third the Debye energy. In the case of L2−xSrxCuO4, TC isapproximately 40 K. Multiplying by a factor of three would correspond to aDebye energy of 10 meV, which is certainly too low to give the observed “kink”in the photoemission spectrum at 70 meV. As such, if phonons are involved, themechanism is certainly not describable using the standard Eliashberg approach.Further, the measured scattering rates do not saturate at energies above thekink energy as would be expected on the basis of the Eliashberg equation if thekink reflected the Debye energy. Rather they show a continuous variation tohigher binding energies suggesting that some form of electron-electron scatteringplays an important role.
An alternative scenario would suggest that the mass enhancement reflectscoupling to the spin excitations in the system. Such a coupling is expected tobe strongest in the anti-nodal or (π,0) region reflecting the observation that thespin excitations are described primarily by the scattering vector Q = (π, π),
27
0
25
50
75
100T
C=69 K, UD
45 K
108 K
45 K - 108 K
0
25
50 TC=91 K, OP
70 K
130 K
70 K - 130 K
Re
Σ (
meV
)
-250 -200 -150 -100 -50 0 50
0
25
50T
C~55 K, OD
ω (meV)
22 K
121 K
22 K - 121 K
Figure 19: Σ1 as a function of binding energy for the superconducting (bluedots) and normal states (open red diamonds) for the UD69, OP91, and OD55samples. The solid lines through the normal state data represent MFL fits tothe data. The difference between the superconducting and the normal Σ1 foreach level of doping is also plotted (green triangles). The lines through thelatter are Gaussian fits to extract the peak energy ωsc
0 .
28
0 50 100 150 200 250 300
40
50
60
70
80
Re
Σ
(me
V)
T (K)
Inte
nsity (
arb
. u
nits))(Re 0
sc
ωΣYBCO, INS resonance
Figure 20: Temperature dependence of Σ1(ωsc0 ) from the nodal line for an under-
doped sample with Tc = 69K (black squares) compared with the temperaturedependence of the intensity of the resonance mode observed in INS studies ofunderdoped YBa2Cu3O6+x, TC = 74 K (Ref. [90]) (gray circles).
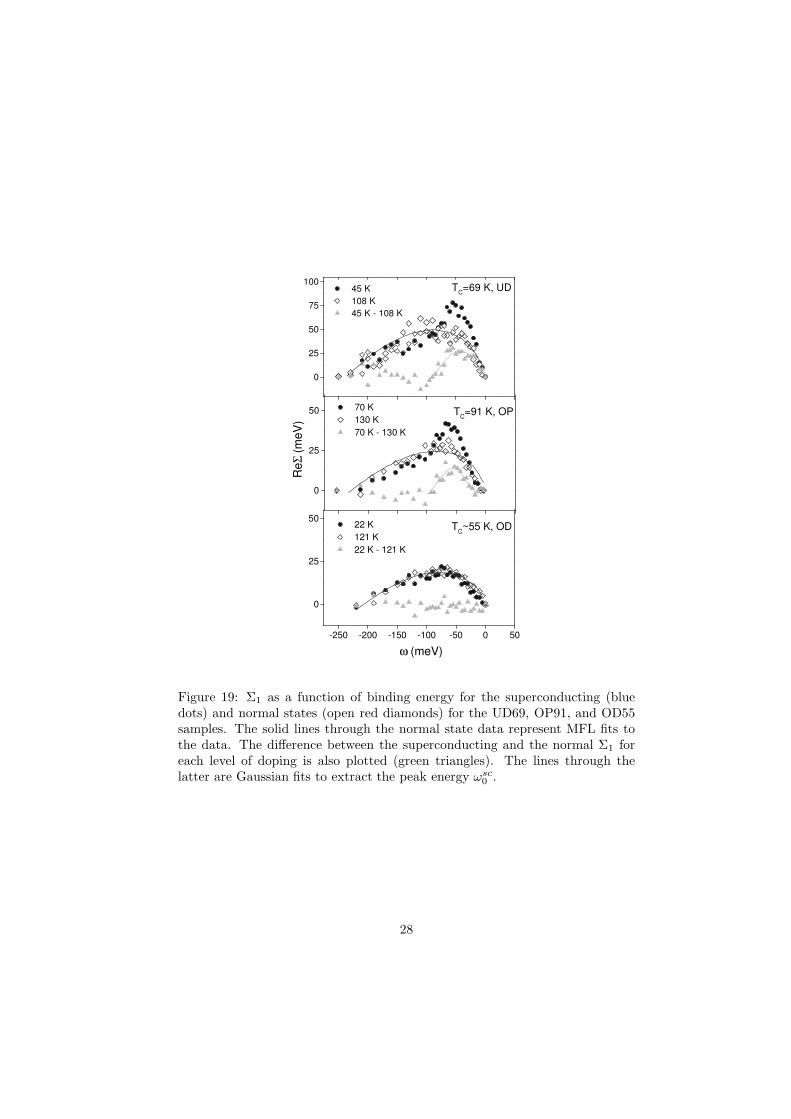
which couples the antinodal regions as shown if figure 18. However certainbehavior in the nodal region would appear to carry the hallmarks of such aninteraction. Examining figure 17 it is possible, with certain assumptions aboutthe bare velocities, to extract representative doping dependent real componentsof the self energy, Σ1. These are reproduced in figure 19 where for each dopinglevel the Σ1 corresponding to the superconducting state is compared to the Σ1
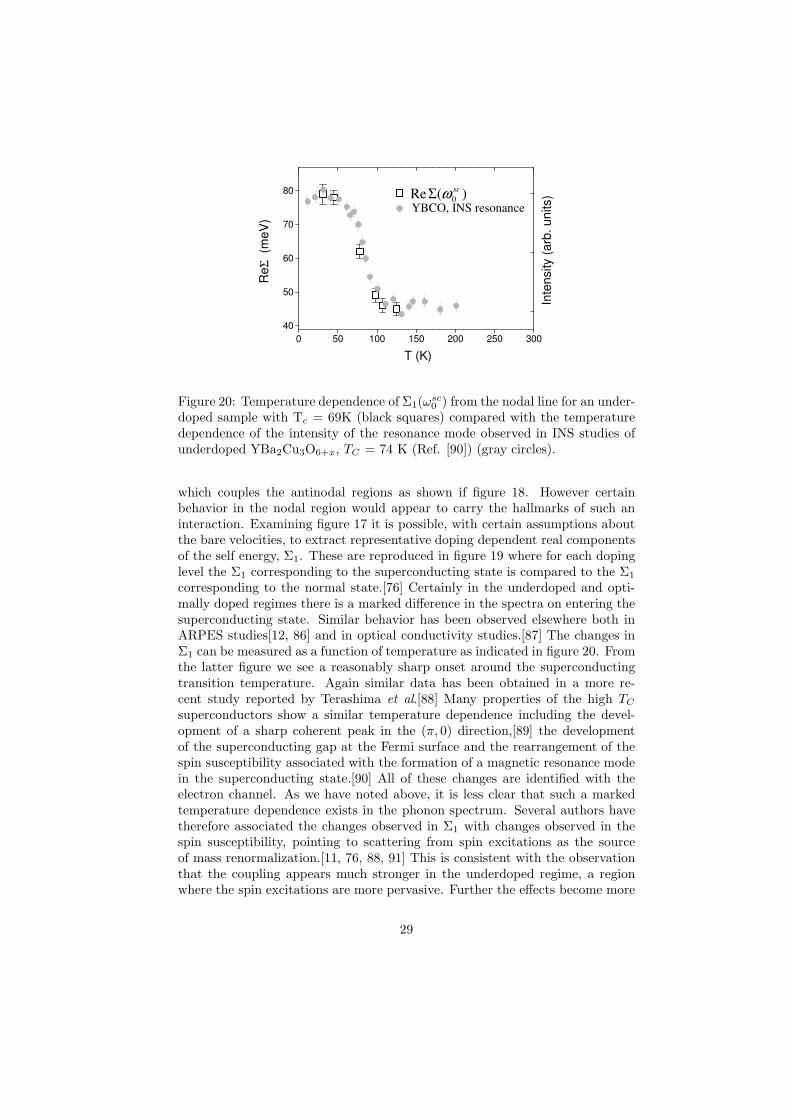
corresponding to the normal state.[76] Certainly in the underdoped and opti-mally doped regimes there is a marked difference in the spectra on entering thesuperconducting state. Similar behavior has been observed elsewhere both inARPES studies[12, 86] and in optical conductivity studies.[87] The changes inΣ1 can be measured as a function of temperature as indicated in figure 20. Fromthe latter figure we see a reasonably sharp onset around the superconductingtransition temperature. Again similar data has been obtained in a more re-cent study reported by Terashima et al.[88] Many properties of the high TC
superconductors show a similar temperature dependence including the devel-opment of a sharp coherent peak in the (π, 0) direction,[89] the developmentof the superconducting gap at the Fermi surface and the rearrangement of thespin susceptibility associated with the formation of a magnetic resonance modein the superconducting state.[90] All of these changes are identified with theelectron channel. As we have noted above, it is less clear that such a markedtemperature dependence exists in the phonon spectrum. Several authors havetherefore associated the changes observed in Σ1 with changes observed in thespin susceptibility, pointing to scattering from spin excitations as the sourceof mass renormalization.[11, 76, 88, 91] This is consistent with the observationthat the coupling appears much stronger in the underdoped regime, a regionwhere the spin excitations are more pervasive. Further the effects become more
29
pronounced on moving away from the nodal direction towards the (π, 0) direc-tion. This is evident in the measured momentum dependence of the change inthe Fermi velocity on entering the superconducting state[92] and is consistentwith the observation that the spin excitations are described primarily by thescattering vector Q = (π, π) coupling the antinodal regions.
7 Summary and outlook
The new experimental developments combined with new analysis methods haveallowed photoemission to become a powerful probe of the collective excitationsin condensed matter systems. We can anticipate that such studies will continueand be extended to an ever larger array of new materials. We can also anticipatethat the experimental capabilities will be improved. However this will not beeasy. The total energy resolution in any experiment is influenced by the energyspread in the incident light beam and the resolving power of the electron spec-trometer. These each present a challenge but not an insurmountable challenge.The temperature of the sample and also the quality of the sample surface willalso be reflected in the measured peak widths. These contributions are intrinsicand represent more of a challenge. It will be challenge to get the sample muchbelow 1 K but getting to low temperatures is worth the effort. It is a simplematter to show from equation (6) above that in the limit of 0 K the Eliashberg
function, α2F , is simply related to d∆k(ω)dω
where ∆k(ω) is the width of an MDCat binding energy ω. The problems associated with sample surface quality willbe somewhat alleviated in experiments that are less surface sensitive such asthe new laser based techniques.[93, 94]
Acknowledgments
We would like to acknowledge the many contributions of our collaborators on thework described here. These include A.V. Fedorov, S.L. Hulbert, P-A Glans, C.McGuinness, K.E. Smith. E.Y. Andrei, H. Berger, Q. Li, G.D. Gu, N. Koshizka,G. Reisfeld, J. Xue, F.J. DiSalvo, Z. Yusof, B.O. Wells, A.R. Moodenbaugh, C.Kendziora, S. Jian, D.G. Hinks, F. Liu, M. Weinert, T.E. Kidd and P.B. Allen.The research work described in this paper was supported by the Department ofEnergy under Contract No. DE-AC02-98CH10886.
30
References
[1] N. Martensson, P. Baltzer, P.A. Bruhweiler, J.-O. Forsell, A. Nilsson, A.Stenborg, and B. Wannberg, J. Electron Spectr. Relat. Phenom. , 70 117,(1994)
[2] J.G. Bednorz and K.A. Muller, Zeit. Phys. B, 64, 189 (1986)
[3] D. Pines and P. Nozieres, The Theory of Quantum Liquids (Benjamin, NewYork, 1969).
[4] N.V. Smith, P. Thiry, and Y. Petroff, Phys. Rev. B 47, 15476 (1993)
[5] G.D. Mahan, Many Particle Physics, Plenum Press, New York 1990.
[6] N. V. Smith et al, Phys. Rev. B 64, 155106 (2001).
[7] Angle-Resolved Photoemission, Ed. S. Kevan, Elsevier Amsterdam 1992.
[8] G. Grimvall, The Electron-Phonon Interaction in Metals (North- Holland,New York, 1981).
[9] T. Valla at al, Science 285, 2110 (1999);
[10] S. LaShell, E. Jensen and T. Balasubramanian, Phys. Rev. B 61, 2371(2000)
[11] A. Kaminski et al., Phys. Rev. Lett. 84, 1788 (2000)
[12] T. Valla et al, Phys. Rev. Lett. 85, 4759 (2000).
[13] A.A. Kordyuk et al., Phys. Rev. B, 71, 214513 (2005)
[14] B.A. McDougall, T. Balasubramanian and E. Jensen, Phys. Rev. B 51,13891 (1995)
[15] T. Balasubramanian, E. Jensen, X.L. Wu, and S.L. Hulbert, Phys. Rev B57, R6866 (1998)
[16] M. Hengsberger et al, Phys. Rev. Lett. 83, 592 (1999).
[17] T. Valla, A. V. Fedorov, P. D. Johnson and S. L. Hulbert, Phys. Rev. Lett.83, 2085 (1999)
[18] K. Jeong, R H. Gaylord and S. D. Kevan, Phys. Rev. B 38, 10302 (1988);K. Jeong, R H. Gaylord and S. D. Kevan, Phys. Rev. B 39, 2973 (1989).
[19] S. Y. Savrasov and D. Y. Savrasov, Phys. Rev. B 54, 16487 (1996).
[20] C. Hodges, H. Smith and J. W. Wilkins, Phys. Rev. B 4, 302 (1971).
[21] W. A. Harrison, Electronic Structure and the Properties of Solids (W. H.Freeman & Co, San Francisco, 1980).
31
[22] J. A. Wilson, F. J. Di Salvo and S. Mahajan, Phys. Rev. Lett. 32, 882(1974).
[23] A. H. Castro Neto, Phys. Rev. Lett. 86, 4382 (2001).
[24] F. Smith et al, J. Phys. C: Solid State Phys. 5, L230 (1972); C. Berthier,P. Molini’e and D. J’erome, Solid State Commun. 18, 1393 (1976); D. W.Murphy et al, J. Chem. Phys. 62, 967 (1975).
[25] P. Moline, D. Jerome and A. J. Grant, Phil. Mag. 30, 1091 (1974).
[26] H. Suderow, V.G. Tissen, J.P. Brisson, J.L. Martinez, and S. Vieira, Phys.Rev. Lett., 95, 117006 (2005)
[27] P. Garoche et al, Solid State Commun. 19, 455 (1976); D. Sanchez et al,Physica B 204, 167 (1995).
[28] J. E. Graebner and M. Robbins, Phys. Rev. Lett. 36, 422 (1976).
[29] R. Corcoran et al, J. Phys.: Condens.Matter 6, 4479 (1994).
[30] T. Yokoya et al, Science 294, 2518 (2001); T. Kiss et al, Physica B 312-313,666 (2002).
[31] J. A. Wilson, Phys. Rev. B 15, 5748 (1977).
[32] N. J. Doran et al, J. Phys. C 11, 699 (1978).
[33] T. M. Rice and G. K. Scott, Phys. Rev. Lett. 35, 120 (1975).
[34] B. Ruzicka at al, Phys. Rev. Lett. 86, 4136 (2001).
[35] K. Rossnagel, E. Rotenberg, H. Koh, N.V. Smith and L. Kipp, Phys. Rev.B, 72, 121103 (2005)
[36] R. Liu, C.G. Olson, W.C. Tonjes, and R.F. Frindt, Phys. Rev. Lett. 80,5762 (1998)
[37] R. Liu et al, Phys. Rev. B 61, 5212 (2000).
[38] Th. Straub et al, Phys. Rev. Lett. 82, 4504 (1999).
[39] G. Benedek et al, Europhys. Lett. 5, 253 (1988); G. Brusdeylins et al, Phys.Rev. B 41, 5707 (1990).
[40] T. Valla, A.V. Fedorov, P.D. Johnson, P-A Glans, C. McGuinness, K.E.Smith. E.Y. Andrei and H. Berger, Phys. Rev. Lett. 92, 086401 (2004)
[41] J. L. Feldman, Phys. Rev. B 25, 7132 (1982); G. Brusdeylins et al, Phys.Rev. B 41, 5707 (1990); Y. Nishio, J. Phys. Soc. Jpn. 63, 223 (1994).
[42] J. M. E. Harper, T. H. Geballe and F. J. DiSalvo, Phys. Rev. B 15, 2943(1977); K. Noto, N. Kobayashi and Y. Muto, Nuovo Cimento 38, 511 (1977).
32
[43] S. V. Dordevic, D. N. Basov, R. C. Dynes and E. Bucher, Phys. Rev. B 64,161103 (2001).
[44] R. Liu et al, Phys. Rev. B 61, 5212 (2000); A. V. Fedorov et al, unpublished.
[45] Th. Straub et al, Phys. Rev. Lett. 82, 4504 (1999).
[46] W. C. Tonjes et al, Phys. Rev. B 63, 235101 (2001).
[47] H. F. Hess et al, J. Vac. Sci. Technol. A 8, 450 (1990).
[48] A.V. Fedorov, T. Valla, D.J. Huang, G. Reisfeld, F. Loeb, F. Liu and P.D.Johnson, J. Elect. Spectr. And Relat. Phenom. 92, 19 1998.
[49] A.V. Fedorov, T. Valla, F. Liu, P.D. Johnson, M. Weinert and P.B. Allen,Phys. Rev. B 65, 212409 (2002)
[50] J. Schafer, D. Schrupp, E. Rotenberg, K. Rossnagel, H. Koh, P. Blaha andR. Claessen, Phys. Rev. Lett. 92, 97205 (2004)
[51] P.D. Johnson. Rep. Prog. Phys. 60, 1217-1304 (1997)
[52] R. Wu, C. Li, A.J. Freeman and C.L. Fu, Phys. Rev. B 44, 9400 (1991).
[53] D. Li, C.W. Hutchings, P.A. Dowben, C. Hwang, R.T. Wu, M. Oneelion,A.B. Andrews, J.L. Erskine, J. Magn. Magn. Mater. 99, 85 (1991)
[54] G.A. Mulhollan, K. Garrison and J.L. Erskine, Phys. Rev. Lett. 69, 3240(1992)
[55] P. Wells, P.C. Lanchester, P.W. Jones and R.G. Jordan, J. Phys. F, 4, 1729(1974)
[56] H.L. Skriver and I. Mertig, Phys. Rev. B 41, 6553 (1990)
[57] D. Li, J. Zhang, P.A. Dowben, K. Garrison, P.D. Johnson, H. Tang, T. G.Walker, H. Hopster, J.C. Scott, D. Weller and D.P. Pappas, Mat. Res. SocsProc. 313, 451 (1993)
[58] A.V. Fedorov, K. Starke and G. Kaindl, Phys. Rev. B 50, 2739 (1994); E.Weschke, C. Schussler- Langeheine, R. Meier, A.V. Fedorov, K. Starke, F.Hubinger and G. Kaindl, Phys. Rev. Lett. 77, 3415 (1996).
[59] B. Sinkovic, E. Shekel and S.L. Hulbert, Phys. Rev. B, 52, R15703 (1995).
[60] P.B. Allen, Phys. Rev. B 63, 214410 (2001)
[61] C. Zener, Phys. Rev. 81, 440 (1951); C. Zener, Phys. Rev. 82, 403 (1951);C. Zener, Phys. Rev. 83, 299 (1951).
[62] A. Rehbein, D. Wegner, G. Kaindl, and A. Bauer, Phys. Rev. B 67, 033403(2003)
33
[63] J.G. Bednorz and K.A. Muller, Z. Phys. B: Condens. Matter, 64, 189 (1986)
[64] Z.X. Shen, D.S. Dessau, B.O. Wells et al., Phys. Rev. Lett. 70, 1553 (1993)
[65] H. Ding et al., Phys Rev Lett., 74, 2784 (1995)
[66] A.G. Loeser et al., Science 273, 325 (1996)
[67] H. Ding et al., Nature 382, 51 (1996)
[68] B. Reihl, T. Riesterer, J.G. Bednorz and K.A. Muller, Phys. Rev. B 35,8804 (1987)
[69] P.D. Johnson, S.L. Qiu, L. Jiang, M.W. Ruckman, M. Strongin, S.L. Hul-bert, R.F. Garrett, B. Sinkovic, N.V. Smith, R.J. Cava, C.S. Jee, D.Nichols, Kaczanowicz, R.E. Salomon, and J.E. Crow, Phys. Rev. B 35,8811 (1987).
[70] C.G. Olsen et al., Science245, 731 (1989)
[71] A. Damascelli, Z. Hussain, and Z.-X. Shen, Rev. Mod. Phys. 75, 473 (2003)
[72] J.C. Campuzano, M.R. Norman and M Randeiria in Physics of Supercon-
ductors , Vol.II, ed K.H. Bennemann and J.B. Ketterson, Springer Berlin,2004 p. 167-272
[73] P. V. Bogdanov at al, Phys. Rev. Lett. 85, 2581 (2000)
[74] A. Kaminski et al, Phys. Rev. Lett. 86, 1070 (2001).
[75] A. Lanzara et al, Nature 412, 510 (2001).
[76] P. D. Johnson et al, Phys. Rev. Lett. 87, 177007 (2001).
[77] T. K. Kim et al, Phys. Rev. Lett. 91, 167002 (2003).
[78] X.J. Zhou et al., Nature 423, 398 (2003)
[79] M. Randeria, A. Paramekanti and N. Trivedi, Phys. Rev. B 69 144509(2004)
[80] R.J. McQueeney et al., Phys. Rev. lett. 82, 628 (1999)
[81] G.-H. Gweon et al., Nature, 430, 187 (2004)
[82] F. Douglas et al., to be published
[83] X.J. Zhou, Phys. Rev. Lett., 95, 117001 (2005)
[84] T. Valla, cond-mat/0501138 (2005)
[85] X.J. Zhou et al. cond-mat/0502040 (2005)
[86] T. Yamasaki et al., cond-mat/0603006 (2006)
34
[87] J. Hwang, T. Timusk and G.D. Gu, Nature, 427, 714, (2004)
[88] K. Terashima, H. Matsui, D. Hashimoto, T. Sato, T. Takahash, H. Ding,T. Yamamoto and K. Kadowaki, Nature Physics, 2, 27 (2006)
[89] A.V. Fedorov, T. Valla, P.D. Johnson, Q. Li, G.D. Gu and N. Koshizuka,Phys. Rev. Lett., 82, 2179 (1999)
[90] P. Dai et al, Science 284, 1346 (1999)
[91] T. Valla, Proceedings SPIE – Volume 5932, Strongly Correlated Electron
Materials: Physics and Nanoengineering, Ivan Bozovic, Davor Pavuna Ed-itors, 593203 (2005)
[92] T. Valla et al, Phys. Rev. Lett. 85, 828 (2000).
[93] T. Kiss et al., Phys Rev. Lett., 94, 057001(2005)
[94] J.D. Koralek et al., Phys. Rev. Lett. 96, 017005 (2006)
35