Embed Size (px)
Citation preview

International Conference on Renewable Energies and Power Quality (ICREPQ’17)
Malaga (Spain), 4th to 6th April, 2017 Renewable Energy and Power Quality Journal (RE&PQJ)
ISSN 2172-038 X, No.15 April 2017
PHOTODEGRADATION OF GLYCEROL USING NANOSTRUCTURED TiO2
CATALYST
E. Coser
1,2, A. Bervian
1, S. Khan
1, A. De León
3, J. Bussi
3, S. A. Pianaro
2, Otto, R. B.
4 , C. Aguzzoli
5 and C. F.
Malfatti1*
1 Metallurgical Department (DEMET), Pros-graduation Program in Mining Metallurgical and Materials
Laboratory of Corrosion Research (LAPEC), Federal University of Rio Grande do Sul (UFRGS)
Av. Bento Gonçalves, 9500 Porto Alegre (Brasil)
Phone/Fax number:+0051 3308407, e-mail: *[email protected], 2 Department of Materials Engineering (LIMAC), State University of Ponta Grossa (UEPG)
Av. Carlos Cavalcanti, 4748 Ponta Grossa (Brasil) 3 Surface Physical-chemistry Laboratory /DETEMA, Faculty of Chemistry, University of the Republic
Av. Gral. Flores, 2124 Montevideo (Uruguay) 4 Automation and Simulation of Electrical Systems Laboratory (Lasse)- Itaipu Technological Park (PTI)
Av. Tancredo Neves, 6731. Foz do Iguaçu - Paraná (Brazil)
Phone/Fax number: +55 45 3576.7200, e-mail: [email protected] 5 Programa de Pós-Graduação em Engenharia e Ciência dos Materiais - PGMAT, Universidade de
Caxias do Sul - UCS, Rua Francisco Getúlio Vargas, 1130 - Caxias do Sul, RS, Brazil.
Abstract. The rapid growth in the production of biodiesel
and it’s primary co-product, i.e. glycerol, has become an
environment concern. Currently, several processes have been
developed to convert glycerol to other compounds through
catalysis. Herein, nanotubular morphology of titanium dioxide
(TiO2) was obtained by electrochemical anodization and applied
in photocatalytic degradation of glycerol. Nanostructured TiO2
catalysts were obtained by anodization in glycerol-ethylene
glycol electrolyte containing ammonium fluoride at 60 V for
time durations of 60 and 120 minutes and crystallized through
thermal treatment at 450 °C for 3 h with a heating ramp of 10 ºC
min-1. The samples were characterized by FEG-SEM and XRD.
The performances of TiO2 nanotubular photoelectrodes were
evaluated via glycerol photodegradation and also for comparison
in photo-electrochemical water splitting. The TiO2 nanotubes
anodized for 120 minutes presented the best performance in both
tests that was related to their optimal morphology and charge
transportation.
Key words
Titanium dioxide nanostructures, glycerol
photodegradation, photocatalysis
1. Introduction
Glycerol (C3H8O3) is involuntarily produced as a by-
product during the synthesis of biodiesel. In general,
about 10 kg crude glycerol (CG) is produced for every
100 kg of biodiesel, causing adverse economic and
environmental effects. CG glycerol generated by
homogeneous base-catalyzed transesterification contains
glycerol, organic and inorganic salts, water, soap, alcohol,
traces of glycerides and vegetable colour [1],[2]. CG
refining to a high purity is too expensive, especially for
small and medium biodiesel producers [3]. To improve
the economic feasibility of the biodiesel industry,
alternate ways of using CG have recently been studied.
Possibilities such as combustion, chemical industry,
composting, animal feed, thermochemical conversion, and
biological conversion have been applied [4].
Heterogeneous photocatalysis is a novel technique
with a great potential for the degradation of hazardous
organic pollutants, heavy metals removal, inactivation of
microorganisms, and also for the water splitting reaction
to obtain hydrogen as a clean energy source [5],[6]. In this
technique UV–VIS photons are absorbed by a
semiconductor, whose band gap energy is equal to or
lower than the energy of the photons. The energy of the
absorbed photons promotes the passage of electrons from
the valence band of the semiconductor to its conduction
band. Electrons can reach the surface of the
semiconductor and can reduce appropriate species in
solution. On the other hand, the holes created in the
valence band can also migrate to the surface where they
will oxidise available species in solution. In the case of
glycerol, its photocatalytic conversion has been studied
https://doi.org/10.24084/repqj15.356 468 RE&PQJ, Vol.1, No.15, April 2017468

for its degradation into CO2 and H2O [7],[8], or to its
conversion into more valuable products such as hydrogen
[9].
There are various interesting solid materials that can
be used as photocatalysts such as TiO2, ZnO, SiC and CdS
etc. Among these photocatalysts the titanium dioxide
(TiO2) being the most well-known material owing to its
high photocatalytic activity, good photostability, non-
toxicity, and low price. Because all these advantages, the
development of new TiO2 based photocatalysts is
explored in order to improve their catalytic properties
mainly by increasing their specific surface area and by
shifting its optical response to the visible range [10].
Recently, ordered TiO2 architecture has attracted
significant attention as a photocatalyst. Of particular
interest has been 1-d ordered titanium oxide nanotubes (T-
NT), which have demonstrated interesting optical,
catalytic, and electrocatalytic properties for various photo-
related applications [11]–[13]. One of the main reasons is
the high surface area (1000 m2 g
-1) with electron diffusion
higher compared to similar systems based of films made
of TiO2 nanoparticles. The synthesis of these T-NT is
often carried out by the process of electrochemical
anodization of Ti in fluorinated electrolytes. Highly
ordered TiO2 nanotubes arrays with controllable
morphologies can thus be obtained [14].
The main organic electrolytes for T-NT production
by the anodization process consist of ethylene glycol and
glycerol [15]. Ethylene glycol based electrolyte helps for
the faster chemical dissolution but the obtained nanotubes
sometimes consist of rough walls. On the other hand,
glycerol presents higher viscosity that influences the
diffusion of ionic species, the kinetics of nanotube
formation and its morphology. Therefore it does not show
current fluctuations during anodization and hence smooth
walled nanotubes are obtained. However, the chemical
dissolution of TiO2 in glycerol is slow. Albu et al. [16]
and Macak et al. [17] performed the synthesis of different
morphologies of TiO2 utilizing either ethylene glycol or
glycerol-based electrolytes. However, the use of the
mixture of ethylene glycol and glycerol for anodization is
not fully developed. Hence it is interesting to use their
mixture aiming to obtain efficient nanotubular
morphology.
The aim of this work is to obtain TiO2 nanotubes in
an electrolyte containing mixture of ethylene glycol and
glycerol with different concentrations of fluoride and
water to obtain efficient tubular morphology for its
applications in glycerol photodegradation. The TiO2
electrodes were used for the glycerol photodegradation
employing UVA radiation as light source. For comparison
these electrodes were tested in photoelectrochemical
water splitting.
2. Experimental
Nanotubes were grown on Ti foil grade 2 – ASTM–
F67 [18], (99.8 – purity: wt. %, 0.7 mm thickness,
Realum), with dimensions of 1 cm × 5 cm. This foil was
cleaned by ultrasonication for 15 min in degreased and
deionized water (DI) in sequence, and then dried under
cold air. The Ti foil was used as the working electrode
and a platinum foil as the counter electrode. The distance
between these electrodes was about 2 cm. The anodization
was performed at 60 V at a potential ramp of 1 Vs-1
, the
organic electrolyte was a mixture of glycerol (Synth
99.5%) and ethylene glycol (Synth – purity: 99.0%) in 2:1
(v/v) ratio and variable amounts of NH4F (Synth – purity:
98.0%) and deionized water. Table 1 summarizes the
experimental conditions.
Table 1. Experimental conditions for T-NT production by the
anodization process.
Samples NH4F
(wt. %)
Deionized water
(wt. %)
Anodization
time (min)
A 0.25 2 120
B 0.75 10 60
The anodization time (60 minutes and 120minutes)
which are described in this work have been studied
previously [19] and presented the best
photoelectrochemical performance..
After anodization, all the samples were annealed in a
muffle furnace at 450 °C for 3 h in air with a heating ramp
of 10 ºC min-1
to crystallize the TiO2 nanotubes.
Characterization
The morphology was studied by Field Emission Gun
Scanning Electron Microscope (FEG-SEM) equipment
MIRA3 by TESCAN operated at 10 and 15 kV. The
crystal structure was determined by X-ray diffraction
(XRD) using XRD 6000 by SHIMADZU, equipped with
a graphite mono-chromator and rotating copper anode
operated at 40 kV and 30 mA. The X-ray source consisted
of Cu radiation (1.54184 Å) selected with a Ni filter. The
measurements were performed with a step of 0.04° and a
counting time of 0.60 s per step.
The photoelectrochemical water splitting
measurements were performed using an Autolab
potentiostat (PGSTAT 100N). The experiments were
performed in a quartz cell using a three-electrode setup
employing TiO2 nanotubes as the working electrode, a Pt
https://doi.org/10.24084/repqj15.356 469 RE&PQJ, Vol.1, No.15, April 2017469
wire as the counter electrode and Ag/AgCl as the
reference electrode in aqueous electrolyte of 1 M KOH.
The linear sweep voltammetry was performed at a speed
of 10 mV/s in the dark and under illumination. A solar
simulator (Newport) incorporated with xenon lamp (Oriel)
was used as a radiation source and the radiation was
filtered by an AM 1.5G filter. The intensity of the light
was calibrated by a photodiode with a known responsivity
to 100 mW/cm2 (i.e. 1 sun illumination).
The photocatalytic activity was evaluated by glycerol
photodegradation. The reactor was a tubular quartz cell
(10 mm diameter, 120 mm length) illuminated with three
tubular lamps (4x3 watts), which emit UVA light
(maximum emission at 360 nm). The experiments were
performed with two samples placed in the reactor (total
anodized surface of 8.1 cm2) and 1 mmol L
-1 aqueous
glycerol solution (35 mL). The solution was recirculated
in the cell bay a peristaltic pump. Aliquots were taken
during the test and glycerol concentration was determined
by High Pressure Liquid Chromatography (HPLC), using
a Shimadzu equipment with refractive index detector.
3. Results and Discussion
X-ray diffraction (XRD) analysis
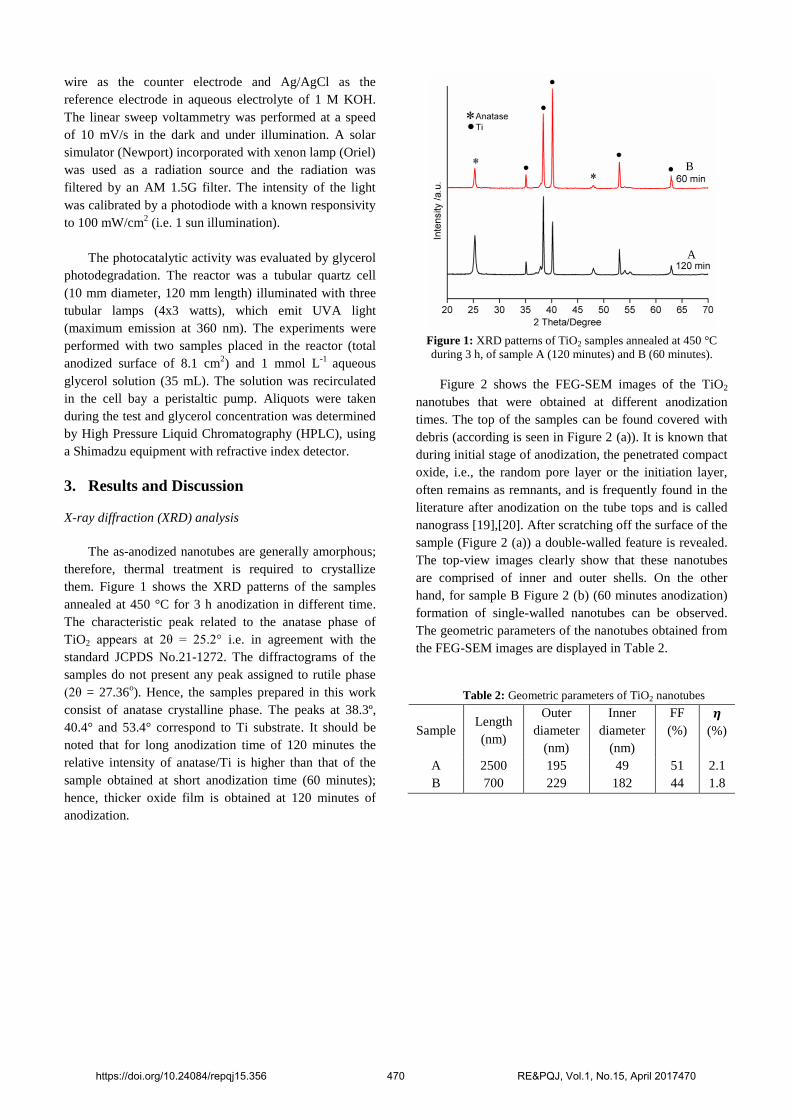
The as-anodized nanotubes are generally amorphous;
therefore, thermal treatment is required to crystallize
them. Figure 1 shows the XRD patterns of the samples
annealed at 450 °C for 3 h anodization in different time.
The characteristic peak related to the anatase phase of
TiO2 appears at 2θ = 25.2° i.e. in agreement with the
standard JCPDS No.21-1272. The diffractograms of the
samples do not present any peak assigned to rutile phase
(2θ = 27.36o). Hence, the samples prepared in this work
consist of anatase crystalline phase. The peaks at 38.3º,
40.4° and 53.4° correspond to Ti substrate. It should be
noted that for long anodization time of 120 minutes the
relative intensity of anatase/Ti is higher than that of the
sample obtained at short anodization time (60 minutes);
hence, thicker oxide film is obtained at 120 minutes of
anodization.
Figure 1: XRD patterns of TiO2 samples annealed at 450 °C
during 3 h, of sample A (120 minutes) and B (60 minutes).
Figure 2 shows the FEG-SEM images of the TiO2
nanotubes that were obtained at different anodization
times. The top of the samples can be found covered with
debris (according is seen in Figure 2 (a)). It is known that
during initial stage of anodization, the penetrated compact
oxide, i.e., the random pore layer or the initiation layer,
often remains as remnants, and is frequently found in the
literature after anodization on the tube tops and is called
nanograss [19],[20]. After scratching off the surface of the
sample (Figure 2 (a)) a double-walled feature is revealed.
The top-view images clearly show that these nanotubes
are comprised of inner and outer shells. On the other
hand, for sample B Figure 2 (b) (60 minutes anodization)
formation of single-walled nanotubes can be observed.
The geometric parameters of the nanotubes obtained from
the FEG-SEM images are displayed in Table 2.
Table 2: Geometric parameters of TiO2 nanotubes
Sample Length
(nm)
Outer
diameter
(nm)
Inner
diameter
(nm)
FF
(%)
𝜼
(%)
A 2500 195 49 51 2.1
B 700 229 182 44 1.8
A
B
https://doi.org/10.24084/repqj15.356 470 RE&PQJ, Vol.1, No.15, April 2017470

Figure 2: FEG-SEM images coss-sectional and of top of TiO2
nanotubes: (a1 and a2) sample A nanotubes prepared by 0.25%
NH4F in 2% H2O at a potential of 60 V for 120 minutes and (b1
and b2) sample B nanotubes prepared by 0.75% NH4F in 10%
H2O at a potential of 60 V for 60 minutes.
Therefore, single-walled or double-walled TiO2
nanotubes can be controllably obtained by optimizing the
anodization time. These results indicate the effectiveness
of the anodization method in producing well-defined TiO2
nanotubes and controlling the nanotubular morphology
via anodization time.
The obtained samples were tested for
photoelectrochemical water splitting in 1 M KOH (aq)
electrolyte under AM 1.5 G (1 sun illumination)
conditions. The linear sweep voltammetry (LSV) curves
are presented in Figure 3. From Figure 3 the values for fill
factor (FF) [21] (equation 1) and efficiency (𝜼) (equation
2) [22] at 0.6 V vs Ag/AgCl for both samples are
calculated and are displayed in Table 2.
The equations of the fill factor (FF) (Eqn. 1) and
efficiency (𝜼) (Eqn. 2) can be written in the form:
(Eqn. 1)
Where:
Vm = Maximum point Voltage;
Im = Maximum point Current;
Voc = Open Circuit Voltage;
Isc = Short Circuit Current.
(Eqn. 2)
The percentage power conversion efficiency (𝜼 ) of
any solar cell device is simply the ratio of power output
(Pout) versus power input (Pin), the latter dependent upon
the incident light flux (I0).
The best photoelectrochemical performance (higher
current density) is obtained for sample A (120 minutes of
anodization time). This result can be related to the better
absorption on longer nanotubes since to ensure efficient
electron collection; there should be a balance between the
tube length and the optical properties of TiO2 nanotubes.
Therefore, 1D nature of TiO2 nanotubes and their optimal
light absorption are important factors in improving the
photoelectrochemical performance [15].
Figure 3: Linear sweep voltammetry curves of TiO2 nanotubes
obtained at different anodization times.
Both samples were employed to the photodegradation
experiments of the glycerol. The concentrations of
glycerol versus time of exposure to ultraviolet radiation
are plotted in Figure 4. It is observed that both samples
have photocatalytic activity and the process is able to
degrade glycerol. Furthermore, the sample A (Figure 4)
has achieved a conversion of 52% after 24 h. However
sample B achieved a conversion of 29% in the same
period. These results show that the sample A, which has
longer nanotubes and smaller inner and outer diameter
(Table 2), has a considerably superior performance
compared to the sample B. Thus sample A obtained by
anodizing during 120 min showed the better
photocatalytic performance.
a1
b1
a2
b2
https://doi.org/10.24084/repqj15.356 471 RE&PQJ, Vol.1, No.15, April 2017471

Figure 4: Glycerol photo-degradation results for sample A
and sample B tests.
4. Conclusion
In summary, it was observed that TiO2 nanotubes
obtained in the mixture of ethylene glycol and glycerol
consist of well-defined tubular morphology but the top of
the nanotubes was covered with nanograss. Doubled wall
or single walled topography can be controlled by
anodization time and electrolyte composition. For
improved photocatalytic performance from the TiO2
nanotubes, the tube length should be sufficiently long to
harvest most of the photons, yet short enough to decrease
the recombination carriers. The sample prepared for 120
minutes (sample A) has shown improved performances in
photocatalytic glycerol degradation with ultraviolet
radiation and in water splitting as compared to the other
that was obtained in 60 minutes (sample B).
Acknowledgement
This work was carried out with the support of CAPES, a
Brazilian Government entity focused on Human
Resources formation. We also thank C-LABMU, UEPG,
for carrying out the FEG analysis.
References
[1] J.C. Thompson, B.B. He. Characterization of crude glycerol
from biodiesel production from multiple feedstocks.
Applied Engineering in Agriculture 22, (2)(2006), 261-265.
[2] T.Kocsisová, J. Cvengos. G-phase from methyl ester
production-splitting and refining. Petroleum and Coal 48
(2006) 1-5.
[3] N. Pachauri, B. He. Value added utilization of crude glycerol
from biodiesel production: a survey of current research
activities. In Proceedings of the ASABE Annual
International Meeting, Portland, Oregon. 9-12 July 2006.
American Society of Agricultural and Biological Engineers
(ASABE), St. Joseph, Missouri, USA.
[4] C. Santibáñez, M. Teresa Varnero, M. Bustamante. Residual
glycerol from biodiesel manufacturing, waste or potential
source of bioenergy: a review. Chilean Journal of
Agricultural Research 71,(3) (2011) 469-475.
[5] U.I. Gaya, A.H. Abdullah. Heterogeneous photocatalytic
degradation of organic contaminants over titanium dioxide:
A review. Advanced research in physics and engineering of
fundamentals, progress and problems, Journal of
Photochemistry and Photobiology C: Photochemistry
Reviews 9 (1)(2008) 1-12.
[6] A. Kudo, Development of photocatalyst materials for water
splitting, International Journal of Hydrogen Energy
31(2)(2006), 197-202.
[7] T.S. Yee. Evaluative study of glycerol photocatalytic
degradation over CuFe2O4 and La-CuFe2O4
Photocatalysts. Thesis Faculty of Chemical & Natural
Resources Engineering Universiti Malaysia Pahang (2015).
[8] T. Jedsukontorn, V. Meeyoo, N. Saito, M. Hunsom, Route of
glycerol conversion and product generation via TiO2-
induced photocatalytic oxidation in the presence of H2O2.
Chemical Engineering Journal. 281 (2015) 252–264.
[9] V. M. Daskalaki, D.I. Kondarides. Efficient production of
hydrogen by photo-induced reforming of glycerol at
ambient conditions. Catalysis Today 144 (2009) 75–80.
[10] M. Pelaez, N.T. Nolan, S.C. Pillaib, M. K. Seery, P.
Falaras, A.G. Kontos, P.S.M. Dunlop, J.W.J. Hamilton,
J.Anthony Byrne, K. O’Shea, M.H. Entezari, D.D.
Dionysiou. A review on the visible light active titanium
dioxide photocatalysts for environmental applications.
Applied Catalysis B: Environmental 125 (2012) 331– 349.
[11] J. Dong, J. Han, Y. Liu, A. Nakajima, S. Matsushita, S.
Wei, W. Gao, Defective Black TiO2 Synthesized via
Anodization for Visible-Light Photocatalysis, ACS Appl.
Mater. Interfaces. 6 (2014) 1385–1388.
[12] Y. Dongliang, Y. Song, X. Zhu, R. Yang, A. Han,
Morphological evolution of TiO2 nanotube arrays with
lotus-root-shaped nanostructure, Appl. Surf. Sci. 276
(2013) 711–716.
[13] R.P. Lynch, A. Ghicov, P. Schmuki, A Photo-
Electrochemical Investigation of Self-Organized TiO2
Nanotubes, J. Electrochem. Soc. 157 (2010) G76–G84.
[14] Z.B. Xie, D.J. Blackwood. Effects of anodization
parameters on the formation of titania nanotubes in
ethylene glycol. Electrochimica Acta 56 (2010) 905–912.
[15] I. Roman, R.D. Trusca, M.-L. Soare, C. Fratila, E.
Krasicka-Cydzik, M.-S. Stan, Titanium dioxide nanotube
films Preparation, characterization and electrochemical
biosensitivity towards alkaline phosphatase Mater.
Materials Science and Engineering C, 37 (2014) 374–382.
[16] S.P Albu., A. Ghicov, et al. Formation of Double-Walled
TiO2 Nanotubes and Robust Anatase Membranes. Adv.
Mater. 20, (2008), 4135.
[17] J.M. Macak, H. Tsuchiya, et. al., TiO2 nanotubes: Self-
organized electrochemical formation, properties and
applications. Curr. Opin. Solid State Mater. Sci. 11,
(2007), 3-18.
[18] ASTM – F67-13, Standard Specification for Unalloyed
Titanium, for Surgical Implant Applications (UNS
R50250, UNS R50400, UNS R50550, UNS R50700).
[19] A. Bervian, E. Coser; et al. Evolution of TiO2
Nanotubular Morphology in Ethylene Glycol Mixed with
Glycerol Electrolyte and its Photoelectrochemical
Performance. The Canadian Journal of Chemical
Engineering. (2016) 1-15.
[20] S. So, I. Hwang, P. Schmuki, Hierarchical DSSC
structures based on “single walled” TiO2 nanotube arrays
reach a back-side illumination solar light conversion
efficiency of 8%. Energy Environ. Sci. 8 (2015) 84-854.
[21] R. Guliani, A. Jain and A. Kapoor. Exact Analytical
Analysis of Dye-Sensitized Solar Cell: Improved Method
and Comparative Study. The Open Renewable Energy
Journal, 5 (2012) 49-60.
[22] J. Rochford, CH 371 - Advanced Inorganic Chemistry
Laboratory, Spring 2013, part Power Conversion
Efficiency of a Dye-Sensitized Solar Cell. Accordance
with site http://alpha.chem.umb.edu/chemistry/ch371/
https://doi.org/10.24084/repqj15.356 472 RE&PQJ, Vol.1, No.15, April 2017472