Embed Size (px)
Citation preview

Photocathode Studies
@ FLASH:
Quantum Efficiency (QE)L. Monaco
Work supported by the European CommunityWork supported by the European Community(contract number RII3-CT-2004-506008)
1/27WSHQE–October 4-6, 2006 L. Monaco INFN Milano – LASA

Main Topics
– Overview Photocathode Production– Production at LASA and transportation
h Ph h d D b– The Photocathode Database
– CW QE measurements (Hg lamp)– Experimental set up – Experimental set-up – Results of measurements at FLASH
– Pulsed QE measurementsQ– Laser energy calibration– Measurements on different cathodes
Results – Results – QE maps
– Conclusions
2/27WSHQE–October 4-6, 2006 L. Monaco INFN Milano – LASA

Quantum Efficiency
For the FLASH laser (λ = 262nm)QE(%) ≈ 0.5*Q(nC)/E(µJ)The design asks for 72000 nC/sThe design asks for 72000 nC/s
• QE required for FLASH:Q q f> 0.5 % to keep the laser in a reasonable limit: within an average power of ~WD i f t l t f • Design of present laser accounts for QE=0.5% with an overhead of a factor of 4 and has an average power of 2 W (IR)and has an average power of 2 W (IR)
• Cs2Te cathodes found to be the best choice
3/27WSHQE–October 4-6, 2006 L. Monaco INFN Milano – LASA

Photocathode Production: Preparation ChamberPhotocathodes are grown @ LASA on Mo plugs under UHV condition.g p gTransport Box Source holder
Preparation Chamber @ LASAMasking
Preparation Chamber @ LASA
Mo Plug• UHV Vacuum System - base pressure 10-10 mbar• 6 sources slot available• Te sources out of 99.9999 % pure element• Cs sources from SAES®
• High pressure Hg lamp and interference filter for online monitoring of QE during production
4/27WSHQE–October 4-6, 2006 L. Monaco INFN Milano – LASA
Masking• Masking system• 5 x UHV transport box

Production: diagnostic on photocathodesThe photoemissive properties of produced • QE map @ 254nmThe photoemissive properties of produced cathodes are checked performing spectral response measurements and QE maps (also at different wavelengths).
QE map @ 254nm(Hg lamp, interferential filter,
1mm spot diameter)
QE map:73-1i(254nm) of cathode #73 1 (23-03-2004) +/-4mm step 0 5mm
•Spectral response(Hg lamp, interferential filters, 5
6
7
8
9
QE map:73 1i(254nm) of cathode #73.1 (23 03 2004), / 4mm, step 0.5mm
5
6
7
8
1.E+01
1.E+02
g p3mm spot diameter)
10
15
20
5
10
15
200
1
2
3
4
1
2
3
4
1.E-02
1.E-01
1.E+00
QE
(%) 0
50
5
12
14
16
QE map:73-1i(254nm) of cathode #73.1 (23-03-2004), +/-4mm, step 0.5mm
6
7
8
Just after the d iti
1.E-04
1.E-03
2 2.4 2.8 3.2 3.6 4 4.4 4.8 5.2 5.6 6Photon Energy (eV)
6
8
10
12
2
3
4
5
d=5mm
deposition
5/27WSHQE–October 4-6, 2006 L. Monaco INFN Milano – LASA
Photon Energy (eV)
2 4 6 8 10 12 14 16
2
4
1
d=5mm

Production: from LASA to FLASH and PITZProduced cathodes are loaded in the Transport Produced cathodes, are loaded in the transport box and shipped to FLASH or PITZ keeping the UHV condition.
box
The box is then connected to the RF gun.
Since 1998, we have shipped to TTF h I FLASH d PITZTTF phase I, FLASH and PITZ:
•49 x Cs2Te
•2 x KCsTeK
•25 x Mo
•Total transfers from LASA: 25
6/27WSHQE–October 4-6, 2006 L. Monaco INFN Milano – LASA
RF gun and FLASH linac

Cathode in the RF Gun• Photocathode inserted into the gun backplane• Photocathode inserted into the gun backplane
7/27WSHQE–October 4-6, 2006 L. Monaco INFN Milano – LASA

Production:The Photocathode DatabaseMany of the data relative to photocathodes (production operation lifetimes) and transport box (production, operation, lifetimes) and transport box are stored in the “photocathode database” whose WEB-interface is available at:
http://wwwlasa.mi.infn.it/ttfcathodes/http://wwwlasa.mi.infn.it/ttfcathodes/The database keeps track of the photocathodes in the different transport boxes and in the different
labs (TTF, PITZ and LASA).( )
8/27WSHQE–October 4-6, 2006 L. Monaco INFN Milano – LASA

CW QE measurements: Experimental set-upTh i t l t f th CW QEThe experimental set-up for the CW QE
measurements is mainly composed by:
towards the RF gun
A high pressure Hg lampInterferential filters (239nm 254nm 297nm cathode
1.2 nA
300 V
towards theexchangechamber
(239nm, 254nm, 297nm, 334nm)
Picoammeter
Hg lamp
interferentialfilter
lensneutraldensity filters
cathodecarrier
cathodes
picoammeter
Power energy meter
Neutral density filters
Optical components (1 lens,
condenserpin-holepin-hole
anode
viewport2n W
transportpowermeter
9/27WSHQE–October 4-6, 2006 L. Monaco INFN Milano – LASA
1 mirror, 2 pin-holes) power headanodetransport
box

CW QE measurements: ResultsMeasured @ DESY on March 31 2006 Measured @ DESY on March 31 2006
Data have been fitted to evaluate: the QE @ 262nm and Eg+Ea
Cathode Dep. data QE@254nm (LASA)
Operation lif ti
QE@254nm (DESY)
QE@262nm (DESY)
Eg+Ea ( V)(LASA) lifetimes (DESY) (DESY) (eV)
73.1 23-Mar-05 7.9% 86 1.64% 0.79% 4.16572 1 22-Mar-05 9 2% 166 0 44% 0 33% 4 16872.1 22 Mar 05 9.2% 166 0.44% 0.33% 4.16823.2 16-Sep-04 7.2% 161 0.22% 0.15% 4.157
Cathode 73.1 Cathode 72.1 Cathode 23.2
100
101 Cathode 73.1 - Eg+Ea =4.1654eV - QE (@262 nm) =0.78732% - Slope =1.2417
← QE (@262 nm) =0.79%
ExperimentalFit
10-1
100Cathode 23.2 - Eg+Ea =4.157eV - QE (@262 nm) =0.15369% - Slope =1.6575
← QE (@262 nm) =0.15%
ExperimentalFit
10-1
100Cathode 72.1 - Eg+Ea =4.168eV - QE (@262 nm) =0.32676% - Slope =1.2422
← QE (@262 nm) =0.33%
10-2
10-1
QE
[%]
10-3
10-2
QE
[%]
10-2
QE
[%]
Experimental
10/27WSHQE–October 4-6, 2006 L. Monaco INFN Milano – LASA
4 4.2 4.4 4.6 4.8 5 5.2 5.410-3
photon energy [eV]
4 4.2 4.4 4.6 4.8 5 5.2 5.4
10-4
photon energy [eV]
4 4.2 4.4 4.6 4.8 5 5.2 5.4
10-3
photon energy [eV]
ExperimentalFit

CW QE measurements: Data Analysis• CW data analysis CW data analysis
– Fitting of the spectral response
( )[ ]mEEhAQE +⋅= ν ( )[ ]AG EEhAQE +−⋅= ν
where A is a constant, EG and EA are energy gap and electron affinity.
100
101 Cathode 73.1 - Eg+Ea =4.1654eV - QE (@262 nm) =0.78732% - Slope =1.2417
Q (@262 ) 0 9%
ExperimentalFit
An example is given for the l i f th CW QE d t
10-1
QE
[%]
← QE (@262 nm) =0.79% analysis of the CW QE data for cathode 73.1.In this case:
10-2
C th d #73 1
• Eg+Ea = 4.165 eV
11/27WSHQE–October 4-6, 2006 L. Monaco INFN Milano – LASA
4 4.2 4.4 4.6 4.8 5 5.2 5.410
-3
photon energy [eV]
Cathode #73.1

CW QE measurements: Data Analysis10
100
0.01
0.1
1
10
Just after the depositionQ
E (%
)
Photon energy (eV)2 3 4 5 6 7
1 .10 4
1 .10 3
the deposition
Powel(*)
1.E+00
1.E+01
1.E+02 Powel( )
(*)R. A. Powell, W. E. Spicer, G. B. Fisher, P. Gregory, “Photoemission studies of cesium telluride”, PRB 8 (9), p. 3987-3995 (1973)
1.E-02
1.E-01
QE
(%) A fresh cathode shows a Eg+Ea of
about 3.5 eV.
S l t f th
1.E-04
1.E-03just after the depositionafter 61h and 55minafter 114h and 42minafter 406 and 20min
Several measurements of the spectral response have been performed to study the Eg+Ea increase vs. time (maximum pressure f 10 9 b )
12/27WSHQE–October 4-6, 2006 L. Monaco INFN Milano – LASA
1.E-052 2.4 2.8 3.2 3.6 4 4.4 4.8 5.2 5.6 6
Photon Energy (eV)
of some 10-9 mbar)

Pulsed QE measurements: laser energy calibration experimental set-up
The laser energy transmission (from the laser hut to the tunnel)
polarizer movable mirror
laser hut to the tunnel) has been evaluated for different iris diameters (3.5mm, 2.0mm and 0 16mm) and different 0.16mm) and different energies.
Th l h
λ/2 plate
The laser energy has been measured using a Pyroelectric gauge (Joulemeter), varying the laser energy using the variable attenuator (λ/2 wave plate + polarizer).
Joulemeter mirror
13/27WSHQE–October 4-6, 2006 L. Monaco INFN Milano – LASA

Pulsed QE measurements: laser beamline transmission analysis
Th QE d h l d h l bl • The QE measurement procedure uses the laser energy measured on the laser table
• Transmission to the vacuum window is regularly measured
• Transmission of the vacuum window (92 %) andfl i i f h l i (90 %) d f
2.5O:\TESLA\TTF2\QE\31-03-06\2006-03-31T214932-QE.dat
0.15Mean trasnmission:14.1868 [%]above4000steps
reflectivity of the vacuum laser mirror (90 %) are accounted for
iris = 3.5 mm as an example:
0 5
1
1.5
2
Ene
rgy
[ μJ]
0.135
0.14
0.145La
ser r
oom
/ tu
nnel
Laser Room
sin2 fit Iris = 3.5 mm•Laser energy is measured as a function f h bl
2000 4000 6000 8000 100000
0.5
Attenuator Step
0.5O:\TESLA\TTF2\QE\energy calibration\cal-pyro-31032006_16512iris.txt
2000 4000 6000 8000 100000.13
Attenuator Step
Tunnel0.18
nel)
Mean trasnmission:17.1078 [%]above4000steps Iris = 2.0 mm
of the variable attenuator setting
•fitted by sin2
0.1
0.2
0.3
0.4
Ene
rgy
[ μJ]
sin2 fit
0.16
0.165
0.17
0.175
n2 (Las
er ro
om) /
sin
2 (tun
i i 16512
fitted by sinto evaluate the transmission
14/27WSHQE–October 4-6, 2006 L. Monaco INFN Milano – LASA
2000 4000 6000 8000 100000
Attenuator Step
2000 4000 6000 8000 10000
0.155
Attenuator Step
sin
iris =16512
Iris = 0.16 mm (σ)

Pulsed QE measurements: laser beam line transmission measurements
The laser beamline transmission has been evaluated four times (from March to August 2006) to take care of changes in the optical transmission path.
Iris Φ (mm) Iris (motor Date (tunnel Date (laser room Transmission Used steps) file) file)
3.5 16512 12-Mar-06 12-Mar-06 13.21 % From 12 March to 31
March2.0 17280 12-Mar-06 12-Mar-06 6.64 %0 16 18208 not done not done0.16 18208 not done not done -3.5 16512 31-Mar-06 31-Mar-06 17.10 % From 31
March to 6 June2.0 17280 31-Mar-06 31-Mar-06 8.75 %
0 16 18208 31-Mar-06 31-Mar-06 0 85%0.16 18208 31 Mar 06 31 Mar 06 0.85%3.5 16512 not done not done - From 6 June
to 7 Aug2.0 17280 6-June-06 6-June-06 7.18 %0.16 18208 not done not done -3.5 16512 not done not done - From 7 August
till now2.0 17280 7-Aug-06 7-Aug-06 4.49 %0.16 18208 not done not done -
15/27WSHQE–October 4-6, 2006 L. Monaco INFN Milano – LASA
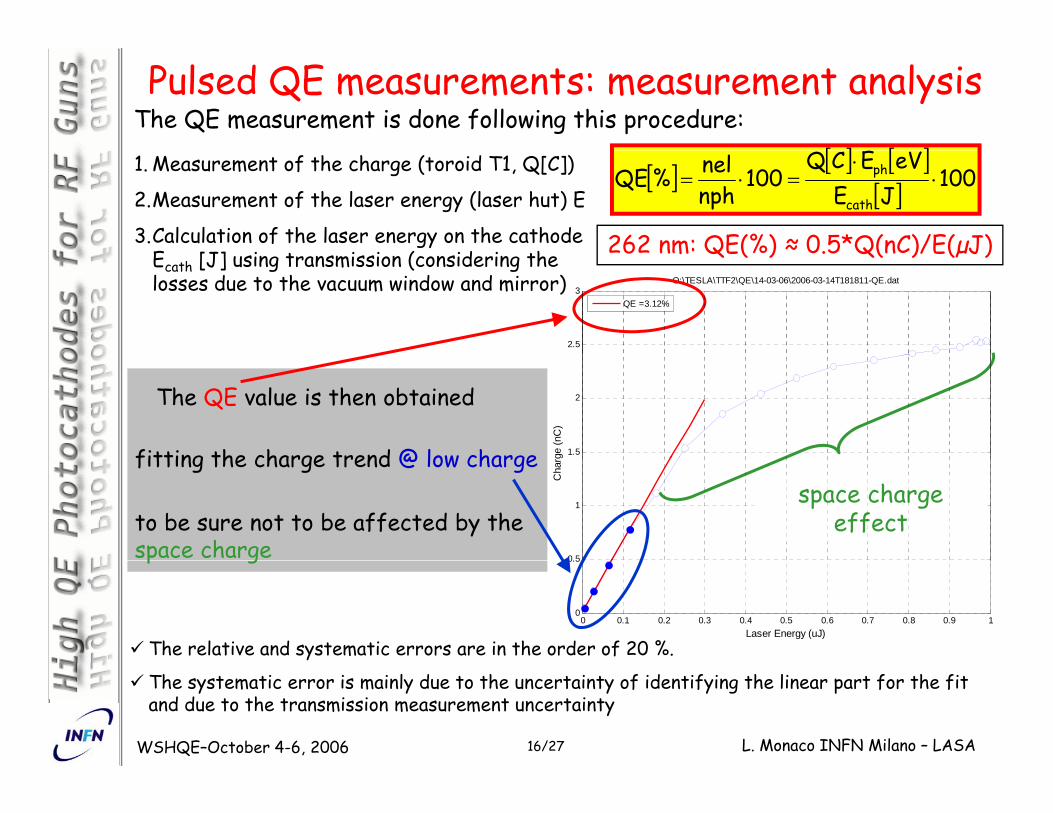
Pulsed QE measurements: measurement analysis
[ ] [ ]The QE measurement is done following this procedure:
[ ] [ ] [ ][ ] 100JE
eVECQ100
nphnel%QE
cath
ph ⋅⋅
=⋅=1. Measurement of the charge (toroid T1, Q[C])
2.Measurement of the laser energy (laser hut) E
3.Calculation of the laser energy on the cathode E [J] i t i i ( id i th 262 nm: QE(%) ≈ 0.5*Q(nC)/E(µJ)Ecath [J] using transmission (considering the losses due to the vacuum window and mirror)
2.5
3O:\TESLA\TTF2\QE\14-03-06\2006-03-14T181811-QE.dat
QE =3.12%
6 nm QE(%) 0.5 Q(nC)/E(µJ)
1.5
2
ge (n
C)
The QE value is then obtained
fitting the charge trend @ low charge
0 5
1
Cha
rg
to be sure not to be affected by the space charge
fitting the charge trend @ low charge space charge
effect
0 0.1 0.2 0.3 0.4 0.5 0.6 0.7 0.8 0.9 10
0.5
Laser Energy (uJ)
p g
The relative and systematic errors are in the order of 20 %.
16/27WSHQE–October 4-6, 2006 L. Monaco INFN Milano – LASA
The systematic error is mainly due to the uncertainty of identifying the linear part for the fit and due to the transmission measurement uncertainty

Pulsed QE measurements: cathode lifetimeQE of cathodes are measured
5
672.1
72 1frequently within months.
Example: cathode 72.1 and 73.1.3
4
5
E (%
)
mean 72.1CW_72.1
1
2
Q
End of lifetime QE < 0.5%
• We define the end of lifetime when the QE reaches 0.5 %
• The CW QE of cathode
473 1
014-Nov-05 14-Dec-05 13-Jan-06 12-Feb-06 14-Mar-06 13-Apr-06
date
• The CW QE of cathode 73.1 is compared with the pulsed QE measured the same day.
2.5
3
3.5
%)
73.1mean 73.1CW_73.1
y
• The difference may be explained considering the increase of the charge due
0 5
1
1.5
2
QE
(
End of lifetime QE < 0.5%
to the field enhancement.
• All cathodes show a drop of the QE over time, with
17/27WSHQE–October 4-6, 2006 L. Monaco INFN Milano – LASA
0
0.5
13-Mar-06 19-Mar-06 25-Mar-06 31-Mar-06 6-Apr-06
date
QQE m , wdifferent characteristics.

Pulsed QE measurements: drop of QE with time We can relate We can relate the drop of QEwith the vacuum condition in the RF gun.
3
3.5
473.1mean 73.1CW 73 1
• As an example, early 2006, the RF gun has been operated with 300 μs long RF pulses.
1.5
2
2.5
3
QE
(%)
CW_73.1p• Up to this, the pulse length
was restricted to 70 μs. • During the long pulse
operation period, the
0
0.5
1End of lifetime QE < 0.5%
operat on per od, the pressure increased from 5÷7·10−11 mbar to 2·10−10 mbar.
• This coincides with the drop of QE of cathode 73 1
18/27WSHQE–October 4-6, 2006 L. Monaco INFN Milano – LASA
13-Mar-06 19-Mar-06 25-Mar-06 31-Mar-06 6-Apr-06
dateof QE of cathode 73.1.

Pulsed QE measurements: cathode 78.1Referring to cathode 78.1, several measurements have been done during about 3 months (period: April 19 to July 11) months (period: April, 19 to July, 11).
Also this cathode shows a drop of th QE ti
•long pulse operation (increase of vacuum, ion-back bombardment??)
•different growth of the cathode during depositionthe QE vs. time. •different growth of the cathode during deposition
•damaging due to dark current coming from ACC135
78 1
• 78.1 just after the deposition25
3078.1CW_78.1mean 78.1
15
20
QE
(%)
• 78.1 during operation
0
5
10
19/27WSHQE–October 4-6, 2006 L. Monaco INFN Milano – LASA
03-Apr-06 23-Apr-06 13-May-06 2-Jun-06 22-Jun-06 12-Jul-06
date

Comparison between:Pulsed QE and CW QE measurements
4
5
6
72.1mean 72.1CW_72.1
The pulsed QE measurements of cathode 72.1 and 73.1 have been compared with the CW QE value @ λ = 262nm, evaluated
2
3
4
QE
(%)
3.5
473.1mean 73.1
from the spectral response.
0
1
14 N 05 14 D 05 13 J 06 12 F b 06 14 M 06 13 A 062
2.5
3
E (%
)
CW_73.1
14-Nov-05 14-Dec-05 13-Jan-06 12-Feb-06 14-Mar-06 13-Apr-06date
0.5
1
1.5
QE
CW QE @ 262nm
013-Mar-06 19-Mar-06 25-Mar-06 31-Mar-06 6-Apr-06
date
The CW QE respect to the pulsed QE value is lower:
thi b d t th hi h l ti fi ld th th d i
20/27WSHQE–October 4-6, 2006 L. Monaco INFN Milano – LASA
•this can be due to the high accelerating field on the cathode in pulsed QE measurements.

Pulsed QE measurements: QE vs. phase laser/RF gun•Measurements have been performed on two cathodes varying p y gthe laser/RF gun phase.
For cathodes 72.1 and 78.1,
the measured QE @ 70 deg is higher respect to the one measured @ 38 deg.
cathode #72.10.65
0 45
0.5
0.55
0.6
%)
cathode #78.1
25
26
0.3
0.35
0.4
0.45
QE
(%
iris = 3.5mmiris = 2mm
21
22
23
24
QE
(a.u
.)0.2
0.25
30 38 46 54 62 70 78RF phase
mean
18
19
20
21
iris = 3.5mmiris = 2mmmean
21/27WSHQE–October 4-6, 2006 L. Monaco INFN Milano – LASA
30 38 46 54 62 70 78
RF phase

Pulsed QE measurements: analysis (1)• RF data analysis – QE enhancement
– QE @ given acc. gradient Eacc and phase φ– with a given laser energy without space charge
( )m
E ⎤⎡ ( ) ( )acceeAG
EqqEEhAQE⎥⎥⎦
⎤
⎢⎢⎣
⎡
⋅⋅⋅⋅⋅
⋅++−⋅=04sin
επφβν
where E is the accelerating field φ is the phase RF/laser β is where Eacc is the accelerating field, φ is the phase RF/laser, β is geometric enhancing factor
Using the values calculated b f f E E d 1 6before for A, EG+EA and m, the geometric enhancing factor results:
β 101.2
1.4
1.6
QE
[%]
β= 10
with Eacc = 40.9 MV/m and the phase φ 38° from the
0.8
1
Q
cathode 73.1
22/27WSHQE–October 4-6, 2006 L. Monaco INFN Milano – LASA
the phase φ = 38° from the experimental measurement. 0 5 10 15 20 25 30 35 40 45 50
0.6
Eacc [MV/m]
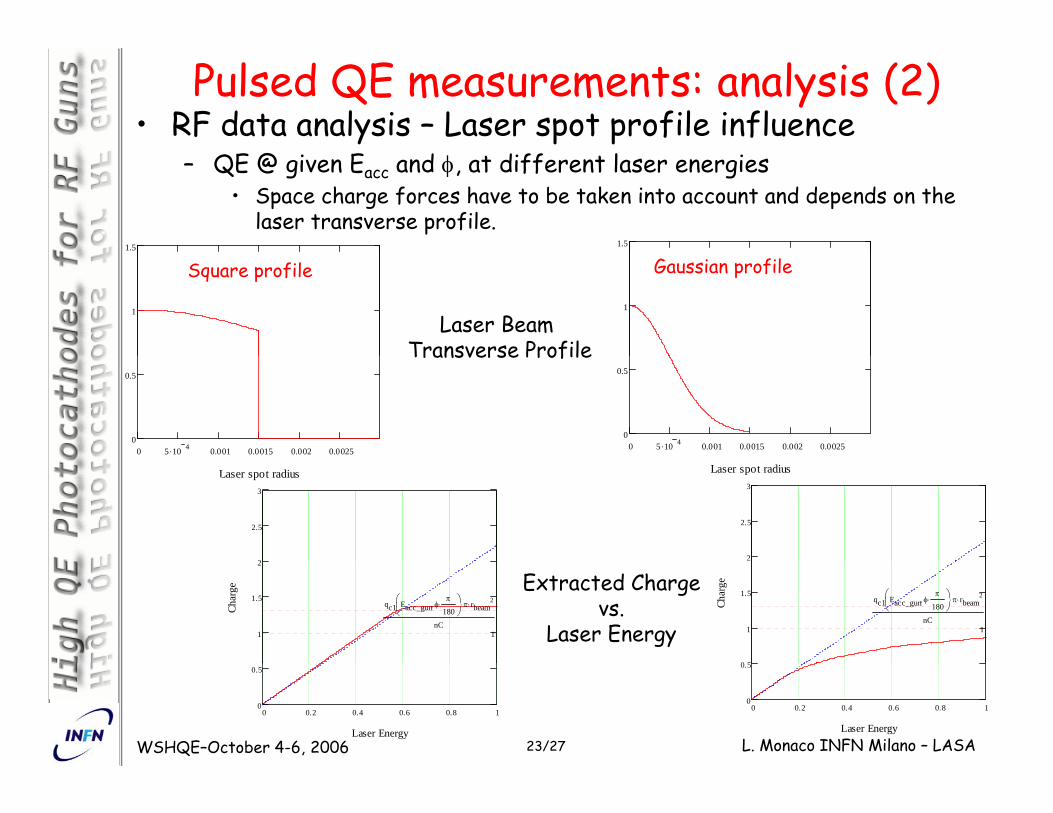
• RF data analysis – Laser spot profile influencePulsed QE measurements: analysis (2)
– QE @ given Eacc and φ, at different laser energies• Space charge forces have to be taken into account and depends on the
laser transverse profile.1.51.5
11
Laser Beam Transverse Profile
Square profile Gaussian profile
0 5 .10 4 0.001 0.0015 0.002 0.00250
0.5
0 5 .10 4 0.001 0.0015 0.002 0.00250
0.5
Transverse Profile
Laser spot radius
2
2.5
3Laser spot radius
2
2.5
3
0 5
1
1.5
Char
ge
1
qc1 Eacc_gun φπ
180⋅,⎛⎜
⎝⎞⎟⎠π⋅ rbeam
2⋅
nC
1
1.5
2
Char
ge
1
qc1 Eacc_gun φπ
180⋅,⎛⎜
⎝⎞⎟⎠π⋅ rbeam
2⋅
nC
Extracted Chargevs.
Laser Energy
23/27WSHQE–October 4-6, 2006 L. Monaco INFN Milano – LASA
0 0.2 0.4 0.6 0.8 10
0.5
Laser Energy0 0.2 0.4 0.6 0.8 1
0
0.5
Laser Energy

Pulsed QE measurements: Comments to the analysis• The influence of the laser spot profile mainly affects the shape of the p p y p
charge vs. laser energy curves.• With this “simple” model, we can explain the shape of the curve and some
of the asymptotic values. It would be very helpful to have CW QE and pulsed QE measurements • It would be very helpful to have CW QE and pulsed QE measurements in the same day (QE constant) to further study the model.
3QE :3.23[%]; spot diameter:3.8586[mm]; laser sigma:0.1099[mm]
Example for cathode 73 1
2
2.5
3 Example for cathode 73.1
•Laser spot/iris diameter = 3.5mm.
1
1.5
Cha
rge
[nC
] •Extrapolated spot size = 3.8mm.•QE from the linear fit =
0 0 1 0 2 0 3 0 4 0 5 0 6 0 7 0 8 0 9 10
0.5
ExperimentalFit
QE from th n ar f t 3.1%•QE from this analysis = 3.23%
24/27WSHQE–October 4-6, 2006 L. Monaco INFN Milano – LASA
0 0.1 0.2 0.3 0.4 0.5 0.6 0.7 0.8 0.9 1Laser energy [μJ]
3.23%

Pulsed QE measurements: QE map (1)QE maps by scanning a small laser spot over the cathode
ti i i 0 16 ( ) t i 0 3 tiny iris = 0.16mm (σ), step size 0.3 mm.
Map of the charge itt d f th th d emitted from the cathode
moving the iris only.
cathode 73 1
Map of charge emitted from the cathode moving i is d i t th
cathode 73.1
iris and mirror together.
The photoemissive layer is 5 mm in diameter.
W ll p d d t Well reproduced, center position: (-0.2,-2.2) mm.
5 di f h
25/27WSHQE–October 4-6, 2006 L. Monaco INFN Milano – LASA
5mm diameter of the photoemissive layer

Pulsed QE measurements: QE map (2)QE maps cathode 77.1, used to center the laser beam on the cathode.
QE maps before alignment
QE map of cathode 77.1 after centering of the laser beam
26/27WSHQE–October 4-6, 2006 L. Monaco INFN Milano – LASA

Conclusion• CW QE measurements:CW QE measurements
– Experimental set-up in the FLASH tunnel has been installed– CW QE has been measured @ FLASH
Pulsed QE measurements:• Pulsed QE measurements:– Laser beamline transmission calibration– QE vs. time and vs. RF phases– Analysis of the pulsed QE measurements:
• Eacc, RF phase, etc.• QE mapsQ p
– Tool to check the centering between the laser spot and the photoemissive film
• For the futureFor the future– On-line measurements of the laser beamline transmission to
have “trustable” QE values and to “continuously follow” the cathode lifetime (helpful to decide when to change it, etc.)
27/27WSHQE–October 4-6, 2006 L. Monaco INFN Milano – LASA
( p g , )