Embed Size (px)
Citation preview
Photocatalytic activity of TiO2 nanoparticles: effect of thermal annealing under various
gaseous atmospheres
This article has been downloaded from IOPscience. Please scroll down to see the full text article.
2012 Nanotechnology 23 475711
(http://iopscience.iop.org/0957-4484/23/47/475711)
Download details:
IP Address: 137.149.3.15
The article was downloaded on 07/03/2013 at 09:50
Please note that terms and conditions apply.
View the table of contents for this issue, or go to the journal homepage for more
Home Search Collections Journals About Contact us My IOPscience
IOP PUBLISHING NANOTECHNOLOGY
Nanotechnology 23 (2012) 475711 (8pp) doi:10.1088/0957-4484/23/47/475711
Photocatalytic activity of TiO2nanoparticles: effect of thermal annealingunder various gaseous atmospheres
Anjana Sarkar1, Andrey Shchukarev1, Anne-Riikka Leino2,Krisztian Kordas1,2, Jyri-Pekka Mikkola1,3, Pavel O Petrov4,Elena S Tuchina4, Alexey P Popov5, Maxim E Darvin6,Martina C Meinke6, Juergen Lademann6 and Valery V Tuchin5,7,8
1 Technical Chemistry, Department of Chemistry, Chemical-Biological Centre, Umea University,SE-901 87 Umea, Sweden2 Microelectronics and Materials Physics Laboratories, Department of Electrical Engineering,University of Oulu, PO Box 4500, Oulu FI-90014, Finland3 Laboratory of Industrial Chemistry and Reaction Engineering, Process Chemistry Centre,Abo Akademi University, Biskopsgata 8, Turku FI-20500, Finland4 Department of Biology, Saratov State University, Saratov, 410012, Russia5 Optoelectronics and Measurement Techniques Laboratory, Department of Electrical Engineering,University of Oulu, PO Box 4500, Oulu FI-90014, Finland6 Center of Experimental and Applied Cutaneous Physiology, Department of Dermatology, Venerologyand Allergology, Charite–Universitatsmedizin Berlin, D-10117 Berlin, Germany7 Research-Educational Institute of Optics and Biophotonics, Saratov State University, Saratov, 410012,Russia8 Institute of Precise Mechanics and Control RAS, Saratov, 410028, Russia
E-mail: [email protected]
Received 14 June 2012, in final form 19 August 2012Published 1 November 2012Online at stacks.iop.org/Nano/23/475711
AbstractThe structure, composition and photocatalytic activity of TiO2 nanoparticles annealed invarious gas atmospheres (N2, NH3 and H2) were studied in this work. The effect of treatmenton crystal structure, particle size, chemical composition and optical absorbance were assessedby means of x-ray diffraction, transmission electron microscopy, x-ray photoelectronspectroscopy and diffuse optical reflectance/transmittance measurements, respectively.Photocatalytic properties of the materials were evaluated by three different methods:degradation of methyl orange in water, killing of Staphylococcus aureus bacteria andphotogeneration of radicals in the presence of 3-carboxy-2,2,5,5-tetramethylpyrrolidine-1-oxyl (PCA) marker molecules. The results indicate that the correlation betweenpretreatment and the photocatalytic performance depends on the photocatalytic processes andcannot be generalized.
(Some figures may appear in colour only in the online journal)
1. Introduction
Photons with energy equal to or greater than the bandgapof semiconducting materials are absorbed while excitingelectrons from the valence to conduction band, thus creating
electron and hole pairs. The generated electron–hole pairs canparticipate in a series of events: (i) recombine in the bulk andrelease energy in the form of heat or photoluminescence; (ii)diffuse/drift to the surface and recombine there or also takepart in redox reactions with adsorbates.
10957-4484/12/475711+08$33.00 c© 2012 IOP Publishing Ltd Printed in the UK & the USA
Nanotechnology 23 (2012) 475711 A Sarkar et al
Because of its photostability, abundance, and affordableprice, nanosized titanium dioxide (TiO2) has been a popularchoice of material in photocatalytic reactions. However,due to its large bandgap (3.2 eV for anatase, 3.0 eV forrutile), the absorption region is limited to the UV spectralrange and hence has low photoconversion efficiency underirradiation with solar light containing a fraction of only5% UV [1–9]. Several studies have aimed at enhancing thephotocatalytic activity of TiO2 by means of doping, variousthermal treatments and introducing defects. Doping TiO2with non-metals has been extensively explored to improve itsphotoefficiency and broaden its photoabsorption to the visibleregion [10–21]. N-doping in pure nitrogen gas under thermalconditions is a rarely adopted technique [10, 22]. Instead,ammonia has often been used as the source of nitrogen [23],since it decomposes to nitrogen and hydrogen above 500 ◦C,thus acting as a reductant as well as a nitrogen source.Hence, it would be interesting to explore and compare theeffect of annealing on the catalytic activity of nanosizedTiO2 anatase in nitrogen and ammonia gases. Recently,surface modification with H2 has also attracted attention [3,24–28]. According to the proposed mechanisms, oxygenvacancies [28] and Ti3+ cationic sites [27] form, which in turnact as defects, leading to a reduction in the bandgap [24] andenhancing the photocatalytic activity of TiO2 in the visiblespectral range [29].
Accordingly, in this work, we report on the change ofstructure/composition and on the photocatalytic efficiency ofa variety of TiO2 based photocatalyst nanoparticles treatedin N2, NH3 and H2 gases at temperatures between 350 and600 ◦C. In the photocatalytic experiments, we have studied(i) decomposition of methyl orange as a model compoundfor organic contaminants, (ii) survival of Staphylococcusaureus in suspensions and (iii) the number of generated freeshort-lived radicals in the presence of aqueous 3-carboxy-2,2,5,5-tetramethyl pyrrolidine-1-oxyl (PCA) solution.
2. Materials and methods
2.1. Material synthesis and structural characterization
Titanium dioxide (Sigma-Aldrich, <25 nm anatase, 99.7%)powder and methyl orange (J T Baker) were utilized asreceived. Water purified through a Millipore system wasused. The nanopowders were treated with either N2 (99.9%,AGA), 2% NH3 in N2 (Praxair) or H2 (99.995%, AGA) gas.Typically, 1 g of TiO2 powder was annealed at the selectedtemperatures (350, 450 or 600 ◦C) for 4 h while maintainingflow rates of 30 ml min−1 (in N2 or in H2) and 50 ml min−1
(in 2% NH3 in N2). In each experiment, two different heatingrates were tried (2 and 20 ◦C min−1), after which heating wascontinued for another 4 h. For the sake of convenience, thecatalysts treated in N2 at 350, 450 and 600 ◦C are denotedas TiO2/N2 X(A), where X denotes the annealing temperature(350 ◦C, 450 ◦C or 600 ◦C) and A denotes the heating rate(2 ◦C min−1 or 20 ◦C min−1). Similarly, TiO2 treated withNH3 and H2 is denoted as TiO2/NH3 X(A) and TiO2/H2 X(A),respectively.
The structure and chemical composition of the materialswere characterized using transmission electron microscopy(EFTEM, Leo 912 Omega, 120 kV, LaB6 filament), x-raypowder diffraction (XRD, Philips PW 1380 and SiemensD5000 employing Cu Kα radiation) and x-ray photoelectronspectroscopy (XPS, Kratos Axis Ultra DLD electronspectrometer, monochromated Al Kα source operated at150 W, charge neutralizer, analyzing area of 0.3× 0.7 mm2).
2.2. Photocatalytic decomposition of methyl orange
Dye degradation was monitored by measuring opticalabsorption using a Shimadzu UV 3101PC, UV–vis–NIRspectrophotometer. In a typical experiment, 0.02% w/wof catalyst was dispersed in 0.03 mM methyl orangeaqueous solution. The suspension was sonicated, followedby irradiation with continuous stirring, at an ambienttemperature. Four 6 W UV-B lamps emitting UV rays (SankyoDenki G6T5E, Japan, FWHM = 40 nm (280–320 nm))corresponding to a total intensity of ∼4 mW cm−2 wereused for irradiation. After centrifugation, the UV–visibleabsorbance spectrum of the residual methyl orange solutionwas measured as a function of time for each catalyst in therange of 200–700 nm. From the absorbance at λ = 464 nm,the concentration of methyl orange solution at each timeinterval was calculated using the calibration curve of thestandard solution.
2.3. Bacterial experiments
Cultures of S. aureus 209 P strain (obtained from the CultureCollection, SISC, Moscow, Russia) were grown on densebrain–heart infusion medium and incubated at 37 ◦C. Asa light source, a home-made light emitting diode (LED)with spectral maximum at 404 nm, bandwidth of 20 nmand power density of 70 mW cm−2 was used. Duringexperiments, light exposures of 5–30 min were applied tosuspensions of 0.02% w/w pristine TiO2, TiO2/N2 600(2),TiO2/N2 600(20), TiO2/NH3 600(2) and TiO2/NH3 600(20).In the bacterial experiments, a similar protocol as describedin [30] was used. In short, suspensions of nanoparticles andbacteria (1000 microbial cells per milliliter) were mixed andkept in the dark for 10 min before dispensing in multi-wellplates for light exposure. The culture was then distributedinto Petri dishes (with dense medium) to calculate the colonyforming units (CFUs) after incubation for 24–48 h at 37 ◦C.Colony forming units for bacteria not exposed to light orto catalyst nanoparticles were used as control. Data werecollected in two independent series of experiments, eachrepeated 10 times.
2.4. Electron paramagnetic resonance experiments
In the electron paramagnetic resonance (EPR) experiments,suspensions of N2 or NH3 treated TiO2 particles were used.Initially in a powder form, 3.6 mg of the particles weresuspended in 150 µl of 10 mM 3-carboxy-2,2,5,5-tetramethylpyrrolidine-1-oxyl (PCA) photocatalytic activity marker
2
Nanotechnology 23 (2012) 475711 A Sarkar et al
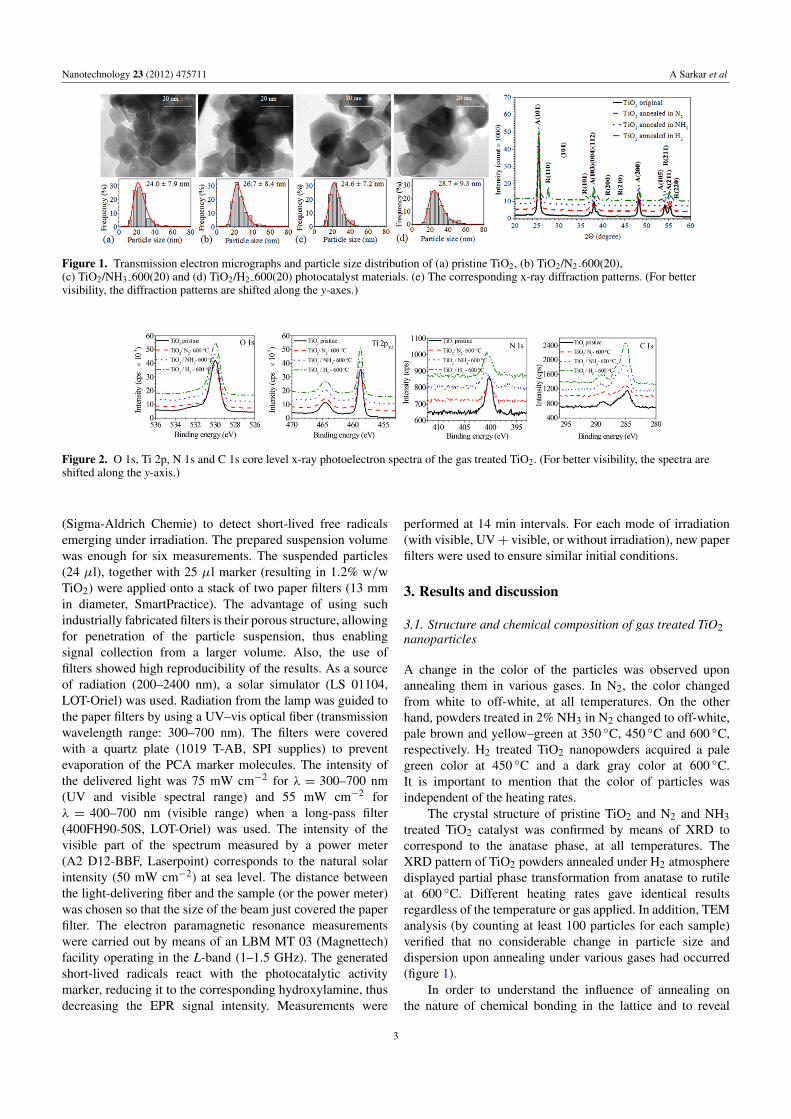
Figure 1. Transmission electron micrographs and particle size distribution of (a) pristine TiO2, (b) TiO2/N2 600(20),(c) TiO2/NH3 600(20) and (d) TiO2/H2 600(20) photocatalyst materials. (e) The corresponding x-ray diffraction patterns. (For bettervisibility, the diffraction patterns are shifted along the y-axes.)
Figure 2. O 1s, Ti 2p, N 1s and C 1s core level x-ray photoelectron spectra of the gas treated TiO2. (For better visibility, the spectra areshifted along the y-axis.)
(Sigma-Aldrich Chemie) to detect short-lived free radicalsemerging under irradiation. The prepared suspension volumewas enough for six measurements. The suspended particles(24 µl), together with 25 µl marker (resulting in 1.2% w/wTiO2) were applied onto a stack of two paper filters (13 mmin diameter, SmartPractice). The advantage of using suchindustrially fabricated filters is their porous structure, allowingfor penetration of the particle suspension, thus enablingsignal collection from a larger volume. Also, the use offilters showed high reproducibility of the results. As a sourceof radiation (200–2400 nm), a solar simulator (LS 01104,LOT-Oriel) was used. Radiation from the lamp was guided tothe paper filters by using a UV–vis optical fiber (transmissionwavelength range: 300–700 nm). The filters were coveredwith a quartz plate (1019 T-AB, SPI supplies) to preventevaporation of the PCA marker molecules. The intensity ofthe delivered light was 75 mW cm−2 for λ = 300–700 nm(UV and visible spectral range) and 55 mW cm−2 forλ = 400–700 nm (visible range) when a long-pass filter(400FH90-50S, LOT-Oriel) was used. The intensity of thevisible part of the spectrum measured by a power meter(A2 D12-BBF, Laserpoint) corresponds to the natural solarintensity (50 mW cm−2) at sea level. The distance betweenthe light-delivering fiber and the sample (or the power meter)was chosen so that the size of the beam just covered the paperfilter. The electron paramagnetic resonance measurementswere carried out by means of an LBM MT 03 (Magnettech)facility operating in the L-band (1–1.5 GHz). The generatedshort-lived radicals react with the photocatalytic activitymarker, reducing it to the corresponding hydroxylamine, thusdecreasing the EPR signal intensity. Measurements were
performed at 14 min intervals. For each mode of irradiation(with visible, UV+ visible, or without irradiation), new paperfilters were used to ensure similar initial conditions.
3. Results and discussion
3.1. Structure and chemical composition of gas treated TiO2nanoparticles
A change in the color of the particles was observed uponannealing them in various gases. In N2, the color changedfrom white to off-white, at all temperatures. On the otherhand, powders treated in 2% NH3 in N2 changed to off-white,pale brown and yellow–green at 350 ◦C, 450 ◦C and 600 ◦C,respectively. H2 treated TiO2 nanopowders acquired a palegreen color at 450 ◦C and a dark gray color at 600 ◦C.It is important to mention that the color of particles wasindependent of the heating rates.
The crystal structure of pristine TiO2 and N2 and NH3treated TiO2 catalyst was confirmed by means of XRD tocorrespond to the anatase phase, at all temperatures. TheXRD pattern of TiO2 powders annealed under H2 atmospheredisplayed partial phase transformation from anatase to rutileat 600 ◦C. Different heating rates gave identical resultsregardless of the temperature or gas applied. In addition, TEManalysis (by counting at least 100 particles for each sample)verified that no considerable change in particle size anddispersion upon annealing under various gases had occurred(figure 1).
In order to understand the influence of annealing onthe nature of chemical bonding in the lattice and to reveal
3
Nanotechnology 23 (2012) 475711 A Sarkar et al
Table 1. Binding energies (BEs) and atomic concentrations (at.%) of fitted components in O 1s, Ti 2p, N 1s and C 1s core level x-rayphotoelectron spectra of the gas treated TiO2 nanoparticle powders.
Pristine TiO2 TiO2/N2 600(20) TiO2/NH3 600(20) TiO2/H2 600(20) Peak assignment
N 1s Not detected Not detected 396.7 eV, Not detected Ti–N0.1 at.%399.6 eV
−NH2 and other contaminants400. 3 eV; 400. 2 eV; 0.1 at.% 400.6 eV,0.8 at.% 0.6 at.% 400.9 eV, 0.6 at.%
0.4 at.%Ti 2p3/2 458.8 eV; 458.8 eV; 458.8 eV; 458.8 eV; TiO2
27.9 at.% 28.5 at.% 27.0 at.% 26.6 at.%O 1s 530.0 eV; 530.0 eV; 530.0 eV; 530.0 eV; TiO2
53.2 at.% 54.5 at.% 53.9 at.% 52.1 at.%
531.0 eV; 531.0 eV; 531.1 eV; 531.1 eV; TiOH6.9 at.% 6.3 at.% 5.3 at.% 6.7 at.%
532.3 eV; 532.5 eV; 532.3 eV; 532.4 eV; C–O5.8 at.% 5.9 at.% 4.7 at.% 3.0 at.%
C 1s 284.8 eV 285.1 eV 285.2 eV, 285.0 eV, C–(C, H)3.1 at.% 2.9 at.% 5.1 at.% 6.7 at.%
286.4 eV 286.7 eV 286.7 eV, 286.5 eV, C–OH1.4 at.% 0.5 at.% 2.4 at.% 2.8 at.%
288.9 eV 288.7 eV 289.1 eV, 289.0 eV, COOH1.0 at.% 0.9 at.% 1.0 at.% 1.6 at.%
any variation of surface groups on TiO2, XPS analysis wasperformed (figure 2 and table 1).
No considerable differences in the O and Ti core levelspectra of the different types of gas treated sample couldbe observed. N core level spectra, however, demonstrateddistinct characteristic features. The N2 treated TiO2 particlesremained identical regardless of the annealing temperaturesand were comparable to pristine TiO2 nanoparticles.Interestingly, the NH3 treated sample demonstrated N-dopingonly at 600 ◦C, while at 350 and 450 ◦C the spectra weresimilar to those of the untreated sample. TiO2 annealed at600 ◦C at the rate of 2 ◦C min−1 (TiO2/NH3 600(2)) revealedtwo peaks for N 1s at the binding energies 396 and 400.2 eV,while TiO2 annealed at 600 ◦C at the rate of 20 ◦C min−1
(TiO2/NH3 600(20)) shows three peaks, at 396.7, 399.6 and400.9 eV, which can be assigned to binding energies of atypical N-doped TiO2 particle [10, 31–33]. The N 1s peakat ∼396 eV can be attributed to substitutional nitrogen,which is obtained by replacing oxygen in the lattice. Sincethe XRD analysis did not give evidence for formation ofTiN phase, a low percentage of oxygen substitution andformation of TiO(2−x)Nx rather than TiN is suggested. Thepeak at ∼399 eV is attributed to chemisorbed interstitialnitrogen, while the peak at 401 eV is due to NHx species andother contaminants adsorbed on the surface of TiO2 [34–37].N-doping on TiO2 increases the photocatalytic activity bynarrowing the bandgap of TiO2, thus shifting the absorptionfrom UV to visible light and expanding the absorption of solarlight.
Although H2 treatment of TiO2 has been reported already,in order to generate oxygen vacancies and also to lead toreduced Ti3+ in the lattice [27], we observed no change inthe Ti 2p core level spectra of the samples upon reduction at600 ◦C. Other studies also reported the formation of hydroxylgroups on the surface [24, 38], while our results show only
negligible differences in surface hydroxyl group concentrationafter gas treatment. It is not known whether the enhancementin photoactivity is a contribution of oxygen vacancies, Ti3+
or hydroxyl groups or a combined effect [27]. Chen et al [29]reported that, upon hydrogenation, the surface layers of TiO2were disordered, resulting in a shift in the valence bandand narrowing of the bandgap. Our results revealed that H2treated TiO2 samples were identical to pristine TiO2 under theexperimental conditions, in agreement with other studies [24].
A distinct feature, however, is the increase in organicsurface contaminants after annealing in NH3 and in H2 ascompared to the original or N2 treated powders. The sourceof carbon is unclear.
3.2. Photocatalytic degradation of methyl orange
Upon irradiation, the photogenerated electrons can react withdissolved oxygen in water and with oxygen adsorbed on thecatalyst surface. As a result, oxygen is reduced to superoxideradical anion O·−
2 . Simultaneously, photogenerated holesoxidize any organic moiety or react with either hydroxyl ionsor water to form hydroxyl radicals OH·− [39–41]. In a recentstudy [42], Yu et al showed that in dilute aqueous methylorange solutions (below 0.16 mM) the degradation of dye iscaused not entirely by the holes but also by hydroxyl radicals,which should also be true for our solutions (0.03 mM).
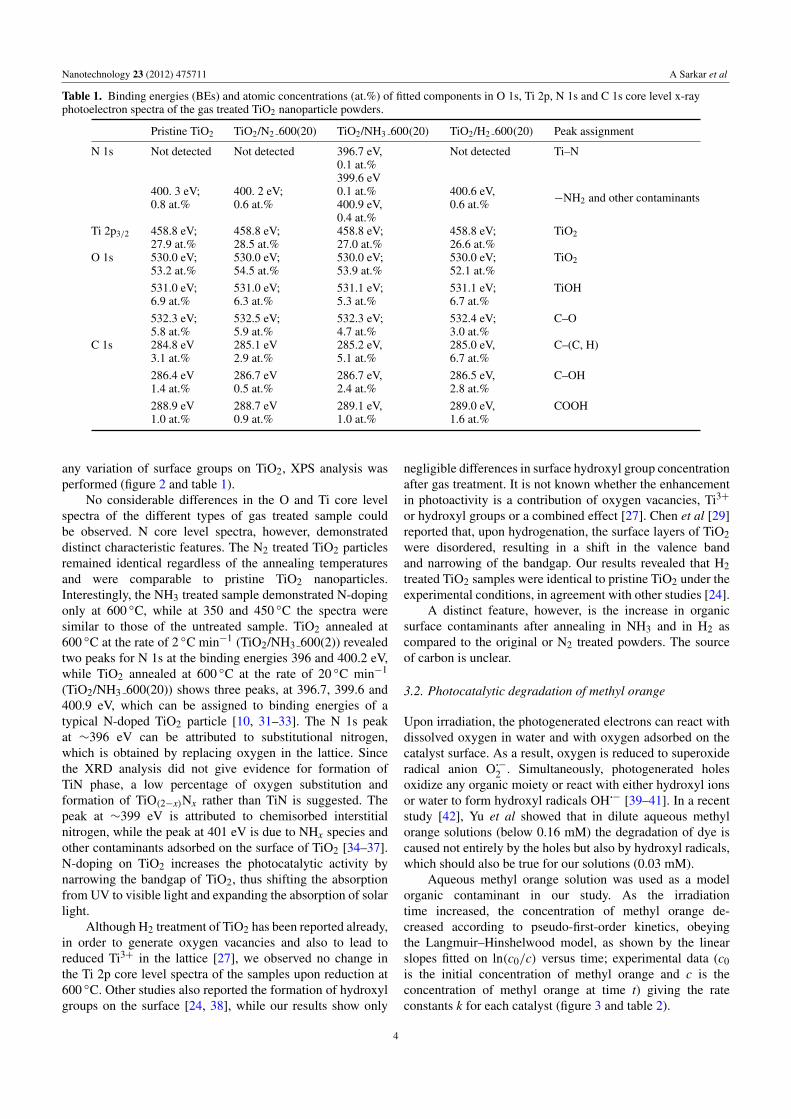
Aqueous methyl orange solution was used as a modelorganic contaminant in our study. As the irradiationtime increased, the concentration of methyl orange de-creased according to pseudo-first-order kinetics, obeyingthe Langmuir–Hinshelwood model, as shown by the linearslopes fitted on ln(c0/c) versus time; experimental data (c0is the initial concentration of methyl orange and c is theconcentration of methyl orange at time t) giving the rateconstants k for each catalyst (figure 3 and table 2).
4
Nanotechnology 23 (2012) 475711 A Sarkar et al
Figure 3. Kinetic plots of methyl orange degradation under UV-B irradiation in the presence of different types of treated TiO2 nanoparticlephotocatalyst powders.
Table 2. Rate constants of methyl orange decomposition as afunction of different photocatalysts.
Sample k (min−1) Sample k (min−1)
Pristine TiO2 0.016TiO2/N2 600(2) 0.024 TiO2/N2 600(20) 0.026TiO2/N2 450(2) 0.024 TiO2/N2 450(20) 0.021TiO2/N2 350(2) 0.024 TiO2/N2 350(20) 0.025TiO2/NH3 600(2) 0.010 TiO2/NH3 600(20) 0.011TiO2/NH3 450(2) 0.019 TiO2/NH3 450(20) 0.025TiO2/NH3 350(2) 0.015 TiO2/NH3 350(20) 0.024TiO2/H2 600(2) 0.023 TiO2/H2 600(20) 0.020TiO2/H2 450(2) 0.015 TiO2/H2 450(20) 0.013
All the various TiO2 catalysts treated in N2 demonstratedmarginal differences in activity, regardless of the differentheating rates. However, the activity was clearly highercompared to pristine TiO2 nanopowder. Surprisingly, theN-doped samples (i.e. calcined in NH3 at 600 ◦C) exhibitedlower activity than the non-doped ones. This seems tocontradict the hypothesis of the bandgap narrowing effectof N-doping in TiO2 [43–45]. It is a general observationthat N-doped TiO2 materials show better visible lightphotocatalytic activity. However, under UV irradiation anopposite effect is seen upon doping [46], due to the formedoxygen vacancies, which act as recombination centers forholes and electrons, leading to lower UV activity as suggestedby Irie et al [46].
The catalyst treated with NH3, at temperatures of350 ◦C and 450 ◦C, demonstrated higher activity when thetemperature was ramped at 20 ◦C min−1 as compared to2 ◦C min−1. The catalyst treated with H2 gas displayedactivity equal to or higher than that of pristine TiO2 particles.Furthermore, the catalysts exposed to H2 demonstrated areverse trend; i.e., higher catalytic activity was observed uponhigher treatment temperature, which could be due to partialphase transition from anatase to rutile at 600 ◦C. These resultssuggest that not only does the narrowed bandgap give riseto different levels of catalytic activity but also the surfacechemistry of TiO2 can influence the overall photocatalyticbehavior.
3.3. Photocatalytic action on S. aureus
Several groups have shown a steady photocatalytic antibac-terial effect of TiO2 nanoparticles under the action of UV
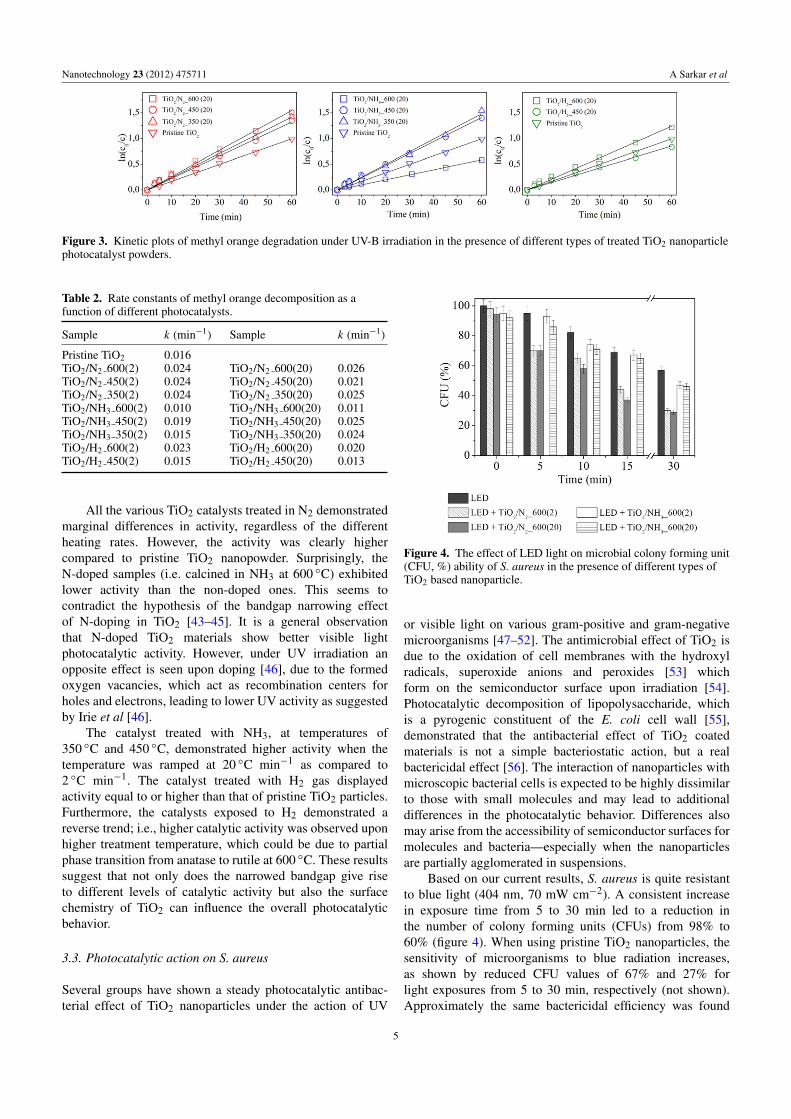
Figure 4. The effect of LED light on microbial colony forming unit(CFU, %) ability of S. aureus in the presence of different types ofTiO2 based nanoparticle.
or visible light on various gram-positive and gram-negativemicroorganisms [47–52]. The antimicrobial effect of TiO2 isdue to the oxidation of cell membranes with the hydroxylradicals, superoxide anions and peroxides [53] whichform on the semiconductor surface upon irradiation [54].Photocatalytic decomposition of lipopolysaccharide, whichis a pyrogenic constituent of the E. coli cell wall [55],demonstrated that the antibacterial effect of TiO2 coatedmaterials is not a simple bacteriostatic action, but a realbactericidal effect [56]. The interaction of nanoparticles withmicroscopic bacterial cells is expected to be highly dissimilarto those with small molecules and may lead to additionaldifferences in the photocatalytic behavior. Differences alsomay arise from the accessibility of semiconductor surfaces formolecules and bacteria—especially when the nanoparticlesare partially agglomerated in suspensions.
Based on our current results, S. aureus is quite resistantto blue light (404 nm, 70 mW cm−2). A consistent increasein exposure time from 5 to 30 min led to a reduction inthe number of colony forming units (CFUs) from 98% to60% (figure 4). When using pristine TiO2 nanoparticles, thesensitivity of microorganisms to blue radiation increases,as shown by reduced CFU values of 67% and 27% forlight exposures from 5 to 30 min, respectively (not shown).Approximately the same bactericidal efficiency was found
5
Nanotechnology 23 (2012) 475711 A Sarkar et al
Figure 5. EPR based kinetic plots of short-lived radical formation under different kinds of irradiation in presence of treated TiO2nanoparticle photocatalyst powders.
for TiO2 nanoparticle samples treated in N2. After a 30 minexposure, CFU numbers were 30% and 29%, respectively.Also, surprisingly, the nanoparticles treated with NH3 inN2 were less efficient (CFUs of 47% and 46%) than thoseannealed in N2. However, this result corresponds well to thestudies of photocatalytic degradation of methyl orange undersimilar nanoparticle suspensions but at different irradiationconditions (see figure 3).
Bacterial treatment with blue light (404 nm) insteadof UV-B (280–320 nm) or UV-A (320–400 nm) wasmotivated by future medical applications upon treatmentof inflammatory diseases, such as skin acne [57–60],gingivitis [61–63], and maxillary sinusitis [64]; namely, thelonger wavelength light is more penetrative into tissues(typically microorganisms colonize the epithelial layer ofmucosa and skin appendages) and has less effect oncell genetic apparatus. Furthermore, blue light can beused to treat dermatological diseases caused by antibiotic-resistant bacterial strains [65–67], as well as to correct anumber of symbiotic microorganisms of skin and mucousmembranes [60, 65]. In our previous studies we haveshown that the use of blue light in combination withTiO2 nanoparticles and various photosensitizers effectivelydecreases the quantity of microorganisms [30, 60, 68, 69].
3.4. Radical production by nanoparticles
Photoactivity of catalytic materials can also be assessed bythe electron paramagnetic resonance (EPR) technique bymeasuring the number of generated free short-lived radicalsemerging under irradiation [70, 71]. This method allows forthe detection of microwave energy absorbed by unpairedelectrons on outer orbitals of the formed radicals. Withan appropriate choice of stable markers responsible forEPR signal generation (e.g., 3-carboxy-2,2,5,5-tetramethylpyrrolidine-1-oxyl), the technique is an efficient tool even atroom temperature.
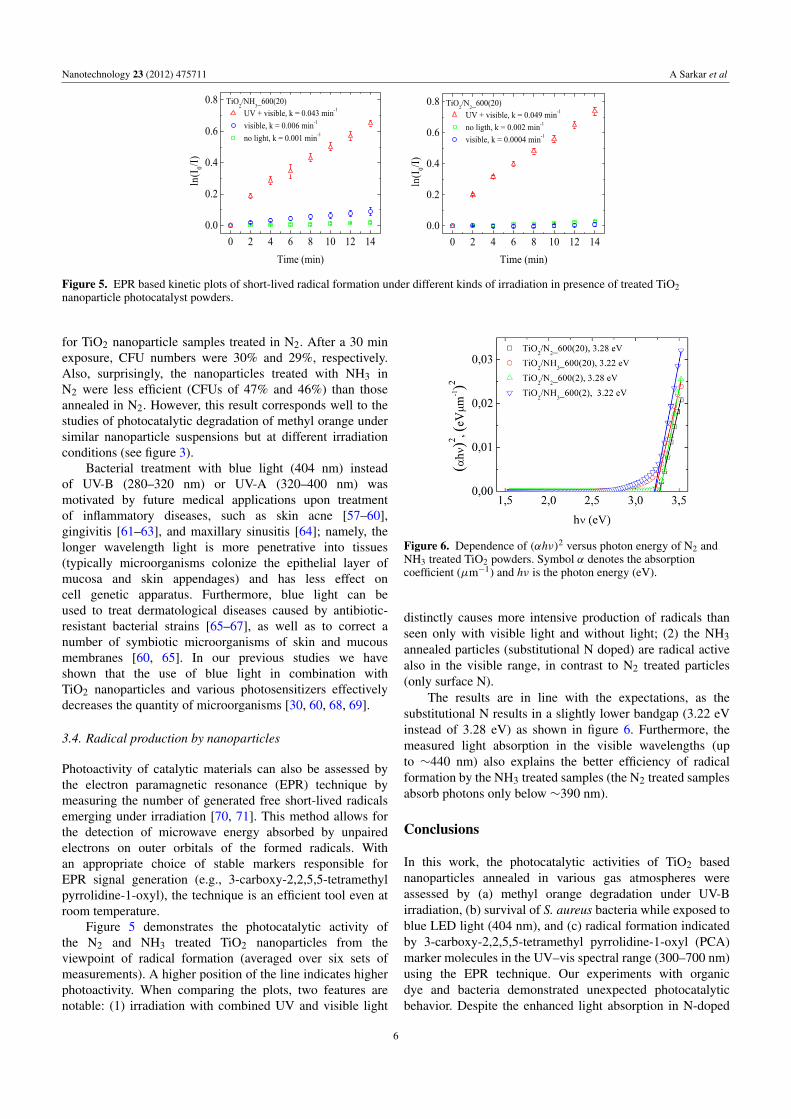
Figure 5 demonstrates the photocatalytic activity ofthe N2 and NH3 treated TiO2 nanoparticles from theviewpoint of radical formation (averaged over six sets ofmeasurements). A higher position of the line indicates higherphotoactivity. When comparing the plots, two features arenotable: (1) irradiation with combined UV and visible light
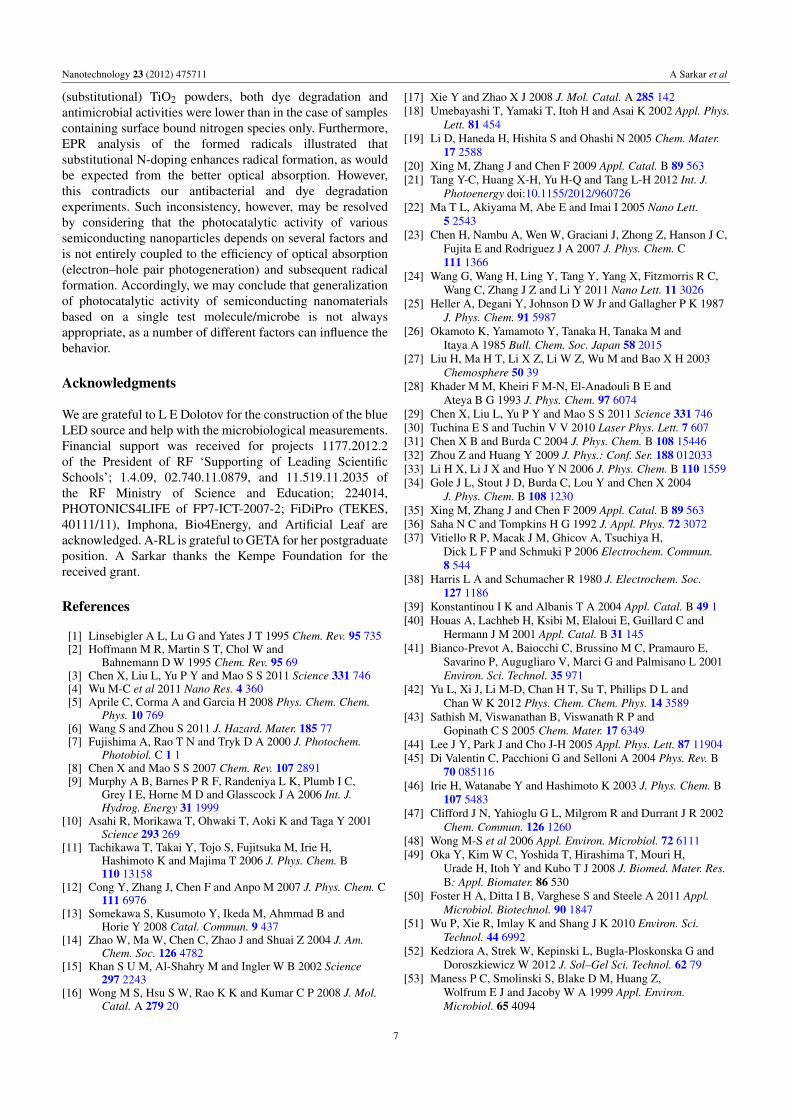
Figure 6. Dependence of (αhν)2 versus photon energy of N2 andNH3 treated TiO2 powders. Symbol α denotes the absorptioncoefficient (µm−1) and hν is the photon energy (eV).
distinctly causes more intensive production of radicals thanseen only with visible light and without light; (2) the NH3annealed particles (substitutional N doped) are radical activealso in the visible range, in contrast to N2 treated particles(only surface N).
The results are in line with the expectations, as thesubstitutional N results in a slightly lower bandgap (3.22 eVinstead of 3.28 eV) as shown in figure 6. Furthermore, themeasured light absorption in the visible wavelengths (upto ∼440 nm) also explains the better efficiency of radicalformation by the NH3 treated samples (the N2 treated samplesabsorb photons only below ∼390 nm).
Conclusions
In this work, the photocatalytic activities of TiO2 basednanoparticles annealed in various gas atmospheres wereassessed by (a) methyl orange degradation under UV-Birradiation, (b) survival of S. aureus bacteria while exposed toblue LED light (404 nm), and (c) radical formation indicatedby 3-carboxy-2,2,5,5-tetramethyl pyrrolidine-1-oxyl (PCA)marker molecules in the UV–vis spectral range (300–700 nm)using the EPR technique. Our experiments with organicdye and bacteria demonstrated unexpected photocatalyticbehavior. Despite the enhanced light absorption in N-doped
6
Nanotechnology 23 (2012) 475711 A Sarkar et al
(substitutional) TiO2 powders, both dye degradation andantimicrobial activities were lower than in the case of samplescontaining surface bound nitrogen species only. Furthermore,EPR analysis of the formed radicals illustrated thatsubstitutional N-doping enhances radical formation, as wouldbe expected from the better optical absorption. However,this contradicts our antibacterial and dye degradationexperiments. Such inconsistency, however, may be resolvedby considering that the photocatalytic activity of varioussemiconducting nanoparticles depends on several factors andis not entirely coupled to the efficiency of optical absorption(electron–hole pair photogeneration) and subsequent radicalformation. Accordingly, we may conclude that generalizationof photocatalytic activity of semiconducting nanomaterialsbased on a single test molecule/microbe is not alwaysappropriate, as a number of different factors can influence thebehavior.
Acknowledgments
We are grateful to L E Dolotov for the construction of the blueLED source and help with the microbiological measurements.Financial support was received for projects 1177.2012.2of the President of RF ‘Supporting of Leading ScientificSchools’; 1.4.09, 02.740.11.0879, and 11.519.11.2035 ofthe RF Ministry of Science and Education; 224014,PHOTONICS4LIFE of FP7-ICT-2007-2; FiDiPro (TEKES,40111/11), Imphona, Bio4Energy, and Artificial Leaf areacknowledged. A-RL is grateful to GETA for her postgraduateposition. A Sarkar thanks the Kempe Foundation for thereceived grant.
References
[1] Linsebigler A L, Lu G and Yates J T 1995 Chem. Rev. 95 735[2] Hoffmann M R, Martin S T, Chol W and
Bahnemann D W 1995 Chem. Rev. 95 69[3] Chen X, Liu L, Yu P Y and Mao S S 2011 Science 331 746[4] Wu M-C et al 2011 Nano Res. 4 360[5] Aprile C, Corma A and Garcia H 2008 Phys. Chem. Chem.
Phys. 10 769[6] Wang S and Zhou S 2011 J. Hazard. Mater. 185 77[7] Fujishima A, Rao T N and Tryk D A 2000 J. Photochem.
Photobiol. C 1 1[8] Chen X and Mao S S 2007 Chem. Rev. 107 2891[9] Murphy A B, Barnes P R F, Randeniya L K, Plumb I C,
Grey I E, Horne M D and Glasscock J A 2006 Int. J.Hydrog. Energy 31 1999
[10] Asahi R, Morikawa T, Ohwaki T, Aoki K and Taga Y 2001Science 293 269
[11] Tachikawa T, Takai Y, Tojo S, Fujitsuka M, Irie H,Hashimoto K and Majima T 2006 J. Phys. Chem. B110 13158
[12] Cong Y, Zhang J, Chen F and Anpo M 2007 J. Phys. Chem. C111 6976
[13] Somekawa S, Kusumoto Y, Ikeda M, Ahmmad B andHorie Y 2008 Catal. Commun. 9 437
[14] Zhao W, Ma W, Chen C, Zhao J and Shuai Z 2004 J. Am.Chem. Soc. 126 4782
[15] Khan S U M, Al-Shahry M and Ingler W B 2002 Science297 2243
[16] Wong M S, Hsu S W, Rao K K and Kumar C P 2008 J. Mol.Catal. A 279 20
[17] Xie Y and Zhao X J 2008 J. Mol. Catal. A 285 142[18] Umebayashi T, Yamaki T, Itoh H and Asai K 2002 Appl. Phys.
Lett. 81 454[19] Li D, Haneda H, Hishita S and Ohashi N 2005 Chem. Mater.
17 2588[20] Xing M, Zhang J and Chen F 2009 Appl. Catal. B 89 563[21] Tang Y-C, Huang X-H, Yu H-Q and Tang L-H 2012 Int. J.
Photoenergy doi:10.1155/2012/960726[22] Ma T L, Akiyama M, Abe E and Imai I 2005 Nano Lett.
5 2543[23] Chen H, Nambu A, Wen W, Graciani J, Zhong Z, Hanson J C,
Fujita E and Rodriguez J A 2007 J. Phys. Chem. C111 1366
[24] Wang G, Wang H, Ling Y, Tang Y, Yang X, Fitzmorris R C,Wang C, Zhang J Z and Li Y 2011 Nano Lett. 11 3026
[25] Heller A, Degani Y, Johnson D W Jr and Gallagher P K 1987J. Phys. Chem. 91 5987
[26] Okamoto K, Yamamoto Y, Tanaka H, Tanaka M andItaya A 1985 Bull. Chem. Soc. Japan 58 2015
[27] Liu H, Ma H T, Li X Z, Li W Z, Wu M and Bao X H 2003Chemosphere 50 39
[28] Khader M M, Kheiri F M-N, El-Anadouli B E andAteya B G 1993 J. Phys. Chem. 97 6074
[29] Chen X, Liu L, Yu P Y and Mao S S 2011 Science 331 746[30] Tuchina E S and Tuchin V V 2010 Laser Phys. Lett. 7 607[31] Chen X B and Burda C 2004 J. Phys. Chem. B 108 15446[32] Zhou Z and Huang Y 2009 J. Phys.: Conf. Ser. 188 012033[33] Li H X, Li J X and Huo Y N 2006 J. Phys. Chem. B 110 1559[34] Gole J L, Stout J D, Burda C, Lou Y and Chen X 2004
J. Phys. Chem. B 108 1230[35] Xing M, Zhang J and Chen F 2009 Appl. Catal. B 89 563[36] Saha N C and Tompkins H G 1992 J. Appl. Phys. 72 3072[37] Vitiello R P, Macak J M, Ghicov A, Tsuchiya H,
Dick L F P and Schmuki P 2006 Electrochem. Commun.8 544
[38] Harris L A and Schumacher R 1980 J. Electrochem. Soc.127 1186
[39] Konstantinou I K and Albanis T A 2004 Appl. Catal. B 49 1[40] Houas A, Lachheb H, Ksibi M, Elaloui E, Guillard C and
Hermann J M 2001 Appl. Catal. B 31 145[41] Bianco-Prevot A, Baiocchi C, Brussino M C, Pramauro E,
Savarino P, Augugliaro V, Marci G and Palmisano L 2001Environ. Sci. Technol. 35 971
[42] Yu L, Xi J, Li M-D, Chan H T, Su T, Phillips D L andChan W K 2012 Phys. Chem. Chem. Phys. 14 3589
[43] Sathish M, Viswanathan B, Viswanath R P andGopinath C S 2005 Chem. Mater. 17 6349
[44] Lee J Y, Park J and Cho J-H 2005 Appl. Phys. Lett. 87 11904[45] Di Valentin C, Pacchioni G and Selloni A 2004 Phys. Rev. B
70 085116[46] Irie H, Watanabe Y and Hashimoto K 2003 J. Phys. Chem. B
107 5483[47] Clifford J N, Yahioglu G L, Milgrom R and Durrant J R 2002
Chem. Commun. 126 1260[48] Wong M-S et al 2006 Appl. Environ. Microbiol. 72 6111[49] Oka Y, Kim W C, Yoshida T, Hirashima T, Mouri H,
Urade H, Itoh Y and Kubo T J 2008 J. Biomed. Mater. Res.B: Appl. Biomater. 86 530
[50] Foster H A, Ditta I B, Varghese S and Steele A 2011 Appl.Microbiol. Biotechnol. 90 1847
[51] Wu P, Xie R, Imlay K and Shang J K 2010 Environ. Sci.Technol. 44 6992
[52] Kedziora A, Strek W, Kepinski L, Bugla-Ploskonska G andDoroszkiewicz W 2012 J. Sol–Gel Sci. Technol. 62 79
[53] Maness P C, Smolinski S, Blake D M, Huang Z,Wolfrum E J and Jacoby W A 1999 Appl. Environ.Microbiol. 65 4094
7

Nanotechnology 23 (2012) 475711 A Sarkar et al
[54] Sroiraya S, Triampo W, Morales N P and Triampo D 2008J. Ceram. Proc. Res. 9 146
[55] Sunada K, Watanabe T and Hashimoto K 2003 J. Photochem.Photobiol. A 156 227
[56] Kiwi J and Nadtochenko V 2005 Langmuir 21 4631[57] Sigurdsson V, Knulst A C and van Weelden H 1997
Dermatology 194 256[58] Papageorgiou P, Katsambas A and Chu A 2000 Br. J.
Dermatol. 142 973[59] Kawada A, Aragane Y, Kameyama H, Sangen Y and
Tezuka T 2002 J. Dermatol. Sci. 30 129[60] Tuchina E S and Tuchin V V 2009 Proc. SPIE 7165 71650I[61] Soukos N S, Som S, Abernethy A D, Ruggiero K, Dunham J,
Lee C, Doukas A G and Goodson J M 2005 Antimicrob.Agents Chemother. 49 1391
[62] Kotoku Y, Kato J, Akashi G, Hirai Y and Ishihara K 2009Laser Phys. Lett. 6 388
[63] Genina E A, Titorenko V A, Simonenko G V, Bashkatov A N,Shub G M, Lepilin A B, Tuchin V V, Yaroslavsky I V andAltshuler G B 2011 J. Innov. Opt. Health Sci. 4 437
[64] Genina E A, Bashkatov A N, Chikina E E, Knyazev A B,Mareev O V and Tuchin V V 2006 Laser Phys. 16 1128
[65] Zeina B, Greenman J, Purcell W M and Das B 2001 Br. J.Dermatol. 144 274
[66] Guffey J S and Wilborn J 2006 Photomed. Laser Surg. 24 684[67] Enwemeka C S, Williams D, Hollosi S, Yens D and
Enwemeka S K 2008 Lasers Surg. Med. 40 734[68] Tuchina E S and Tuchin V V 2010 Proc. SPIE 7576 75761L[69] Tuchina E S and Tuchin V V 2011 Proc. SPIE 7887 78870A[70] Popov A P, Haag S, Meinke M, Lademann J,
Priezzhev A V and Myllyla R 2009 J. Biomed. Opt.14 021011
[71] Popov A P, Zvyagin A V, Lademann J, Roberts M S,Sanchez W, Priezzhev A V and Myllyla R 2010 Proc. SPIE7715 77153G
8