Embed Size (px)
Citation preview

John ZastrowJohn Zastrow
Photoacclimation of the diatom Photoacclimation of the diatom Asterionella formosaAsterionella formosa in a simulated in a simulated
vertically mixed water columnvertically mixed water column

•• Changes in photosynthetic apparatus which Changes in photosynthetic apparatus which result in cells being better able to utilize their result in cells being better able to utilize their light climatelight climate
• Response to changes in light intensity and quality (spectral distribution)
• Distinct from diel cycle
• Occurs within the lifespan of a single cell (is not adaptation)
• Changes in morphology and biochemical composition varies with algal group
PhotoacclimationPhotoacclimation

•• Change number & density of thylakoid Change number & density of thylakoid membranes, adjust amount and ratio of membranes, adjust amount and ratio of photopigments, move chloroplasts photopigments, move chloroplasts
•• Increase size of photosynthetic units (Increase size of photosynthetic units (PSUsPSUs) ) embedded in thylakoid membrane, embedded in thylakoid membrane, egeg. Add . Add chlorophyll chlorophyll aa molecules (increases molecules (increases efficiencyefficiency, , but not capacity of photosynthesis)but not capacity of photosynthesis)
•• And/or increase number of And/or increase number of PSUs egPSUs eg, adds , adds chlorophyll chlorophyll aa and electron transport capacity (can and electron transport capacity (can increase efficiency, but primarily raises capacity)increase efficiency, but primarily raises capacity)
Strategies of acclimationStrategies of acclimation
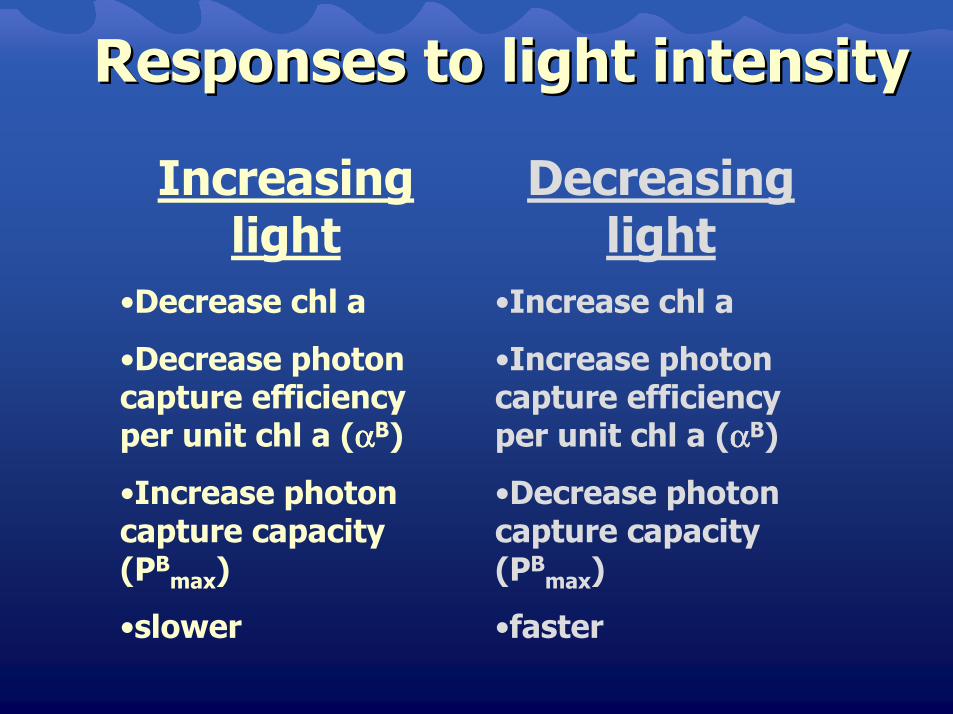
Responses to light intensityResponses to light intensity
Increasing light
•Decrease chl a
•Decrease photon capture efficiency per unit chl a (ααααB)
•Increase photon capture capacity (PB
max)
•slower
Decreasing light
•Increase chl a
•Increase photon capture efficiency per unit chl a (ααααB)
•Decrease photon capture capacity (PB
max)
•faster
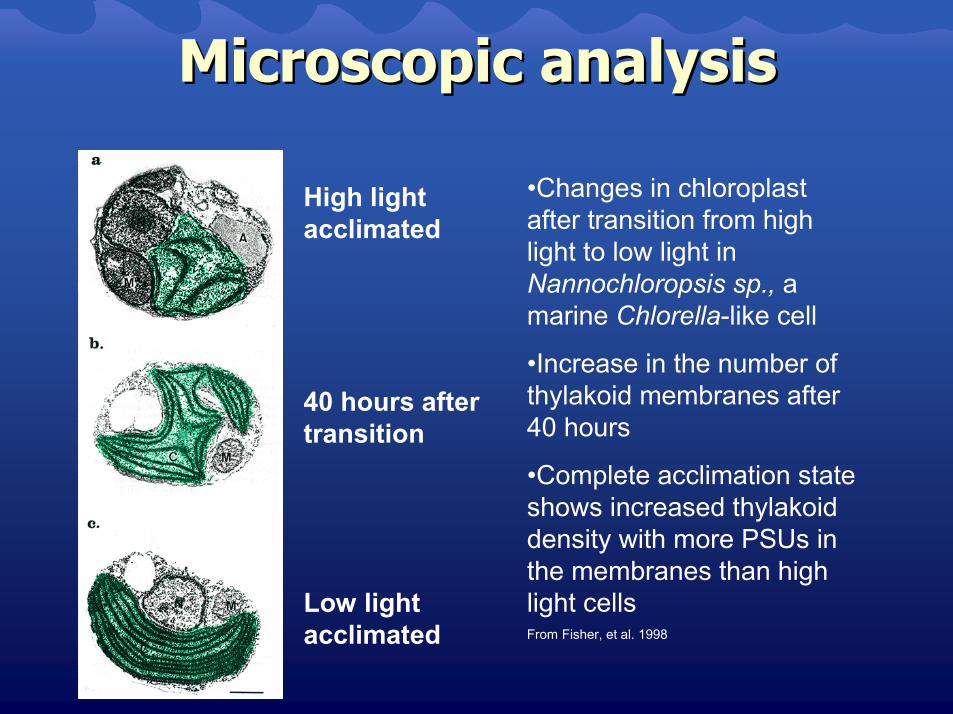
Microscopic analysisMicroscopic analysis
•Changes in chloroplast after transition from high light to low light inNannochloropsis sp., a marine Chlorella-like cell
•Increase in the number of thylakoid membranes after 40 hours
•Complete acclimation state shows increased thylakoid density with more PSUs in the membranes than high light cellsFrom Fisher, et al. 1998
High light acclimated
40 hours aftertransition
Low light acclimated
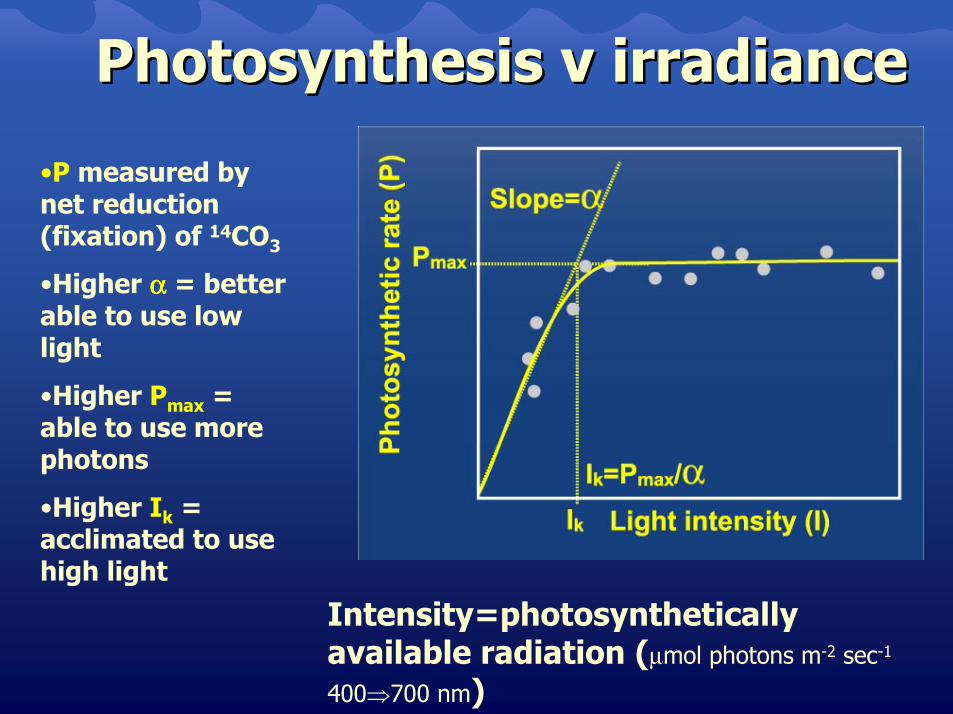
Photosynthesis v irradiancePhotosynthesis v irradiance
•P measured by net reduction (fixation) of 14CO3
•Higher αααα = better able to use low light
•Higher Pmax = able to use more photons
•Higher Ik = acclimated to use high light
Intensity=photosynthetically available radiation (µmol photons m-2 sec-1
400⇒700 nm)

Fox PointFox Point
1234567891011121314151617181920
100 200 300 400 500 600 700 800 900
Depth (m)
umol photons m-2 sec-1
Sim
ulat
ed li
ght
inte
nsiti
es
Sim
ulat
ed li
ght
inte
nsiti
es ~250 ~250 umol umol @ 1.5m@ 1.5m
~10 ~10 umol umol @ 16.5 m@ 16.5 m

Observed photoacclimationObserved photoacclimation
•Collection of observed parameters for mid-spring at Fox Point from 1986-1997
•PBmax does not change
with depth, but AlphaB
acclimates to lower light with depth
•Evidence of acclimation, but no knowledge of physical mixing rates

g C m-2 year-1 Scenario Difference from
observed (g C)Basinwide impact
(kg C year-1)
Impact to fish food (kg C year-1,10%
conversion)
Impact to fish (kg C year-1,10% conversion)
Basin area (km)(GLIN) 57,800 118.5 ObservedAssume 70% area > depth than euphotic
zone40,460 90.7 Alpha=4 27.8 1,124,788,000 112,478,800 11,247,880
Deep lake area (m) 40,460,000,000 104.4 Alpha=5 14.1 570,486,000 57,048,600 5,704,860116.6 Alpha=6 1.9 76,874,000 7,687,400 768,740127.2 Alpha=7 -8.7 -352,002,000 -35,200,200 -3,520,020
Importance of photoacclimationImportance of photoacclimation

This study2 - 6 dExperimentalGallegos & Platt (1982)0.14 – 1.3 hExperimental
Falkowski & Wirick (1981)4.6 – 460 dMathematical
Platt & Gallegos (1980)~3 dMathematical
Marra (1978)1-1.5 hExperimental
Kremer & Nixon (1978)~ 3 hExperimental
Jewson & Wood (1975)0.05 hExperimental
Harris & Lott (1973)~ 0.1 hExperimental
ReferenceComplete mixing time
Type of simulation
From Lewis, Cullen and Platt (1984)
Mixing in prior studiesMixing in prior studies

•• Detect and characterize photoacclimation Detect and characterize photoacclimation under conditions somewhat like Fox Point under conditions somewhat like Fox Point stationstation
•• Determine a rate of transport through the Determine a rate of transport through the light gradient that exceeds light gradient that exceeds A. A. formosa’aformosa’aability to acclimateability to acclimate
•• Relate results to conditions found in Lake Relate results to conditions found in Lake MichiganMichigan
ObjectivesObjectives

MethodsMethods

Natural assemblageNatural assemblage
Taxa encountered during 1976 at Fox Point; Ristic, 1977
BACILLARIOPHYCEAE BACILLARIOPHYCEAE (DIATOMS)(DIATOMS)
CENTRALES•Discineae
–Aulicosira spp.–Cyclotella spp.–Stephanodiscus spp.
•Soleniineae–Rhizosolenia eriensis
PENNALES•Araphidineae
–Tabellaria spp.–Fragilaria spp.–Asterionella formosa–Synedra spp.
•Biraphidineae–Navicula spp.–Amphora spp.–Cymbella spp.–Nitzschia spp.–Cymatopleura solea
CHLOROPHYTA CHLOROPHYTA (GREEN ALGAE)(GREEN ALGAE)
TETRASPORALES–Elakatothrix spp.–Gloeocystis spp.
ULOTRICHALES–Ulothrix spp.
CHLOROCOCCALES–Actinastrum spp.–Ankinastrum sp.–Crucigenia spp.–Franceia spp.–Golenkinia spp.–Lagerheimia spp.–Oocystis spp.–Pediastrum boryanum–Scenedesmus spp.
ZYGNEMATALES–Mougeotia sp.
DESMIDS–Cosmarium sp.–Staurastrum sp.
CYANOPHYTACYANOPHYTA–Anabaena spp.–Chroococcus spp.–Coelosphaerium sp.–Gloeocapsa sp.–Lyngbya sp.–Microcystis spp.–Spirulina major
PYRRHOPHYTAPYRRHOPHYTA–Ceratium hirundinella spp.–Peridinium spp.
CHRYSOPHYTACHRYSOPHYTA–Dinobryon spp.
CRYPTOPHYACRYPTOPHYA–Cryptomonas spp.–Rhodomonas sp.

Study speciesStudy species
Micrograph by Patrick Eberland, REU 2000
•Asterionella formosa
•Represent diatoms found in L. Michigan in spring
•Able to conduct cell counts in particle counter versus visual counting
•Easy to culture

•• Rate of travel controlled Rate of travel controlled by programmable by programmable stepping motorstepping motor
•• MIXMIX samples are in samples are in motion. motion. TOPTOP and and BOTBOTtom tom samples are samples are fixed in position in static fixed in position in static columncolumn
•• Samples in Samples in WALKWALKtreatment remained in treatment remained in growth chamber growth chamber
•• Bubbles to keep Bubbles to keep columns homothermal columns homothermal and increase light and increase light attenuationattenuation
Incubation columnsIncubation columns
Irradiance~250 umol
~5 umol
1000 watt Super MetalarcLamps (12/12 diel cycle)
Height4m
Static column Mixed column
Chilling Units (4 C )
Computer programablestepping motor
Agitationmotor
Sample bottles

Exposure vesselsExposure vessels
•• Each treatment (TOP, Each treatment (TOP, BOT, MIX, WALK) in BOT, MIX, WALK) in each experiment used each experiment used 15 bottles and 3 were 15 bottles and 3 were removed as replicates removed as replicates for each samplingfor each sampling
•• Bottle diameter meant Bottle diameter meant each treatment each treatment spanned significant spanned significant amount of the light amount of the light gradientgradient
•• SelfSelf--shading by the shading by the bottlesbottles

Column incubation Column incubation methodsmethods
•• Replicate bottles within each column Replicate bottles within each column under same conditions (12/12 L/D, 4°C)under same conditions (12/12 L/D, 4°C)
•• Samples removed at 24 hour intervals Samples removed at 24 hour intervals throughout incubation and assayed for throughout incubation and assayed for acclimation responseacclimation response
• Measured light dose, cell count, pigment content and ratios, photosynthetic parameters
•• Process repeated at different mixing rates Process repeated at different mixing rates (Period = 2 and 12 days)(Period = 2 and 12 days)

Total daily light doseTotal daily light dose
•Conversion from lumens to PAR used empirical relationship for the columns and data from an intensity logger attached to the bottles
•For the TOP and BOT and WALK treatments, TDLD is calculated from constant PAR
•D is the duration between recordings in seconds
(Intensity)(Intensity)0.250.25 = HLIR= HLIRHLIR= a*PAR^HLIR= a*PAR^bb
PAR = (HLIR/0.832) PAR = (HLIR/0.832) (1/0.253)(1/0.253)
TDLD (24 hours) = (PAR * D) / 1x10TDLD (24 hours) = (PAR * D) / 1x1066

Cell countsCell counts
•All counting done with 3-4 replicate counts per sample using Coulter particle counter
•Coulter particle size histogram was binned to generalize cells/colony determined from microscope counts
8 cells/colony is very common in A. formosa

Photosynthetic modelingPhotosynthetic modeling
•• Used Used JassbyJassby and Platt, 1976 and Platt, 1976 formulation throughout studyformulation throughout study
•• Fitted with SYSTAT, then with Fitted with SYSTAT, then with dedicated application (Fee)dedicated application (Fee)
•• All parameters are cellAll parameters are cell--specific, specific, egeg. . PPcellmaxcellmax==µµµµµµµµg g 1414C (20,000 cells)C (20,000 cells)--11 µµµµµµµµmol photons hourmol photons hour--11
•• Or cellular chlorophyllOr cellular chlorophyll--specific, specific, egeg. . PPBB
cellmaxcellmax==µµµµµµµµg g 1414C (pg Chl C (pg Chl aa cellcell--11) ) µµµµµµµµmol photons hourmol photons hour--11

In vitro pigment absorptionIn vitro pigment absorption

Fucoxanthin absorbanceFucoxanthin absorbance
Source: Jeffrey, S. W., R. F. C. Mantoura, et al. (1997). Phytoplankton pigments in oceanography. Paris, United Nations Educational, Scientific and Cultural Organization.

• In vitro pigment concentration determined through spectrophotometric analysis
• Chlorophyll a, c1+c2 determined through derivation of Jeffrey and Humphrey's trichromatic equations
• Carotenoids were calc’d from absorbance maxima (Mantoura 1983; Rowan 1989)
• Fucoxanthin-like absorbance CELLFUCO= (ABS 444+446+449+467+469+471+473) / CELLCOUNT
• ββββ-carotene-like absorbanceCELLBCARO=(ABS 449+453+475+477+480) / CELLCOUNT
Pigment analysisPigment analysis

ResultsResults

Light exposuresLight exposures•Experiments 0205 and 0325 had MIX sampled that traversed the light gradient every 24 hours.
•0226 traversed every 144 hours (6 days) and WALK treatment
•0325 had an entrainment acclimation of 7 days before sampling began
Days of experiment
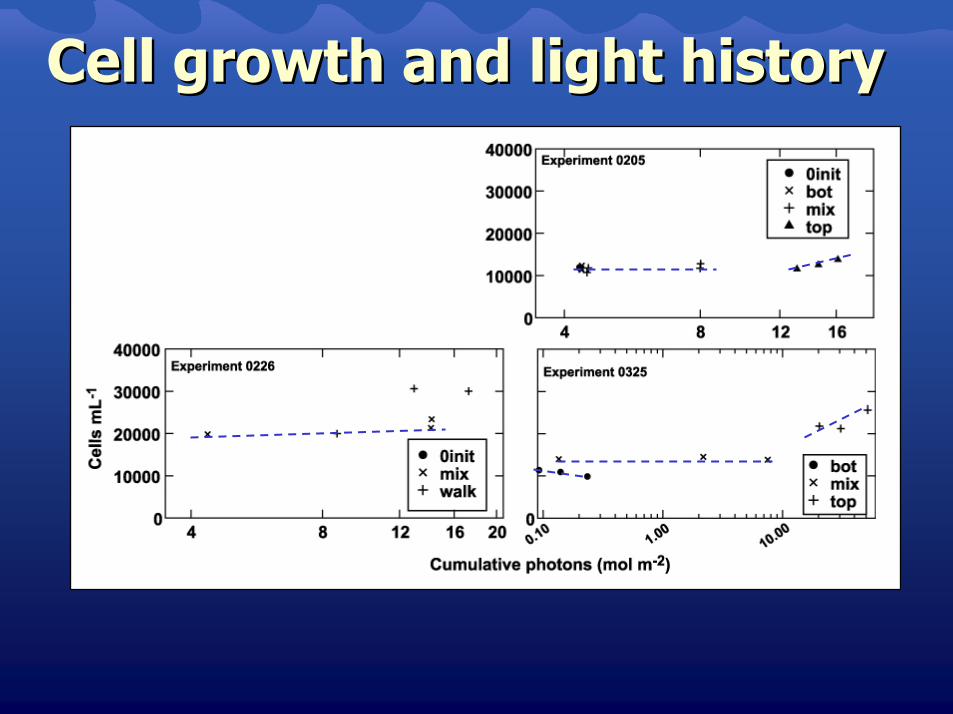
Cell growth and light historyCell growth and light history

Chlorophyll Chlorophyll aa•0205: little change in any treatment over 48 hours. (2.0-2.5 pg cell-1)
•0226: both treatments increased, though WALK achieved steady state higher than MIX
•0325: after acclimation, TOP continued to increase, BOT and MIX did not increase

Appendix C. Pearson correlations
Experiment TreatmentCellular chl a :
cellular fucoxanthin
Cellular b carotene : cellular fucoxanthin
Cellular pheophytin : cellular chl a
Cellular chl c1+c2 : cellular chl a
0226 00init 1.00 1.000226 24mix 0.57 0.930226 24walk 1.00 1.00 0.73 -0.100226 144mix 0.96 1.00 0.54 1.000226 144walk 1.00 1.00 1.00 1.000226 288mix 0.70 0.70 0.65 0.110226 288walk 0.98 1.00 0.73 1.00
0325 0bot 0.97 1.00 0.98 0.990325 0mix -0.60 1.00 1.00 -0.190325 0top 0.96 1.00 0.63 0.870325 24bot 1.00 1.00 -1.00 1.000325 24mix 1.00 1.00 1.00 1.000325 24top 1.00 1.00 -1.00 1.000325 48bot 1.00 1.00 -1.00 1.000325 48mix 0.90 0.95 0.90 0.420325 48top 0.88 0.98 0.86 0.920325 72bot 0.82 0.90 0.51 0.970325 72mix 1.00 1.00 0.73 0.990325 72top 0.94 0.81 0.92 0.850325 96bot 0.89 1.00 1.00 -0.930325 96mix 1.00 1.00 0.82 0.99
•Chlorophyll a, ββββ-carotene & fucoxanthin generally correlated for all experiments.
•No evidence of photoprotective response or chromatic acclimation
•The exceptions don’t follow a trend
0205 left off, but follows similar relationships
Pigment correlationsPigment correlations
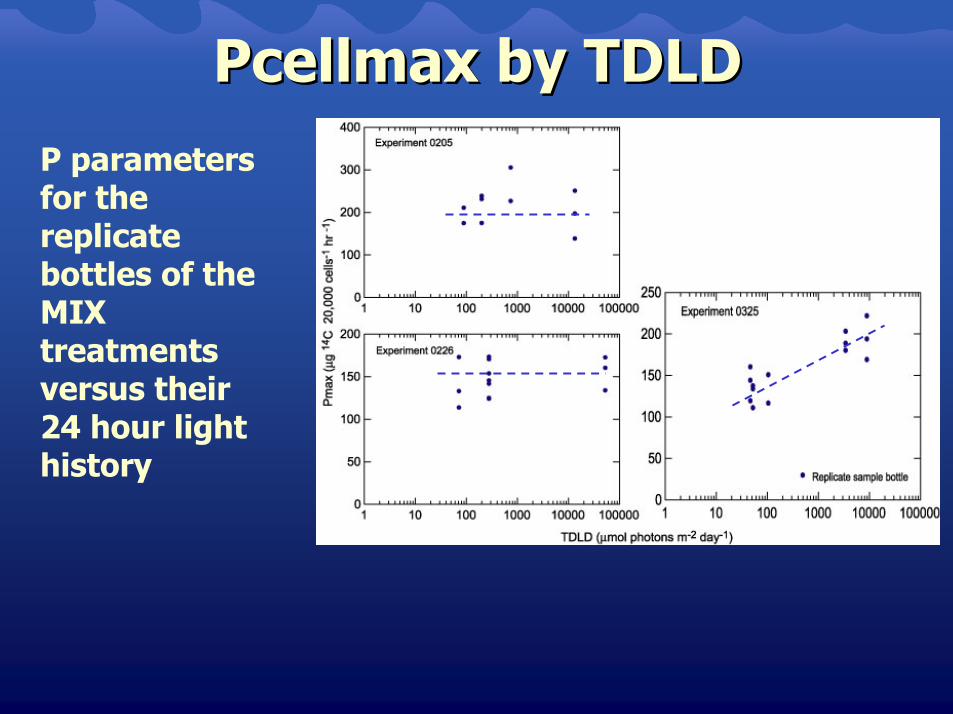
PcellmaxPcellmax by TDLDby TDLDP parameters for the replicate bottles of the MIX treatments versus their 24 hour light history

TDLD & cellTDLD & cell--sp parameterssp parameters•Experiments 0205, 0226 did not provide clear evidence of acclimation
•Both parameters in experiment 0325 oscillate according to 24 hour light history
•0325 cell-chlorophyll specific parameters have opposite slopes. Chlorophyll increased against the rules

TDLD & cellTDLD & cell--chlachla--sp parameterssp parameters•Perhaps correcting for chlorophyll content would clear things up
•Nope. Even fewer coherent responses to light history

Parameter : TDLD regressionParameter : TDLD regression
55
33
55
55
33
55
55
33
55
nnPPFF--ratioratioExperiment/testExperiment/test
0.0030.00312.9212.920325 0325 IkIkBcellBcell
0.390.390.890.890226 0226 IkIkBcellBcell
0.630.630.250.250205 0205 IkIkBcellBcell
0.060.064.224.220325 0325 PbmPbmcellcell
0.840.840.040.0402260226 PBmPBmcellcell
0.270.271.351.3502050205 PBmPBmcellcell
0.0060.00610.3210.320325 0325 ααααααααBcellBcell
0.400.400.840.840226 0226 ααααααααBcellBcell
0.170.172.242.240205 0205 ααααααααBcellBcell•Regression of cell-specific parameters against TDLD
•0325 was highly correlated with light history
•Need more “n”

IkIkcellcell
•Makes you want to fit a line through the points…
•All you can say is that Ikcell increases with light history
Numbers are hours into experiment

ConclusionsConclusions
•• Even under slow mixing, acclimation Even under slow mixing, acclimation was not confirmed (0226)was not confirmed (0226)
•• 0325 indicated acclimation to TDLD 0325 indicated acclimation to TDLD • and/or secondary cyclic light regime overlaid
with diel cycle (Legendré, Prezelin)•• After 7 days at <0.01 TDLD After 7 days at <0.01 TDLD (10 (10 umolumol ≅≅≅≅≅≅≅≅ 16.5 m 16.5 m
FPFP)) BOT samples were unable to BOT samples were unable to acclimate further. Implications for acclimate further. Implications for Lake Michigan?Lake Michigan?

Further workFurther work
•• How does acclimation get manifested How does acclimation get manifested during calm periods interrupted by during calm periods interrupted by episodic events (geek speak for episodic events (geek speak for storms)?storms)?
•• What role does UV play?What role does UV play?•• How does temperature (cold) How does temperature (cold)
influence ability to photoacclimate?influence ability to photoacclimate?

AcknowledgementsAcknowledgements•Arthur Brooks•Harvey Bootsma•Craig Sandgren•Joyce Witebsky•Carmen Aguilar•Russell Cuhel•Lisa Belli•Jen Garrow•Anna Kuester•Jerry Liu•Maurizio Murru•John Niebler•Steve Robillard•Stephanie Schroeder•The staff of the WATER Institute and
Biological sciences•….A gazzlion other friends and family

Supported in part by The Great Lakes Cruising Club Paul FredericSupported in part by The Great Lakes Cruising Club Paul Frederick k Memorial FellowshipMemorial Fellowship