Embed Size (px)
Citation preview
IFP Energies nouvelles International ConferenceRencontres Scientifiques d'IFP Energies nouvelles
Dynamics of Evolving Fluid Interfaces – DEFI Gathering Physico-Chemical and Flow PropertiesDynamiques des écoulements à interfaces fluides – au croisement de la physico-chimie et de la mécanique de fluides
Photo-Optical In-Situ Measurement of Drop Size
Distributions: Applications in Research and Industry
Robert P. Panckow1,4
*, Laura Reinecke2, Maria C. Cuellar
3and Sebastian Maaß
4
1 Technische Universität Berlin, Fachgebiet Verfahrenstechnik, Ackerstraße 76, 13355 Berlin - Germany2 Franken Filtertechnik KG, Max-Planck-Str. 7, 50354 Hürth - Germany
3 Department of Biotechnology, Delft University of Technology, Van der Maasweg 9, 2629 HZ Delft - The Netherlands4 SOPAT GmbH, Boyenstr. 41, 10115 Berlin - Germany
e-mail: [email protected] - [email protected] - [email protected] - [email protected]
* Corresponding author
Abstract—The exact knowledge of Drop Size Distributions (DSD) plays a major role in various fields ofapplications to control and optimise processes as well as reduce waste. In the microbial production ofadvanced biofuels, oil droplets are produced under turbulent conditions in an aqueous mediumcontaining many surface active components, which might hinder the recovery of the product.Knowledge of DSD is thus essential for process optimisation. This study demonstrates the capabilityof a photo-optical measurement method for DSD measurement in fermentation broth and in plateseparators aimed at cost reduction in the microbial production of advanced biofuels. Measurementswere made with model mixtures in a bioreactor, and at the inlet and outlet of a plate separator. Inthe bioreactor, the method was effective in detecting a broad range of droplet sizes and indifferentiating other disperse components (e.g. microbial cells and gas bubbles). In the plateseparator, the method was effective in determining the influence of the varied parameters on theseparation efficiency.
Résumé — Mesure photo-optique in-situ de la distribution des taille des gouttes : applicationsdans la recherche et l’industrie — La connaissance approfondie de la distribution du diamètre desgouttelettes joue un rôle important dans des diverses applications des contrôles et d’optimisations desprocessus, de plus elle permet de réduire le gaspillage. Pendant la production microbienne debiocarburants avancés, des gouttelettes d’huiles sont produites sous les effets des turbulences dumilieu aqueux contenant beaucoup de substances tensio-actives, ce qui pourrait entraver larécupération du produit. La connaissance de la distribution du diamètre des gouttelettes est doncessentielle pour l’optimisation des processus. Cette étude montre les possibilités offertes par uneméthode de mesure photo-optique pour les mesures de la taille des gouttelettes dans des bouillons defermentations et dans des séparateurs à plaques, ceci vise à réduire les coûts dans la productionmicrobienne de biocarburants avancés. Les mesures ont été effectuées avec des mélanges modèlesdans un bioréacteur ainsi qu’à l’entrée et à la sortie d’une plaque de séparation. Dans le bioréacteur,le procédé est efficace dans la détection d’une large gamme de tailles de gouttelettes et dans ladifférenciation des autres composants dispersés (par exemple des cellules microbiennes et des bullesde gaz). Dans le séparateur à plaque, le procédé est efficace, car il détermine l’influence de différentsparamètres sur l’efficacité de la séparation.
Oil & Gas Science and Technology – Rev. IFP Energies nouvelles (2017) 72, 14� R.P. Panckow et al., published by IFP Energies nouvelles, 2017DOI: 10.2516/ogst/2017009
This is an Open Access article distributed under the terms of the Creative Commons Attribution License (http://creativecommons.org/licenses/by/4.0),which permits unrestricted use, distribution, and reproduction in any medium, provided the original work is properly cited.

LIST OF SYMBOLS AND/OR NOTATIONS
aP Disperse phase surface area per volume (lm�1)
d3,2 Sauter mean diameter (lm)dmax Maximum diameter (lm)dmin Minimum diameter (lm)dP Particle diameter (lm)
drX Percentiles of quantity r (lm)k Number of bins (-)N Total number of particles (-)Qr Cumulative distribution of quantity r (-)qr Density distribution of quantity r (% lm�1)_V Volume flow rate L h�1
� �x Size variable (lm)
GREEK SYMBOLS
D Difference operator
gd Dynamic viscosity of disperse phase (mPa s)gfl Dynamic viscosity of fluid (mPa s)q Density (kg m�3)rfl Interfacial tension between fluids (N m�1)
ud Phase fraction of disperse phase (vol%)ufl Phase fraction of fluid (vol%)
SUBSCRIPTS
0 Related to quantity number3 Related to quantity volumei Index numbern Related to quantity number
r Type of quantityv Related to quantity volumeX Percentage
ABBREVIATIONS
CDF Cumulative Distribution FunctionCFD Computational Fluid DynamicsDSD Drop Size Distribution
FOV Field Of ViewGDP Gradient-Direction-PatternImg ImageNCC Normalised Cross-Correlation procedure
SMD Sauter Mean Diameterl-l Liquid-Liquid
INTRODUCTION
One of the recent advances in the field of biofuels is theapplication of synthetic biology to develop microorganismsthat produce long chain hydrocarbons, which are also knownas advanced biofuels (Cuellar and van der Wielen, 2015).These fuels have been demonstrated in airplanes duringthe UN Earth Summit in Rio de Janeiro 2012 and publictransport buses in São Paulo, Brazil (www.amyris.com).
These fuels are produced by microorganisms convertingthe substrate (glucose, glycerol) to the biofuel product,which is secreted into the fermentation broth, resulting in adispersion of product droplets in an aqueous phase fromwhich the product then has to be recovered. The turbulentconditions in the bioreactor and the presence of surfaceactive components originating from the feedstock or themicrobial process lead to product stabilisation in the formof emulsions (Heeres et al., 2014, 2015). As a consequence,product recovery strategies often involve intensive centrifu-gation, shifts in pH and temperature, and/or the use of de-emulsifiers. However, for economically feasible productionof the biofuel, the recovery process has to be cheap, so alow cost process technology should be used. Technologiessuch as gas enhanced oil recovery (Heeres et al., 2016),magnetic nanoparticles (Furtado et al., 2015) and catas-trophic phase inversion (Glonke et al., 2016) have beenproposed as alternative de-emulsification methods. Further-more, gravity separators such as plate droplet separatorsoffer opportunities for either concentrating the dispersephase prior to one of the de-emulsification methods above,or for the complete separation of the disperse phase whenthe droplet stabilisation can be mitigated during the conver-sion process. The latter is, however, still an object ofresearch. The actual Drop Size Distribution (DSD) obtainedafter the microbial conversion process, on the other hand, isinfluenced by broth composition, reactor parameters, oilfraction, type of microorganism and fermentation age,among others. For this type of system off-line measurementmethods are often not suitable due to non-homogeneoussampling, changes in DSD during sample procedure andageing of the sample. In-situ measurement methods over-come these issues, but should be able to differentiate otherdisperse phases present in the broth such as gas bubblesand the microorganisms, and must not compromise thesterility of the system.
The separation of Liquid-Liquid (l-l) dispersions bymeans of gravity separators is a standard operation inprocess engineering. They are typically used when immisci-ble two-phase mixtures from organic and aqueous phaseshave to be separated. This is the case in a variety of upstreamand downstream processes in chemical industry, petroleumindustry or pharmaceutical industry. Internal compo-nents such as plates have a significant impact on the phase
Page 2 of 17 Oil & Gas Science and Technology – Rev. IFP Energies nouvelles (2017) 72, 14
separation (Mungma et al., 2014). The dimensioning ofgravity or plate droplet separators is currently often anempirical issue. The design is based on information aboutsettling behaviour and residence time and also coalescencecharacteristics (Schlieper et al., 2004). This can result inoverdimensioning of these apparatuses to guarantee suffi-cient separation efficiency. Besides relevant variables suchas viscosity of the involved fluids gfl, interfacial tension rflbetween these fluids or phase fraction ufl, the DSD q0 basedon the particle number and the DSD q3 based on the particlevolume, play a crucial role in the selection of design param-eters. The inline measurement of the DSD at the inlet andoutlet of a gravity or plate droplet separator is a possibleoption to study the influence of the parameters mentionedabove on the separation. Based on these measurements animproved design method for gravity separators using multi-phase flow Computational Fluid Dynamics (CFD) should beestablished in the future.
In this contribution, we investigated the applicabilityof in-situ droplet size measurement by a photo-opticalmethod both in a fermentation broth and in plate dropletseparators, aimed at the development of efficient and lowcost separation methods for the production of advancedbiofuels.
1 IN-SITU DROPLET SIZE MEASUREMENTBY PHOTO-OPTICAL ENDOSCOPE TECHNIQUE
1.1 Drop Size Measurements
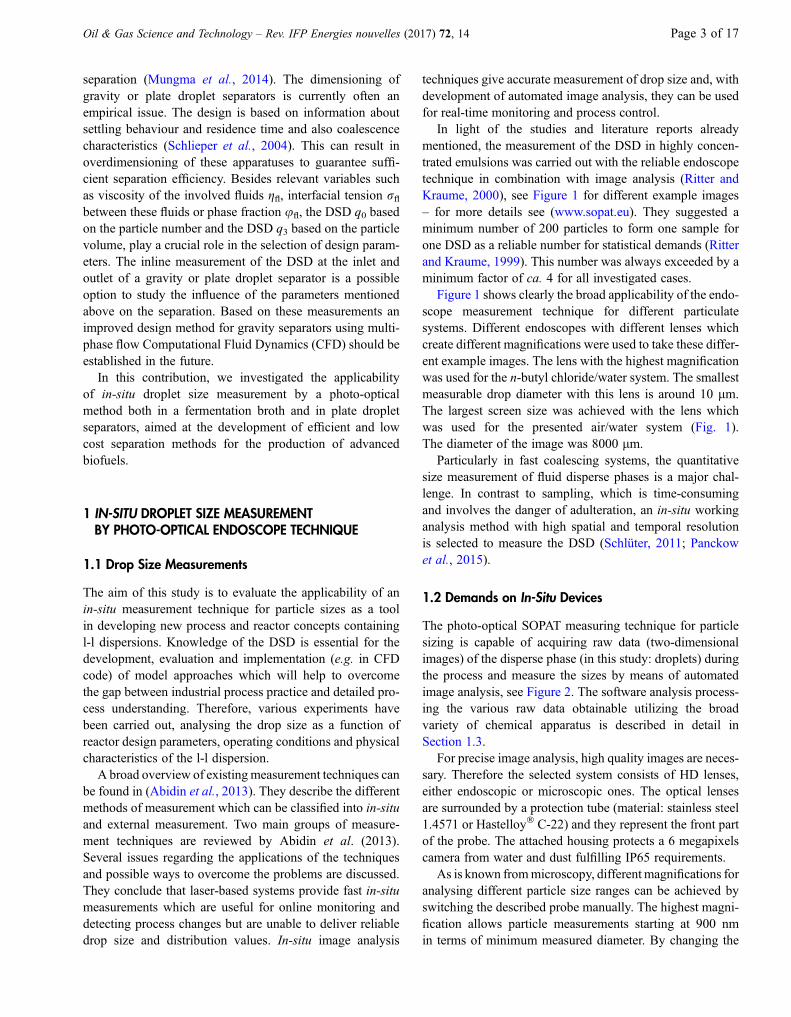
The aim of this study is to evaluate the applicability of anin-situ measurement technique for particle sizes as a toolin developing new process and reactor concepts containingl-l dispersions. Knowledge of the DSD is essential for thedevelopment, evaluation and implementation (e.g. in CFDcode) of model approaches which will help to overcomethe gap between industrial process practice and detailed pro-cess understanding. Therefore, various experiments havebeen carried out, analysing the drop size as a function ofreactor design parameters, operating conditions and physicalcharacteristics of the l-l dispersion.
A broad overview of existingmeasurement techniques canbe found in (Abidin et al., 2013). They describe the differentmethods of measurement which can be classified into in-situand external measurement. Two main groups of measure-ment techniques are reviewed by Abidin et al. (2013).Several issues regarding the applications of the techniquesand possible ways to overcome the problems are discussed.They conclude that laser-based systems provide fast in-situmeasurements which are useful for online monitoring anddetecting process changes but are unable to deliver reliabledrop size and distribution values. In-situ image analysis
techniques give accurate measurement of drop size and, withdevelopment of automated image analysis, they can be usedfor real-time monitoring and process control.
In light of the studies and literature reports alreadymentioned, the measurement of the DSD in highly concen-trated emulsions was carried out with the reliable endoscopetechnique in combination with image analysis (Ritter andKraume, 2000), see Figure 1 for different example images– for more details see (www.sopat.eu). They suggested aminimum number of 200 particles to form one sample forone DSD as a reliable number for statistical demands (Ritterand Kraume, 1999). This number was always exceeded by aminimum factor of ca. 4 for all investigated cases.
Figure 1 shows clearly the broad applicability of the endo-scope measurement technique for different particulatesystems. Different endoscopes with different lenses whichcreate different magnifications were used to take these differ-ent example images. The lens with the highest magnificationwas used for the n-butyl chloride/water system. The smallestmeasurable drop diameter with this lens is around 10 lm.The largest screen size was achieved with the lens whichwas used for the presented air/water system (Fig. 1).The diameter of the image was 8000 lm.
Particularly in fast coalescing systems, the quantitativesize measurement of fluid disperse phases is a major chal-lenge. In contrast to sampling, which is time-consumingand involves the danger of adulteration, an in-situ workinganalysis method with high spatial and temporal resolutionis selected to measure the DSD (Schlüter, 2011; Panckowet al., 2015).
1.2 Demands on In-Situ Devices
The photo-optical SOPAT measuring technique for particlesizing is capable of acquiring raw data (two-dimensionalimages) of the disperse phase (in this study: droplets) duringthe process and measure the sizes by means of automatedimage analysis, see Figure 2. The software analysis process-ing the various raw data obtainable utilizing the broadvariety of chemical apparatus is described in detail inSection 1.3.
For precise image analysis, high quality images are neces-sary. Therefore the selected system consists of HD lenses,either endoscopic or microscopic ones. The optical lensesare surrounded by a protection tube (material: stainless steel1.4571 or Hastelloy� C-22) and they represent the front partof the probe. The attached housing protects a 6 megapixelscamera from water and dust fulfilling IP65 requirements.
As is known frommicroscopy, different magnifications foranalysing different particle size ranges can be achieved byswitching the described probe manually. The highest magni-fication allows particle measurements starting at 900 nmin terms of minimum measured diameter. By changing the
Oil & Gas Science and Technology – Rev. IFP Energies nouvelles (2017) 72, 14 Page 3 of 17

probe, a larger Field Of View (FOV) can be achieved. Thelargest available FOV from the discussed in-situ probes is24 mm. This allows particle analyses up to 9 mm in particlediameter.
The camera is controlling a xenon flash. The latter ensureshigh illumination intensities in a very short time. The flashtime varies, depending on the intensity, from 2 ls forthe lowest intensity up to 8 ls for the highest intensity.
Figure 1
Example image gallery: representative samples taken with the endoscope technique using different lenses according to the expected particle sizefor different systems.
Figure 2
Photo-optical measuring method for particle size distributions.
Page 4 of 17 Oil & Gas Science and Technology – Rev. IFP Energies nouvelles (2017) 72, 14
This ensures sharp image capture even from fast movingparticles. The flash is inside the central box (Fig. 10, rightin Sect. 3.1). The light from the stroboscope is transportedby a fibre-optic. This ensures highly homogeneous illumina-tion across the FOV. The fibre-optic is flexible but issurrounded by a robust and IP65 certified protective hose.Using a diverse variety of flanges, the system can easilybe installed in pre-existing apparatuses. The probes toleratea process pressure up to 150 bar, however for specialapplications even higher pressure can be achieved. Theimage analysis is carried out on a work station with fourIntel� CoreTM i7 processors. The details of the imageanalysis software are given in Section 1.3.
1.3 Image Analysis Working Principle
Various commercial software packages are now availablethat analyse images automatically and measure the size ofthe droplets. The qualities of the results from these packagesdiffer and depend on a number of variables, including thequality of the initial images. Custom software can be written
to incorporate previously validated image processingalgorithms. There is also software available allowing amanual marking of droplets on images which are thenmeasured by the computer. This process is extremely timeconsuming, but generally considered essential for producingaccurate results as well as checking the performance ofautomatic software (Brown et al., 2004).
To overcome the drawback of time consuming manualquantification using photo-optical methods with imageanalysis, a fully automated method based on MATLAB�
was implemented and put into practice. The softwareemploys a Normalised Cross-Correlation (NCC) procedurealgorithm, which is explained in detail along with the pre-filtering which was employed by (Maaß et al., 2012).Additionally, it avoids human generated bias by differentobservers, also shown in (Maaß et al., 2012).
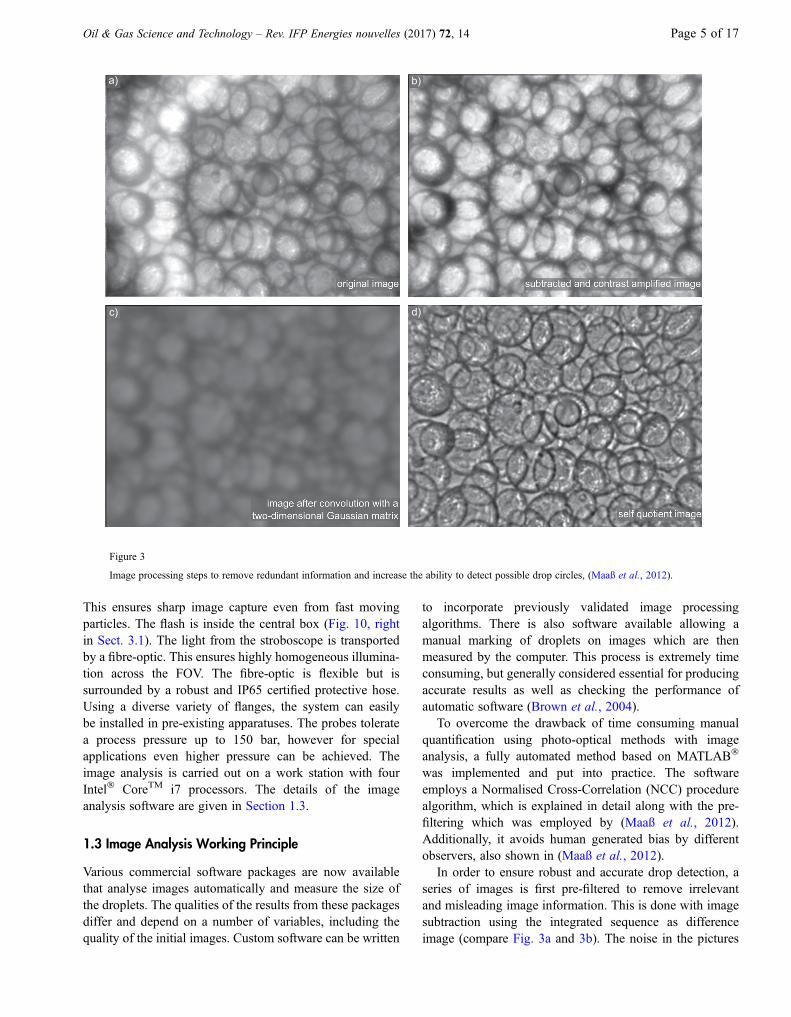
In order to ensure robust and accurate drop detection, aseries of images is first pre-filtered to remove irrelevantand misleading image information. This is done with imagesubtraction using the integrated sequence as differenceimage (compare Fig. 3a and 3b). The noise in the pictures
a) b)
c) d)
Figure 3
Image processing steps to remove redundant information and increase the ability to detect possible drop circles, (Maaß et al., 2012).
Oil & Gas Science and Technology – Rev. IFP Energies nouvelles (2017) 72, 14 Page 5 of 17
is reduced by the self-quotient image method (Gopalan andJacobs, 2010). This operation norms the intensity of everylocal pixel based on the local environment. It is carried outby division of the processed image (Fig. 3b) by a smoothedversion of itself, see Figure 3c after convolution with aGaussian matrix.
Figure 3d shows the self-quotient image whichemphasises the changes of the intensities from the originalimage. This results in an independence from any illumina-tion or process variation.
Then the drop recognition follows. It consists of threesteps: pattern recognition by correlation of pre-filteredgradients with search samples, the pre-selection of plausiblecircle coordinates, and the classification of each of thosecircles by an exact edge examination. The software employsa NCC algorithm (Lewis, 1995) to evaluate possible dropmatches, see Maaß et al. (2012) for more technical detailsand results.
The approaches described here are comparable to thework of Rojas-Domínguez et al. (2015). They propose atransformation of the denominated Gradient-Direction-Pattern (GDP). The GDP is the described pattern matchingalgorithm which is currently only implemented to findcircular patterns. Therefore the existing image analysis tech-nology by SOPAT was further developed to take also irreg-ular shaped particles into account (Panckow et al., 2015).
2 APPLICATION: FERMENTATION BROTH
2.1 Chemical Systems and Operating Conditions
The model fermentation broth was obtained by fed-batchcultivation under similar conditions to those reported inCuellar et al. (2009). The fermentation broth contained ca.50 g L�1 of E. coli K12 cells on a dry weight basis, to whichca. 10 vol% hexadecane had been added. For the measure-ment purposes of this paper a volume of 1-2 L of this mixturewas transferred to a 7 L Applikon bioreactor operating at astirrer speed of 300 rpm. When indicated, air was spargedat a flow rate of _V = 1.5 L min�1.
2.2 Specifications of the Installed Photo-Optical Probe
The probe “SOPAT MM” used in the fermentation brothsystem contains a high magnification microscopic lenssystem projecting an image from the inside of the bioreactorwith a cross section diameter (the FOV) of 385 lm. It istransported onto the camera sensor, being 15.989 mm indiagonal, with a resolution of 2752 9 2200 pixels, creatinga circular projection of the observed measurement volume,see Figure 6. To convert the discretised objects in pixels,acquired at the camera sensor, back to the unit of the real
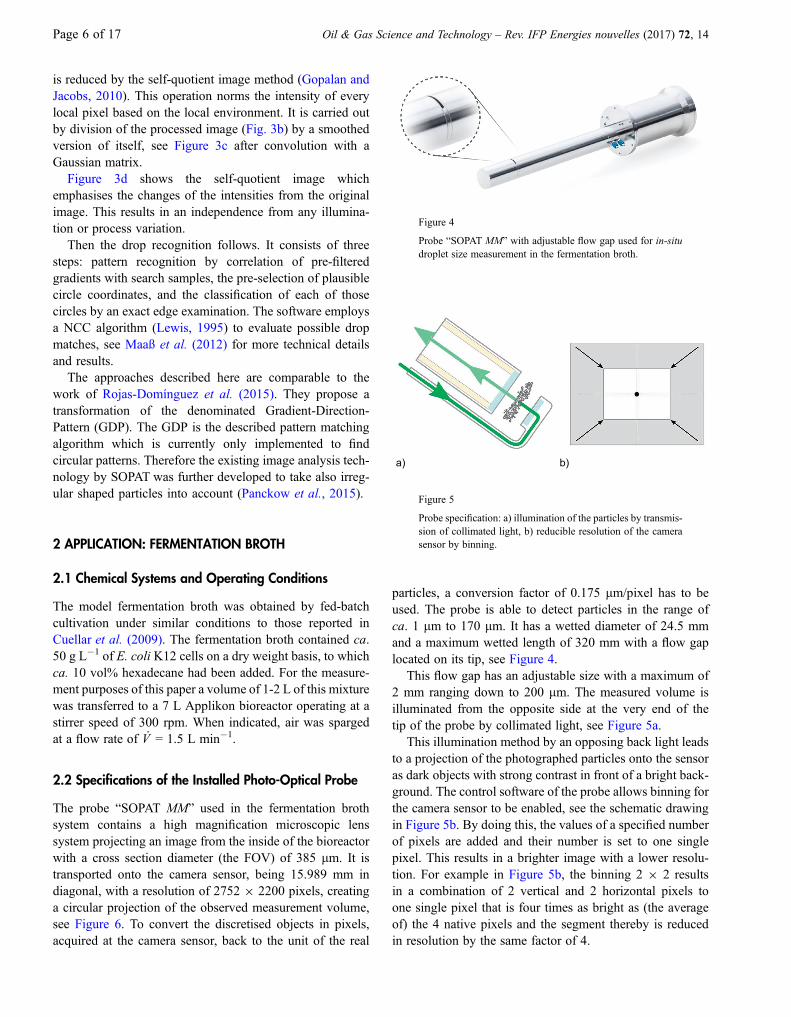
particles, a conversion factor of 0.175 lm/pixel has to beused. The probe is able to detect particles in the range ofca. 1 lm to 170 lm. It has a wetted diameter of 24.5 mmand a maximum wetted length of 320 mm with a flow gaplocated on its tip, see Figure 4.
This flow gap has an adjustable size with a maximum of2 mm ranging down to 200 lm. The measured volume isilluminated from the opposite side at the very end of thetip of the probe by collimated light, see Figure 5a.
This illumination method by an opposing back light leadsto a projection of the photographed particles onto the sensoras dark objects with strong contrast in front of a bright back-ground. The control software of the probe allows binning forthe camera sensor to be enabled, see the schematic drawingin Figure 5b. By doing this, the values of a specified numberof pixels are added and their number is set to one singlepixel. This results in a brighter image with a lower resolu-tion. For example in Figure 5b, the binning 2 9 2 resultsin a combination of 2 vertical and 2 horizontal pixels toone single pixel that is four times as bright as (the averageof) the 4 native pixels and the segment thereby is reducedin resolution by the same factor of 4.
Figure 4
Probe “SOPAT MM” with adjustable flow gap used for in-situdroplet size measurement in the fermentation broth.
a) b)
Figure 5
Probe specification: a) illumination of the particles by transmis-sion of collimated light, b) reducible resolution of the camerasensor by binning.
Page 6 of 17 Oil & Gas Science and Technology – Rev. IFP Energies nouvelles (2017) 72, 14
2.3 Analytical Methodology
The experiments performed and their corresponding starttime (relative to the start of experiment e01) are shown inTable 1. Variations were made on the gap and whether themixture was aerated or not.
For experiment e06 a reduced binning was used in orderto measure with a higher resolution than in the otherexperiments. The resulting images, which are four timesdarker than those with binning 2 9 2, were still brightenough to be usable, since a very thin gap of 200 lm wasapplied. By setting a gain, a further adjustment of the bright-ness of the resulting output image is possible: by increasingthe gain, i.e. amplifying the signal of the impinging photonson the camera sensor, the background noise is increased aswell. However, in order to get a sufficient brightness of theresulting pictures, for the larger gap sizes in e01-e03, e05a higher gain was applied. In the last two columns of Table 1
the absolute numbers of images, having been acquired andused for the analysis of each experiment, as well as thecounts of particles per single image (Detections Img�1) arereported. The influence of the gap size as well as thepresence of another disperse phase besides the dispersephase of interest (here: droplets) is presented in Figure 6.
The images shown here represent a contrast expandedversion of the acquired raw data, stretching the brightest greyvalue to white and the darkest grey value to black. Hereby,the images become visible for the human eye which is notable to distinguish between small differences in grey values.Especially the image in Figure 6a would appear as pure greywithout contrast expansion. These distorted images are onlyintended for a clearer visualisation and are not used by thesoftware, which is fed with the original images as raw data.
In the images acquired with the big gap of 2 mm inexperiment e01, there is a low contrast resulting from therefraction of light in the thick layer of fermentation broth
TABLE 1
Experiments in the model fermentation broth system.
ID Time (min) Gap (mm) Binning Gain Aeration Images Detections Img�1
e01 0 2 2 9 2 14 Non-aerated 250 3.2
e02 18 1 2 9 2 14 Non-aerated 250 7.9
e03 22 1 2 9 2 14 Aerated 250 8.3
e04 32 0.5 2 9 2 3-5 Non-aerated 4 9 250 13.3
e05 60 1 2 9 2 12 Non-aerated 3 9 250 13.6
e06 87 0.2 1 9 1 0-9 Non-aerated 5 9 250 23.9
a) b) c)
Figure 6
Comparison of different gap sizes: a) e01 with 2 mm, b) e03 with 1 mm, c) e06 with 200 lm; all experiments have microbial cells and oil dropletsas disperse phases, b) e03 additionally had air bubbles.
Oil & Gas Science and Technology – Rev. IFP Energies nouvelles (2017) 72, 14 Page 7 of 17

leading to a high overall diffuseness, see Figure 6a. There-fore, after the contrast expansion of the narrow-ranged greyvalues, these images appear very noisy. The appearance ofsmall droplets is strongly weakened and the number ofdroplets detected is low, which is why the setup in experi-ment e01 is not suitable to detect a reliable DSD of thedisperse oil, although the absolute number of detections(N = 788) fulfils the criterion of a minimum number of200 particles (Ritter and Kraume, 1999), see Section 1.1.With a smaller gap size, see Figures 6b and 6c, the contrastincreases and smaller droplets become visible. For the small-est gap of 200 lm, the structures of the cell agglomerates andother components (e.g. dirt particles) become visible in theemulsion. They emerge as background structures in thedense (as compared to the other disperse phases) cellemulsion, see Figure 6c.
These background structures as well as the bubbles ine03, see Figure 6b, are not analysed in this study. Thereforethe software was parametrised to find the droplets bycreating a pattern containing information describing theappearance (grey values) of droplets in the SOPAT software,see Section 1.3 for details about the software algorithms forparticle recognition. Combined or separated size distribu-tions of different particle types can be produced byparametrising the software to detect additionally/only thespecific particle type (i.e. droplets, bubbles and/or cellagglomerates), see Figure 7.
This mechanism for the detection of different dispersephases is illustrated by the subtraction of two size distribu-tions: Figure 7a “droplets + bubbles”-distribution andFigure 7b “bubbles only”-distribution. Each of the greencircles in the figure marks a particle detected by the auto-mated software with its corresponding location and size on
the photograph. In the first step, the software is parametrisedto detect the droplet size distribution using a pattern repre-senting the droplet appearance (grey values). Since thebubbles cause a strong refraction of the light and result in ahigh contrast projection on the camera sensor – resulting ina high quality pattern match – they are likely to be detectedby this first droplet pattern as well, see Figure 7a. The result-ing particle size distribution contains both the liquid dropletsand the gaseous bubble phase. By creating a second patternthat represents the bubbles only a second distribution canbe obtained, see Figure 7b, containing no droplets at all sincetheir match quality (in comparison to the bubble pattern) istoo low. The subtraction of these two particle detections,“droplets + bubbles”-distribution and “bubbles only”-distri-bution, results in the desired “droplets only”-distribution,see Figure 7c. These two patterns for droplets and bubblesdo not lead to erroneous detections by misinterpretation ofthe small cell structures in the background, but only classifythe droplet and bubble phase, which are clearly distinguish-able from the cells. This procedure of distinguishing betweendifferent disperse phases is possible as long as their opticalappearance (grey values, object borders, sizes) are suffi-ciently different. A basic prerequisite is the possibility of aclear identification and distinction with the human eye inorder to achieve a consistent training of the software and thusa reliable size analysis. The detection of the cell size distribu-tion is not part of this study. In order to measure it in theinvestigated fermentation broth, very small gaps (Fig. 6c200 lm or smaller) have to be applied to achieve an appropri-ate visualisation – and thus identification by the human eye –of the single cell structures.
However, besides the advantages mentioned above whenchoosing a small gap, the exclusion of big droplets and an
a) b) c)
Figure 7
Working principle to distinguish between different disperse phases, particle detections marked as green circles: a) detection of all objects corre-sponding to the taught pattern, b) only detecting the high contrast bubbles c) subtraction of the detections a) and b) to get the size distribution ofonly the droplets.
Page 8 of 17 Oil & Gas Science and Technology – Rev. IFP Energies nouvelles (2017) 72, 14

inhibited flow through the gap could occur, especially forhigher viscosities of the analysed emulsion.
For further discussion of the measured drop sizes inSection 2.4 as well as Sections 3.2 and 3.3 the followingformulas have been adapted. As the main representationsof the DSD, the density distributions of number q0 and ofvolume q3 as well as the cumulative distributions of numberQ0 and of volume Q3 are used in this paper. The firstrepresent the likelihood of the occurrence of a specific eventx (here: particle diameter dP) based on the type of quantity r(i.e. r = 0 for number, r = 3 for volume). Their generalmathematical relationship is stated in Equation (1).
Qr xið Þ ¼Z xi
xmin
qr xð Þ dx ð1Þ
In particle characterisation the specific event x indicates acertain particle feature and could also represent, for example,circularity, colour, inner structure, membrane thickness andmany others. In this paper, only the distributions of thefeature “particle diameter dP” are addressed. As a commonlyused characteristic value in particle sizing, the Sauter MeanDiameter (SMD), see Equation (2), relates the availablesource/sink (volume) to the means of transportation (area)and therefore provides an essential parameter when charac-terising heat and mass transfer in chemical processes.
d3;2 ¼ 6
aP¼
XNi¼1
d3P;i
.XNi¼1
d2P;i ð2Þ
Herein aP is the characteristic surface area per unitvolume of the disperse phase and N is the total number ofparticles. Using Equation (2) to calculate the SMD, sphericalparticles are assumed. Besides averaged diameters like theSMD, percentiles drX are used to characterise distributions.They indicate that the cumulative distribution exceeds acertain percentage X of the total quantity r at the given diam-eter d. For example, a characteristic diameter dn10 = 15 lm
indicates that 10% of all particle diameters are less than15 lm and 90% are greater than or equal to 15 lm. Insteadof numbers, the type of quantity r is usually expressed inletters (n – number, v – volume) when using percentiles.Often dn1, dn99 or dn5, dn95 or dv1, dv99 are used instead ofthe absolute minimum and maximum diameter of the distri-bution due to statistical outliers. When transformations fromthe dimension length to volume (or vice versa) are made, thedroplets are always assumed to be spherical.
2.4 Results and Discussion
Since this study is focused on the size distribution of dropletsand there are only 15 bubbles present on the 250 images ofe03 (Tab. 1), it is not intended to present and discuss the“bubbles only”-distribution, see Figure 7 in Section 2.3.The measured average sizes represented as SMD d3,2 as wellas selected percentiles are shown in Table 2.
In all of the experiments (except e06) a binning of 2 9 2was used, see Table 1. In spite of the significant opacity ofthe system under consideration, by using a binning it wasstill possible to visualise the disperse phases, even for thelarge gap size. Without the effect of binning, the imagesfor experiments e01, e02, e03 and e05 (gap � 1 mm) wouldhave been too dark to analyse. The brighter and richer incontrast the objects appear on the camera sensor, the morereliably the automatic image analysis algorithms canoperate: the probability of pre-selection of a plausible circlecoordinate and classification by exact edge examination(Sect. 1.3) increases, and the probability of false detectionsdecreases. As mentioned in Section 2.3, the setup of exper-iment e01 has been deemed unsuitable for the system underconsideration. As can be seen by the values in Table 2, e01results in the narrowest distribution, having the maximumvalues for dn1, dv1 and the minimum values for dn95, dv90,dmax. The calculated values in Table 2 show that the verysmall droplets could not be detected because of the highdiffuseness. This is due to the influence of the gap on the
TABLE 2
Characteristic values measured in the model fermentation broth system.
ID d3,2 (lm) dn1 (lm) dn95 (lm) dv1 (lm) dv90 (lm) dmax (lm)
e01 64.87 21.42 81.20 29.40 109.39 151.96
e02 86.82 18.43 107.95 27.53 221.20 234.96
e03 77.23 18.38 98.59 26.13 149.57 212.51
e04 96.63 17.50 111.77 28.93 241.27 368.67
e05 106.10 18.43 120.17 33.60 243.13 325.73
e06 82.54 9.55 81.32 20.10 208.42 269.73
Oil & Gas Science and Technology – Rev. IFP Energies nouvelles (2017) 72, 14 Page 9 of 17
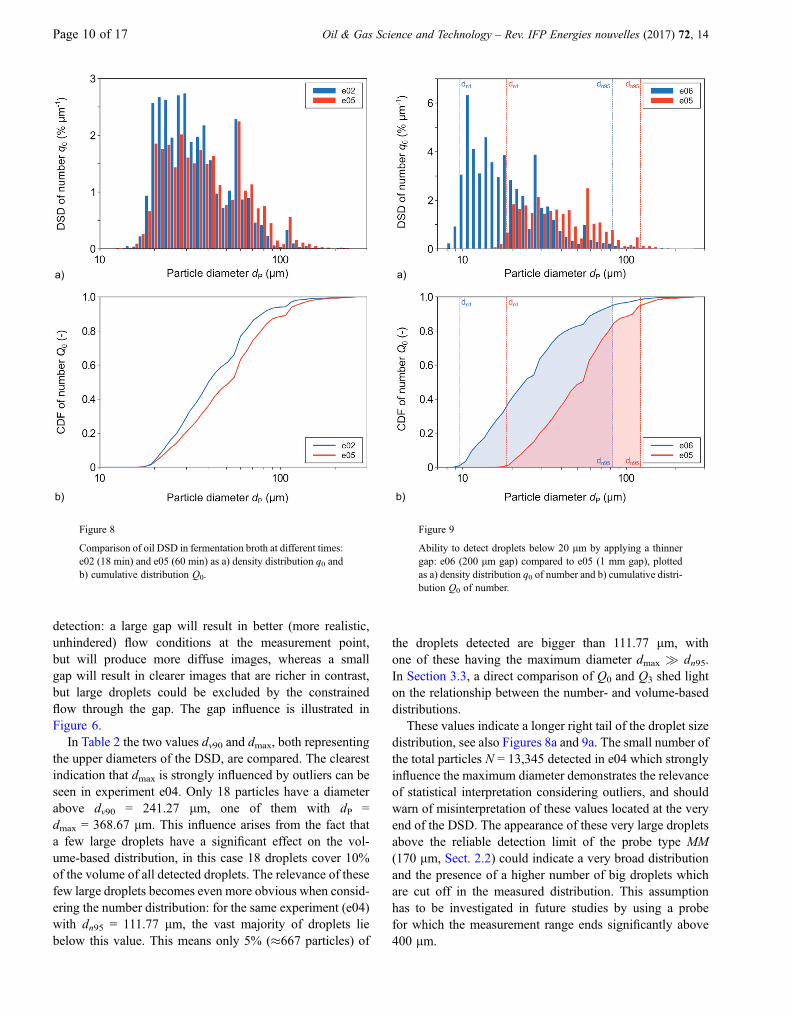
detection: a large gap will result in better (more realistic,unhindered) flow conditions at the measurement point,but will produce more diffuse images, whereas a smallgap will result in clearer images that are richer in contrast,but large droplets could be excluded by the constrainedflow through the gap. The gap influence is illustrated inFigure 6.
In Table 2 the two values dv90 and dmax, both representingthe upper diameters of the DSD, are compared. The clearestindication that dmax is strongly influenced by outliers can beseen in experiment e04. Only 18 particles have a diameterabove dv90 = 241.27 lm, one of them with dP =dmax = 368.67 lm. This influence arises from the fact thata few large droplets have a significant effect on the vol-ume-based distribution, in this case 18 droplets cover 10%of the volume of all detected droplets. The relevance of thesefew large droplets becomes even more obvious when consid-ering the number distribution: for the same experiment (e04)with dn95 = 111.77 lm, the vast majority of droplets liebelow this value. This means only 5% (�667 particles) of
the droplets detected are bigger than 111.77 lm, withone of these having the maximum diameter dmax � dn95.In Section 3.3, a direct comparison of Q0 and Q3 shed lighton the relationship between the number- and volume-baseddistributions.
These values indicate a longer right tail of the droplet sizedistribution, see also Figures 8a and 9a. The small number ofthe total particles N = 13,345 detected in e04 which stronglyinfluence the maximum diameter demonstrates the relevanceof statistical interpretation considering outliers, and shouldwarn of misinterpretation of these values located at the veryend of the DSD. The appearance of these very large dropletsabove the reliable detection limit of the probe type MM(170 lm, Sect. 2.2) could indicate a very broad distributionand the presence of a higher number of big droplets whichare cut off in the measured distribution. This assumptionhas to be investigated in future studies by using a probefor which the measurement range ends significantly above400 lm.
a)
b)
Figure 8
Comparison of oil DSD in fermentation broth at different times:e02 (18 min) and e05 (60 min) as a) density distribution q0 andb) cumulative distribution Q0.
a)
b)
Figure 9
Ability to detect droplets below 20 lm by applying a thinnergap: e06 (200 lm gap) compared to e05 (1 mm gap), plottedas a) density distribution q0 of number and b) cumulative distri-bution Q0 of number.
Page 10 of 17 Oil & Gas Science and Technology – Rev. IFP Energies nouvelles (2017) 72, 14

The influence of aeration on the drop sizes can be seenfrom the calculated diameters in Table 2. Comparing e02with e03 after having increased the air flow from_V = 0 L min�1 to _V = 1.5 L min�1, all the characteristicvalues are lower, resulting in a slight shift to smaller diame-ters. Furthermore an increased SMD can be observed overtime by comparing experiments e02 and e05, see Table 2.The repetition of experiment e02 as e05 with the same probeconfiguration showed reasonable results considering therange of drop sizes in the distribution, see Figure 8.
It should be kept in mind that the system was deliberatelydisturbed by aeration (e03) in between experiments e02 ande05. A significantly higher number of droplets were detectedat the later time in e05, see Table 1. The shift to biggerdroplets, resulting in a higher SMD, may be the result ofadvanced biological conversion over time in combinationwith the forced increase of transport processes by aerationin e03.
In Figures 8 and 9, the number of bins k is chosen to be40. Following Sturges’ Rule k = (1 + log2 N), the calculatednumber of bins should be chosen such that k = 16 for themaximum occurring particle count, viz. N = 29,861 in e06(Sturges, 1926). Since Sturges’ Rule is known to lead toan over-smoothed histogram, especially for large samples,and only considers normal, not skewed distributions (Legget al., 2013), a higher number was chosen. This also resultsin a more representative Cumulative Distribution Function(CDF) and leads to preservation of the shape of both densitydistributions in Figure 9 although they span different inter-vals. The width of the bins grows accordingly with base10 resulting in equally broad appearing bars over a logarith-mic scale.
The capacity of the system to detect very small dropletsby applying a thin gap can be seen when comparing e05and e06, see Figure 9. In this figure, the percentiles dn1and dn95 from Table 2 are also plotted. By comparing thepercentiles dn1 of both experiments, the lowered minimum
of the detection range for the thin gap (200 lm, e06) canclearly be seen. On the other hand, the big droplets seemdistorted when applying a thin gap; compare percentilesdn95, Figure 9 as well as dv90 and dmax in Table 2.
The probe was able to measure the oil droplets in a broadsize range and, with the usage of a very thin gap, evenobserve microbial cell structures (see experiment e06 inFig. 6c and Tab. 1) and to differentiate among gas bubbles,see Figures 6b and 7.
3 APPLICATION: PLATE DROPLET SEPARATORS
3.1 Chemical Systems and Operating Conditions
For the investigation of the parameters mentioned in theintroduction (e.g. gfl, ufl) which influence the phase separa-tion in gravity or plate droplet separators, a laboratory plantDN100 was built, see Figure 10. It is operated in circulation.
The main part of the laboratory plant is a separator of100 mm diameter and a length of 400 mm. It operates bothwith and without plate internals. Frequency converters areused to control the pump flow rate of the main and dispersedphases to ensure a constant volume flow as well as a certainphase fraction of the dispersed phase. Furthermore, the plantconsists of two more fibre bed phase separators to preventenrichment of non-separated droplets in each phase.The DSD at the inlet of the phase separator is producedmechanically by a special dispersing unit and can be repro-ducibly adjusted in the range 1 to 1000 microns. After asteady state is reached in the separator (usually after20 min) the in-situ measurement of the DSD at the inletand outlet is recorded. For these experiments, a photo-optical probe (“SOPAT Sc”) with a measuring range of12 to 1500 microns is used with an attached reflection adap-ter generating a flow gap of 5 mm. A description of how toobtain an adequate adjustment of the latter is given in
Figure 10
Experimental setup for investigating the plate droplet separator.
Oil & Gas Science and Technology – Rev. IFP Energies nouvelles (2017) 72, 14 Page 11 of 17
Section 3.2. To verify these measurements, the separationefficiency was also determined volumetrically. The firstdispersion tested consisted of water and silicon oil, the othersystem was a dispersion of water and paraffin oil. Table 3shows the physical properties of the utilized oils for thedisperse phases as well as their types and suppliers. Forthe aqueous phases tap water was used. All experimentswere carried out at room temperature.
This investigation was initially focused on experimentswith small amounts of dispersed phase to study onlysedimentation of droplet swarms with no major impact bycoalescence (which would be present at high volumefraction).
3.2 Determination of an Adequate Probe Configurationfor One Target Operating Point
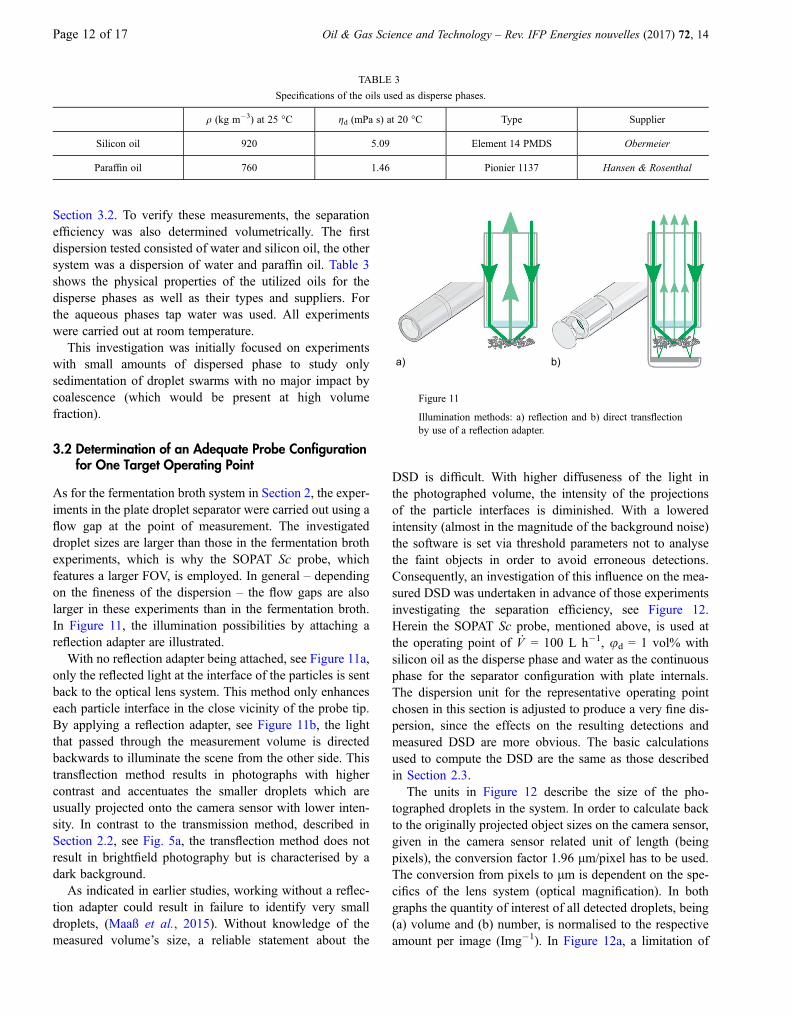
As for the fermentation broth system in Section 2, the exper-iments in the plate droplet separator were carried out using aflow gap at the point of measurement. The investigateddroplet sizes are larger than those in the fermentation brothexperiments, which is why the SOPAT Sc probe, whichfeatures a larger FOV, is employed. In general – dependingon the fineness of the dispersion – the flow gaps are alsolarger in these experiments than in the fermentation broth.In Figure 11, the illumination possibilities by attaching areflection adapter are illustrated.
With no reflection adapter being attached, see Figure 11a,only the reflected light at the interface of the particles is sentback to the optical lens system. This method only enhanceseach particle interface in the close vicinity of the probe tip.By applying a reflection adapter, see Figure 11b, the lightthat passed through the measurement volume is directedbackwards to illuminate the scene from the other side. Thistransflection method results in photographs with highercontrast and accentuates the smaller droplets which areusually projected onto the camera sensor with lower inten-sity. In contrast to the transmission method, described inSection 2.2, see Fig. 5a, the transflection method does notresult in brightfield photography but is characterised by adark background.
As indicated in earlier studies, working without a reflec-tion adapter could result in failure to identify very smalldroplets, (Maaß et al., 2015). Without knowledge of themeasured volume’s size, a reliable statement about the
DSD is difficult. With higher diffuseness of the light inthe photographed volume, the intensity of the projectionsof the particle interfaces is diminished. With a loweredintensity (almost in the magnitude of the background noise)the software is set via threshold parameters not to analysethe faint objects in order to avoid erroneous detections.Consequently, an investigation of this influence on the mea-sured DSD was undertaken in advance of those experimentsinvestigating the separation efficiency, see Figure 12.Herein the SOPAT Sc probe, mentioned above, is used atthe operating point of _V = 100 L h�1, ud = 1 vol% withsilicon oil as the disperse phase and water as the continuousphase for the separator configuration with plate internals.The dispersion unit for the representative operating pointchosen in this section is adjusted to produce a very fine dis-persion, since the effects on the resulting detections andmeasured DSD are more obvious. The basic calculationsused to compute the DSD are the same as those describedin Section 2.3.
The units in Figure 12 describe the size of the pho-tographed droplets in the system. In order to calculate backto the originally projected object sizes on the camera sensor,given in the camera sensor related unit of length (beingpixels), the conversion factor 1.96 lm/pixel has to be used.The conversion from pixels to lm is dependent on the spe-cifics of the lens system (optical magnification). In bothgraphs the quantity of interest of all detected droplets, being(a) volume and (b) number, is normalised to the respectiveamount per image (Img�1). In Figure 12a, a limitation of
TABLE 3
Specifications of the oils used as disperse phases.
q (kg m�3) at 25 �C gd (mPa s) at 20 �C Type Supplier
Silicon oil 920 5.09 Element 14 PMDS Obermeier
Paraffin oil 760 1.46 Pionier 1137 Hansen & Rosenthal
a) b)
Figure 11
Illumination methods: a) reflection and b) direct transflectionby use of a reflection adapter.
Page 12 of 17 Oil & Gas Science and Technology – Rev. IFP Energies nouvelles (2017) 72, 14

the ordinate was chosen to yield a more detailed representa-tion of the interesting range.
As can be seen in Figure 12a, an expected distribution ofdroplets for the outlet related to its inlet DSD is observable.Following the red outlet curve of a certain probe configura-tion (i.e. reflection adapter gap size) it coincides exactly withits blue inlet curve until ca. 60-80 lm. From a certain point,which corresponds to the separation of the first small dro-plets, the curves diverge up to the cut-off drop size at whichthe red outlet curve ends. Meaning, all droplets above areentirely separated. In contrast to this familiar trend, thediagram in Figure 12b, representing the absolute particlenumber detected at the inlet and outlet, reveals an unex-pected trend. For the trial with a flow gap of 2.5 mm(Fig. 12b, solid lines), the number of particles counted atthe outlet is greater than the count at the inlet. Accordingto the explanation given in the beginning of this section, thisis a result of setting the gap of the reflection adapter too large,resulting in failure to identify the small particles at the inlet.
Therefore, at this operating point with dispersion unit pro-ducing a very fine dispersion, the gap should be set below1.5 mm when the interest lies in the absolute number ratherthan the volumetric relationship between inlet and outlet.
Having determined a distance of 1.5 mm for the flow gap,Figure 13 shows an accurate correspondence between theabsolute volume density distributions of the inlet and outletfor the inseparable droplets. Hence, the fraction of dropletsin the range below dP � 60 lm present at the inlet almostcompletely reaches the outlet of the separator. No fractionof droplets in the detectable range of the probe seems tobe lost in the measured volume, neither at the inlet nor theoutlet. The biggest droplets detected at this operating point(approximately 1000 lm, see Fig. 12b and 13) are belowthe maximum detectable particle size of the used probe,viz. dP = 1500 lm, see Section 3.1.
As a result of this study (preliminary to the investigationof the separation efficiency), the obtained DSD are deemedreliable in the detectable range when using a certain gap size(in the discussed case 1.5 mm) dependent on the operatingconditions.
3.3 Results and Discussion
The volumetric separation efficiency and cut-off drop sizecan be determined from the measurements of the inlet andoutlet DSD for each experiment. In this study the cut-offdrop size is the largest drop measured at the separator outlet,which hence could not be separated. Based on these valuesand the DSD, two examples for different operating statesare compared. For each experiment, 15,000-25,000 dropswere evaluated at 60-90 frames in order to minimise possiblestatistical inaccuracies. The basic calculations used to com-pute the DSD are the same as those described in Section 2.3.
Figure 13
Measured DSD for a gap size of 1.5 mm at the inlet and outletfor _V = 100 L h�1, ud = 1 vol%.
a)
b)
Figure 12
Measured DSD for different gap sizes at the inlet and outlet for_V = 100 L h�1, ud = 1 vol%, plotted as a) absolute volume ofparticles and b) absolute number of particles per image(Img�1).
Oil & Gas Science and Technology – Rev. IFP Energies nouvelles (2017) 72, 14 Page 13 of 17

Representative results of the detection process are givenin Figure 14. In Figures 14a and 14b the paraffin oil/watersystem is shown, and Figures 14c and 14d show the siliconoil/water system. For both systems, the outlet droplets are
clearly smaller in size and fewer in number. The very shinyobjects in Figures 14a and 14b are droplets, which stick tothe lens. These are not taken into account by the software,since they do not move.
a) b)
c) d)
Figure 14
Representative images of the detection for _V = 200 L h�1, ud = 1 vol%, in the paraffin oil/water system at the a) inlet and b) outlet and the siliconoil/water system at the c) inlet and d) outlet.
b)a)
Figure 15
Comparison of the two systems for _V = 200 L h�1, ud = 1 vol% a) cumulative DSD Q0 of number, b) cumulative DSD Q3 of volume.
Page 14 of 17 Oil & Gas Science and Technology – Rev. IFP Energies nouvelles (2017) 72, 14
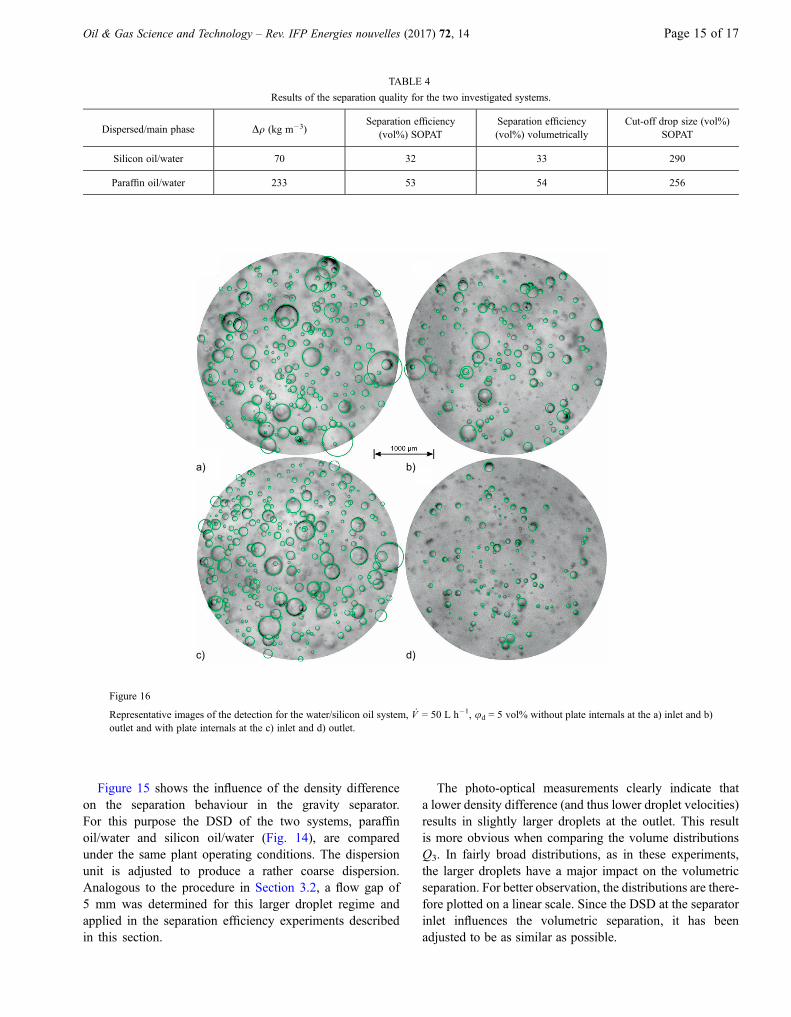
Figure 15 shows the influence of the density differenceon the separation behaviour in the gravity separator.For this purpose the DSD of the two systems, paraffinoil/water and silicon oil/water (Fig. 14), are comparedunder the same plant operating conditions. The dispersionunit is adjusted to produce a rather coarse dispersion.Analogous to the procedure in Section 3.2, a flow gap of5 mm was determined for this larger droplet regime andapplied in the separation efficiency experiments describedin this section.
The photo-optical measurements clearly indicate thata lower density difference (and thus lower droplet velocities)results in slightly larger droplets at the outlet. This resultis more obvious when comparing the volume distributionsQ3. In fairly broad distributions, as in these experiments,the larger droplets have a major impact on the volumetricseparation. For better observation, the distributions are there-fore plotted on a linear scale. Since the DSD at the separatorinlet influences the volumetric separation, it has beenadjusted to be as similar as possible.
TABLE 4
Results of the separation quality for the two investigated systems.
Dispersed/main phase Dq (kg m�3)Separation efficiency
(vol%) SOPATSeparation efficiency(vol%) volumetrically
Cut-off drop size (vol%)SOPAT
Silicon oil/water 70 32 33 290
Paraffin oil/water 233 53 54 256
a) b)
c) d)
Figure 16
Representative images of the detection for the water/silicon oil system, _V = 50 L h�1, ud = 5 vol% without plate internals at the a) inlet and b)outlet and with plate internals at the c) inlet and d) outlet.
Oil & Gas Science and Technology – Rev. IFP Energies nouvelles (2017) 72, 14 Page 15 of 17
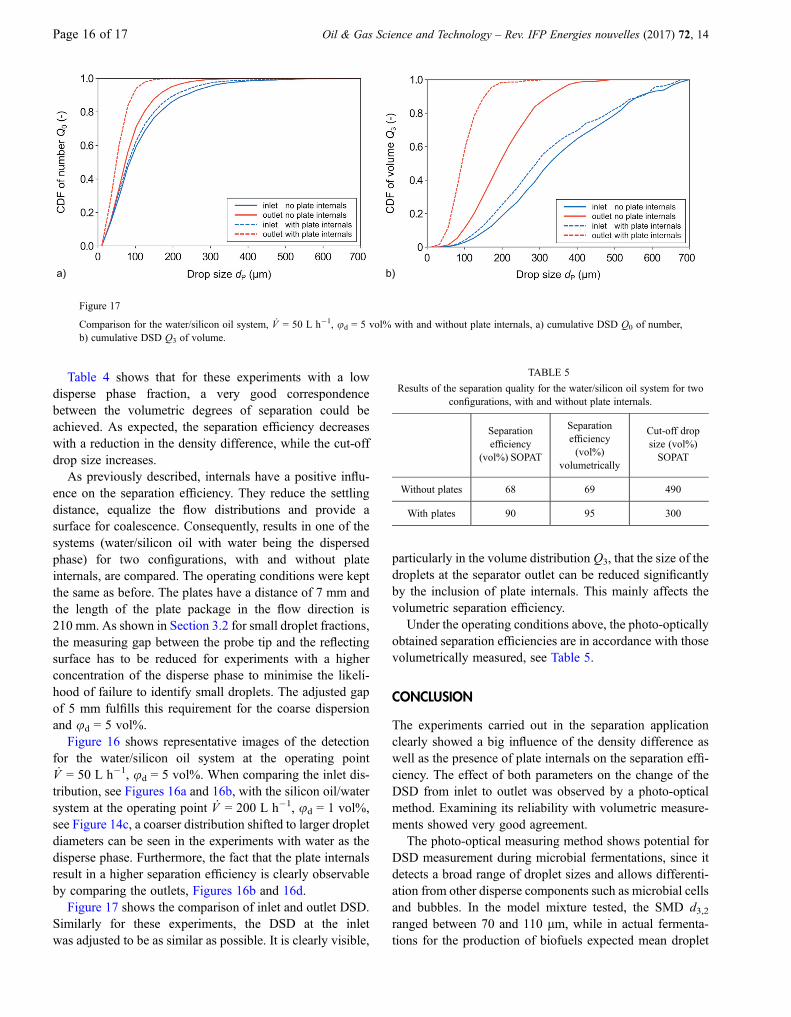
Table 4 shows that for these experiments with a lowdisperse phase fraction, a very good correspondencebetween the volumetric degrees of separation could beachieved. As expected, the separation efficiency decreaseswith a reduction in the density difference, while the cut-offdrop size increases.
As previously described, internals have a positive influ-ence on the separation efficiency. They reduce the settlingdistance, equalize the flow distributions and provide asurface for coalescence. Consequently, results in one of thesystems (water/silicon oil with water being the dispersedphase) for two configurations, with and without plateinternals, are compared. The operating conditions were keptthe same as before. The plates have a distance of 7 mm andthe length of the plate package in the flow direction is210 mm. As shown in Section 3.2 for small droplet fractions,the measuring gap between the probe tip and the reflectingsurface has to be reduced for experiments with a higherconcentration of the disperse phase to minimise the likeli-hood of failure to identify small droplets. The adjusted gapof 5 mm fulfills this requirement for the coarse dispersionand ud = 5 vol%.
Figure 16 shows representative images of the detectionfor the water/silicon oil system at the operating point_V = 50 L h�1, ud = 5 vol%. When comparing the inlet dis-tribution, see Figures 16a and 16b, with the silicon oil/watersystem at the operating point _V = 200 L h�1, ud = 1 vol%,see Figure 14c, a coarser distribution shifted to larger dropletdiameters can be seen in the experiments with water as thedisperse phase. Furthermore, the fact that the plate internalsresult in a higher separation efficiency is clearly observableby comparing the outlets, Figures 16b and 16d.
Figure 17 shows the comparison of inlet and outlet DSD.Similarly for these experiments, the DSD at the inletwas adjusted to be as similar as possible. It is clearly visible,
particularly in the volume distribution Q3, that the size of thedroplets at the separator outlet can be reduced significantlyby the inclusion of plate internals. This mainly affects thevolumetric separation efficiency.
Under the operating conditions above, the photo-opticallyobtained separation efficiencies are in accordance with thosevolumetrically measured, see Table 5.
CONCLUSION
The experiments carried out in the separation applicationclearly showed a big influence of the density difference aswell as the presence of plate internals on the separation effi-ciency. The effect of both parameters on the change of theDSD from inlet to outlet was observed by a photo-opticalmethod. Examining its reliability with volumetric measure-ments showed very good agreement.
The photo-optical measuring method shows potential forDSD measurement during microbial fermentations, since itdetects a broad range of droplet sizes and allows differenti-ation from other disperse components such as microbial cellsand bubbles. In the model mixture tested, the SMD d3,2ranged between 70 and 110 lm, while in actual fermenta-tions for the production of biofuels expected mean droplet
a) b)
Figure 17
Comparison for the water/silicon oil system, _V = 50 L h�1, ud = 5 vol% with and without plate internals, a) cumulative DSD Q0 of number,b) cumulative DSD Q3 of volume.
TABLE 5
Results of the separation quality for the water/silicon oil system for twoconfigurations, with and without plate internals.
Separationefficiency
(vol%) SOPAT
Separationefficiency(vol%)
volumetrically
Cut-off dropsize (vol%)SOPAT
Without plates 68 69 490
With plates 90 95 300
Page 16 of 17 Oil & Gas Science and Technology – Rev. IFP Energies nouvelles (2017) 72, 14
sizes are ca. 10 lm. Ongoing research will focus on strate-gies for promoting droplet coalescence and avoiding dropletstabilisation during fermentation.
It could be shown clearly that the demonstrated particlemeasurement system precisely determined the influence ofthe varied parameters on the separation efficiency. It is ableto perform well even in very opaque media like fermentationbroth. Additionally, it could not only detect the requiredDSD, but was also able to distinguish between different dis-perse phases, such as disturbing bubbles, yeast agglomeratesand dirt particles. As the results are available inline and inreal-time, a closed control loop can be established in thefuture.
ACKNOWLEDGMENTS
We would like to thank Susana Pedraza de la Cuesta andCaroline van Houten from Delft University of Technologyfor preparing the fermentation broth and for their assistanceduring the droplet size measurements.
REFERENCES
Abidin M.I.I.Z., Raman A.A.A., Nor M.I.M. (2013) Review onmeasurement techniques for drop size distribution in a stirredvessel, Ind. Eng. Chem. Res. 52, 46, 16085-16094.
Brown D.A.R., Jones P.N., Middleton J.C., Papadopoulos G.,Arik E.B. (2004) Experimental methods, in: E.L. Paul, V.A.Atiemo-Obeng, S.M. Kresta (eds), Handbook of Industrial Mixing:Science and Practice, John Wiley & Sons, Inc., Hoboken, NJ,USA, pp. 145-256.
Cuellar M.C., Zijlmans T.W., Straathof A.J.J., Heijnen J.J.,van der Wielen L.A.M. (2009) Model-based evaluation ofcell retention by crossflow ultrafiltration during fed-batch fermenta-tions with Escherichia coli, Biochem. Eng. J. 44, 2-3, 280-288.
Cuellar M.C., van der Wielen L.A.M. (2015) Recent advances inthe microbial production and recovery of apolar molecules, Curr.Opin. Biotech. 33, 39-45.
Furtado G.F., Picone C.S.F., Cuellar M.C., Cunha R.L. (2015)Breaking oil-in-water emulsions stabilized by yeast, Colloids Surf.B 128, 568-576.
Glonke S., Sadowski G., Brandenbusch C. (2016) Appliedcatastrophic phase inversion: a continuous non-centrifugal phaseseparation step in biphasic whole-cell biocatalysis, J. Ind.Microbiol. Biotechnol. 43, 1527-1535.
Gopalan R., Jacobs D. (2010) Comparing and combining lightinginsensitive approaches for face recognition, Comput. Vis. ImageUnderst. 114, 135-145.
Heeres A.S., Picone C.S.F., van der Wielen L.A.M., Cunha R.L.,Cuellar M.C. (2014) Microbial advanced biofuels production:overcoming emulsification challenges for large-scale operation,Trends Biotechnol. 32, 4, 221-229.
Heeres A.S., Schroën K., Heijnen J.J., van der Wielen L.A.M.,Cuellar M.C. (2015) Fermentation broth components influencedroplet coalescence and hinder advanced biofuel recovery duringfermentation, Biotechnol. J. 10, 8, 1206-1215.
Heeres A.S., Heijnen J.J., van der Wielen L.A.M., Cuellar M.C.(2016) Gas bubble induced oil recovery from emulsions stabilisedby yeast components, Chem. Eng. Sci. 145, 31-44.
Legg P.A., Rosin P.L., Marshall D., Morgan J.E. (2013) Improvingaccuracy and efficiency of mutual information for multi-modalretinal image registration using adaptive probability densityestimation, Comput. Med. Imaging Graph. 37, 7-8, 597-606.
Lewis J.P. (1995) Fast template matching, in: Vision Interface 95,Canadian Image Processing and Pattern Recognition Society,Quebec City, Canada, pp. 120-123.
Maaß S., Reinecke L., Panckow R.P., Franken H. (2015) OptimierteFeinsttropfenabscheidung mittels Echtzeittropfengrößenanalyse,Chem. Ing. Tech. 87, 8, 1078.
Maaß S., Rojahn J., Hänsch R., Kraume M. (2012) Automated dropdetection using image analysis for online particle size monitoring inmultiphase systems, Comput. Chem. Eng. 45, 27-37.
Mungma N., Chuttrakul P., Pfennig A. (2014) Liquid-liquid phaseseparation in batch settling with inclined plate, Jurnal Teknologi(Sciences & Engineering) 67, 4, 55-58.
Panckow R.P., Comandè G., Maaß S., Kraume M. (2015) Determi-nation of particle size distributions in multiphase systems contain-ing nonspherical fluid particles, Chem. Eng. Technol. 38, 11,2011-2016.
Ritter J., KraumeM. (1999) Local drop size distributions in agitatedliquid-liquid dispersions of various dispersed phase fractions, in:F. Gilles F. (ed.), Proc. 2nd European Congress of ChemicalEngineering, Montpellier, pp. 153-160.
Ritter J., Kraume M. (2000) On-line measurement technique fordrop size distributions in liquid/liquid systems at high dispersedphase fractions, Chem. Eng. Technol. 23, 7, 579-581.
Rojas-Domínguez A., Holguín-Salas A., Galindo E., Corkidi G.(2015) Gradient-direction-pattern transform for automated mea-surement of oil drops in images of multiphase dispersions, Chem.Eng. Technol. 38, 2, 327-335.
Schlieper L., Chatterjee M., Henschke M., Pfennig A. (2004)Liquid-liquid phase separation in gravity settler with inclinedplates, AIChE J. 50, 4, 802-811.
Schlüter M. (2011) Local Measurement Techniques for MultiphaseFlows, Chem. Ing. Tech. 83, 7, 992-1004.
Sturges H.A. (1926) The choice of a class interval, J. Am. Stat.Assoc. 153, 21, 65-66.
Manuscript submitted in October 2016
Manuscript accepted in March 2017
Published online in May 2017
Cite this article as: R.P. Panckow, L. Reinecke, M.C. Cuellar and S. Maaß (2017). Photo-Optical In-Situ Measurement of Drop SizeDistributions: Applications in Research and Industry, Oil Gas Sci. Technol 72, 14.
Oil & Gas Science and Technology – Rev. IFP Energies nouvelles (2017) 72, 14 Page 17 of 17


![1 Interfacial Rheology System. 2 Background of Interfacial Rheology Interfacial Shear Stress Interfacial Shear Viscosity = [ ]](https://img.pdfslide.us/doc/110x75/56649d1f5503460f949f3d29/1-interfacial-rheology-system-2-background-of-interfacial-rheology-interfacial.jpg)