Embed Size (px)
Citation preview


Photo credit:
© WWF-Canon / Paul FORSTER
© WWF-Canon / André BÄRTSCHI
© WWF-Canon / Mark EDWARDS
Design and Layout: Aulia Rahman

�
Contents
Contents �
List of Figures 2
List of Tables 3
CHAPTER � INTRODUCTION 4
�.� Background 4
�.2 Objectives 5
�.3 Scope of Work 5
CHAPTER 2 RESEARCH JUSTIFICATION 7
2.� BenefitoftheResearch 7
2.2 Previous Researches 7
2.3 Project Potentials 8
CHAPTER 3 METHODOLOGY �0
3.� Climate Data Processing and Groundwater Calculation �0
3.2 Climate Change Projection Model ��
3.3 Image Processing �2
3.4 Flow-chart Diagram �3
CHAPTER 4 ANALYSIS �4
4.� Rainfall and Temperature Projections Analysis �4
4.2 Zoning Changes Analysis 20
4.3 Direct Runoff Analysis and its Projection 22
4.4 Base-flow Analysis and its Projection 24
CHAPTER 5 CONCLUSION 27
REFERENCES 28
GLOSSARY 29

2
List of Figures
Figure �.� 6
Figure 3.� �3
Figure 4.� �5
Figure 4.2 �6
Figure 4.3 �8
Figure 4.4 �8
Figure 4.5 �9
Figure 4.6 20
Figure 4.7 2�
Figure 4.8 23
Figure 4.9 23
Figure 4.�0 25
Figure 4.�� 26

3
List of Tables
Table 4.�. Land-use Change in 200� and 2020 based on NDVI analysis �6
Table 4.2. Rainfall Amount in research areas in 200� and its projection in 2020 �9
Table 4.3. Zoning of the Research Area in 200� 2�

4
Chapter 1 INTRODUCTION
1.1 Background
The Industrial Revolution that started in�840 began the use of fossil fuel, especially the consumption of coal; it is the major cause for the drastic increase of greenhouse effect gases volumes in the atmosphere. The main green-house gas produced by fossil fuel consumption is carbon dioxide (CO2). The greenhouse gas effect has significantly triggered the globaltemperature rise on earth year after year. This phenomenon is known as the global warming.
Theglobalwarmingcausedbythegreenhousegaseshasalreadyandwillalwaysinfluencetheworld climate. Indonesian WWF and IPCC (�999) have reported that the yearly temperature in Indonesia has increased by 0.3 0C since �990. A scenario of climate change (Indonesian WWF and IPCC, �999) predicted that the temperature will increase between �.3 0C to 4.6 0C in 2�00 with the trend of 0.�00C – 0.400C per year. Susandi (2006) projected that temperature rise in Indonesia will reach 3.5 0C in 2�00, and earth’s temperature will reach the maximum of 6.2 0C that year. The implications of the temperature rise will raise �00 cm of ocean’s surface in 2�00. The accumulation of these events will affect the infrastructures, buildings, and human activities in the present time and in the future.
One of the basic human needs affected by global warming is the water reserve. Water supply is an important issue related to the climate change. Vörösmarty et al. (2000) showed that the water supply became an issue as the result of earth’s population growth which also increases the need of water. The increase of this demand will put pressure on the global water system that is highly related to the global warming. The population growth and the economy are the main factors that lead to the increaseofwaterdemand,while thewatersupply is influencedby the increased evaporation which resulted from temperature rise of the earth surface. The increased water supply demand is correlated with the need of the integrated management of water resources, and failing to do so, will damage the water resources physically, institutionally, and the implication will be on the socioeconomy.
Currently, the water management in Indonesia is generally considered as inadequate in the sensethatatthispointnoteveryonehastheaccesstoasufficientamountofwatertogetonwith their day-to-day lives. If there is no intervention for the water management, it will cause a problem. Half hearted approach or attempt to manage the water supply issue will not lead us to a comprehensive and sustainable solution. The decision makers and the authorities need to have a study that will bridge their lack of related educational background to manage water, so they can formulate a balanced and harmonic decision between the social function, environment, and the water resource economy.
This study attempts to analyze the climate change and its effect on the water reserve in riverside areas. This research provides answers to the need of climate change analysis related to temperatureandrainfall,whichwill influencesomevariables, related to thewaterbalancesystem and integrated water management. The study area is Citarum riverside, West Java.
5
The result will hopefully give a picture about water bodies’ management affected by the climate change and also as a recommendation for the ongoing development plan.
1.2 Objectives
The objectives of the study are:�. To analyse problems related to meteorology variables on climate change: the temperature
and rainfall.
2. To assess water supply issue using meteorology variables (temperature and rainfall) and to create a map and spatial data which give a picture about river condition, as the implication of the climate change.
3. Toincludeclimatechangeissuesintherivermanagementplan,soascientificdocumentcan be produced as the base for policy making and adaptation efforts for the decision makers and the government.
4. Toanalyzethepossibilityoffloodsandlandslideoccurrences,bystudyingthecontourmap and zoning.
5. To produce spatial map (space scale), a temporal map (time scale), the Citarum riverside data condition and its projection for 2020, as an implication of climate change.
6. In general, the purpose of the study is to develop an approach to analyse the issues and problems about water resource management in Indonesia, especially in Citarum riverside by including the climate change issues.
1.3 Scope of study
• The condition of Citarum riverside has grown very complex; therefore this research will focus more on the study of climate change at Citarum River that relates to the water availability and river management.
• The study assesses the climate change from the angle of meteorology (related to the temperature variable and rainfall) at Citarum River, and will not discuss theclimatechangethatinfluencesthequalityofwateroranyothereffects.
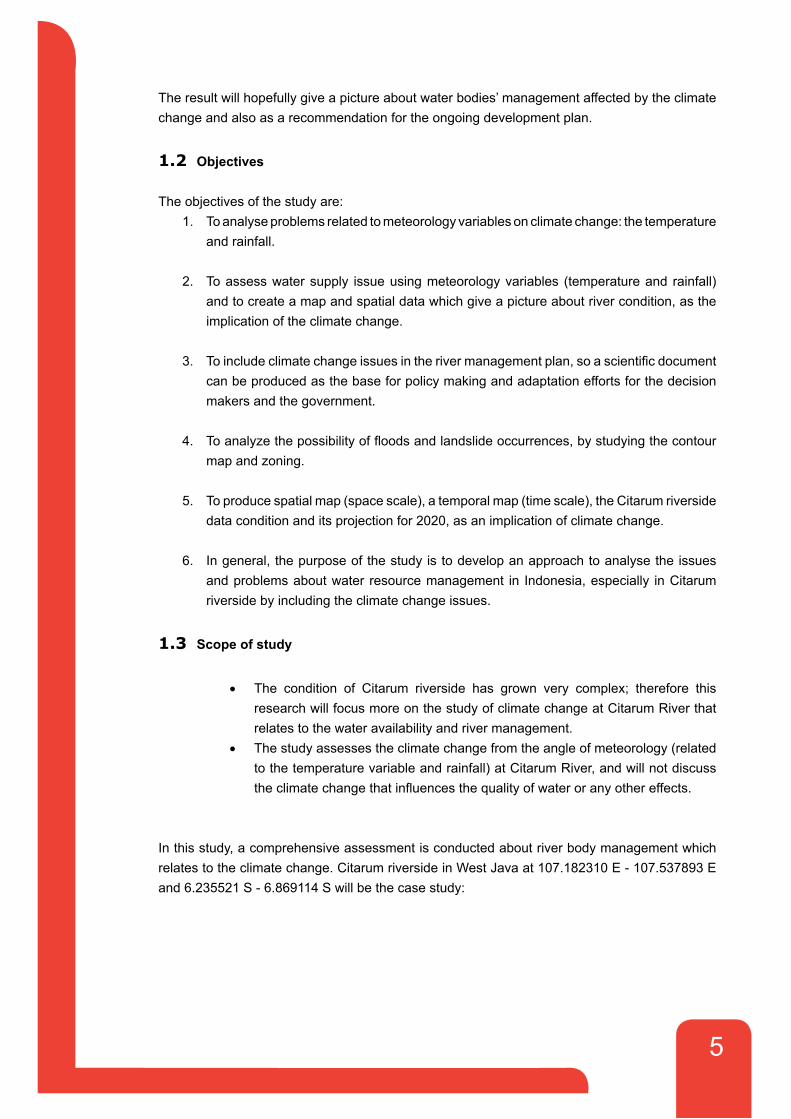
In this study, a comprehensive assessment is conducted about river body management which relates to the climate change. Citarum riverside in West Java at �07.�823�0 E - �07.537893 E and 6.23552� S - 6.869��4 S will be the case study:
6
Figure 1. 1 Research area: Citarum riverside

7
Chapter 2 RESEARCH JUSTIFICATION
2.1 The Benefit of the Research
The study produces a report about an assessment of the river body condition in Indonesia, with the aim of helping the decision makers and the authorities (the government) to make a comprehensive policy, related to the water management, especially in its relation to the climate change. This study also assesses the upriver area, where we will make an analysis about water balance. In the end, this research can contribute to the development planning in Indonesia, especially the water source management related to the climate change issue.
2.2 Previous Researches
Indonesia is located in the tropical climate zone (Köppen, �900, in Puradimaja, 2006). This type of climate usually has a characteristic in the seasonal variation: high rainfall in the rainy season andverylowrainfallindryseason.Theconditionmakesitdifficulttocontrolthewaterintherainyseasonanditisalsodifficulttogetsufficientwaterinthelongdryseason.Thus,it’snecessaryto do a study about water source management that is related to the climate change because rainfall is one of the important factors in climate change.
GCM (global circulation model) MAGICC/SCENGEN is used for the global scale climate change projection. This model is used to produce global temperature projection, change of rainfall amount in the future, and ocean’s surface level rise. The projection will be calculated until 2�00 with ten years interval. Climate change projection in Indonesia has been done by two models of GCM simulation, ECHAM4 (Germany) and HadCM2 (UK). SRESS B2 Emission scenario has been selected to project the temperature and rainfall in Indonesia. B2 scenario is assumed as the reference scenario that creates maximum temperature projection of �.4 oC in 2050 and will keep increasing until 2.6oCin2100.Next,theA2scenario(signifiedbytheincreaseofthepopulation and low growth in economy) will produce the increase of the temperature in Indonesia and it will reach more than 3oC in 2�00. The change of the amount of rainfall occurs randomly withthechangeofdeficitpercentage20%and12%increasein2100comparedtotherainfalldata in �990.
The study on the change of river debit as the result of the change in zoning has also been done by Sabar and Prasetiati in 2006 in Bandung basin area. The conclusion from the research is:
• Thereisasignificantchange,whicharethedecreaseofthevegetationareaandtheincreaseofthedevelopedarea.Thesechangesraisethetendencyofrunoffcoefficientto increase, which links to the increase of river maximum debit and the decrease of river minimun debit. The next phenomenon that will also likely to happen often is the danger offloodintherainyseasonanddroughtinthedryseason.
• The water surface condition has also threatened the ground water reserve in the Bandung basin; this is indicated by the decreasing water surface and soil subsidence.

8
SurosoandSantoso(2006)alsostatedthatzoningchangesinfluencetheincreaseofriverdebit.Thereisachangeofzoningfrom1759,28haofpaddyfields,289.54haofcultivatedlands,1284.36hahumansettlementsin1995,to1603.97hapaddyfields,283.32hacultivatedlands,�445.88 ha human settlements in 200�, which have caused the river debit to increase.
The calculation showed that climate change could also alter the water resource availability, and it will affect the growth of agriculture, industry, and urban development. Therefore climate changes will have a great effect on the water source management in some riverside areas (design, operation, and water usage system management).
Here are some of the runoff projection calculations with different climate change scenarios. If there is a 20%decreaseof rainfall and a 2°C increaseof temperature, the yearly runoffwilldecrease41%fromthepresentyearlyrunoff.Iftherainfallremainsthesame,runoffwillincreaseby9%.Butifthereisa10%rainfallincreaseand2°Cto4°Ctemperaturerise,itwillresultinarunoffincreasefrom4to12%(Hailemariam,1999).
Similar research has also been done to calculate the amount of direct runoff in Jakarta area toanalysethefloodincidentin2005.AfterthecalculationwasprocessedforthefloodcaseinJanuary �7th-20th 2005 at Tangkapan Kali Angke area, Pesanggrahan, and Grogol, it produced a good result. The maximum direct runoff value in January �9th, 2005 reached 3.76 inches, the increase of DRO started in January �7th until January �8th, 2005, because there was a high rainfall in January �7th (2.23 inches). In January �9th, 2005, DRO reached maximum value (3.76 inches) when the prediction of rainfall is 4.�� inches. Then the amount started to decrease until it came to less than � inch in January 2�th.
ThehighestDROvalueinJanuary19th,2005correlatedtotheworstoffloodwhichwasalsoinJanuary �9th, 2005. The amount of DRO in �9th January, 2005 was caused by the large amount of rainfall in January �9th, 2005, and worsened by the rainfall accumulation. The ground could not absorb more rain as it had become very saturated from the previous torrential rain that fell in the previous days consecutively. When again heavy rain fell in January �9th, the water from therainjustflowedonthesurfaceandcausedbigDRO.ThebiggestDROvaluewasfoundinresidentialareasandthesmallDROvaluewasfoundatthegreenareasuchasfields,farm-yards,andpaddyfields. Itshowsthat thecalculationofDROwithSoilConservationServicemethods is adequately reliable to be used in calculating the DRO, because it has included the variety of land/ground covers, type of ground, and soil moistness (Herlianti, 2007).
2.3 The Project Potentials
The studies regarding river bodies are parallel to the climate change. These studies proved to be useful for both the local government and the central government to help making more accurate decision regarding water resources conservation policies, especially on the demand and supply of water. These policies can then be used as the law for infrastructure developments to support the riverside area in adapting to the climate change. The method developed in this

9
study will be applicable for other areas, making adjustments whenever necessary to meet the specificconditionsinthoseotherareas.
�0
Chapter 3 METHODOLOGY
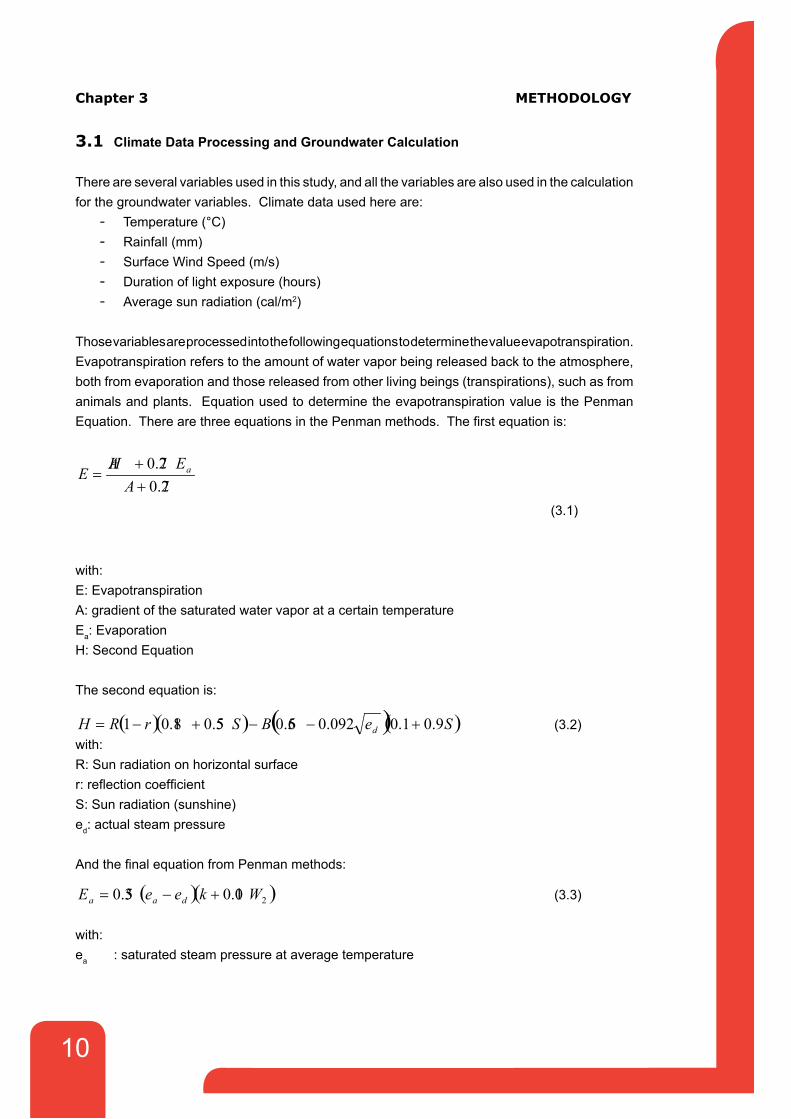
3.1 Climate Data Processing and Groundwater Calculation
There are several variables used in this study, and all the variables are also used in the calculation for the groundwater variables. Climate data used here are:
- Temperature(°C)- Rainfall (mm)- Surface Wind Speed (m/s)- Duration of light exposure (hours)- Average sun radiation (cal/m2)
Those variables are processed into the following equations to determine the value evapotranspiration. Evapotranspiration refers to the amount of water vapor being released back to the atmosphere, both from evaporation and those released from other living beings (transpirations), such as from animals and plants. Equation used to determine the evapotranspiration value is the Penman Equation.TherearethreeequationsinthePenmanmethods.Thefirstequationis:
27.027.0
++
=A
EAHE a
(3.�)
with:E: EvapotranspirationA: gradient of the saturated water vapor at a certain temperatureEa: EvaporationH: Second Equation
The second equation is:
( )( ) ( )( )SeBSrRH d 9.01.0092.056.055.018.01 +−−+−= (3.2)with: R: Sun radiation on horizontal surfacer:reflectioncoefficientS: Sun radiation (sunshine)ed: actual steam pressure
AndthefinalequationfromPenmanmethods:
( )( )201.035.0 WkeeE daa +−= (3.3)
with:ea : saturated steam pressure at average temperature

��
k :roughnesscoefficientW2 : wind-speed at the altitude of 2 meters
Thenextstepistocalculatethedirectrunoffandthebase-flow.Basically,base-flowsarethepercolated waters that reach the ground water reservoir, and then supply the river as a ground water discharge. The Soil Conservation Service (SCS) is a method developed by the Agricultural Department of the United States since �947. The SCS method is used to calculate the amount of direct runoff from a certain event of precipitation (USDA, �986). The equation is:
( )( )SP
SPQ8.0
2.0 2
+−
= (3.4)
Where, Q = Direct Run-off (inch) P = Rainfall (inch) S = Maximum retention (inch)
The value of S is parallel to the condition of the soil and land cover, shown in the Curve Number (CN). The CN value varies from 0 until �00.
101000−=
CNS (3.5)
To determine the amount of CN, there are a number of notable factors, i.e. the type of soil, land covers, hydrological condition, and the soil moistness.
Ontheotherhand,base-flowiscalculatedbycontinuingthePenmanmethod.Basically,runoffisthesumofthebase-flowandthedirectrunoff.UsingtheSCSmethodwealreadyacquirethe values of direct runoff, then with available climate data, the value for variable runoff can be obtainedTherefore,thevalueofthebase-flowcanbedetermined.
The output resulted from the above equations will be the crucial part on policy making regarding the riverside area management. The output will be updated according to changes of the most current river condition, so the policies made will always be compatible to the changes on the river’s condition. One interesting point from this study is that the policies made for the riverside area management involves climate change, therefore the formulation can be considered as a river’s strategic plan to adapt to the climate change. This policy not only involves the river biophysics factors, but also includes other factors such as variability of the climate and weather.
3.2 Projection Model of the Climate Change
In conducting the projection of the climate change parameters (the temperature and rainfall) it is necessarytohavespatialobservationdataandfieldmeasurementdata,Thedatausedinthisresearch are satellite data and climatological data for the temperature and rainfall around the

�2
Citarum’s riverside area. The earliest step is to collect climotological data and TRMM (Tropical Rainfall Measuring Mission) satellite data for the riverside area of Citarum for �0 years and climatological data such as rainfall and the monthly surface temperature. TRMM data are only used as a comparison data to the climatological data, spatially.
From the database, monthly data are extracted from each season every year. In this case, every year is divided into two periods, which are the rainy season (represented by January data) and the dry season (July).
Besides the two data above, it is necessary to have a digital map of the riverside area of Citarum River that includes location points of the meteorology obervation stations. Each observation pointsprovidethevalueofrainfallandsurfacetemperature,tofindtheplotthatarewithintherange of Citarum’s riverside area and its vicinity, it requires spatial interpolation. The interpolation used here is the Kriging method where this method is an interpolation that produced geostatical grids. The Kriging Point method estimated the value of each point in every grid, while also considering the value of each point that has a real value.
For the next step, the projection model of the climate change will be developed from the primary model of the last year of the observation period by developing non-linear equation on each climatological data spots. This equation will be extrapolated to obtain spatial and temporal projection for the rainfall and temperature of the observed area (Citarum riverside area). This model is used in this research to maximize the accuracy to the actual results and also because this model can be used in overlay with the spatial map of water resources in Citarum riverside area.
3.3 Image Processing
The images are obtained from Landsat TM for year �99� and 200�. Both images consist of two different types of images, which are 3-band image and 8-band image. The Landsat 3-band image is used to identify the types of soil, and landsat 8-band is used to analize the vegetation index (NDVI - Normalized Difference Vegetation Index). NDVI is used to determine the condition of vegetation in certain area. Basically, NDVI calculates the amount of the sun radiation absorbed by plants, especially on leaf surfaces. The green plants absorb sun radiations on the parts called photosynthetically active radiation (PAR). The value of NDVI varies from -�.00 to +�.00. The following equation is used in calculating the NDVI:
REDNIRREDNIRNDVI
+−
= (3.6)with: NIR : Near Infrared spectrumRED : Infrared spectrum
The processing of 3-band images resulted in land use map, and aided with soil type map, we can determine the value of direct runoff by using the SCS method. The entire image processing
�3
is mostly done using GIS software
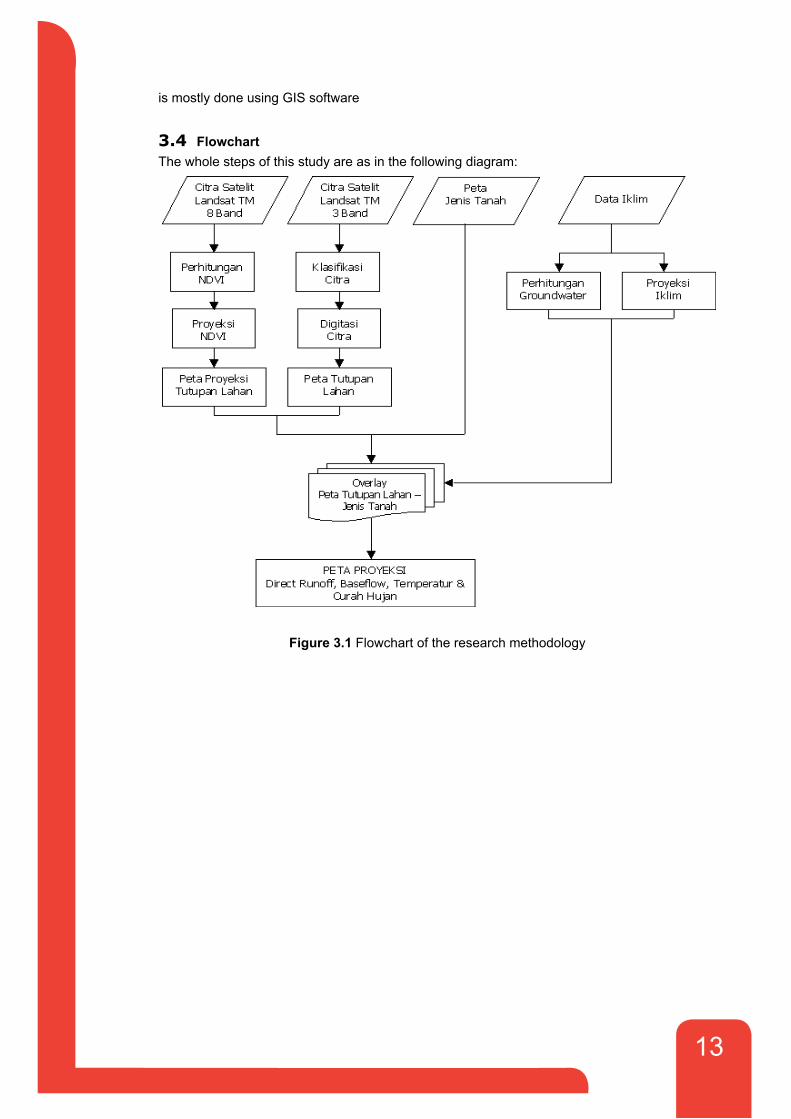
3.4 FlowchartThe whole steps of this study are as in the following diagram:
Figure 3.1 Flowchart of the research methodology

�4
Chapter 4 ANALYSIS
The hydrology cycle describes the movement of water on, in, and under the earth’s surface. Because the hydrology cycle is actually a “cycle”, and thus it is unclear where it begins or where it ends. Water can change forms from the liquid state, solid, and gaseous state at various stages in the cycle. This cycle also causes the recharge and discharge process at some reservoir of ground waters.
Base-flowanddirectrunoffarepartofthehydrologycycle.Base-flowlinkswiththedischargingprocess forgroundwater,anddirect runoffdescribes theamountofwater thatdirectlyflowson the ground, in the case of precipitation. The value of direct runoff depends on a number of conditions, from the meteorology side, land covers and the soil types of an area or region. If the directrunoffandbase-flowvaluesareknown,manyimportantissuescanalsobepredictedsuchas:thethreatoffloods,landslides,riverandriverdebit,droughtandgroundwaterreserve.
4.1 Rainfall and Temperature Projection Analysis
Climate change is indicated from the changes in two major meteorological factors, which are the temperature and the rainfall. These factors contribute to the rise of the sea level. The changes in temperature will cause changes on other variables in the atmosphere, which in the end causing changes on the rainfall. The change in the rainfall does not change the amount of the rainfall, but drastically altering the distribution pattern. This means that during the rainy season, certain area will receive more rains and during the dry season will receive fewer rains. This posed many problems to the mankind, because the impact of this change can be very dangerous, and even lethal. With the condition described previously, during the rainy season thereisanincreasedoccurenceofvariousdisasters,suchasfloods,landlides,anddiseasesepidemic through vectors. And during the dry season the disasters will continue with other type of disaster such as drought, which will lead to failing crops and the spread of various illnesses affecting the skin and digestive system, which will possibly lead to death.Rainfall pattern in Indonesia is known as type-V pattern or monsoon type, or a rainfall with annual graph shaping like the letter “V”. This means the number of precipitations in Indonesia will increase during December - February and it will decrease during June - August (see image 4.�). The periods of March - May and September - November are also known as transition periods. During this period, the rainfall and wind condition is constantly changing due to the monsoon wind, which is constantly shifting because of the heat source movement (wind pressure).

�5
Pola Curah Hujan Indonesia
0
�00
200
300
400
500
600
700
Jan Feb Mar Apr May Jun Jul Aug Sep Oct Nov Dec
Pres
ipita
si (m
m)
Figure 4.1. The general rainfall pattern in Indonesia.
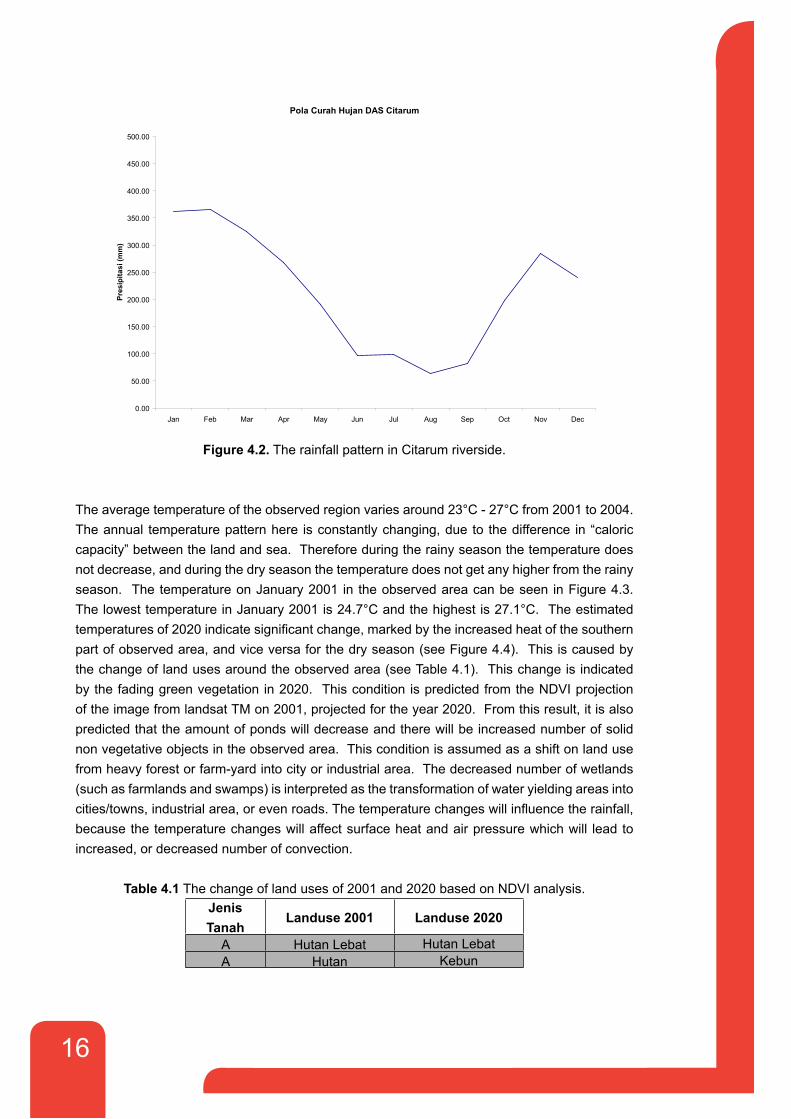
The rainfall in the researched area also follows this pattern. From the climate data obtained in the researched area, the average rainfall of Januari is 362.4 mm (�4.27 inches) and the average rainfall of February is 99.04 mm (3.9� inches). This means that the rainfall pattern in the observed area is the monsoon rainfall pattern (see Figure 4.2). With this pattern, it is clear that in January the water received from precipitation is abundant, which can cause disaster if it is not managed properly. But using appropriate approach, the excess water can be utilized for irrigation and saved in a reservoir during the dry season. The dry season represented by July showed huge difference on the number of the rainfall. This can lead to drought, failing crops, and scarcity of clean water during the dry season. These conditions will also affect the situation of the Citarum riverside. The abundant water during the rainy season could cause riverbanks overflow,whichpotentiallyleadstofloods.Butifmanagedproperly,itcouldbeusedtoincreasethe river debit, and make use of the dam in the Citarum riverside.
�6
Pola Curah Hujan DAS Citarum
0.00
50.00
�00.00
�50.00
200.00
250.00
300.00
350.00
400.00
450.00
500.00
Jan Feb Mar Apr May Jun Jul Aug Sep Oct Nov Dec
Pres
ipita
si (m
m)
Figure 4.2. The rainfall pattern in Citarum riverside.
Theaveragetemperatureoftheobservedregionvariesaround23°C-27°Cfrom2001to2004.The annual temperature pattern here is constantly changing, due to the difference in “caloric capacity” between the land and sea. Therefore during the rainy season the temperature does not decrease, and during the dry season the temperature does not get any higher from the rainy season. The temperature on January 200� in the observed area can be seen in Figure 4.3. ThelowesttemperatureinJanuary2001is24.7°Candthehighestis27.1°C.Theestimatedtemperaturesof2020indicatesignificantchange,markedbytheincreasedheatofthesouthernpart of observed area, and vice versa for the dry season (see Figure 4.4). This is caused by the change of land uses around the observed area (see Table 4.�). This change is indicated by the fading green vegetation in 2020. This condition is predicted from the NDVI projection of the image from landsat TM on 200�, projected for the year 2020. From this result, it is also predicted that the amount of ponds will decrease and there will be increased number of solid non vegetative objects in the observed area. This condition is assumed as a shift on land use from heavy forest or farm-yard into city or industrial area. The decreased number of wetlands (such as farmlands and swamps) is interpreted as the transformation of water yielding areas into cities/towns,industrialarea,orevenroads.Thetemperaturechangeswillinfluencetherainfall,because the temperature changes will affect surface heat and air pressure which will lead to increased, or decreased number of convection.
Table 4.1 The change of land uses of 200� and 2020 based on NDVI analysis.Jenis Tanah
Landuse 2001 Landuse 2020
A Hutan Lebat Hutan LebatA Hutan Kebun

�7
A Kebun Kota/industriA Kota Kota/industriA Industri Kota/industriA Lahan Kosong Kota/industri
ASawah/Lahan
BasahB Hutan Lebat Hutan LebatB Hutan KebunB Kebun Kota/industriB Kota Kota/industriB Industri Kota/industriB Lahan Kosong Kota/industri
BSawah/Lahan
BasahC Hutan Lebat Hutan LebatC Hutan KebunC Kebun Kota/industriC Kota Kota/industriC Industri Kota/industriC Lahan Kosong Kota/industri
CSawah/Lahan
BasahD Hutan Lebat Hutan LebatD HutanD Kebun KebunD Kota Kota/industriD Industri Kota/industriD Lahan Kosong Kota/industri
DSawah/Lahan
Basah
ThetemperatureinJuly(dryseason)2020(seeFigure4.4)changessiginificantly,thatcomesto as much as 2.8oC. This phenomenon is common when interlaced with the change of the land use of the observed area. As the elevation in the south is higher than the northern side; the area will experience a more intense heat in July. An area with higher elevation receives more heatthanthelowerelevation.Thiswouldleadtosignificanttemperaturechangesduringthedryseason; therefore it will need proper management and adaptation to anticipate the conditions projected to happen in year 2020.

�8
Figure 4.3. The temperature of January (rainy season) in the observed area.The image on the left was taken in 200� and on the right is the prediction for 2020.
Figure 4.4. The temperature of July (dry season) over the observed area.The image on the left was taken in 200� and on the right is the prediction for 2020.
�9
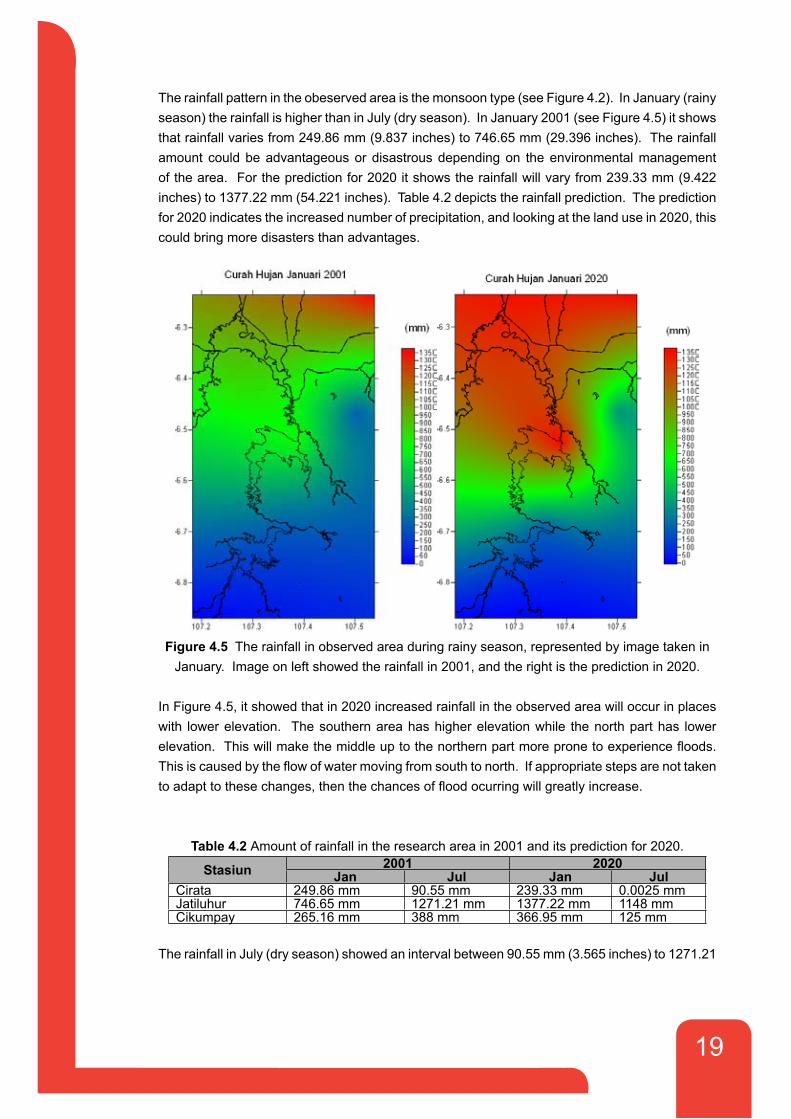
The rainfall pattern in the obeserved area is the monsoon type (see Figure 4.2). In January (rainy season) the rainfall is higher than in July (dry season). In January 200� (see Figure 4.5) it shows that rainfall varies from 249.86 mm (9.837 inches) to 746.65 mm (29.396 inches). The rainfall amount could be advantageous or disastrous depending on the environmental management of the area. For the prediction for 2020 it shows the rainfall will vary from 239.33 mm (9.422 inches) to �377.22 mm (54.22� inches). Table 4.2 depicts the rainfall prediction. The prediction for 2020 indicates the increased number of precipitation, and looking at the land use in 2020, this could bring more disasters than advantages.
Figure 4.5 The rainfall in observed area during rainy season, represented by image taken in January. Image on left showed the rainfall in 200�, and the right is the prediction in 2020.
In Figure 4.5, it showed that in 2020 increased rainfall in the observed area will occur in places with lower elevation. The southern area has higher elevation while the north part has lower elevation.Thiswillmakethemiddleuptothenorthernpartmorepronetoexperiencefloods.Thisiscausedbytheflowofwatermovingfromsouthtonorth.Ifappropriatestepsarenottakentoadapttothesechanges,thenthechancesoffloodocurringwillgreatlyincrease.
Table 4.2 Amount of rainfall in the research area in 200� and its prediction for 2020.
Stasiun 2001 2020Jan Jul Jan Jul
Cirata 249.86 mm 90.55 mm 239.33 mm 0.0025 mmJatiluhur 746.65 mm �27�.2� mm �377.22 mm ��48 mmCikumpay 265.�6 mm 388 mm 366.95 mm �25 mm
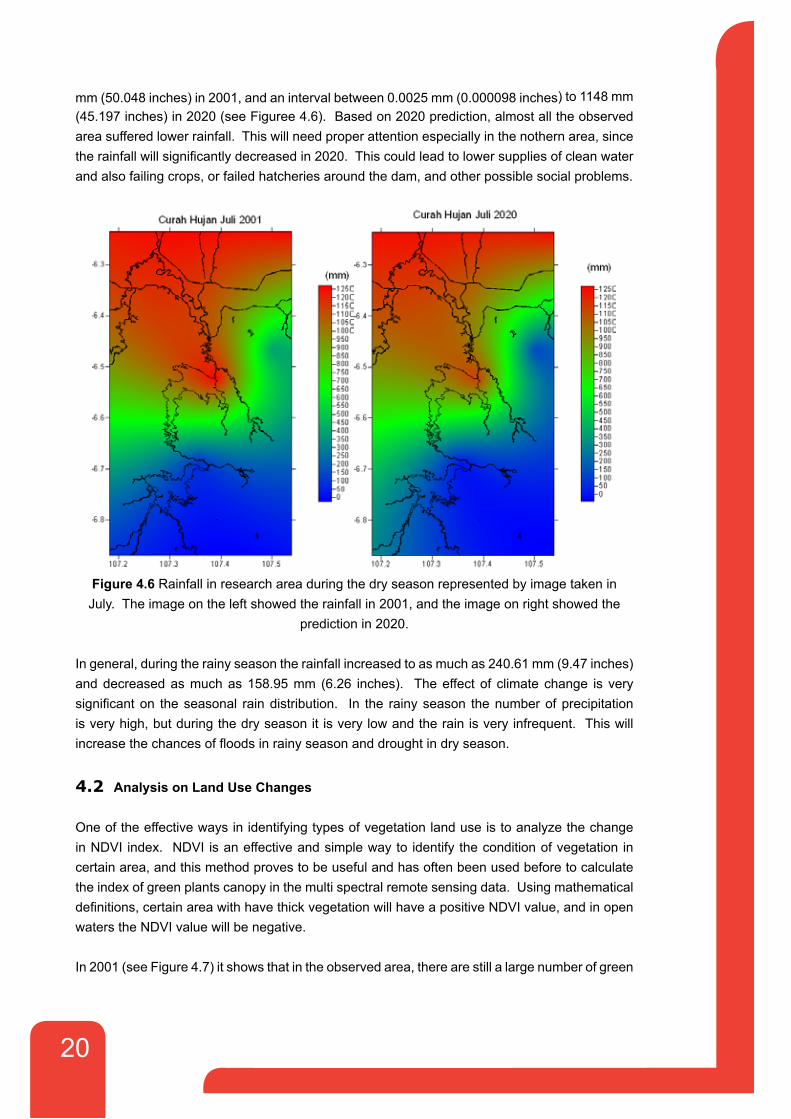
The rainfall in July (dry season) showed an interval between 90.55 mm (3.565 inches) to �27�.2�
20
mm (50.048 inches) in 200�, and an interval between 0.0025 mm (0.000098 inches) to ��48 mm (45.�97 inches) in 2020 (see Figuree 4.6). Based on 2020 prediction, almost all the observed area suffered lower rainfall. This will need proper attention especially in the nothern area, since therainfallwillsignificantlydecreasedin2020.Thiscouldleadtolowersuppliesofcleanwaterand also failing crops, or failed hatcheries around the dam, and other possible social problems.
Figure 4.6 Rainfall in research area during the dry season represented by image taken in July. The image on the left showed the rainfall in 200�, and the image on right showed the
prediction in 2020.
In general, during the rainy season the rainfall increased to as much as 240.6� mm (9.47 inches) and decreased as much as �58.95 mm (6.26 inches). The effect of climate change is very significanton theseasonal raindistribution. In the rainyseason thenumberofprecipitationis very high, but during the dry season it is very low and the rain is very infrequent. This will increasethechancesoffloodsinrainyseasonanddroughtindryseason.
4.2 Analysis on Land Use Changes
One of the effective ways in identifying types of vegetation land use is to analyze the change in NDVI index. NDVI is an effective and simple way to identify the condition of vegetation in certain area, and this method proves to be useful and has often been used before to calculate the index of green plants canopy in the multi spectral remote sensing data. Using mathematical definitions,certainareawithhavethickvegetationwillhaveapositiveNDVIvalue,andinopenwaters the NDVI value will be negative.
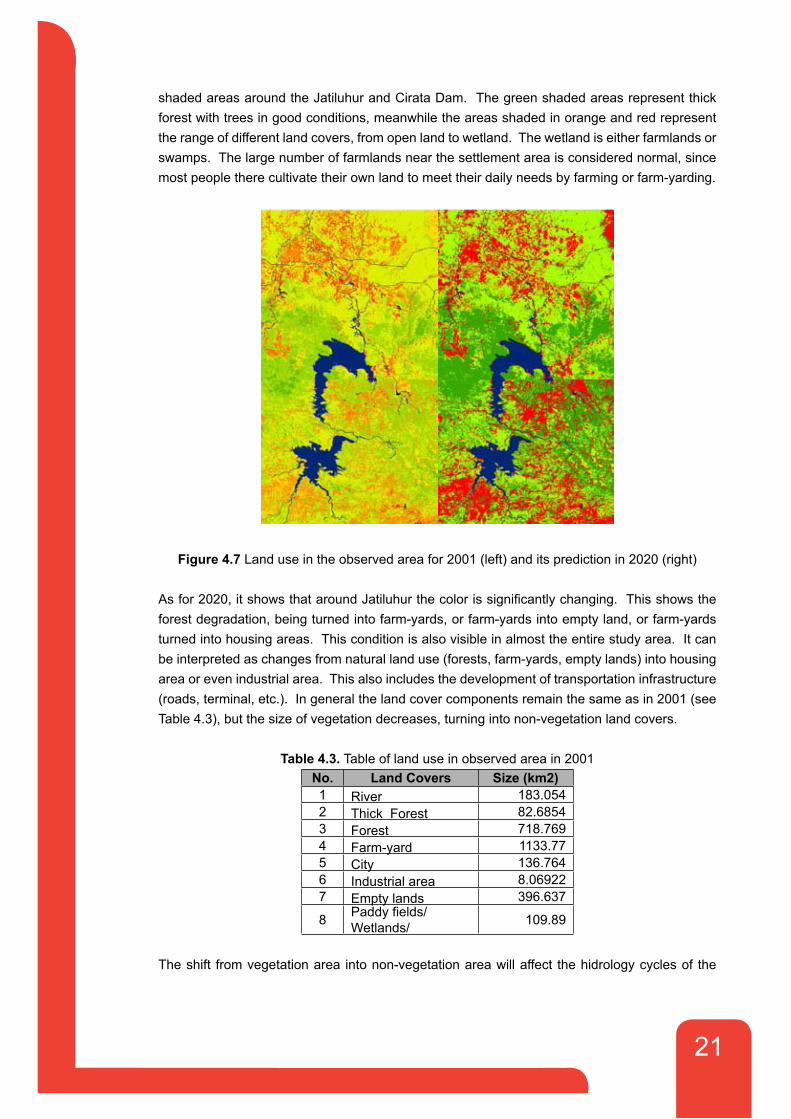
In 200� (see Figure 4.7) it shows that in the observed area, there are still a large number of green
2�
shaded areas around the Jatiluhur and Cirata Dam. The green shaded areas represent thick forest with trees in good conditions, meanwhile the areas shaded in orange and red represent the range of different land covers, from open land to wetland. The wetland is either farmlands or swamps. The large number of farmlands near the settlement area is considered normal, since most people there cultivate their own land to meet their daily needs by farming or farm-yarding.
Figure 4.7 Land use in the observed area for 200� (left) and its prediction in 2020 (right)
Asfor2020,itshowsthataroundJatiluhurthecolorissignificantlychanging.Thisshowstheforest degradation, being turned into farm-yards, or farm-yards into empty land, or farm-yards turned into housing areas. This condition is also visible in almost the entire study area. It can be interpreted as changes from natural land use (forests, farm-yards, empty lands) into housing area or even industrial area. This also includes the development of transportation infrastructure (roads, terminal, etc.). In general the land cover components remain the same as in 200� (see Table 4.3), but the size of vegetation decreases, turning into non-vegetation land covers.
Table 4.3. Table of land use in observed area in 200�
No. Land Covers Size (km2)� River �83.0542 Thick Forest 82.68543 Forest 7�8.7694 Farm-yard ��33.775 City �36.7646 Industrial area 8.069227 Empty lands 396.637
8 Paddyfields/Wetlands/ �09.89
The shift from vegetation area into non-vegetation area will affect the hidrology cycles of the

22
observed area. Basically the volume of water on a certain cycle can be maintained (Puradimaja, 2006). However, the shift from vegetation into non-vegetation area is causing water catchments volume deficit, thus depleting the water supply. Besides, the DRO increases as infiltrationdecreases, followed by increased surplus of water on the surface. Assessments regarding base-flowsanddirectrunoffs,usingthedataandcalculationforprojectioninclimatechangewillbe explained in the following paragraphs.
4.3 Analysis and Projection of Direct Runoff
Value of the Direct Runoff (DRO) depends on the types of soil, land covers and the rainfall, therefore its value varies for different the soil types and land covers. According to the DRO map in January 200� with rainfall of �6.56 inches (420.62 mm) the DRO varies between 0 to �6.3� inches (see Figure 4.8). The biggest DRO occurs in the city/town areas and clay soil type. This is caused by the inability city/town surfaces to absorb large amount of water; the surfaces in these areas are mostly covered by water-proof layers such as concrete and cement. Clay alsoaffectthewatercatchmentsabilitybecauseofitssmallporosity,makingitdifficult/slowforwater to be absorbed into the ground, hence causing more water to slip away on the surface as DRO. Clay with the D soil type has water absorbing rate of 0-� mm/hour. This means when precipitation occurs with the level of 400 mm, the water will be on the surface for 400 hours (equivalent to �7 days).
The DRO value in January 200� shows a high number, varies between �3.30 inches to �6.3� inches(337.82mm-414.27mm).Withtherainfallof16.56inchesitmeansmorethan70%oftherainfallwillflowonthesurfaceasaDRO.ThehighnumberoftheDROinJanuaryiscaused by the rainy season occured at that time (high rainfall). Compared to DRO projection of January 2020, it is obvious that the DRO in January 2020 will increase to 26.03 inches (66�.6� mm). The value of the DRO will also increase, reaching up to 25.66 inches (65�.76 mm) and with the change on the overlay (increased number of city area), the number of areas with high DRO will increase compared to the one in January 200�. These conditions will increase the chanceofdisastersoccurringintheobservedarea,suchasflood,landslides,riveroverflowing,and failing crops. Therefore, proper adaptation will be needed to reduce these undesirable and disastrous effects. Therefore it is urgently imperative that the stakeholders, in this case the local government and other parties should develop policies to prevent future damages which might happen because of the climate changes.

23
Figure 4.8 Direct runoff study area map for January (wet season) 200� (left panel) and the projection for 2020 (right panel).
The DRO map of July 200�, which is a dry season, shows that only a few areas have high DRO (shown in blue and red shades), most of the DRO is relatively smaller than the maximum value (seefigure4.9).TheprojectionofDROforJuly2020,areaswithhighDRO(comparedtothemaximum value) expand following the change in land covering (see table 4.�).
Figure 4.9 Direct runoff study area map for July (dry season) 200� (left panel) and the projection for 2020 (right panel).
The conclusion is that DRO value is relatively proportional to the rainfall rate; if the rainfall is high the DRO will be high, and if the rainfall rate is low the DRO will be low as well. This concludes
24
that the change in rainfall rate will greatly affect the volume of DRO of an area. Therefore the climatechange,signifiedbyincreasedofglobaltemperature,haschangedthelocalclimateofsome area. The change of temperature has also changed the rainfall level, and because the DRO corresponds proportionally to the rainfall rate, the climate change is then affecting the DRO.
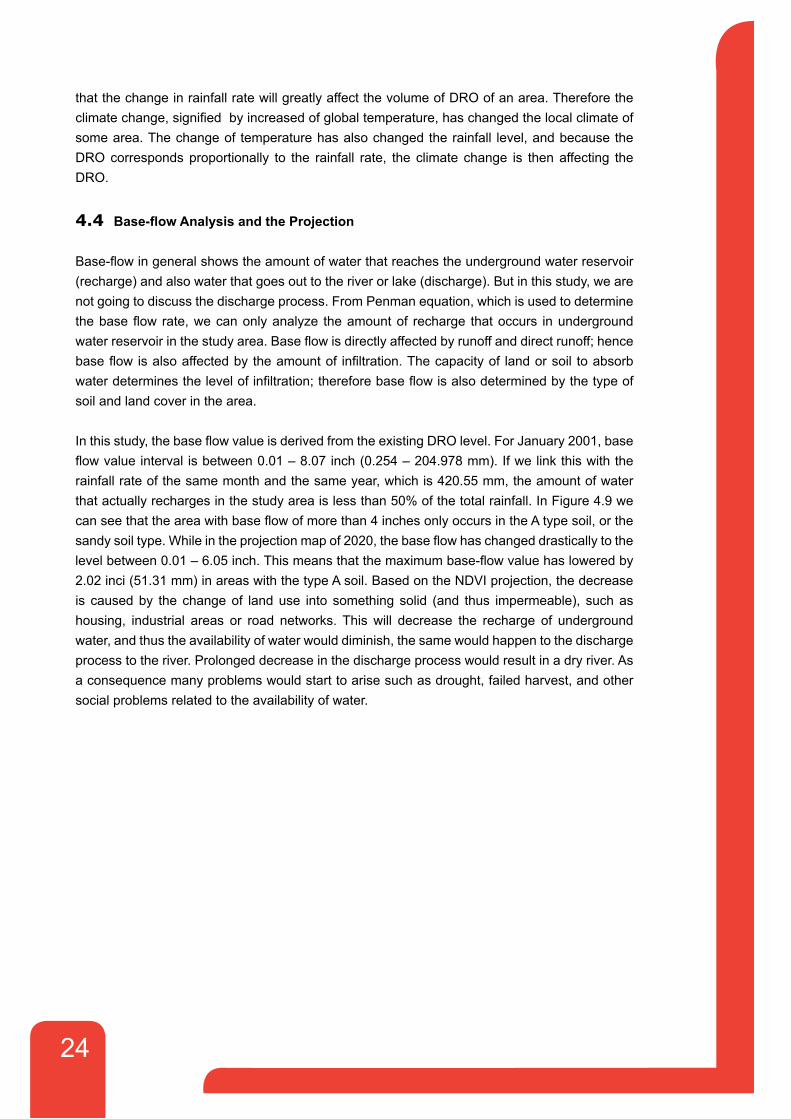
4.4 Base-flow Analysis and the Projection
Base-flowingeneralshowstheamountofwaterthatreachestheundergroundwaterreservoir(recharge) and also water that goes out to the river or lake (discharge). But in this study, we are not going to discuss the discharge process. From Penman equation, which is used to determine thebaseflowrate,wecanonlyanalyze theamountof recharge thatoccurs inundergroundwaterreservoirinthestudyarea.Baseflowisdirectlyaffectedbyrunoffanddirectrunoff;hencebaseflowisalsoaffectedbytheamountof infiltration.Thecapacityof landorsoil toabsorbwaterdeterminesthelevelofinfiltration;thereforebaseflowisalsodeterminedbythetypeofsoil and land cover in the area.
Inthisstudy,thebaseflowvalueisderivedfromtheexistingDROlevel.ForJanuary2001,baseflowvalueintervalisbetween0.01–8.07inch(0.254–204.978mm).Ifwelinkthiswiththerainfall rate of the same month and the same year, which is 420.55 mm, the amount of water thatactuallyrechargesinthestudyareaislessthan50%ofthetotalrainfall.InFigure4.9wecanseethattheareawithbaseflowofmorethan4inchesonlyoccursintheAtypesoil,orthesandysoiltype.Whileintheprojectionmapof2020,thebaseflowhaschangeddrasticallytothelevelbetween0.01–6.05inch.Thismeansthatthemaximumbase-flowvaluehasloweredby2.02 inci (5�.3� mm) in areas with the type A soil. Based on the NDVI projection, the decrease is caused by the change of land use into something solid (and thus impermeable), such as housing, industrial areas or road networks. This will decrease the recharge of underground water, and thus the availability of water would diminish, the same would happen to the discharge process to the river. Prolonged decrease in the discharge process would result in a dry river. As a consequence many problems would start to arise such as drought, failed harvest, and other social problems related to the availability of water.
25
Figure 4.10 BaseflowmapforJanuary2001(left)andtheprojectionfor2020(right).
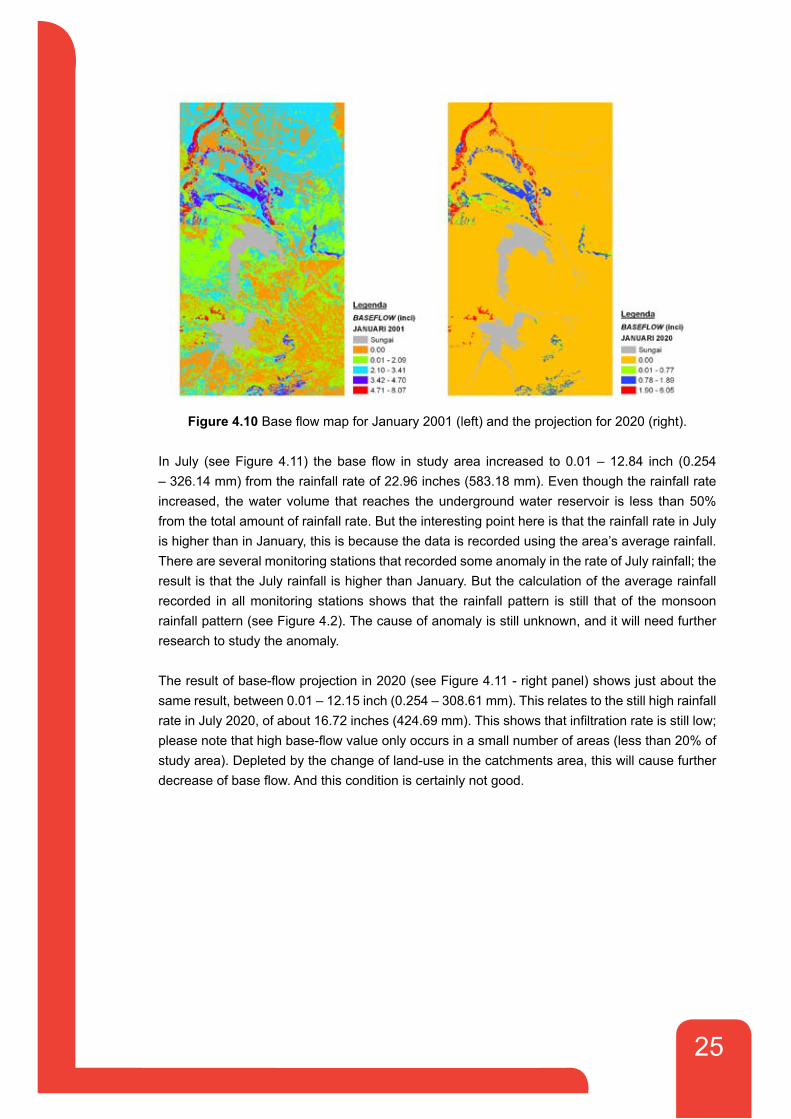
In July (seeFigure4.11) thebaseflow in studyarea increased to0.01–12.84 inch (0.254– 326.�4 mm) from the rainfall rate of 22.96 inches (583.�8 mm). Even though the rainfall rate increased, thewatervolume that reaches theundergroundwater reservoir is less than50%from the total amount of rainfall rate. But the interesting point here is that the rainfall rate in July is higher than in January, this is because the data is recorded using the area’s average rainfall. There are several monitoring stations that recorded some anomaly in the rate of July rainfall; the result is that the July rainfall is higher than January. But the calculation of the average rainfall recorded in all monitoring stations shows that the rainfall pattern is still that of the monsoon rainfall pattern (see Figure 4.2). The cause of anomaly is still unknown, and it will need further research to study the anomaly.
Theresultofbase-flowprojectionin2020(seeFigure4.11-rightpanel)showsjustaboutthesame result, between 0.0� – �2.�5 inch (0.254 – 308.6� mm). This relates to the still high rainfall rateinJuly2020,ofabout16.72inches(424.69mm).Thisshowsthatinfiltrationrateisstilllow;pleasenotethathighbase-flowvalueonlyoccursinasmallnumberofareas(lessthan20%ofstudy area). Depleted by the change of land-use in the catchments area, this will cause further decreaseofbaseflow.Andthisconditioniscertainlynotgood.
26
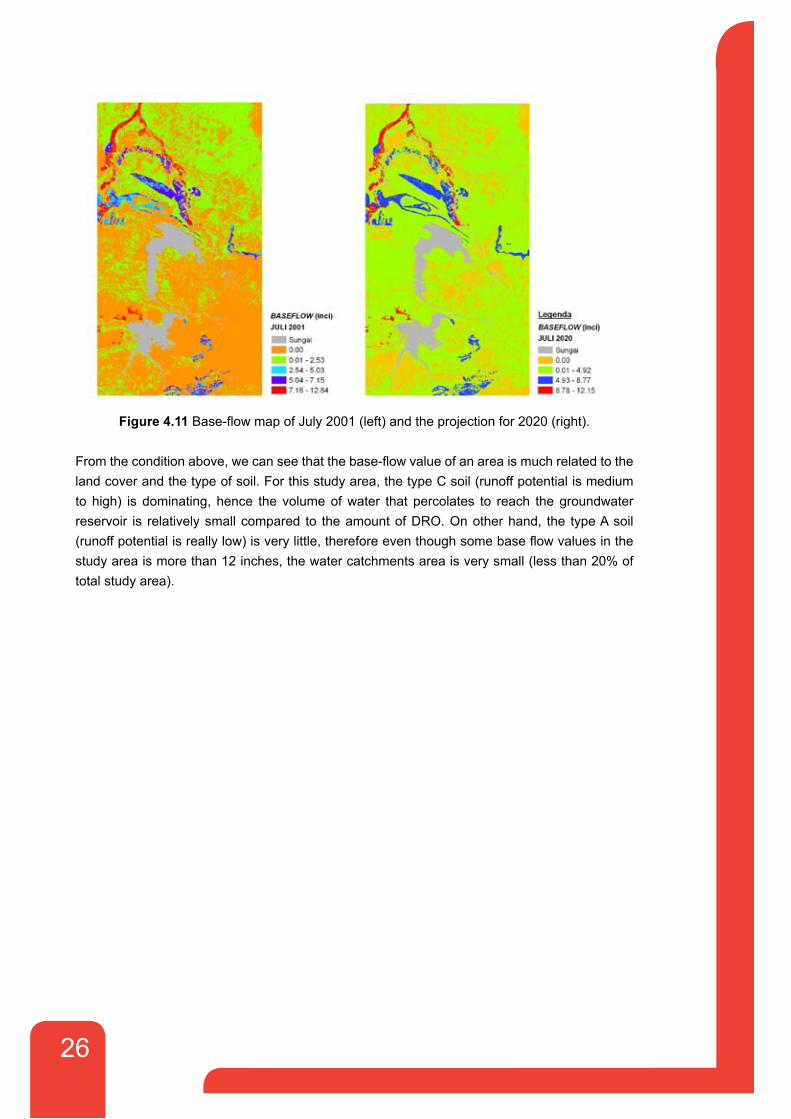
Figure 4.11 Base-flowmapofJuly2001(left)andtheprojectionfor2020(right).
Fromtheconditionabove,wecanseethatthebase-flowvalueofanareaismuchrelatedtotheland cover and the type of soil. For this study area, the type C soil (runoff potential is medium to high) is dominating, hence the volume of water that percolates to reach the groundwater reservoir is relatively small compared to the amount of DRO. On other hand, the type A soil (runoffpotentialisreallylow)isverylittle,thereforeeventhoughsomebaseflowvaluesinthestudyareaismorethan12inches,thewatercatchmentsareaisverysmall(lessthan20%oftotal study area).

27
Chapter 5 CONCLUSIONS
From the climate variable analyses, climate change and groundwater in the previous chapters, we can conclude that:
�. Based on the result of temperature variable projection, the temperature tends to increase until 2020, and will continue to rise in the future. The trend of gradual increase in temperature is an indication of a climate change in the research area.
2. From the perspective of seasonal distribution in the study area, the rising temperature changes the rainfall rate. In general the study area is wetter during the rainy season and drier in the dry season.
3. The change in rainfall distribution causes potential natural hazards triggered by increased rainfallratesuchas:flood,landslide,riveroverflow,andthespreadofepidemicdiseases.On the other hand, decreasing rainfall can cause drought, failed harvest, lack of clean water, and social problems, such as monopoly of water supply.
4. Flood threat in the northern part of study area is higher because the elevation in this partislowerthanthesouth,andinhighrainfallperiod,thiscancausebigfloodinthenorth because the south part is also steeper compared to the gradual slope in the north. Thetopographicalprofileoftheareaposesalsothedangerofriveroverflowandagiantaccumulation of water forming around the riverside area in the north.
5. The area with potential landslide is in the steep slope between Cirata and Jatiluhur. The area west of Jatiluhur, also faces the same threat because it is a steep area with high DRO rate.
6. Based on the rainfall rate in wet and dry season, actually the volume of from rainfall can cover the water needs for the local communities in study area. A person would need �00 liter of water per day, the rainfall in � month (January 200�) is 348 million litter, and the population in Citarum riverside is 5.7 million. The rainfall could supply 20.4 liter/day for eachpersonor20%oftheneed.Theriver,lake,orevenartesianwater(well)cansupplythe remaining required water.
7. Thecurrentrainlevelisstillsufficienttoprovidethewaterreserveneededtoconservethe forest in the research area (the forest in the area needs 0,93x�08 liter/month while the volume of water in January 200� is 3,48x�08 liter/month). Even with the assumption that the forest area decreases as the result of local development, the water volume projected for year 2020 is still enough to maintain this condition. But if in reality the level of development exceeds the estimated rate causing even less water catchments then this prediction might not be valid.
8. Based on the data of the average monthly debit between �984 and 2005 at one point in the research area, the average daily debit in a year comes to �2.253.884 liter/day for every square kilometer. Therefore the average monthly debit is 367,6�6,520 liter/month. If this number is added to the rain level, the sum would be 7.�5 x �08 liter of water/month. This would provide enough water for the demand of the communities in the riverside area and also for the forest (the total need of water for the communities and forest is 6,63x�08 liter/month).

28
REFERENCES
• D.J. Puradimaja, B. Kombaitan, and D.E. Irawan. 2006. Hydro-geological Analysis in Regional Planning of Tigaraksa City, Tangerang, Banten, Indonesia. Langkawi-Malaysia
• Herlianti, I. 2007. Prediksi Curah Hujan dengan Data Radiosonde untuk Menentukan daerah Potensi Banjir. Tugas Akhir Program Studi Meteorologi. Insitut Teknologi Bandung.
• Köppen, W. �900. Handbuch der Klimatologie, West Germany.• Suroso and Santoso. 2006. Pengaruh Perubahan Tata Guna Lahan Terhadap Debit
Banjir Daerah Aliran Sungai Banjaran, Jurusan Teknik Sipil, Universitas Jenderal Soedirman.
• Susandi, A. 2006. Laporan Interim Penyusunan Pola Investasi dalam Rangka Peningkatan Partisipasi Swasta dan Koperasi dalam Pengembangan Energi Terbarukan, Bandung.
• United States Department of Agriculture (USDA), Natural Resources Conservation Service. (�986). Urban Hydrology for Small Watershed (TR–55)
• Vorosmarty, C. J., P. Green, J. Salisbury and R. B. Lammers. 2000. Global Water Resources: Vulnerability from Climate Change and Population Growth, Science, 289, 284 - 288
• WWF Indonesia and IPCC. �999.

29
GLOSSARYBase-flowWater that reaches the groundwater reservoir which supplies the river.
Direct Runoff Theoverflowofsurfacewater.Thishappenswhenwaterdirectlyflowsoverthegroundsurfacebecause the soil can no longer absorb the rain.
Green House EffectDuring the day time, when the sun radiates its energy to the earth, a large part of the radiation energy(45%) isreflectedbackto thesky.Thegreenhousegas layer in theatmospherewillabsorb the reflectedsun radiation.Thisphenomenon isoftencalled thegreenhouseeffect.Green house effect correlates with global temperature change. If there is no green house effect in atmosphere, the earth temperature will be below - �8oC.
EvaporationThe process of liquid turning into gas.
EvapotranspirasiWater evaporation through direct evaporation of a wet surface and the release of vapors from vegetations.
Green House GasThe gasses that absorb sun radiation and bounce it back to earth and causing the earth temperature to rise. Some of the green house gasses are: carbon dioxyde (CO2), Methane, Nitrous Oxyde, etc.
GroundwaterThe water below the ground surface.
InfiltrationThe process of water being absorbed by the soil or rocks.
ConvectionThe vertical air movement caused by heated ground surface.
Global WarmingThe warming of the earth surface caused by green house gasses in the atmosphere.
PercolationWater movement into the soil.
Precipitation Various water particles (liquid and solid), that falls from the atmosphere and reach the ground.
30
RunoffSumofbase-flowanddirectrunoff.
Hydrology CycleNatural water cycle of the earth, the transformation from liquid, solid, and gas.
Vapor PressurePressure caused by the molecules of evaporated water in certain air volume.
Air TemperatureDegree of hotness and coldness of air measured by a thermometer.
TranspirationRelease of water vapor by plant into the atmosphere.
Water Catchment VolumeCapacity of soil to trap/retain water.

3�