Embed Size (px)
Citation preview
Phosphorus Release and Equilibrium Dynamics of CanalSediments within the Everglades Agricultural Area, Florida
Jaya Das & Samira H. Daroub &
Jehangir H. Bhadha & Timothy A. Lang &
Manohardeep Josan
Received: 28 September 2011 /Accepted: 13 March 2012 /Published online: 3 April 2012# Springer Science+Business Media B.V. 2012
Abstract High phosphorus (P) in surface drainage waterfrom agricultural and urban runoff is the main cause ofeutrophication within aquatic systems in South Florida,including the Everglades. While primary sources of P indrainage canals in the Everglades Agricultural Area(EAA) are from land use application of agricultural chem-icals and oxidation of the organic soils, internal sourcesfrom canal sediments can also affect overall P status in thewater column. In this paper, we evaluate P release andequilibrium dynamics from three conveyance canals with-in the EAA. Incubation and flux experiments were con-ducted on intact sediment cores collected from fourlocations within the Miami, West Palm Beach (WPB),and Ocean canal. After three continuous exchanges,Miami canal sediments reported the highest P release(66±37 mg m−2) compared to WPB (13±10 mg m−2)and Ocean (17±11 mg m−2) canal over 84 days. Overall,the P flux from all three canal sediments was highestduring the first exchange. Miami canal sediments showedthe highest P flux (2.4±1.3 mg m−2 day−1) compared to
WPB (0.83±0.39 mgm−2d−1) and Ocean canal sediments(0.98±0.38 mg m−2 day−1). Low P release from WPBcanal sediments despite having high TP content could bedue to carbonate layers distributed throughout the sedi-ment column inhibiting P release. Equilibrium P concen-trations estimated from the sediment core experimentcorresponded to 0.12±0.04 mg L−1, 0.06±0.03 mg L−1,and 0.08±0.03mg L−1 forMiami,WPB, andOcean canalsediments, respectively, indicatingMiami canal sedimentsbehave as a source of P, while Ocean and WPB canalsediments are in equilibrium with the water column.Overall, the sediments showed a significant positive cor-relation between P release and total P (r00.42), Feox(r00.65), and Alox (r00.64) content of sediments. Thecontribution of P from the three main canals sedimentswithin the EAA boundary corresponded to a very smallportion of the total P load exiting the EAA. These esti-mates, however, only take into consideration diffusivefluxes from sediments and no other factors such as canalflow, bioturbation, resuspension, and anaerobicconditions.
Keywords Everglades Agricultural Area . Sediments .
Canal . Phosphorus . Equilibrium . Incubation .
Release
1 Introduction
The Everglades Agricultural Area (EAA) consists of aportion (2,833 km2) of the original Everglades region
Water Air Soil Pollut (2012) 223:2865–2879DOI 10.1007/s11270-012-1152-2
J. Das : S. H. Daroub (*) : J. H. Bhadha : T. A. Lang :M. JosanEverglades Research and Education Center,University of Florida,3200 E. Palm Beach Rd.,Belle Glade, FL 33430, USAe-mail: [email protected]
S. H. DaroubSoil and Water Science Department,University of Florida,Gainesville, FL, USA
of south Florida, actively drained to sustain an annual$2 billion agriculture industry within the region. Tomaintain a high rate of productivity, nutrient and watermanagement are essential. Over the years, phosphorus(P) in drainage water has been purported as a majorcontributor to the eutrophic state of the downstreamEverglades ecosystem. Some of the efforts carried outto reduce P loads out of the EAA involved best man-agement practices (BMPs) that have resulted in an av-erage annual P load reduction of 50% compared tobaseline levels since inception in 1995 (Daroub et al.2011). In an attempt to further reduce P loads, six storm-water treatment areas (STA) were constructed along theouter boundary of the EAA, encompassing an area ofapproximately 160 km2 (SFER 2011b). The STAs areused to “filter” water coming from agricultural andurban areas before being discharged into the water con-servation areas (WCAs). The main goal of farmingBMPs and STAs is to deliver water with low P concen-tration to downstream ecosystems. However, historic Ploading to canals and subsequent P flux from accumu-lated sediments to the water column is of concern as apotential source of P to canal waters and ultimatelydownstream aquatic systems.
There are four main canals that are used to deliverirrigation water from Lake Okeechobee in the dryseason and act as drainage canals in the wet seasonwithin the EAA: the West Palm Beach, Hillsboro,North New River, and the Miami. The Ocean canalis another connecting conveyance canal. The canalsare controlled and maintained by the South FloridaWater Management District (SFWMD). The canalstransport water and P to the WCAs, and can impactthe quality of water of these wetlands (Gu et al. 2001).Mechanisms that alter P levels in the canals may alsobe responsible for the changes in the P levels in theSTAs and WCAs (Kadlec and Wallace 2008). Whileone such mechanism maybe sediment resuspensiondue to flow, another could involve simple diffusionalexchange of P from shallow porewater to the watercolumn. Sediment resuspension from flow may bebeneficial to the quality of receiving water by sorbingthe ortho-P from the water column (Brezonik et al.1979); conversely, sediment resuspension may beproblematic by releasing nutrients from the suspendedmaterial (McPherson et al. 1976). The net effect is thatortho-P is cycled between the suspended sediment andthe water in a state of dynamic equilibrium (Gale1975; Davis 1982).
Typically under aerobic conditions, ortho-P is re-moved from the water column in the presence of Feand Al hydroxides (Pierzynski et al. 2005; Bhadha etal. 2010a). This loss also occurs when there is a highconcentration of Ca, as is the case in the EAA canals.Such condition favors the precipitation rather than therelease of P (McPherson et al. 1976). Reddy (1983)studied P interaction between sediments and overlyingwater column and found that organic sediments hadthe lowest ability to remove P from the water column.However, calcareous clay loams have the highest Premoval ability, which is similar to the underlyingmarl deposits in the EAA. Since the main canals aredug into the limestone bedrock, a significant removalof P can be expected until organic sediment depositsaccumulate to the point where they limit diffusion.This is in fact expected to be the case in most of theEAA canals resulting from decades of detrital organicmatter deposition within the canals from agriculturalrunoff and growth of aquatic vegetation. Under turbu-lent flow conditions, the canal sediments may be resus-pended and could potentially be a source of solublenutrients (Stuck et al. 2001). Generally, anaerobic andacidic conditions favor the release of phosphate fromsediments. Waller and Earle (1975) supported this, butbecause of the prevalence of aerobic conditions most ofthe year they concluded that ortho-P is released from thesediments only infrequently.
The release of P from sediment is chemically de-pendent upon factors such as mixing (Holden andArmstrong 1980; Boström et al. 1982), pH, bioturba-tion (Sondergaard 1989), redox potential (Moore et al.1998), and concentrations of oxygen, Ca, Fe, and Al.Small changes in sediment–water equilibria can havelarge effects on P levels in the water. Gale (1975)reported the rate of P release from sediments in LakeOkeechobee to be 6.42 g m−2 year−1. Similar estimatesneed to be calculated for the main canal sedimentswithin the EAA. Water flowing out of the EAA con-tains P in the dissolved form (orthophosphate andsoluble organic) and in the particulate form (mineraland organic) (Daroub et al. 2002). Phosphorus trans-ported to canals accumulates in the sediments and thecapacity of sediments to retain or release P can affectwater quality. Our concern about EAA canals is thatthe canal sediments can act as potential P source andgenerate an internal load of P to the overlying watercolumn which is then delivered to the downstreamEverglades. Another concern is that the sediments
2866 Water Air Soil Pollut (2012) 223:2865–2879
are subject to transport and can act as a P source wherevertransported. A Phosphorus-flux incubation study willhelp us understand the P release characteristics associatedwith internal loading of the EAA canal sediments.
Equilibrium phosphorus concentration (EPC)measurements of canal sediments can be used to de-termine if sediments act as sink or source of P. TheEPC is defined as the aqueous P concentration in thewater column at which zero net flux occurs betweenthe sediments and the water, i.e., the P in solution is inequilibrium with P in the solid phase (Reddy et al.1999). When soluble reactive P (SRP) in the overlyingwater is greater than the EPC of the sediment, thesediment will remove SRP from the water column,and the opposite is true when SRP is less than theEPC (Reddy et al. 1995; Pant and Reddy 2001). De-termining the EPC values within EAA main canalswill allow us to identify the direction of SRP fluxesacross the sediment–water interface.
Equilibrium P concentration (EPC) values can bedetermined from incubation of intact sediment cores.The EPCw is the floodwater P concentration in intactsediment columns when there is no net P release/retention from the sediments. The EPC values deter-mined by Richardson and Vaiyithianaythan (1995) inWCA-2A showed a linear increase of EPC values fromun-enriched to enriched sites. They had also reportedhigher EPC values at the inflow structures. Graetz andNair (1995) determined EPC values in high animaldensity areas soils in a watershed north of Lake Okee-chobee. These active dairy soils had EPC values rangingfrom 5.3 to 10.6 mg L−1 whereas the EPC value for thenative soils was around 1.3 mg L−1. The EPC values inun-enriched southern Everglades’ soil determined byZhou and Li (2001) ranged from 0.002 to 0.010 mg L−1.
The main conveyance canals in the EAA are struc-turally and ecologically connected to the rest of theEverglades. Dynamics of P release/retention, its mag-nitude, and interaction with other parameters in thesecanals is of prime importance as it indicates the po-tential of canal sediments to release P and adverselyaffect downstream water bodies. We hypothesized thatcanal sediments high in organic matter and total Pcontent are more likely to release P into the watercolumn and have a higher EPC. Evaluating the inter-actions between P release and sediment physico-chemical parameters such as organic matter (OM),pH, P species, and metals can be important informa-tion necessary to diagnose present water quality
conditions. This information can be utilized to forecastwater quality conditions, build water quality models,and develop effective long-term management strate-gies. Results from Das et al. (2012) indicated thatmajority of P in the canal sediments was containedin the HCl–P fraction (Ca–P and Mg–P), comprising>50% of total P in the main and farm canal sediments.An estimated 73 mt of P was stored in the 0–10cmlayer of the three main canals within the EAA bound-aries of which 57 mt P is reactive and available forrelease at different time scales (Das et al. 2012). Con-cerns generated from these results have prompted theneed to investigate potential P release from the maincanal sediments.
The objectives of this study were to (1) evaluate thepotential P release from Miami, West Palm Beach(WPB), and Ocean canal sediments; (2) determinethe EPC of the three canals to determine if the sedi-ments act as a source or sink of P; and (3) correlatefactors such as OM, total P, extractable Ca and Mg,and Fe–Al oxides content with P release from thesecanal sediments.
2 Materials and Methods
2.1 Sediment Sampling and Analyses
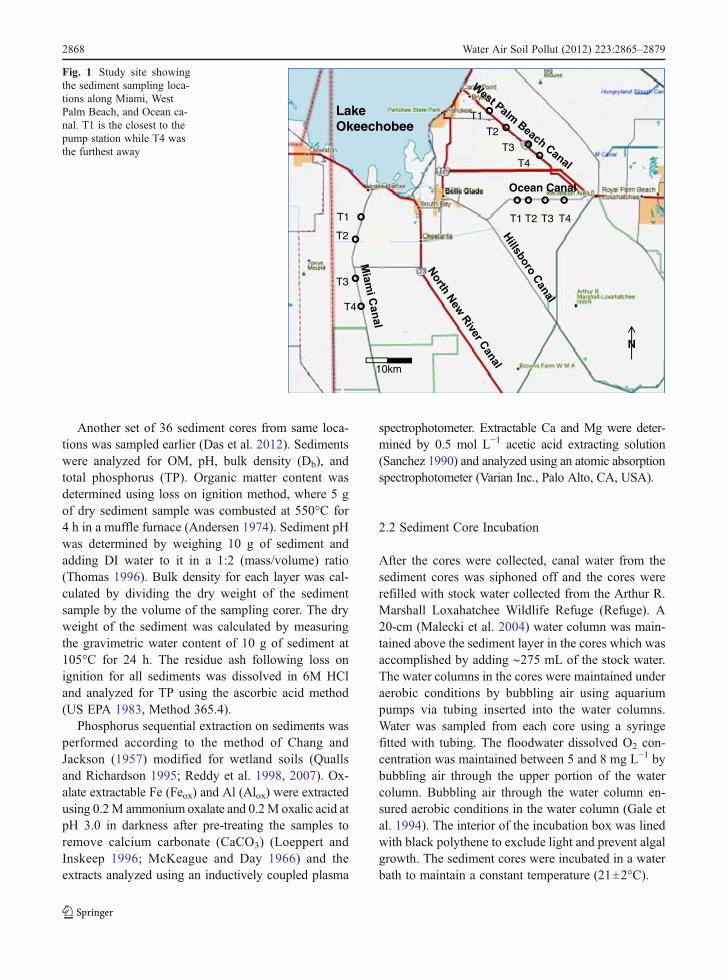
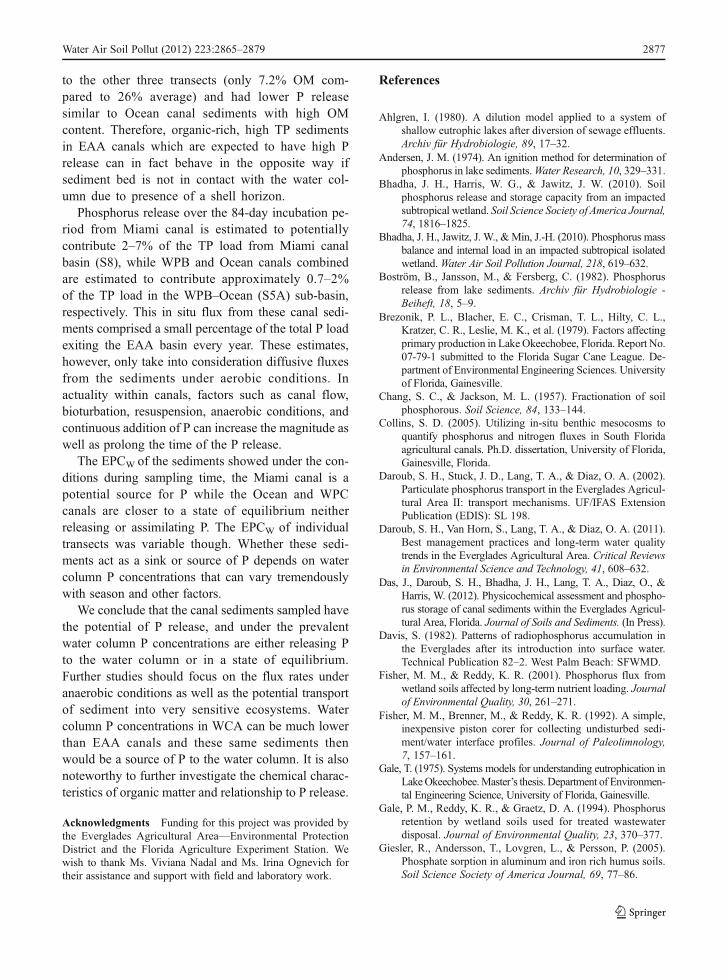
Intact sediment cores were collected from four differ-ent transects (T1, T2, T3, and T4) within the Miami,WPB, and Ocean canals EAA boundary (Fig. 1). Theintact cores were collected using a piston sedimentcorer comprised of a 7.0-cm inner diameter polycar-bonate core tube that was inserted into the sedimentbed (Fisher et al. 1992). At each of the four transects ineach canal, about 20 cm of intact sediments was col-lected in triplicates along the width of the transectleading to 12 cores per canal. The first location (T1)for Miami and WPB canal was closest to the LakeOkeechobee while the other transects (T2, T3, and T4)were taken progressively southward into EAA. Theaverage distance between the sampling locations was∼11 km. The first sampling location (T1) in Oceancanal was closest to the WPB canal and the fourthtransect (T4) was closest to the Hillsboro canal. Theaverage distance between transects in Ocean canal was∼2 km. In total, 36 intact sediment cores along withtwo blank cores (no sediment) were used for theincubation experiment.
Water Air Soil Pollut (2012) 223:2865–2879 2867
Another set of 36 sediment cores from same loca-tions was sampled earlier (Das et al. 2012). Sedimentswere analyzed for OM, pH, bulk density (Db), andtotal phosphorus (TP). Organic matter content wasdetermined using loss on ignition method, where 5 gof dry sediment sample was combusted at 550°C for4 h in a muffle furnace (Andersen 1974). Sediment pHwas determined by weighing 10 g of sediment andadding DI water to it in a 1:2 (mass/volume) ratio(Thomas 1996). Bulk density for each layer was cal-culated by dividing the dry weight of the sedimentsample by the volume of the sampling corer. The dryweight of the sediment was calculated by measuringthe gravimetric water content of 10 g of sediment at105°C for 24 h. The residue ash following loss onignition for all sediments was dissolved in 6M HCland analyzed for TP using the ascorbic acid method(US EPA 1983, Method 365.4).
Phosphorus sequential extraction on sediments wasperformed according to the method of Chang andJackson (1957) modified for wetland soils (Quallsand Richardson 1995; Reddy et al. 1998, 2007). Ox-alate extractable Fe (Feox) and Al (Alox) were extractedusing 0.2M ammonium oxalate and 0.2M oxalic acid atpH 3.0 in darkness after pre-treating the samples toremove calcium carbonate (CaCO3) (Loeppert andInskeep 1996; McKeague and Day 1966) and theextracts analyzed using an inductively coupled plasma
spectrophotometer. Extractable Ca and Mg were deter-mined by 0.5 mol L−1 acetic acid extracting solution(Sanchez 1990) and analyzed using an atomic absorptionspectrophotometer (Varian Inc., Palo Alto, CA, USA).
2.2 Sediment Core Incubation
After the cores were collected, canal water from thesediment cores was siphoned off and the cores wererefilled with stock water collected from the Arthur R.Marshall Loxahatchee Wildlife Refuge (Refuge). A20-cm (Malecki et al. 2004) water column was main-tained above the sediment layer in the cores which wasaccomplished by adding ∼275 mL of the stock water.The water columns in the cores were maintained underaerobic conditions by bubbling air using aquariumpumps via tubing inserted into the water columns.Water was sampled from each core using a syringefitted with tubing. The floodwater dissolved O2 con-centration was maintained between 5 and 8 mg L−1 bybubbling air through the upper portion of the watercolumn. Bubbling air through the water column en-sured aerobic conditions in the water column (Gale etal. 1994). The interior of the incubation box was linedwith black polythene to exclude light and prevent algalgrowth. The sediment cores were incubated in a waterbath to maintain a constant temperature (21±2°C).
LakeOkeechobee
09A
00A
06AB
N
Ocean Canal
T1
T2
T3
T4
T1 T2 T3 T4
T1
T2
T3
T4
10km
Fig. 1 Study site showingthe sediment sampling loca-tions along Miami, WestPalm Beach, and Ocean ca-nal. T1 is the closest to thepump station while T4 wasthe furthest away
2868 Water Air Soil Pollut (2012) 223:2865–2879
Three floodwater exchanges were performed at aninterval of 28 days each. The stock water SRP con-centration used during the three exchanges was 0.008,0.004, and 0.007 mg L−1, respectively. Duringexchanges, water from the sediment cores was suc-tioned with minimum disturbance to the sedimentcolumn. The cores were then refilled with ∼275 mLof stock water and incubated for another 28 days.Throughout individual exchanges, water samples werecollected at time 0, 1, 2, 4, 7, 14, 21, and 28 days,respectively. Prior to sampling, the aerator was turnedoff to minimize disturbance. Dissolved oxygen (DO)and pH of the water column from each core were mea-sured before sampling. A 20-mL sample was pipettedfrom the water column, filtered through a 0.45-μm filter,and analyzed for SRP using ascorbic acid colorimetricmethod (US EPA 1983, Method 365.1).
2.3 P-Flux Estimation
Phosphorus flux from sediment to the water columnwas estimated by plotting cumulative SRP release/retention (Malecki et al. 2004) per unit surface areaof the sediment core over unit time (days). Sediment Pflux was calculated as linear change in P mass in theoverlying water after correction for sampling volumedivided by the internal area of the sediment cores. Fluxcalculations were based on the increase/decrease of theamount of P in the water column. The estimation of Preleased/retained was calculated by the product of thevolume of the water column multiplied by the differ-ence in concentrations of the water column as shownbelow (Steinman et al. 2004), while the P flux wascalculated as SRP released/retained per unit surfacearea per unit time:
J ¼X ðCt � Ct�1Þ � Vt þ ðCt � CsÞ � Vs
A� tð1Þ
where
J phosphorus flux (mg m−2 day−1)Ct final SRP concentration (mg L−1)
of the overlying waterCt−1 initial SRP concentration (mg L−1)
of the overlying waterVt total volume (mL) of the water
column overlying the sedimentCs SRP concentration (mg L−1) of the
water replaced for sampling
Vs volume of water taken for sampling (mL)A cross-sectional area of the sediment core (m2)t duration of study (days)
2.4 Estimation of EPCw Using Sediment CoreIncubation
Five different floodwater exchanges consisting of 7days each were performed with P spikes of 0.007,0.05, 0.13, 0.27, and 0.35 mg L−1, respectively. Watercollected from the Refuge with a P concentration of0.007 mg L−1 was used for the first exchange. The restof the spikes were prepared by adding appropriate Pstandard solution (KH2PO4) to water collected fromthe Refuge. Similar to the earlier sediment core incu-bation experiment used to estimate P flux, a 20-cmwater column was maintained above the sedimentlayer in the cores which was accomplished by adding∼275 mL of the desired spiked water. Duringexchanges, water from the sediment cores were suc-tioned with minimum disturbance to the sedimentcolumn. The cores were then refilled with ∼275mLof the next higher spike concentration and incubatedfor another 7 days. For each exchange, samples werecollected at time 0-, 2-, 4-, and 7-day intervals. Prior tosampling, the aerator was turned off to minimize dis-turbance. A 20-mL sample was pipetted from thewater column, filtered (0.45 μm), and analyzed forSRP. Sediment P release was calculated using Eq.(1). The EPCw values were determined as the intersec-tion of P release (y-axis) with initial spike P concen-tration (x-axis). The equation of the straight line wasequated to zero and solved for the value of x, or the Pconcentration (Reddy et al. 1999; Leeds 2006).
Determination of the relationship between P releaseand soil physicochemical properties, P fractions andFeox, Alox, Ca, and Mg were performed using SASstatistical program (proc CORR) (SAS Institute 2003).
3 Results and Discussion
3.1 Phosphorus Release from Canal Sediments
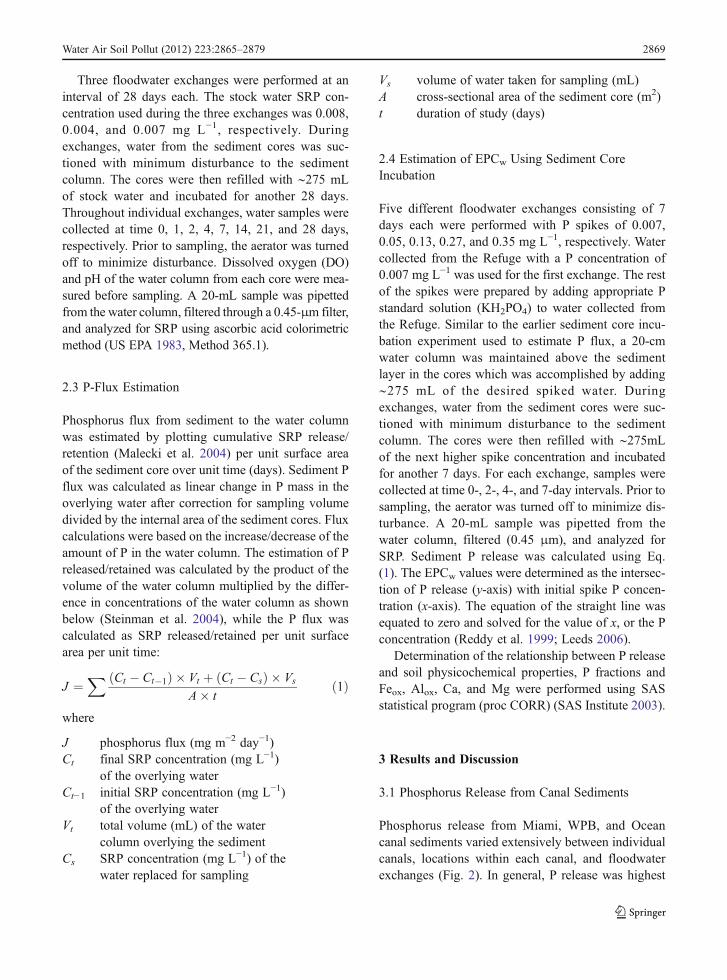
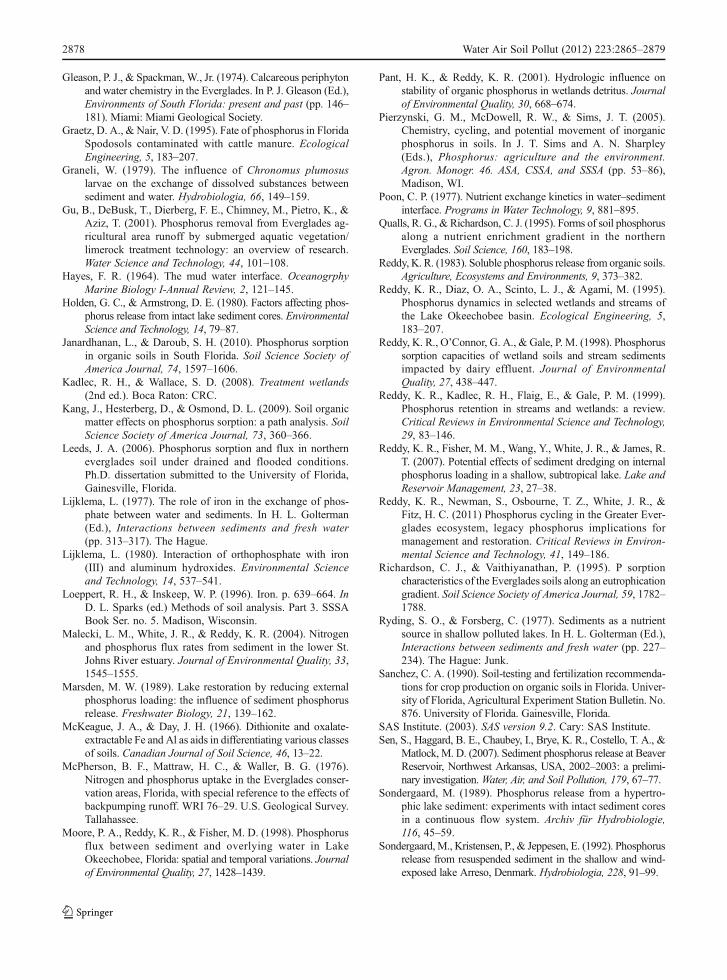
Phosphorus release from Miami, WPB, and Oceancanal sediments varied extensively between individualcanals, locations within each canal, and floodwaterexchanges (Fig. 2). In general, P release was highest
Water Air Soil Pollut (2012) 223:2865–2879 2869
from Miami canal sediments compared to the other twocanals, although there were differences between trans-ects. During exchange 1, sediments from Miami canalT1 and T4 showed lower cumulative P release rates of31.9 and 37.0mgm−2, respectively, than T2 and T3with107.5 and 86.9 mg m−2 released, respectively. The S8sub-basin of the EAA (in which the Miami canal islocated) had a TP load of 16.3 mt year−1 in 2008(DBhydro database—http://www.sfwmd.gov/dbhydroplsql). Multiplying measured cumulative P releasein this study by the area of the Miami canal gives a totalP release ranging from 0.4 to 1.2 mt year−1. Phosphorus
release from Miami canal was estimated to contribute2% to 7% of the total P load of the S8 basin.
Phosphorus release from WPB canal sediments waslower than that of Miami canal at all locations andexchanges. Within the WPB canal, T4 had the leastcumulative P release values for all the three exchanges.During exchange 1, cumulative P release from T1, T2,and T3 were 31.2, 28.1, and 26.5 mg m−2, respectively.Similar toMiami canal, during consecutive exchanges Prelease values decreased at all locations at WPB canal.The WPB canal is situated in the S5A basin whichhas an annual P load of 50.0 mt year−1 in 2008
0
5
10
15
20
25
30
35
40
45
0 1 2 4 7 14 21 28 0 1 2 4 7 14 21 28 0 1 2 4 7 14 21 28
0
20
40
60
80
100
120
0 1 2 4 7 14 21 28 0 1 2 4 7 14 21 28 0 1 2 4 7 14 21 28
T1 T2 T3 T4
0
5
10
15
20
25
30
35
40
45
0 1 2 4 7 14 21 28 0 1 2 4 7 14 21 28 0 1 2 4 7 14 21 28
P r
elea
se (
mg
m-2
)
Time (days)
Miami
WPB
Ocean
1st floodwater exchange (0-28 d) 2nd
floodwater exchange (29-56 d) 3rd floodwater exchange (57-84 d)
Fig. 2 Cumulative phosphorus release (mg m−2) from Miami,WPB, and Ocean canal sediments from four locations within thecanals. Three floodwater exchanges of 0.008, 0.004, and 0.007
mg L−1, and water analyzed at 0, 1, 2, 4, 7, 14, 21, and 28 days,respectively. Error bars represent standard deviation
2870 Water Air Soil Pollut (2012) 223:2865–2879
(DBhydro database—http://www.sfwmd.gov/dbhydroplsql). Multiplying cumulative P release by WPBcanal area gives a P release ranging from 0.17 to 0.76mt year−1, contributing approximately 0.3% to 1.5% ofthe total P load for the entire S5A sub-basin.
Ocean canal sediment P release values were lowerthan Miami canal sediments for all floodwaterexchanges, but were comparable to P release values ofWPB canal sediments. Within Ocean canal, the highestcumulative P release was observed at T2 that decreasedin subsequent exchanges from 43.1 to 25.1, and 9.3 mgm−2 during exchanges 1, 2, and 3. Similar to Miamicanal and WPB canal sediments, cumulative P releasedecreased at all locations during exchanges 2 and 3. TheOcean canal is also located in the S5A basin with a Pload of 50.0 mt year−1 in 2008. Multiplying cumulativeP release by Ocean canal area gives a total estimated Prelease ranging from 0.17 to 0.36 mt year−1. Combined,
WPB and Ocean canals have an estimated P releaseranging from 0.40 to 1.1 mt year−1 and comprise about0.7% to 2% of the total P load of the S5A basin.
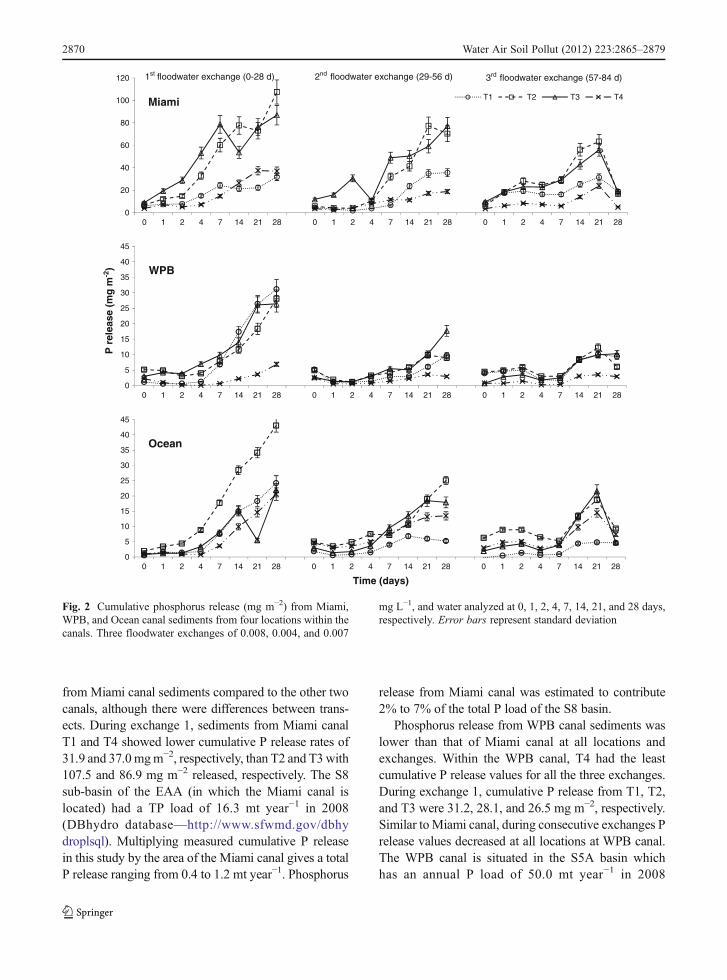
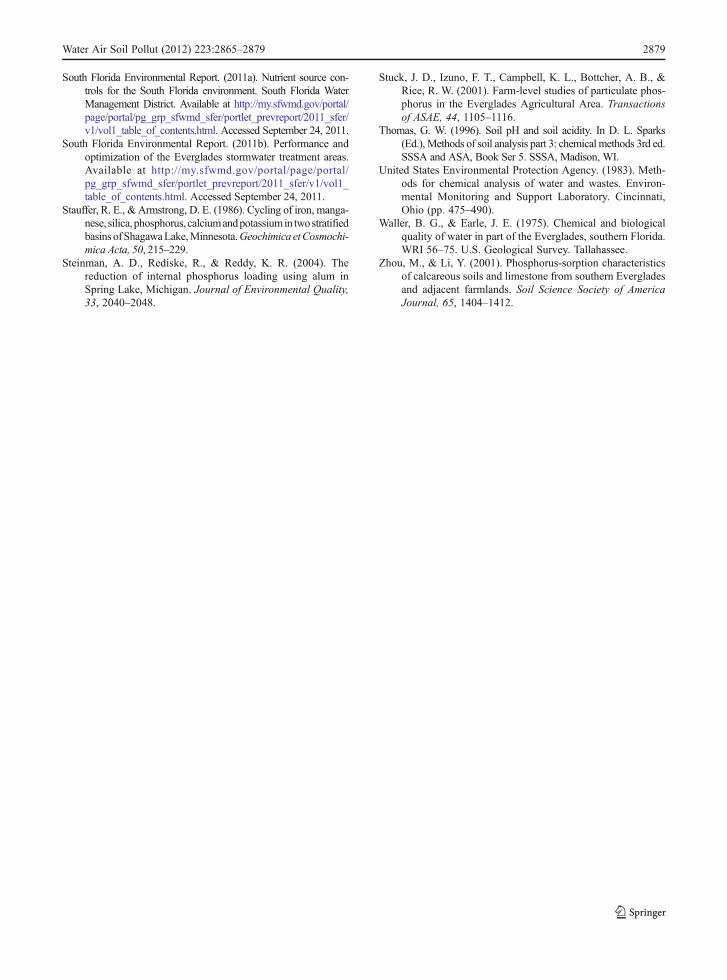
3.2 Phosphorus Flux
Phosphorus flux from the sediments was typicallyhighest during exchange 1 (first 28-day floodwaterexchange) (Fig. 3). During exchange 1, Miami canalsediments showed the highest P flux (2.4±1.3 mg m−2
day−1) compared to WPB (0.83±0.39 mg m−2 day−1)and Ocean canal sediments (0.98±0.38 mg m−2
day−1). This trend was observed during the secondand third floodwater exchanges. The average P fluxfrom Miami canal sediments during the second flood-water exchange was 1.8±1.0 mg m−2 day−1, comparedto WPB (0.35±0.22 mg m−2 day−1) and Ocean canalsediments (0.55±0.3 mg m−2 day−1). Lower flux rates
0.0
1.0
2.0
3.0
4.0
5.0
T1 T2 T3 T4
Exchange 1 Exchange 2 Exchange 3
Miami canal
0.0
1.0
2.0
T1 T2 T3 T4
WPB canal
0.0
1.0
2.0
T1 T2 T3 T4
Ocean canal
P f
lux
(mg
m-2
d-1
)
Fig. 3 Phosphorus fluxes(mg m−2 d−1) estimated forthree 28-day floodwaterexchanges based on thesediment core incubationexperiment for Miami,WPB, and Ocean canalsediments at four differentlocations. Error bars indi-cate the standard deviationof P flux based on the trip-licate sediment cores col-lected from individuallocations
Water Air Soil Pollut (2012) 223:2865–2879 2871
were observed during exchange 3. The fluxes reportedhere are up to an order of magnitude lower than thoseestimated from the peat soils within the EvergladesWCA-2A (1.5 to 6.5 mg m−2 day−1) (Fisher andReddy 2001), but are consistent with those from with-in the sandy zones from within Lake Okeechobee (0.1to 0.5 mg m−2 day−1) (Moore at al. 1998). This is notunusual since large volumes of Lake sediments gettransported to the main canals during instances whenwater from Lake Okeechobee is drained via the canals.It should be noted that there are variations in Miamicanal sediments with T2 and T3 exhibiting higher fluxrates during exchanges 1 and 2. While the accretion ofP-rich material at the sediment–water interface couldincrease the diffusive flux from the sediment to thewater column, an increase in surface water concentra-tions from agriculture runoff inputs could potentiallyreduce diffusive flux from shallow sediments to thewater column, as the P concentration gradient betweenthe two also reduces (Bhadha et al. 2010b). This typeof quasi-equilibrium between the water column P andsediment P content is a common phenomenon in loticsystems such as streams and canals. Malecki et al.(2004) and Sen et al. (2007) showed that the flux ofsoluble P from sediments under anaerobic conditionswas significantly greater than under aerobic condi-tions. During this study, the sediments were monitoredonly under aerobic conditions; however, the canalsediments frequently experience both aerobic and an-aerobic conditions depending on the time of year.Also, fluxes associated to advective modes such asmixing and bioturbation are not incorporated in corestudy experiment such as this one. This would implythat the P fluxes reported here provide a conservativeestimate compared to the overall potential P flux fromthe Miami, WPB, and Ocean canal sediments.
Total P stored in the canal sediments up to a depth of10cm was determined by multiplying TP content by Db
and canal area estimated using Google map, 2010 (Daset al. 2012). Average TP stored in Miami, WPB, andOcean canal sediments up to 10 cm were 34 (±12), 26(±3), and 13 (±5) mt, respectively. Total P was dividedinto non-reactive P (residue P fraction) and reactive P(KCL, NaOH, and HCl fractions) (Reddy et al. 2011).Less than 22% of the TP was contained in the residue-Pfraction, a recalcitrant form of P but susceptible tomicrobial breakdown over time. Reactive P comprised78% of TP and is potentially available for release atdifferent time scales. Phosphorus storage values
indicated that appreciable quantities of P are stored inEAA canals that could function as a P source to thesystem. A comparison of EAA canal internal P load tothe overall P loads from the EAA of 169 mt year−1 inwater year 2010 (SFER 2011a) indicate that internal Pload from the three main canals is a very small portion ofthe entire P load from EAA. Internal P load calculatedhere simulates no flow conditions as in the Evergladesand takes into account diffusive P flux only under aer-obic conditions. In reality, P flux from EAA canals maybemuch higher than the calculated value due to seasonalanaerobic conditions, sediment transport, and resuspen-sion. Water flow in EAA canals can undergo rapidfluctuations from stagnant conditions to high velocitythat can cause resuspension and sediment transport.Sediment resuspension has been reported to cause about20 to 30 times greater P release than undisturbed sedi-ments (Sondergaard et al. 1992). Particularly, it wasobserved that bioturbation and resuspension causedhigher P flux in calcareous lake sediments comparedto non-calcareous lake sediments (Graneli 1979).
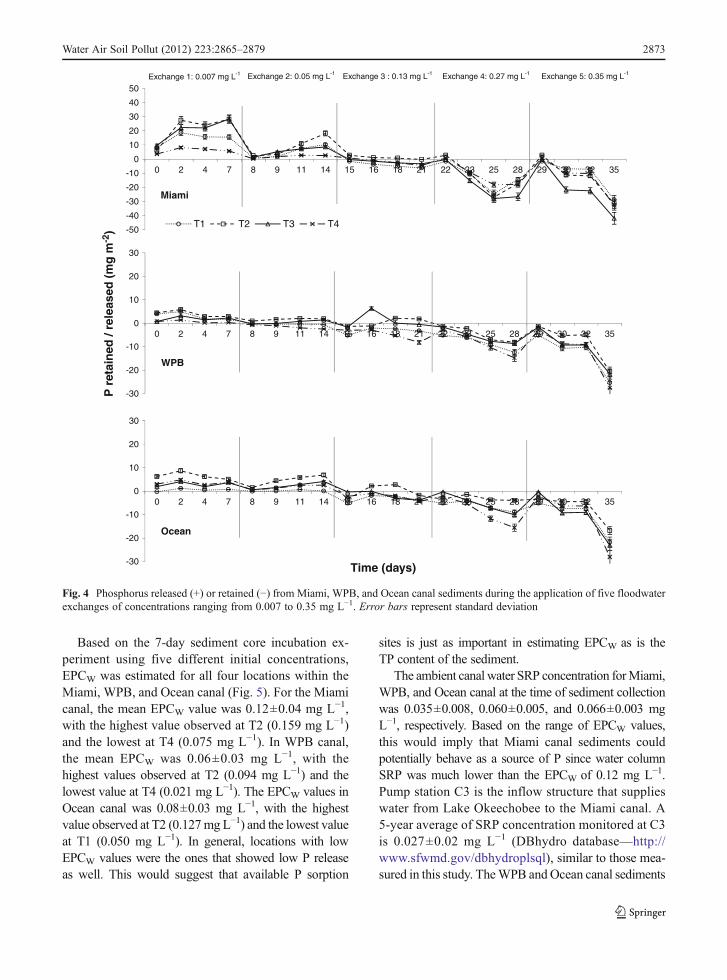
3.3 Equilibrium Phosphorus Concentration (EPCW)
Phosphorus release/retention during exchanges 1 to5 from the four transects of each canal to determineEPC is presented in Fig. 4. Each exchange repre-sents a different initial P spike concentration (0.007,0.05, 0.13, 0.27, and 0.35 mg L−1). Phosphorusrelease from Miami canal sediments shows that sedi-ments released P during exchanges 1 and 2 andretained P during exchanges 4 and 5 (Fig. 4). Phos-phorus release from WPB canal sediments shows alltransects released P during exchange 1. During ex-change 2, at P spike concentration of 0.05 mg L−1,T1 and T4 began retaining P while T2 and T3 sedi-ments were still releasing P. During exchange 3 at Pspike concentration of 0.13 mg L−1, T2 and T3began retaining P while at exchange 4 and 5 alltransects retained P.
Ocean canal sediments show all locations releasedP during exchange 1 with P spike concentration of0.007 mg L-1. During exchange 2, with P spike con-centration of 0.05 mg L−1, T2–T4 were releasing Pwhile the P release curve for T1 intersects the hori-zontal axis which indicates equilibrium concentration.During exchange 3, with P spike concentration 0.12mg L−1, all transects retained P except T2 whichbriefly released P before finally starting to retain it.
2872 Water Air Soil Pollut (2012) 223:2865–2879
Based on the 7-day sediment core incubation ex-periment using five different initial concentrations,EPCW was estimated for all four locations within theMiami, WPB, and Ocean canal (Fig. 5). For the Miamicanal, the mean EPCW value was 0.12±0.04 mg L−1,with the highest value observed at T2 (0.159 mg L−1)and the lowest at T4 (0.075 mg L−1). In WPB canal,the mean EPCW was 0.06±0.03 mg L−1, with thehighest values observed at T2 (0.094 mg L−1) and thelowest value at T4 (0.021 mg L−1). The EPCW values inOcean canal was 0.08±0.03 mg L−1, with the highestvalue observed at T2 (0.127mg L−1) and the lowest valueat T1 (0.050 mg L−1). In general, locations with lowEPCW values were the ones that showed low P releaseas well. This would suggest that available P sorption
sites is just as important in estimating EPCW as is theTP content of the sediment.
The ambient canal water SRP concentration forMiami,WPB, and Ocean canal at the time of sediment collectionwas 0.035±0.008, 0.060±0.005, and 0.066±0.003 mgL−1, respectively. Based on the range of EPCW values,this would imply that Miami canal sediments couldpotentially behave as a source of P since water columnSRP was much lower than the EPCW of 0.12 mg L−1.Pump station C3 is the inflow structure that supplieswater from Lake Okeechobee to the Miami canal. A5-year average of SRP concentration monitored at C3is 0.027±0.02 mg L−1 (DBhydro database—http://www.sfwmd.gov/dbhydroplsql), similar to those mea-sured in this study. TheWPB andOcean canal sediments
-50
-40
-30
-20
-10
0
10
20
30
40
50
0 2 4 7 8 9 11 14 15 16 18 21 22 23 25 28 29 30 32 35
T1 T2 T3 T4
-30
-20
-10
0
10
20
30
0 2 4 7 8 9 11 14 15 16 18 21 22 23 25 28 29 30 32 35
-30
-20
-10
0
10
20
30
0 2 4 7 8 9 11 14 15 16 18 21 22 23 25 28 29 30 32 35
Miami
WPB
Ocean
Exchange 1: 0.007 mg L-1 Exchange 2: 0.05 mg L-1 Exchange 3 : 0.13 mg L-1 Exchange 4: 0.27 mg L-1 Exchange 5: 0.35 mg L-1
Time (days)
P r
etai
ned
/ re
leas
ed (
mg
m-2
)
Fig. 4 Phosphorus released (+) or retained (−) from Miami, WPB, and Ocean canal sediments during the application of five floodwaterexchanges of concentrations ranging from 0.007 to 0.35 mg L−1. Error bars represent standard deviation
Water Air Soil Pollut (2012) 223:2865–2879 2873
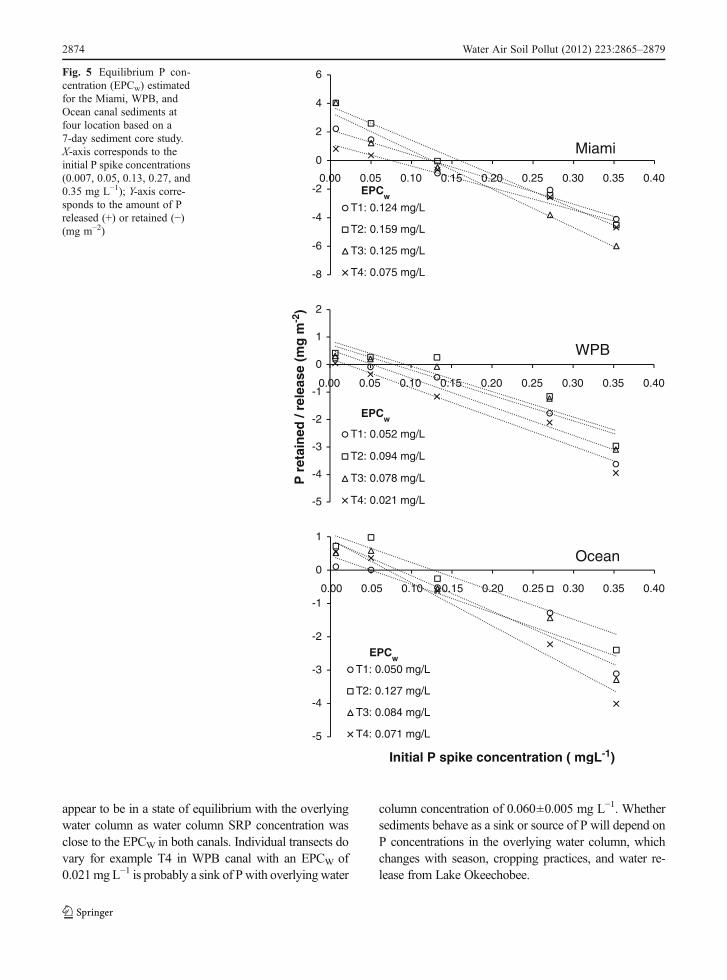
appear to be in a state of equilibrium with the overlyingwater column as water column SRP concentration wasclose to the EPCW in both canals. Individual transects dovary for example T4 in WPB canal with an EPCW of0.021mg L−1 is probably a sink of Pwith overlying water
column concentration of 0.060±0.005 mg L−1. Whethersediments behave as a sink or source of P will depend onP concentrations in the overlying water column, whichchanges with season, cropping practices, and water re-lease from Lake Okeechobee.
-8
-6
-4
-2
0
2
4
6
0.00 0.05 0.10 0.15 0.20 0.25 0.30 0.35 0.40
T1: 0.124 mg/L
T2: 0.159 mg/L
T3: 0.125 mg/L
T4: 0.075 mg/L
-5
-4
-3
-2
-1
0
1
0.00 0.05 0.10 0.15 0.20 0.25 0.30 0.35 0.40
T1: 0.050 mg/L
T2: 0.127 mg/L
T3: 0.084 mg/L
T4: 0.071 mg/L
-5
-4
-3
-2
-1
0
1
2
0.00 0.05 0.10 0.15 0.20 0.25 0.30 0.35 0.40
T1: 0.052 mg/L
T2: 0.094 mg/L
T3: 0.078 mg/L
T4: 0.021 mg/L
Miami
WPB
Ocean
EPCw
EPCw
EPCw
P r
etai
ned
/ re
leas
e (m
g m
-2)
Initial P spike concentration ( mgL-1)
Fig. 5 Equilibrium P con-centration (EPCw) estimatedfor the Miami, WPB, andOcean canal sediments atfour location based on a7-day sediment core study.X-axis corresponds to theinitial P spike concentrations(0.007, 0.05, 0.13, 0.27, and0.35 mg L−1); Y-axis corre-sponds to the amount of Preleased (+) or retained (−)(mg m−2)
2874 Water Air Soil Pollut (2012) 223:2865–2879
3.4 Sediment Physico-Chemical Propertiesand P Release
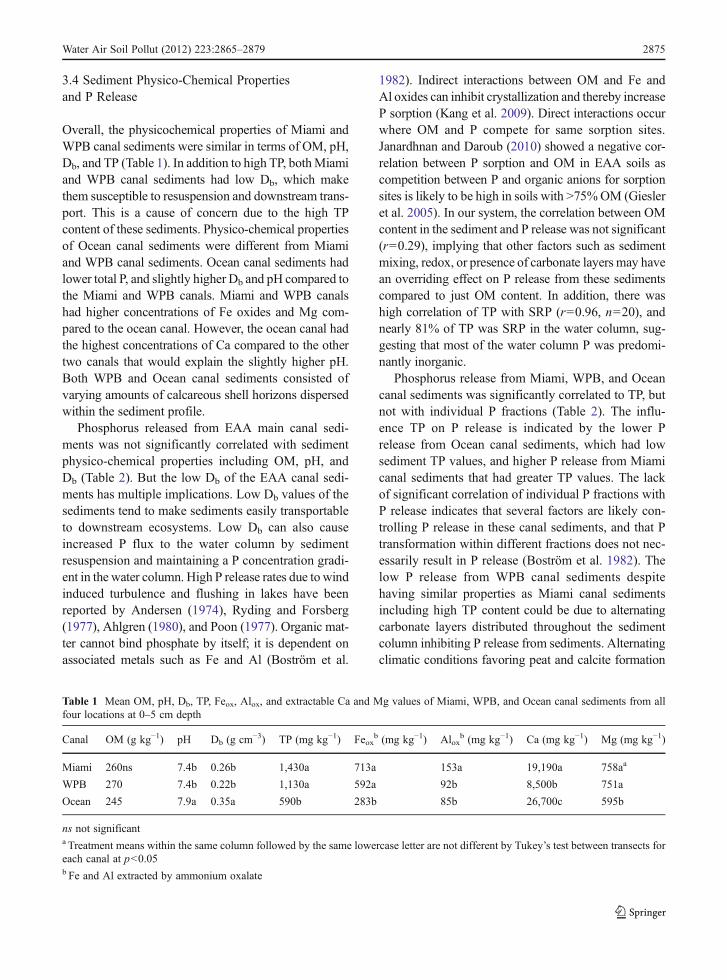
Overall, the physicochemical properties of Miami andWPB canal sediments were similar in terms of OM, pH,Db, and TP (Table 1). In addition to high TP, bothMiamiand WPB canal sediments had low Db, which makethem susceptible to resuspension and downstream trans-port. This is a cause of concern due to the high TPcontent of these sediments. Physico-chemical propertiesof Ocean canal sediments were different from Miamiand WPB canal sediments. Ocean canal sediments hadlower total P, and slightly higher Db and pH compared tothe Miami and WPB canals. Miami and WPB canalshad higher concentrations of Fe oxides and Mg com-pared to the ocean canal. However, the ocean canal hadthe highest concentrations of Ca compared to the othertwo canals that would explain the slightly higher pH.Both WPB and Ocean canal sediments consisted ofvarying amounts of calcareous shell horizons dispersedwithin the sediment profile.
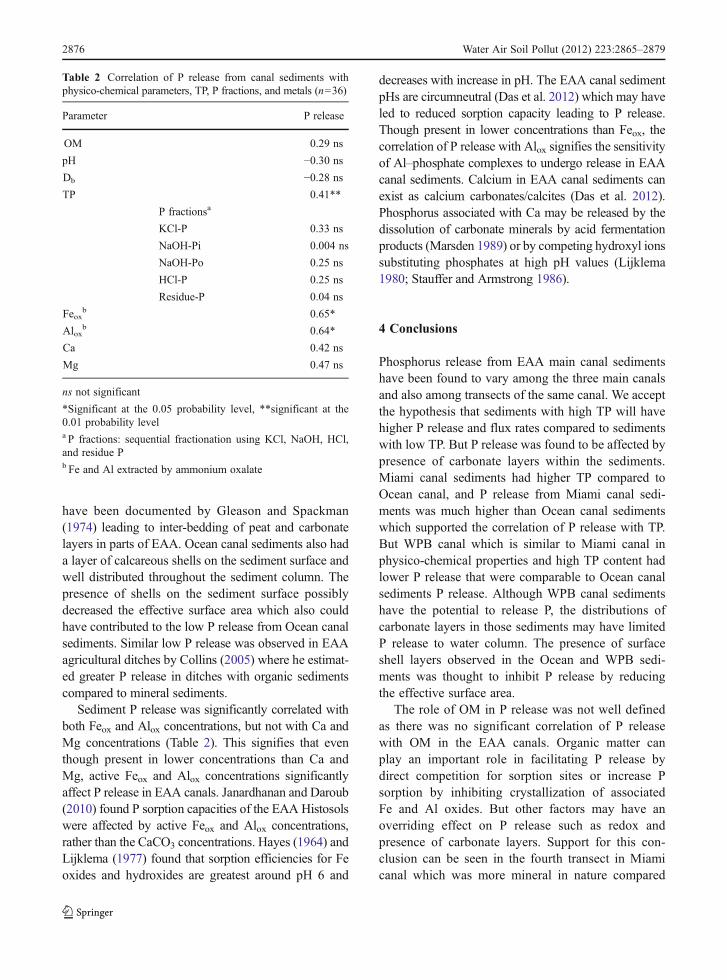
Phosphorus released from EAA main canal sedi-ments was not significantly correlated with sedimentphysico-chemical properties including OM, pH, andDb (Table 2). But the low Db of the EAA canal sedi-ments has multiple implications. Low Db values of thesediments tend to make sediments easily transportableto downstream ecosystems. Low Db can also causeincreased P flux to the water column by sedimentresuspension and maintaining a P concentration gradi-ent in the water column. High P release rates due to windinduced turbulence and flushing in lakes have beenreported by Andersen (1974), Ryding and Forsberg(1977), Ahlgren (1980), and Poon (1977). Organic mat-ter cannot bind phosphate by itself; it is dependent onassociated metals such as Fe and Al (Boström et al.
1982). Indirect interactions between OM and Fe andAl oxides can inhibit crystallization and thereby increaseP sorption (Kang et al. 2009). Direct interactions occurwhere OM and P compete for same sorption sites.Janardhnan and Daroub (2010) showed a negative cor-relation between P sorption and OM in EAA soils ascompetition between P and organic anions for sorptionsites is likely to be high in soils with >75%OM (Giesleret al. 2005). In our system, the correlation between OMcontent in the sediment and P release was not significant(r00.29), implying that other factors such as sedimentmixing, redox, or presence of carbonate layers may havean overriding effect on P release from these sedimentscompared to just OM content. In addition, there washigh correlation of TP with SRP (r00.96, n020), andnearly 81% of TP was SRP in the water column, sug-gesting that most of the water column P was predomi-nantly inorganic.
Phosphorus release from Miami, WPB, and Oceancanal sediments was significantly correlated to TP, butnot with individual P fractions (Table 2). The influ-ence TP on P release is indicated by the lower Prelease from Ocean canal sediments, which had lowsediment TP values, and higher P release from Miamicanal sediments that had greater TP values. The lackof significant correlation of individual P fractions withP release indicates that several factors are likely con-trolling P release in these canal sediments, and that Ptransformation within different fractions does not nec-essarily result in P release (Boström et al. 1982). Thelow P release from WPB canal sediments despitehaving similar properties as Miami canal sedimentsincluding high TP content could be due to alternatingcarbonate layers distributed throughout the sedimentcolumn inhibiting P release from sediments. Alternatingclimatic conditions favoring peat and calcite formation
Table 1 Mean OM, pH, Db, TP, Feox, Alox, and extractable Ca and Mg values of Miami, WPB, and Ocean canal sediments from allfour locations at 0–5 cm depth
Canal OM (g kg−1) pH Db (g cm−3) TP (mg kg−1) Feoxb (mg kg−1) Alox
b (mg kg−1) Ca (mg kg−1) Mg (mg kg−1)
Miami 260ns 7.4b 0.26b 1,430a 713a 153a 19,190a 758aa
WPB 270 7.4b 0.22b 1,130a 592a 92b 8,500b 751a
Ocean 245 7.9a 0.35a 590b 283b 85b 26,700c 595b
ns not significanta Treatment means within the same column followed by the same lowercase letter are not different by Tukey’s test between transects foreach canal at p<0.05b Fe and Al extracted by ammonium oxalate
Water Air Soil Pollut (2012) 223:2865–2879 2875
have been documented by Gleason and Spackman(1974) leading to inter-bedding of peat and carbonatelayers in parts of EAA. Ocean canal sediments also hada layer of calcareous shells on the sediment surface andwell distributed throughout the sediment column. Thepresence of shells on the sediment surface possiblydecreased the effective surface area which also couldhave contributed to the low P release from Ocean canalsediments. Similar low P release was observed in EAAagricultural ditches by Collins (2005) where he estimat-ed greater P release in ditches with organic sedimentscompared to mineral sediments.
Sediment P release was significantly correlated withboth Feox and Alox concentrations, but not with Ca andMg concentrations (Table 2). This signifies that eventhough present in lower concentrations than Ca andMg, active Feox and Alox concentrations significantlyaffect P release in EAA canals. Janardhanan and Daroub(2010) found P sorption capacities of the EAA Histosolswere affected by active Feox and Alox concentrations,rather than the CaCO3 concentrations. Hayes (1964) andLijklema (1977) found that sorption efficiencies for Feoxides and hydroxides are greatest around pH 6 and
decreases with increase in pH. The EAA canal sedimentpHs are circumneutral (Das et al. 2012) which may haveled to reduced sorption capacity leading to P release.Though present in lower concentrations than Feox, thecorrelation of P release with Alox signifies the sensitivityof Al–phosphate complexes to undergo release in EAAcanal sediments. Calcium in EAA canal sediments canexist as calcium carbonates/calcites (Das et al. 2012).Phosphorus associated with Ca may be released by thedissolution of carbonate minerals by acid fermentationproducts (Marsden 1989) or by competing hydroxyl ionssubstituting phosphates at high pH values (Lijklema1980; Stauffer and Armstrong 1986).
4 Conclusions
Phosphorus release from EAA main canal sedimentshave been found to vary among the three main canalsand also among transects of the same canal. We acceptthe hypothesis that sediments with high TP will havehigher P release and flux rates compared to sedimentswith low TP. But P release was found to be affected bypresence of carbonate layers within the sediments.Miami canal sediments had higher TP compared toOcean canal, and P release from Miami canal sedi-ments was much higher than Ocean canal sedimentswhich supported the correlation of P release with TP.But WPB canal which is similar to Miami canal inphysico-chemical properties and high TP content hadlower P release that were comparable to Ocean canalsediments P release. Although WPB canal sedimentshave the potential to release P, the distributions ofcarbonate layers in those sediments may have limitedP release to water column. The presence of surfaceshell layers observed in the Ocean and WPB sedi-ments was thought to inhibit P release by reducingthe effective surface area.
The role of OM in P release was not well definedas there was no significant correlation of P releasewith OM in the EAA canals. Organic matter canplay an important role in facilitating P release bydirect competition for sorption sites or increase Psorption by inhibiting crystallization of associatedFe and Al oxides. But other factors may have anoverriding effect on P release such as redox andpresence of carbonate layers. Support for this con-clusion can be seen in the fourth transect in Miamicanal which was more mineral in nature compared
Table 2 Correlation of P release from canal sediments withphysico-chemical parameters, TP, P fractions, and metals (n036)
Parameter P release
OM 0.29 ns
pH −0.30 ns
Db −0.28 ns
TP 0.41**
P fractionsa
KCl-P 0.33 ns
NaOH-Pi 0.004 ns
NaOH-Po 0.25 ns
HCl-P 0.25 ns
Residue-P 0.04 ns
Feoxb 0.65*
Aloxb 0.64*
Ca 0.42 ns
Mg 0.47 ns
ns not significant
*Significant at the 0.05 probability level, **significant at the0.01 probability levela P fractions: sequential fractionation using KCl, NaOH, HCl,and residue Pb Fe and Al extracted by ammonium oxalate
2876 Water Air Soil Pollut (2012) 223:2865–2879
to the other three transects (only 7.2% OM com-pared to 26% average) and had lower P releasesimilar to Ocean canal sediments with high OMcontent. Therefore, organic-rich, high TP sedimentsin EAA canals which are expected to have high Prelease can in fact behave in the opposite way ifsediment bed is not in contact with the water col-umn due to presence of a shell horizon.
Phosphorus release over the 84-day incubation pe-riod from Miami canal is estimated to potentiallycontribute 2–7% of the TP load from Miami canalbasin (S8), while WPB and Ocean canals combinedare estimated to contribute approximately 0.7–2%of the TP load in the WPB–Ocean (S5A) sub-basin,respectively. This in situ flux from these canal sedi-ments comprised a small percentage of the total P loadexiting the EAA basin every year. These estimates,however, only take into consideration diffusive fluxesfrom the sediments under aerobic conditions. Inactuality within canals, factors such as canal flow,bioturbation, resuspension, anaerobic conditions, andcontinuous addition of P can increase the magnitude aswell as prolong the time of the P release.
The EPCW of the sediments showed under the con-ditions during sampling time, the Miami canal is apotential source for P while the Ocean and WPCcanals are closer to a state of equilibrium neitherreleasing or assimilating P. The EPCW of individualtransects was variable though. Whether these sedi-ments act as a sink or source of P depends on watercolumn P concentrations that can vary tremendouslywith season and other factors.
We conclude that the canal sediments sampled havethe potential of P release, and under the prevalentwater column P concentrations are either releasing Pto the water column or in a state of equilibrium.Further studies should focus on the flux rates underanaerobic conditions as well as the potential transportof sediment into very sensitive ecosystems. Watercolumn P concentrations in WCA can be much lowerthan EAA canals and these same sediments thenwould be a source of P to the water column. It is alsonoteworthy to further investigate the chemical charac-teristics of organic matter and relationship to P release.
Acknowledgments Funding for this project was provided bythe Everglades Agricultural Area—Environmental ProtectionDistrict and the Florida Agriculture Experiment Station. Wewish to thank Ms. Viviana Nadal and Ms. Irina Ognevich fortheir assistance and support with field and laboratory work.
References
Ahlgren, I. (1980). A dilution model applied to a system ofshallow eutrophic lakes after diversion of sewage effluents.Archiv für Hydrobiologie, 89, 17–32.
Andersen, J. M. (1974). An ignition method for determination ofphosphorus in lake sediments.Water Research, 10, 329–331.
Bhadha, J. H., Harris, W. G., & Jawitz, J. W. (2010). Soilphosphorus release and storage capacity from an impactedsubtropical wetland. Soil Science Society of America Journal,74, 1816–1825.
Bhadha, J. H., Jawitz, J. W., &Min, J.-H. (2010). Phosphorus massbalance and internal load in an impacted subtropical isolatedwetland. Water Air Soil Pollution Journal, 218, 619–632.
Boström, B., Jansson, M., & Fersberg, C. (1982). Phosphorusrelease from lake sediments. Archiv für Hydrobiologie -Beiheft, 18, 5–9.
Brezonik, P. L., Blacher, E. C., Crisman, T. L., Hilty, C. L.,Kratzer, C. R., Leslie, M. K., et al. (1979). Factors affectingprimary production in Lake Okeechobee, Florida. Report No.07-79-1 submitted to the Florida Sugar Cane League. De-partment of Environmental Engineering Sciences. Universityof Florida, Gainesville.
Chang, S. C., & Jackson, M. L. (1957). Fractionation of soilphosphorous. Soil Science, 84, 133–144.
Collins, S. D. (2005). Utilizing in-situ benthic mesocosms toquantify phosphorus and nitrogen fluxes in South Floridaagricultural canals. Ph.D. dissertation, University of Florida,Gainesville, Florida.
Daroub, S. H., Stuck, J. D., Lang, T. A., & Diaz, O. A. (2002).Particulate phosphorus transport in the Everglades Agricul-tural Area II: transport mechanisms. UF/IFAS ExtensionPublication (EDIS): SL 198.
Daroub, S. H., Van Horn, S., Lang, T. A., & Diaz, O. A. (2011).Best management practices and long-term water qualitytrends in the Everglades Agricultural Area. Critical Reviewsin Environmental Science and Technology, 41, 608–632.
Das, J., Daroub, S. H., Bhadha, J. H., Lang, T. A., Diaz, O., &Harris, W. (2012). Physicochemical assessment and phospho-rus storage of canal sediments within the Everglades Agricul-tural Area, Florida. Journal of Soils and Sediments. (In Press).
Davis, S. (1982). Patterns of radiophosphorus accumulation inthe Everglades after its introduction into surface water.Technical Publication 82–2. West Palm Beach: SFWMD.
Fisher, M. M., & Reddy, K. R. (2001). Phosphorus flux fromwetland soils affected by long-term nutrient loading. Journalof Environmental Quality, 30, 261–271.
Fisher, M. M., Brenner, M., & Reddy, K. R. (1992). A simple,inexpensive piston corer for collecting undisturbed sedi-ment/water interface profiles. Journal of Paleolimnology,7, 157–161.
Gale, T. (1975). Systems models for understanding eutrophication inLakeOkeechobee.Master’s thesis. Department of Environmen-tal Engineering Science, University of Florida, Gainesville.
Gale, P. M., Reddy, K. R., & Graetz, D. A. (1994). Phosphorusretention by wetland soils used for treated wastewaterdisposal. Journal of Environmental Quality, 23, 370–377.
Giesler, R., Andersson, T., Lovgren, L., & Persson, P. (2005).Phosphate sorption in aluminum and iron rich humus soils.Soil Science Society of America Journal, 69, 77–86.
Water Air Soil Pollut (2012) 223:2865–2879 2877
Gleason, P. J., & Spackman, W., Jr. (1974). Calcareous periphytonand water chemistry in the Everglades. In P. J. Gleason (Ed.),Environments of South Florida: present and past (pp. 146–181). Miami: Miami Geological Society.
Graetz, D. A., & Nair, V. D. (1995). Fate of phosphorus in FloridaSpodosols contaminated with cattle manure. EcologicalEngineering, 5, 183–207.
Graneli, W. (1979). The influence of Chronomus plumosuslarvae on the exchange of dissolved substances betweensediment and water. Hydrobiologia, 66, 149–159.
Gu, B., DeBusk, T., Dierberg, F. E., Chimney, M., Pietro, K., &Aziz, T. (2001). Phosphorus removal from Everglades ag-ricultural area runoff by submerged aquatic vegetation/limerock treatment technology: an overview of research.Water Science and Technology, 44, 101–108.
Hayes, F. R. (1964). The mud water interface. OceanogrphyMarine Biology I-Annual Review, 2, 121–145.
Holden, G. C., & Armstrong, D. E. (1980). Factors affecting phos-phorus release from intact lake sediment cores. EnvironmentalScience and Technology, 14, 79–87.
Janardhanan, L., & Daroub, S. H. (2010). Phosphorus sorptionin organic soils in South Florida. Soil Science Society ofAmerica Journal, 74, 1597–1606.
Kadlec, R. H., & Wallace, S. D. (2008). Treatment wetlands(2nd ed.). Boca Raton: CRC.
Kang, J., Hesterberg, D., & Osmond, D. L. (2009). Soil organicmatter effects on phosphorus sorption: a path analysis. SoilScience Society of America Journal, 73, 360–366.
Leeds, J. A. (2006). Phosphorus sorption and flux in northerneverglades soil under drained and flooded conditions.Ph.D. dissertation submitted to the University of Florida,Gainesville, Florida.
Lijklema, L. (1977). The role of iron in the exchange of phos-phate between water and sediments. In H. L. Golterman(Ed.), Interactions between sediments and fresh water(pp. 313–317). The Hague.
Lijklema, L. (1980). Interaction of orthophosphate with iron(III) and aluminum hydroxides. Environmental Scienceand Technology, 14, 537–541.
Loeppert, R. H., & Inskeep, W. P. (1996). Iron. p. 639–664. InD. L. Sparks (ed.) Methods of soil analysis. Part 3. SSSABook Ser. no. 5. Madison, Wisconsin.
Malecki, L. M., White, J. R., & Reddy, K. R. (2004). Nitrogenand phosphorus flux rates from sediment in the lower St.Johns River estuary. Journal of Environmental Quality, 33,1545–1555.
Marsden, M. W. (1989). Lake restoration by reducing externalphosphorus loading: the influence of sediment phosphorusrelease. Freshwater Biology, 21, 139–162.
McKeague, J. A., & Day, J. H. (1966). Dithionite and oxalate-extractable Fe and Al as aids in differentiating various classesof soils. Canadian Journal of Soil Science, 46, 13–22.
McPherson, B. F., Mattraw, H. C., & Waller, B. G. (1976).Nitrogen and phosphorus uptake in the Everglades conser-vation areas, Florida, with special reference to the effects ofbackpumping runoff. WRI 76–29. U.S. Geological Survey.Tallahassee.
Moore, P. A., Reddy, K. R., & Fisher, M. D. (1998). Phosphorusflux between sediment and overlying water in LakeOkeechobee, Florida: spatial and temporal variations. Journalof Environmental Quality, 27, 1428–1439.
Pant, H. K., & Reddy, K. R. (2001). Hydrologic influence onstability of organic phosphorus in wetlands detritus. Journalof Environmental Quality, 30, 668–674.
Pierzynski, G. M., McDowell, R. W., & Sims, J. T. (2005).Chemistry, cycling, and potential movement of inorganicphosphorus in soils. In J. T. Sims and A. N. Sharpley(Eds.), Phosphorus: agriculture and the environment.Agron. Monogr. 46. ASA, CSSA, and SSSA (pp. 53–86),Madison, WI.
Poon, C. P. (1977). Nutrient exchange kinetics in water–sedimentinterface. Programs in Water Technology, 9, 881–895.
Qualls, R. G., & Richardson, C. J. (1995). Forms of soil phosphorusalong a nutrient enrichment gradient in the northernEverglades. Soil Science, 160, 183–198.
Reddy, K. R. (1983). Soluble phosphorus release from organic soils.Agriculture, Ecosystems and Environments, 9, 373–382.
Reddy, K. R., Diaz, O. A., Scinto, L. J., & Agami, M. (1995).Phosphorus dynamics in selected wetlands and streams ofthe Lake Okeechobee basin. Ecological Engineering, 5,183–207.
Reddy, K. R., O’Connor, G. A., & Gale, P. M. (1998). Phosphorussorption capacities of wetland soils and stream sedimentsimpacted by dairy effluent. Journal of EnvironmentalQuality, 27, 438–447.
Reddy, K. R., Kadlec, R. H., Flaig, E., & Gale, P. M. (1999).Phosphorus retention in streams and wetlands: a review.Critical Reviews in Environmental Science and Technology,29, 83–146.
Reddy, K. R., Fisher, M. M., Wang, Y., White, J. R., & James, R.T. (2007). Potential effects of sediment dredging on internalphosphorus loading in a shallow, subtropical lake. Lake andReservoir Management, 23, 27–38.
Reddy, K. R., Newman, S., Osbourne, T. Z., White, J. R., &Fitz, H. C. (2011) Phosphorus cycling in the Greater Ever-glades ecosystem, legacy phosphorus implications formanagement and restoration. Critical Reviews in Environ-mental Science and Technology, 41, 149–186.
Richardson, C. J., & Vaithiyanathan, P. (1995). P sorptioncharacteristics of the Everglades soils along an eutrophicationgradient. Soil Science Society of America Journal, 59, 1782–1788.
Ryding, S. O., & Forsberg, C. (1977). Sediments as a nutrientsource in shallow polluted lakes. In H. L. Golterman (Ed.),Interactions between sediments and fresh water (pp. 227–234). The Hague: Junk.
Sanchez, C. A. (1990). Soil-testing and fertilization recommenda-tions for crop production on organic soils in Florida. Univer-sity of Florida, Agricultural Experiment Station Bulletin. No.876. University of Florida. Gainesville, Florida.
SAS Institute. (2003). SAS version 9.2. Cary: SAS Institute.Sen, S., Haggard, B. E., Chaubey, I., Brye, K. R., Costello, T. A., &
Matlock, M. D. (2007). Sediment phosphorus release at BeaverReservoir, Northwest Arkansas, USA, 2002–2003: a prelimi-nary investigation.Water, Air, and Soil Pollution, 179, 67–77.
Sondergaard, M. (1989). Phosphorus release from a hypertro-phic lake sediment: experiments with intact sediment coresin a continuous flow system. Archiv für Hydrobiologie,116, 45–59.
Sondergaard, M., Kristensen, P., & Jeppesen, E. (1992). Phosphorusrelease from resuspended sediment in the shallow and wind-exposed lake Arreso, Denmark. Hydrobiologia, 228, 91–99.
2878 Water Air Soil Pollut (2012) 223:2865–2879
South Florida Environmental Report. (2011a). Nutrient source con-trols for the South Florida environment. South Florida WaterManagement District. Available at http://my.sfwmd.gov/portal/page/portal/pg_grp_sfwmd_sfer/portlet_prevreport/2011_sfer/v1/vol1_table_of_contents.html. Accessed September 24, 2011.
South Florida Environmental Report. (2011b). Performance andoptimization of the Everglades stormwater treatment areas.Available at http://my.sfwmd.gov/portal/page/portal/pg_grp_sfwmd_sfer/portlet_prevreport/2011_sfer/v1/vol1_table_of_contents.html. Accessed September 24, 2011.
Stauffer, R. E., & Armstrong, D. E. (1986). Cycling of iron, manga-nese, silica,phosphorus, calciumandpotassiumin twostratifiedbasins ofShagawaLake,Minnesota.Geochimica etCosmochi-mica Acta, 50, 215–229.
Steinman, A. D., Rediske, R., & Reddy, K. R. (2004). Thereduction of internal phosphorus loading using alum inSpring Lake, Michigan. Journal of Environmental Quality,33, 2040–2048.
Stuck, J. D., Izuno, F. T., Campbell, K. L., Bottcher, A. B., &Rice, R. W. (2001). Farm-level studies of particulate phos-phorus in the Everglades Agricultural Area. Transactionsof ASAE, 44, 1105–1116.
Thomas, G. W. (1996). Soil pH and soil acidity. In D. L. Sparks(Ed.), Methods of soil analysis part 3: chemical methods 3rd ed.SSSA and ASA, Book Ser 5. SSSA, Madison, WI.
United States Environmental Protection Agency. (1983). Meth-ods for chemical analysis of water and wastes. Environ-mental Monitoring and Support Laboratory. Cincinnati,Ohio (pp. 475–490).
Waller, B. G., & Earle, J. E. (1975). Chemical and biologicalquality of water in part of the Everglades, southern Florida.WRI 56–75. U.S. Geological Survey. Tallahassee.
Zhou, M., & Li, Y. (2001). Phosphorus-sorption characteristicsof calcareous soils and limestone from southern Evergladesand adjacent farmlands. Soil Science Society of AmericaJournal, 65, 1404–1412.
Water Air Soil Pollut (2012) 223:2865–2879 2879