Embed Size (px)
Citation preview
Phoenix Convention Center • Phoenix, Arizona
Getting Results From Your Energy Projects
Session 3 Greening the Federal Government
Jim BochatCommissioning Concepts, Phoenix AZ
[August 11, 2015]

Energy Exchange: Federal Sustainability for the Next Decade2
HOW DO YOU MEET YOUR ENERGY & WATER MANDATES
• Energy Reduction EO 13514 and EO 13423– 3% per Year 2005-2015 Total 30%
• Water Reduction EO 13693– 2% per Year 2007-2025 Total 36% (16% 2015)
ARE YOU THERE YET?

Energy Exchange: Federal Sustainability for the Next Decade3
HOW DO YOU GET THERE?
• Energy– Energy Audit– Retro Commissioning & Optimization– Metering– Lighting Reduction and Upgrades– Reduce Hot Water use– System Upgrades and Replacement– Renewable Energy Site Generated
Energy Exchange: Federal Sustainability for the Next Decade4
HOW DO YOU GET THERE?
• Water– Water Audit– Metering– Low Flow Plumbing Fixtures– Eliminate Water Leaks– Reduce Landscape Water Use– Increase Cooling Tower Cycles of Concentration– Reduce Water Pressure
Energy Exchange: Federal Sustainability for the Next Decade5
PROCUREMENT
If Reduction is really what you want, why are you not getting it from what you purchase?–Definitions are not standard• Energy Audit Level 1, Level 2?• Retro Commissioning & Optimization• Two Points of View Yours and Theirs
– Specify Outcomes• Do Not Specify Standards, Specify Results• Do Not Specify Measures, Specify Results
Energy Exchange: Federal Sustainability for the Next Decade6
GETTING RESULTS
• Energy & Water Audits– Should only need one– Ask for a root cause analysis for each
recommendation– Ask for a written detailed scope of work for each
recommendation – Require detailed energy or water savings
calculations for each issue recommended – Act immediately on the low cost / no cost
recommendations
Energy Exchange: Federal Sustainability for the Next Decade7
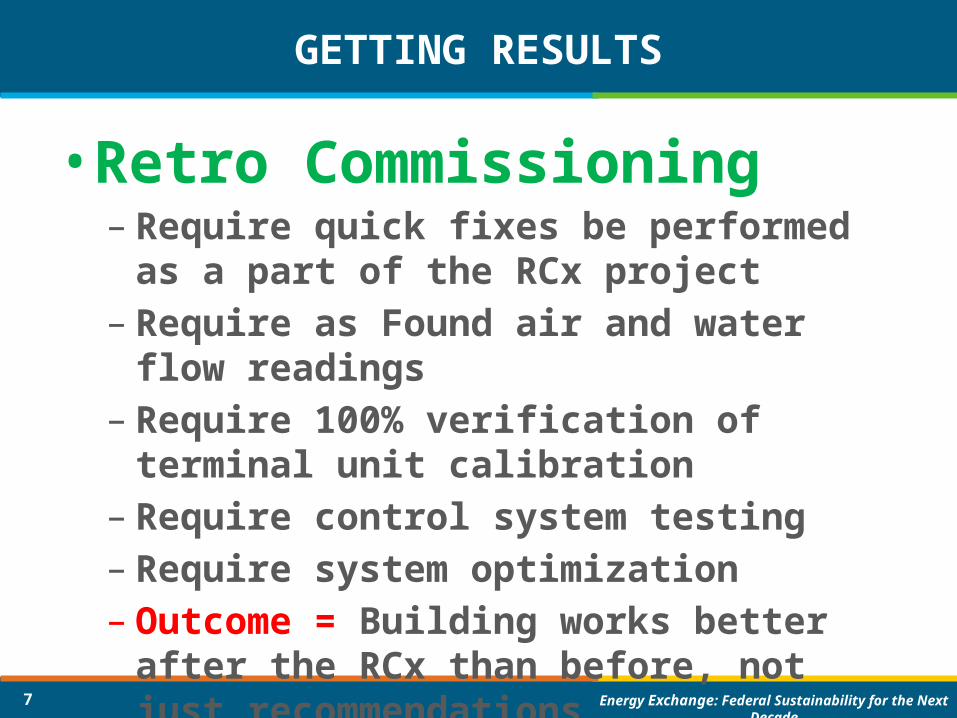
GETTING RESULTS
• Retro Commissioning– Require quick fixes be performed as a part of the
RCx project– Require as Found air and water flow readings– Require 100% verification of terminal unit
calibration– Require control system testing– Require system optimization– Outcome = Building works better after the RCx
than before, not just recommendations
Energy Exchange: Federal Sustainability for the Next Decade8
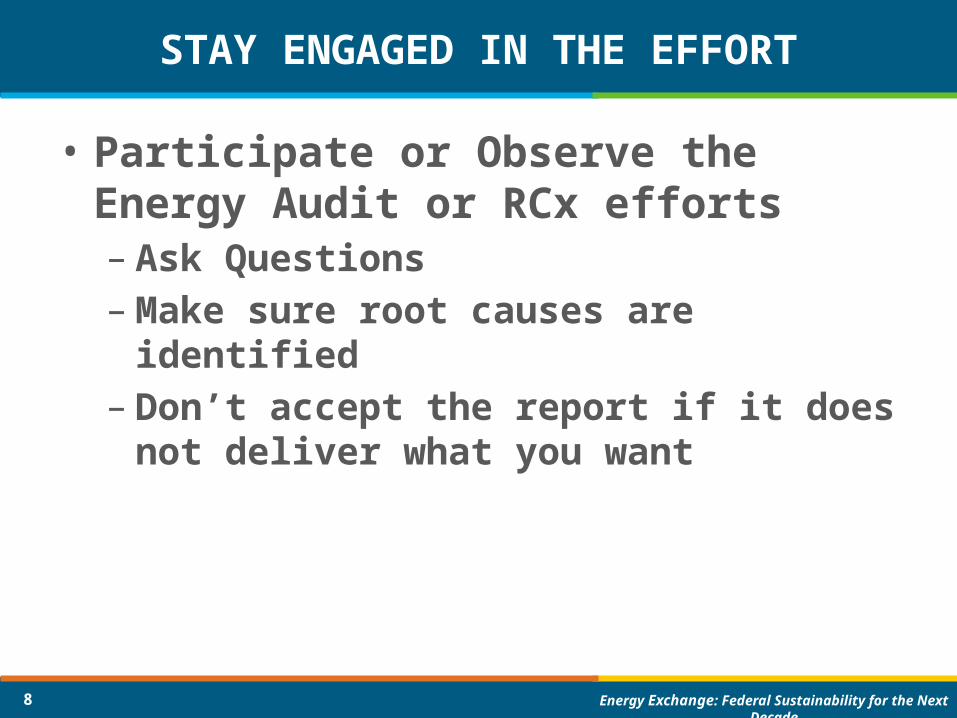
STAY ENGAGED IN THE EFFORT
• Participate or Observe the Energy Audit or RCx efforts– Ask Questions– Make sure root causes are identified– Don’t accept the report if it does not deliver what
you want
Energy Exchange: Federal Sustainability for the Next Decade9
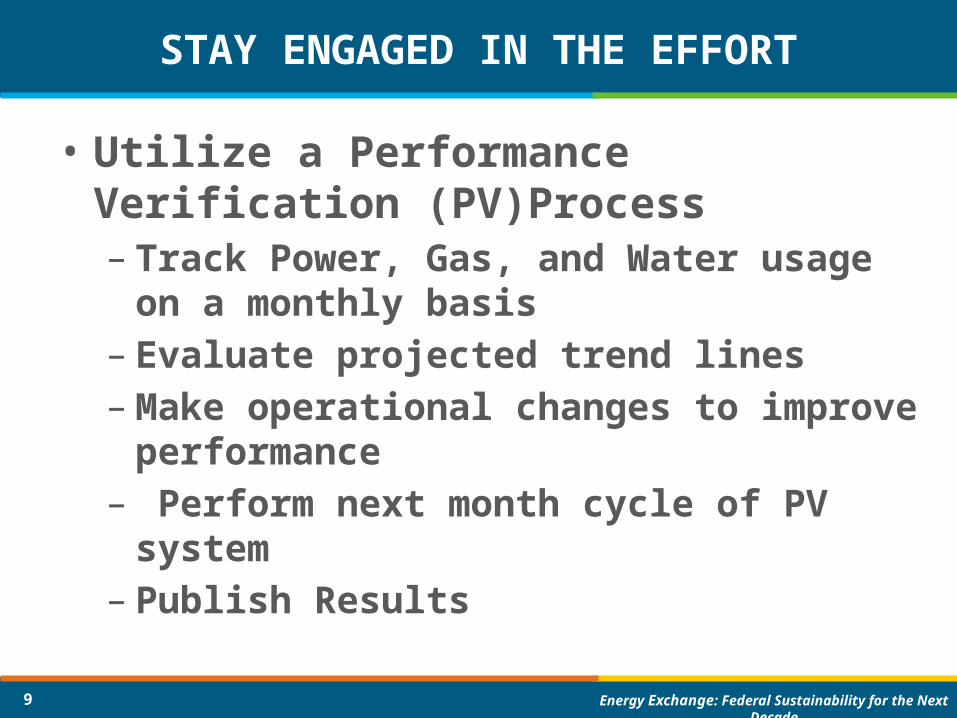
STAY ENGAGED IN THE EFFORT
• Utilize a Performance Verification (PV)Process– Track Power, Gas, and Water usage on a monthly
basis– Evaluate projected trend lines– Make operational changes to improve performance– Perform next month cycle of PV system– Publish Results

Energy Exchange: Federal Sustainability for the Next Decade10
PUBLISH PERFORMANCEDate: 1/21/2013
Current Year
Prior Year Variance
100,000 100,000 019.53 22.62 -3.09$3.85 $3.74 $0.12
Tester ProductsElectrical Use Charts for:
Square FeetEUI Mbtu / Square Foot$ / Square Foot
0
100,000
200,000
300,000
400,000
500,000
600,000
700,000
1 2 3 4 5 6 7 8 9 10 11 12
Gal
lons
Total Comparative Annual Electrical Use
2009 Total Electric Energy Use
2010 Total Electric Energy Use
-60,000
-50,000
-40,000
-30,000
-20,000
-10,000
0
10,000
20,000
1 2 3 4 5 6 7 8 9 10 11 12
Electrical Use Variance by Month
Higher Usage Lower Usage
-120,000
-100,000
-80,000
-60,000
-40,000
-20,000
0
20,000
1 2 3 4 5 6 7 8 9 10 11 12
Electrical Use Variance Trend
Usage Variance Trend Linear Trend
0
10,000
20,000
30,000
40,000
50,000
60,000
70,000
80,000
90,000
100,000
1 2 3 4 5 6 7 8 9 10 11 12
Comparative Monthly Electrical Use
Billing KWH Classification 3 (Shoulder)
Billing KWH Classification 2 (Off Peak)
Billing KWH Classification 1 (On Peak or Total)
2009 Total Electric Energy Use
Present EnergyUse Efficiency
Poor Efficiency
Good Efficiency
71.95%
Date: 6/22/2010Tester ProductsWater Use Charts for:
0
500,000
1,000,000
1,500,000
2,000,000
2,500,000
3,000,000
3,500,000
1 2 3 4 5 6 7 8 9 10 11 12
Gallo
ns
Total Comparative Annual Water Use
2009 Water Use
2010 Water Use
0
500,000
1,000,000
1,500,000
2,000,000
2,500,000
3,000,000
3,500,000
1 2 3 4 5 6 7 8 9 10 11 12
Total Comparative Annual Water Use
2009 Water Use 2010 Water Use
-400,000
-300,000
-200,000
-100,000
0
100,000
200,000
300,000
1 2 3 4 5 6 7 8 9 10 11 12
Water Use Variance by Month
Lower Usage Higher Usage
-300,000-200,000-100,000
0100,000200,000300,000400,000500,000600,000700,000
1 2 3 4 5 6 7 8 9 10 11 12
Water Use Variance Trend
Usage Variance Trend Linear Trend
ASHRAE PMP Best Practice Guide PV System

Energy Exchange: Federal Sustainability for the Next Decade11
PERFORMANCE VERIFICATION SYSTEM
Energy Exchange: Federal Sustainability for the Next Decade12
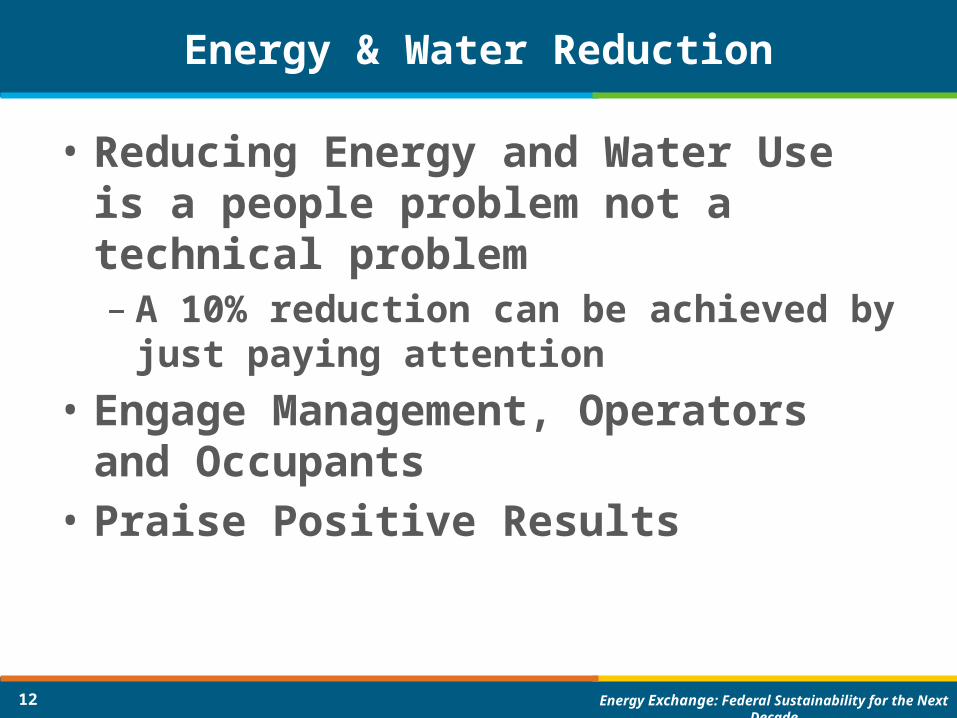
Energy & Water Reduction
• Reducing Energy and Water Use is a people problem not a technical problem– A 10% reduction can be achieved by just paying
attention• Engage Management, Operators and
Occupants• Praise Positive Results
Energy Exchange: Federal Sustainability for the Next Decade13
Questions?
Jim BochatCommissioning Concepts
[email protected] (602) 478-0501