Embed Size (px)
Citation preview

PhillyStat Outcomes Goal 3: Philadelphia is a place of choice

About PhillyStat What is PhillyStat?
• PhillyStat is the City of Philadelphia’s performance management program, led by the Managing Director’s Office in partnership with the Finance Office. During PhillyStat meetings, City leaders review departmental performance metrics and progress toward the Mayor’s strategic goals.
What are PhillyStat Outcomes Meetings?
• PhillyStat Outcomes meetings are a high-level review of the Mayor’s goals and outcomes. At PhillyStat Outcomes, the Mayor or his Chief of Staff chairs while one or more Core Team member presents. The City’s Core Team is comprised of the City Solicitor, the Communications Director, the Finance Director, the Managing Director, and the Deputy Mayors.
PhillyStat
2

The Mayor’s 5 Strategic Goals
1. Philadelphia becomes one of the safest cities in America
2. The education and health of Philadelphians improves
3. Philadelphia is a place of choice
4. Philadelphia becomes one of the greenest and most sustainable cities in America
5. Philadelphia government works efficiently and effectively, with integrity and responsiveness
Mayor’s Goals
3

Philadelphia is positioned well in a competitive region
Availability of Skilled Workers
• High rate of professional degrees, flourishing creative economy
Cost of Doing Business
• Overall costs of doing business are less than New York, Boston, and Washington
Transportation Infrastructure
• Highways, airport, port complex, and commuter rail
Research and Development
• High rates of expenditure on R&D by colleges and universities
Entrepreneurial Climate
• Fast-growing companies
Quality of Life
• World-class amenities, low cost of living
Mayor’s Goal 3
4

William Marth, President and CEO of Teva Pharmaceuticals—The Americas. “Making this investment in Philadelphia is significant for us both financially and emotionally as we've always considered Philadelphia to be our hometown. We have strong partnerships in Philadelphia and we're glad to be furthering our investment in this great city.” David Adelman, CEO of Campus Apartments "The City of Philadelphia was a true partner in bringing this project to life… As a long-time Philadelphia-based company, we are proud to work with an administration that is clearly focused on creating a welcoming environment for business and creating jobs for our local community.”
Nick Gregory, Director of Operations for Kimpton Hotels Philadelphia “The city has been incredibly welcoming of us and the guest response to our type of product has been extremely positive. We look forward to further integrating into the community with the addition of our second property, the Monaco, and helping Philadelphia become a top travel destination."
Business leaders believe Philadelphia is a Smart Choice
Mayor’s Goal 3
5
Tim Reeves, CEO of the Neiman Group “Philadelphia has been rocket fuel for our growth. Tremendous talent. A vibrant creative culture. A dynamic digital community, which is key for us. World-class office space at affordable terms, enabling lower overhead that helps us to compete successfully for national clients. And a true partner in the PIDC. They have radiated enthusiasm for helping our business to grow. Our only regret is that the resulting growth and clients have us working too hard to fully enjoy the tremendous restaurants, sports and cultural amenities that also are part of Philadelphia's magic.”

Our City Faces Challenges
• Poverty
• City/County
• Education
Mayor’s Goal 3
6

Philadelphia is a place of choice
Owner: Deputy Mayor Alan Greenberger
Outcome 1: Philadelphia is business-friendly
Lead Departments or Programs:
• Office of the Deputy Mayor for Economic Development
• Department of Commerce
• Philadelphia Industrial Development Corporation
• Licenses and Inspections
• Office of Economic Opportunity
• Workforce Investment Board
• Philadelphia Workforce Development Corporation
• Office of Finance
Outcome 2: People choose to live and stay in Philadelphia
Presented in November
Goal 3
7

8
Goal 3: Philadelphia is a Place of Choice | VISION
Philadelphia is a place of choice – a place businesses choose to start and grow and a place people come to live, work, and visit. A place like this will not just happen; it must be made by individuals and organizations that see opportunity in Philadelphia and commit the resources, time, and attention required to create a thriving, connected, renewed city.
City government’s role in this context is to create a climate where public life is geared to support entrepreneurs. The strategies and initiatives outlined in this presentation mark the daily pathways we follow toward this goal.
City policy fosters entrepreneurship, improves processes

Goal 3: Philadelphia is a Place of Choice | OUTCOME 1
Outcome 1:
Philadelphia Is Business-Friendly
9

Goal 3: Philadelphia is a Place of Choice | OUTCOME 1: Philadelphia is business-friendly | MEASURE 1: fDi Ranking
Philadelphia ranked 12th overall in a ranking of 76 Major North and South American cities by fDi, a division of the Financial Times.
fDi rankings are used by investment promotion agencies, companies, services providers and academic institutions to identify locations with the best prospects for inward investment, economic development, and business expansion.
TARGET: Philadelphia will rank in the fDi top-ten Major Cities within 6 years.
Philadelphia ranks 12 as a “Major City of the Future” by fDi
10
fDi Top Ten Major Cities
1 New York, NY US
2 Chicago, IL US
3 Houston, TX US
4 Toronto, ON Canada
5 Atlanta, GA US
6 Montreal, QC Canada
7 Boston, MA US
8 Austin, TX US
9 Miami, FL US
10 San Jose, CA US
12 Philadelphia, PA US
Goal 3: Philadelphia is a Place of Choice | OUTCOME 1: Philadelphia is business-friendly | MEASURE 1: fDi Ranking
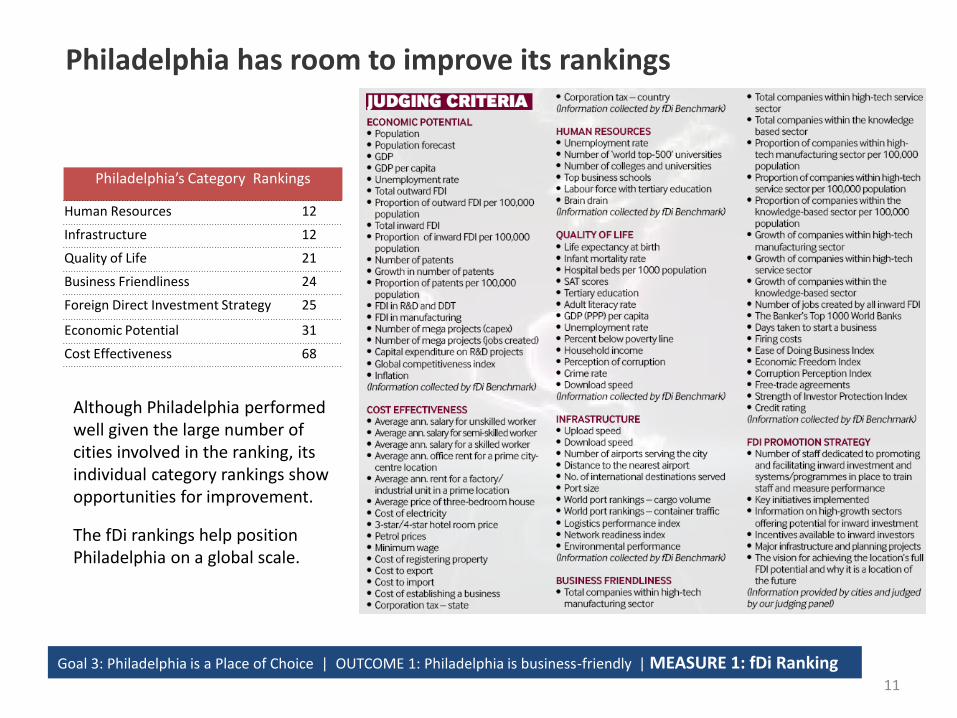
Although Philadelphia performed well given the large number of cities involved in the ranking, its individual category rankings show opportunities for improvement.
The fDi rankings help position Philadelphia on a global scale.
Philadelphia has room to improve its rankings
11
Philadelphia’s Category Rankings
Human Resources 12
Infrastructure 12
Quality of Life 21
Business Friendliness 24
Foreign Direct Investment Strategy 25
Economic Potential 31
Cost Effectiveness 68

12
50,000
55,000
60,000
65,000
70,000
75,000
80,000
85,000
90,000
95,000
100,000
1999 2000 2001 2002 2003 2004 2005 2006 2007 2008 2009
Number of Filers
TARGET: To be determined.
The number of filers excludes BPT filers that file returns without any liability for either the gross or the net income portion of the tax.
Accounts in Keystone Opportunity Zones (KOZ) are excluded.
The number of businesses filing taxes has declined 11% between 2007 and 2009
Goal 3: Philadelphia is a Place of Choice | OUTCOME 1: Philadelphia is business-friendly | MEASURE 2: BPT Filers
Number of Business Privilege Tax Filers Calendar Year 1999 - 2009

13
Strategies to encourage business growth and formation
Goal 3: Philadelphia is a Place of Choice | OUTCOME 1: Philadelphia is business-friendly | STRATEGIES
I. Smart Government:
Make City services and
transactions predictable
and user-friendly
II. Smart Location:
Invest in City
infrastructure
III. Smart People:
Invest in human capital
1) Make Philadelphia’s Cost
Structure More Competitive
2) Provide Businesses with One
Point of Contact in the City
3) Streamline the Development
Process
4) Promote the Economic
Development of Minority-,
Women-, and Disabled-Owned
Business Enterprises
(M/W/DSBEs)
1) Implement the Philadelphia
2035 Plan
2) Reform the Zoning Code
3) Invest in Infrastructure and
Utilities
1) Provide Workforce Training
and Professional Development
to Job-Seekers in Philadelphia
2) Improve Educational
Outcomes (Mayor’s Goal 2)

14
We will make Philadelphia more cost-effective through:
Goal 3: Philadelphia is a Place of Choice | OUTCOME 1: Philadelphia is business-friendly | Strategy I | Initiative 1
• In FY2014, the Administration will resume Wage and Business Privilege Tax rate reductions in order to lower the overall tax burden on businesses and residents
• The Revenue Department is piloting two programs that aim to remove disincentives for businesses to locate in the city, including market-based sourcing, and single receipts factor apportionment.
• The Administration is reforming the property assessment system in the city, and is currently implementing a complete reassessment of all real property, to ensure fair and equitable property assessments.
• The Administration is also constantly striving to improve tax collection and compliance. This year's merger of the Law Department's tax unit within the Revenue Department is expected to provide improved operational efficiency and effectiveness.
• While the City is undertaking these efforts, it is also important to recognize that value matters as much as cost when businesses make decisions.
Smart Government: Cost Competitiveness

15
A reorganized Office of Business Services (OBS) is handling more cases since 2010
Number of New Cases at the Office of Business Services Calendar Years 2010 – 2011, by Quarter
Since a reorganization of the Office of Business Services in early 2010, the Office has seen significant growth in its caseload.
0
50
100
150
200
250
Q1 2010 Q2 2010 Q3 2010 Q4 2010 Q1 2011 Q2 2011
Goal 3: Philadelphia is a Place of Choice | OUTCOME 1: Philadelphia is business-friendly | Strategy I | Initiative 2
Smart Government: Point of Contact

16
OBS Client Satisfaction improved in 2010, has remained high
Customer Satisfaction with Office of Business Services Calendar Years 2010 – 2011, by Quarter
92%
56%
0%
10%
20%
30%
40%
50%
60%
70%
80%
90%
100%
Q1 2010 Q2 2010 Q3 2010 Q4 2010 Q1 2011Percent Satisfied or Very Satisfied
Percent of Issues Resolved
Goal 3: Philadelphia is a Place of Choice | OUTCOME 1: Philadelphia is business-friendly | Strategy I | Initiative 2
Smart Government: Point of Contact

More information about the Office of Business Service
Goal 3: Philadelphia is a Place of Choice | OUTCOME 1: Philadelphia is business-friendly | Strategy I | Initiative 2
Smart Government: Point of Contact
17
The Office of Business Services (OBS) was reorganized beginning of FY 2010.
Since the reorganization, customer satisfaction with service has increased from 60% to 92%. Yet, the percent of customers who report their issue was solved hovers around 55%.
There are a few explanations for this development. Sometimes, clients call OBS very early in the process and the issue may not have been resolved at the time they were surveyed. Occasionally clients contact OBS with incorrect assumptions about what the Office has the ability to do, such as provide direct funding or grants.
OBS is working harder to better inform clients about how we help businesses do their best work. OBS regularly works with community partners to broaden exposure to their services.

18
Elements of the development process made more predictable
Goal 3: Philadelphia is a Place of Choice | OUTCOME 1: Philadelphia is business-friendly | Strategy I | Initiative 3
Smart Government: Predictability of Process
0%
10%
20%
30%
40%
50%
60%
70%
80%
90%
100%
Review ResidentialBuilding Plans
(15 Days)
Review CommercialBuilding Plans
(20 Days)
Perform BuildingPermit Inspections(2 Business Days)
Review Plumbing,Electrical andZoning Plans
(20 days)
Perform PlumbingPermit Inspections(2 Business Days)
ServiceLicense Customers
(30 minutes)
FY09 FY10 FY11
Licenses & Inspections Service Performance - Percent of Time Service Level Was Met
Note: In 2009 and 2010, the service level agreement for reviewing plumbing, electrical, and zoning plans was 25 days.

More information about improvements to the development process
19
A goal for this administration is to improve the development process - the process through which developers obtain the necessary permitting and licensing to develop projects.
One part of this initiative was to improve the speed of delivery of predictability of Licenses and Inspections services. The Department of Licenses and Inspections has shown consistent improvement in this area over the last three years.
Goal 3: Philadelphia is a Place of Choice | OUTCOME 1: Philadelphia is business-friendly | Strategy I | Initiative 3
Smart Government: Predictability of Process

20
As a percentage of spend, the City is contracting more with Minority, Women, Disabled-Owned Business Enterprises
M/W/DSBE Participation by Fiscal Year Operating Departments and Citywide Contract
The number of M/W/DBEs registered with the City has also increased nearly 20% from FY10 to FY11 YTD. Today there are 1,775 registered Minority, Women, or Disabled-owned Business Enterprises.
Goal 3: Philadelphia is a Place of Choice | OUTCOME 1: Philadelphia is business-friendly | Strategy I | Initiative 4
Smart Government: Promote M/W/DSBEs
25%
21% 18% 18%
21% 23%
0%
5%
10%
15%
20%
25%
30%
FY 07 FY 08 FY 09 FY 10 FY 11 Q3 YTD
Target Participation

21
Planning and Zoning Reform are Economic Development Tools
Goal 3: Philadelphia is a Place of Choice | OUTCOME 1: Philadelphia is business-friendly | Strategy II | Initiatives 1, 2
Philadelphia 2035 is the City's first comprehensive plan in 50 years. Planning organizes public will and makes development more predictable
The number of projects that require zoning variances is intolerably high (above 40%). Zoning reform sets modern standards, makes development easier to accomplish, while recognizing community interests
Smart Location: Implement Philly 2035, Reform Zoning

87% 83% 86%
0%
10%
20%
30%
40%
50%
60%
70%
80%
90%
100%
FY09 FY10 FY11
Goal 3: Philadelphia is a Place of Choice | OUTCOME 1: Philadelphia is business-friendly | Strategy III | Initiative 1
The Philadelphia Workforce System is finding jobs for Philadelphians
Target is 87%
Percent of Dislocated Workers Placed by the Public Workforce System who are Working 6 Months After Placement
Smart People: Workforce Development
22

23
Hunting Park
Outcomes: $19 million in investment 450 jobs Timeline SEPT 2010 - Strategic Plan Completed, Adopted by
Philadelphia City Planning Commission SEPT 2010 - Kroc Center Opens
Wissahickon Avenue Improvements New traffic signalization at Kroc Center entrance Frontage improvements to the SEPTA Midvale Yard Relocated SEPTA bus stops MAY 2010 - TastyKake Relocation to Navy Yard JULY 2010 - Zoning Remapping Adopted by Council MARCH 2011 - Ground Breaking for Baker Centre Seamless transition of vacated site to new use Adds a supermarket to the neighborhood MAY 2011 - CarVest Acquires Budd Site FALL 2011 - Proposed Remapping
Goal 3: Philadelphia is a Place of Choice | OUTCOME 1: Philadelphia is business-friendly | CASE STUDY I

24
Central Delaware Waterfront
Outcomes: $12 million in investment First new public space now operating at the Race St. Pier Timeline
JAN 2011 - Race Street Connector Ground Breaking
JUNE 2011 - Central Delaware Master Plan
MAY 2011 - Race Street Pier Opens
SEPT 2012 - Philly Fringe New Home
SEPT 2013 - Waterfront Trail
Goal 3: Philadelphia is a Place of Choice | OUTCOME 1: Philadelphia is business-friendly | CASE STUDY II

25
Baltimore Avenue
Outcomes $2.3 Million in investments 12 New Businesses An estimated 60 new jobs Improved greenspace throughout the
corridor and neighborhood Timeline
January 2010 – August 2011
Goal 3: Philadelphia is a Place of Choice | OUTCOME 1: Philadelphia is business-friendly | CASE STUDY III

26
Market East
Timeline
JULY 2009 - Strategic Plan Completed
SEPT 2010 - Transportation Plan Completed
DECEMBER 2010 - PhillyRising Task Force
JUNE 2011 - Sign Legislation Approved
Goal 3: Philadelphia is a Place of Choice | OUTCOME 1: Philadelphia is business-friendly | CASE STUDY IV

Key Takeaways
Philadelphia’s diverse economy helps the City weather economic downturns, but difficulties remain, including high poverty and low educational attainment
City’s “Smart City. Smart Choice.” strategy seeks to build on Philadelphia’s assets while addressing opportunities to improve
Key elements of this strategy include:
• Smart Government Retooling government to enable an entrepreneurial, growth-oriented economy
• Smart Location Making long term investments to capitalize on Philadelphia’s geographic advantages
• Smart People Utilizing the workforce and education system to prepare Philadelphians with the skills they need to have successful careers
Critical Challenge: Grow the City’s economy in a way that is both sustainable and equitable, providing long-term opportunities for all Philadelphians
Goal 3
27