Embed Size (px)
Citation preview

Phillips Carbon Black Limited
Efficient Growthwww.pcblltd.com May 2015
1


3
CESC
Phillips Carbon Black
Spencer`s Retail
Firstsource Solutions
Saregama India
Harrisons Malayalam
Fully Integrated Private Power Utility
Largest Carbon Black Manufacturer
2nd Largest Food Based Retailer
Top 3 Pure Play BPO Player
Biggest Collection of Indian Music
Tea and Rubber Plantations
6 Business Sectors, 15+ companies, 55,000+ employees, 3,00,000 + shareholders
4
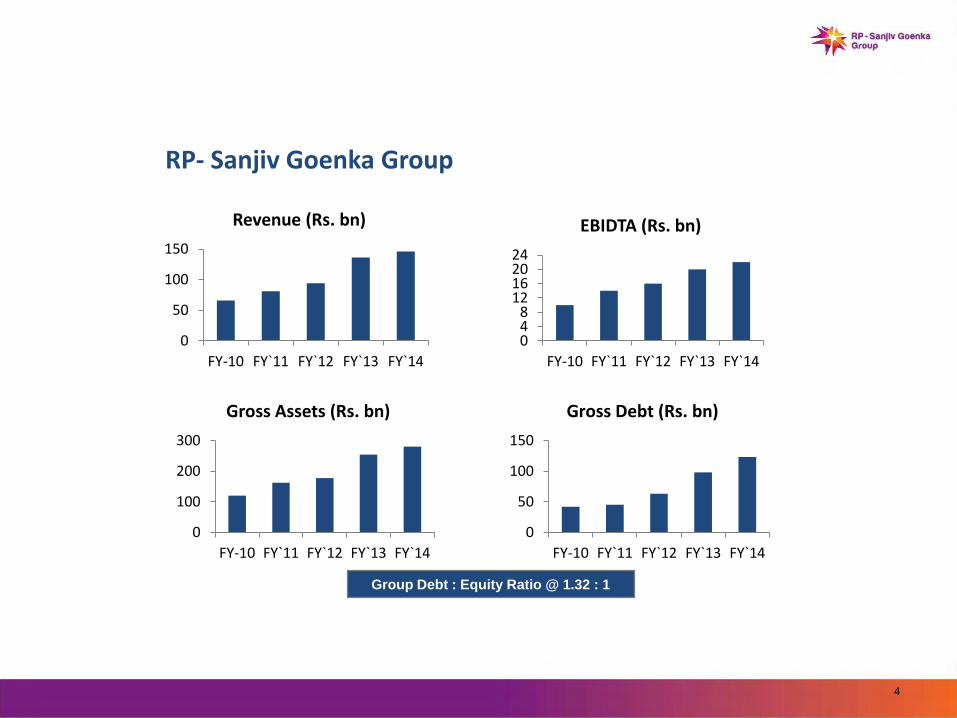
RP- Sanjiv Goenka Group
0
50
100
150
FY-10 FY`11 FY`12 FY`13 FY`14
Revenue (Rs. bn)
048
12162024
FY-10 FY`11 FY`12 FY`13 FY`14
EBIDTA (Rs. bn)
0
100
200
300
FY-10 FY`11 FY`12 FY`13 FY`14
Gross Assets (Rs. bn)
0
50
100
150
FY-10 FY`11 FY`12 FY`13 FY`14
Gross Debt (Rs. bn)
Group Debt : Equity Ratio @ 1.32 : 1

(Rs. bn )
*market cap as on 30th June`12
Gross
Revenues
(FY`14)
EBIDTA
(FY`14)
Net Profit
(FY`14)
Current Market
cap
Promoter
Holding
Institutional
Holding
CESC 56.10 15.30 6.52 100.00 49% 42%
Firstsource Solutions 31.10 3.62 1.93 25.00 57% 18%
Phillips Carbon Black 22.98 1.55 (0.87) 4.00 53% 12%
Spencer`s Retail 14.60 (0.70) (1.65) - 100% -
Noida Power Company 7.80 1.60 0.89 - 73% -
Saregama India 1.74 0.28 0.19 2.80 58% 12%
Harrisons Malayalam 3.70 0.26 0.04 1.25 50% 5%
Integrated Coal Mining 3.10 0.47 0.13 - 100% -
Crescent Power 1.47 0.74 0.32 - 100% -
Financials of RP- Sanjiv Goenka Group companies
5

6
Phillips Carbon Black - at a Glance
Largest CB Capacity of 4,72,000 MT p.a. across four locations in India Co –Generation Green Power Plant at each location aggregating 76MW
Capacity
Largest producer of Carbon Black in India and 6th largest in the World
Second fastest growing CB company in the worldBusiness
Leading tyre companies around the globeCustomers
Exports to more than 50 countriesExports
Stock Listed on BSE (Code – 506590); NSE (PHILIPCARB)
Rs. 4.0 bn
CPP – 5 MW in KochiExpansion Plans
Kochi unit has been awarded Best Environment Management Co. by
Kerala state Government in 2014 PCBL received “Top Exports” awards for 2013-14
Awards
CRISIL Equities has assigned a valuation grade of 3/5 & fundamental
grade of 3/5 as on Feb’14Ratings
Market Cap As on Apr’15
7
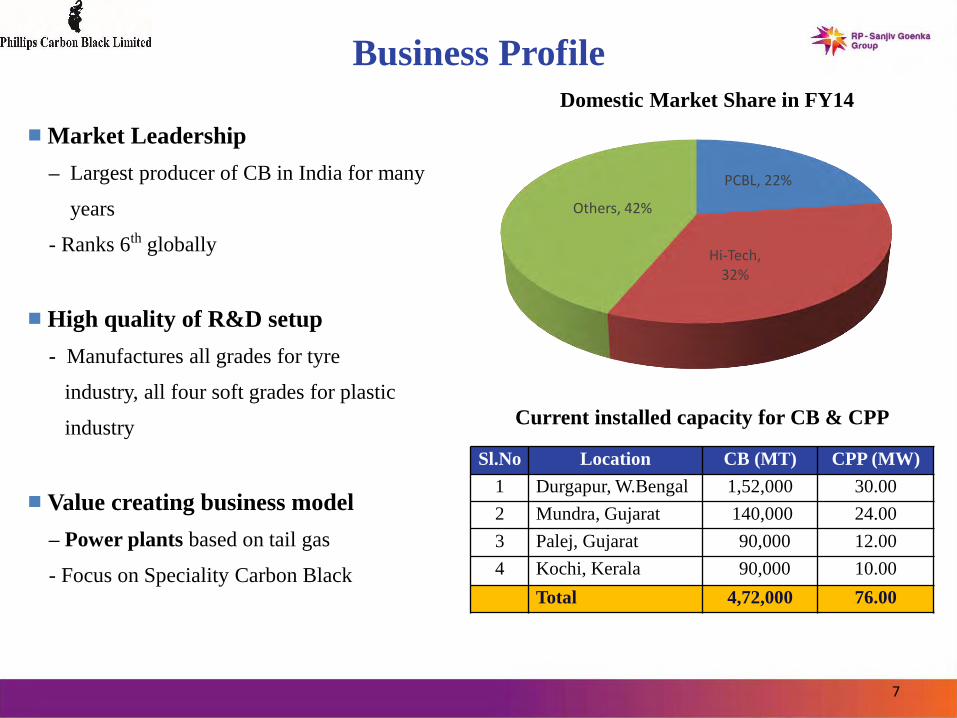
Business Profile
Market Leadership
– Largest producer of CB in India for many
years
- Ranks 6th globally
High quality of R&D setup
- Manufactures all grades for tyre
industry, all four soft grades for plastic
industry
Value creating business model
– Power plants based on tail gas
- Focus on Speciality Carbon Black
Domestic Market Share in FY14
Sl.No Location CB (MT) CPP (MW)
1 Durgapur, W.Bengal 1,52,000 30.00
2 Mundra, Gujarat 140,000 24.00
3 Palej, Gujarat 90,000 12.00
4 Kochi, Kerala 90,000 10.00
Total 4,72,000 76.00
Current installed capacity for CB & CPP
PCBL, 22%
Hi-Tech, 32%
Others, 42%
8
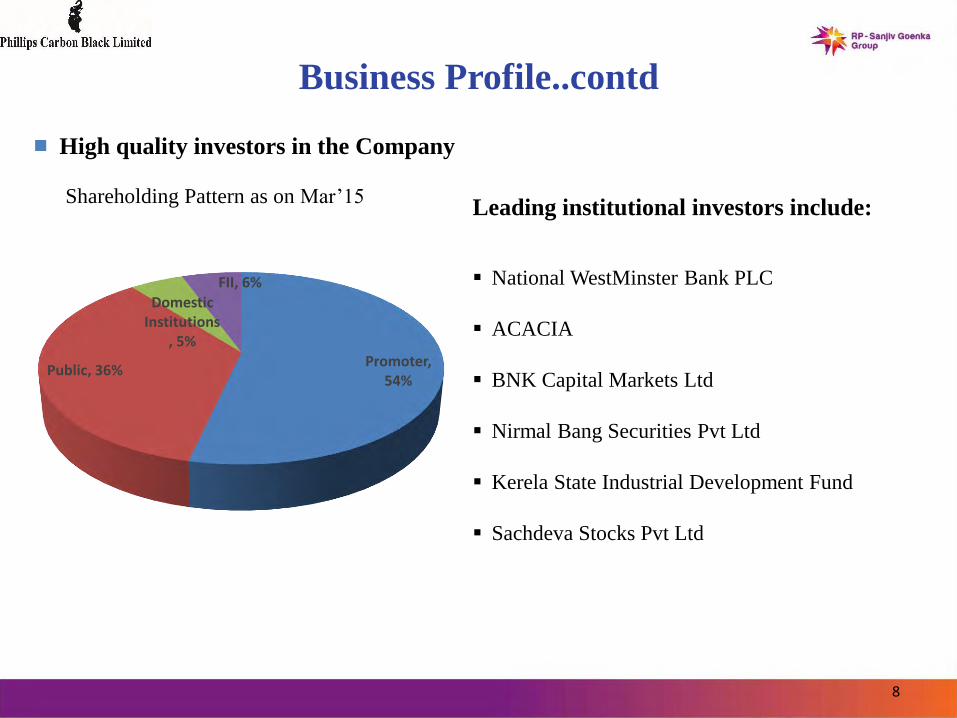
High quality investors in the Company
Business Profile..contd
Shareholding Pattern as on Mar’15Leading institutional investors include:
National WestMinster Bank PLC
ACACIA
BNK Capital Markets Ltd
Nirmal Bang Securities Pvt Ltd
Kerela State Industrial Development Fund
Sachdeva Stocks Pvt Ltd
Promoter, 54%
Public, 36%
Domestic Institutions
, 5%
FII, 6%

9
Business Profile..contd
CB Revenue Split : FY14
Exports – 34%
Domestic – 66%
Increasing Power revenues and export of Carbon Black is improving PCBL’s business model
Carbon Black, 94%
Power,6%
Revenue Split : FY14
EBITDA Split : FY14
Carbon Black, 69%
Power, 31%
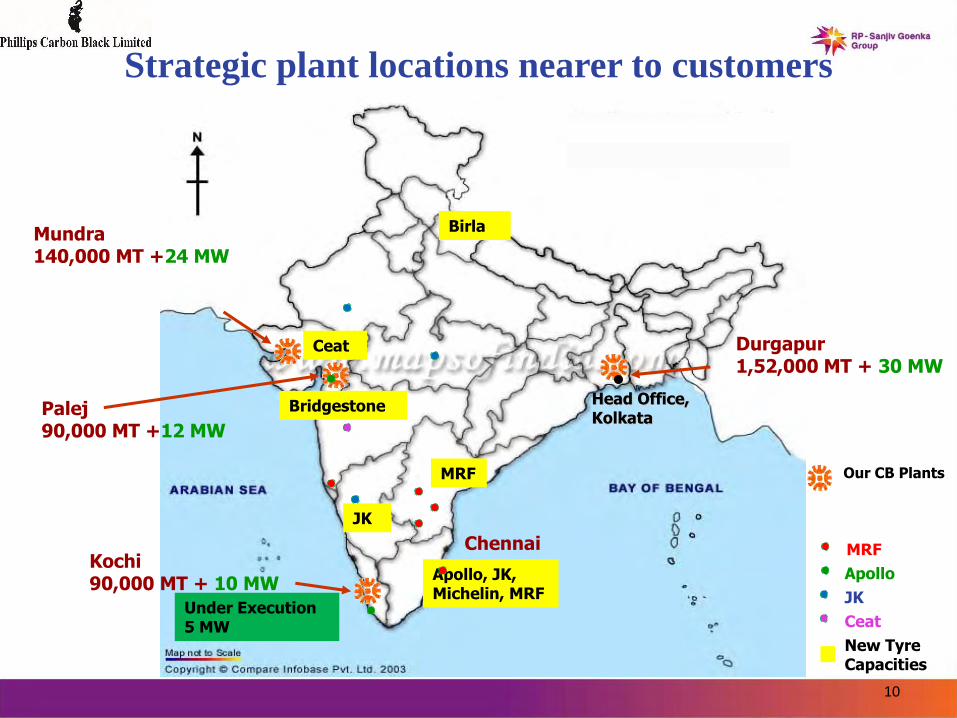
Strategic plant locations nearer to customers
Chennai
Apollo, JK, Michelin, MRF
JK
Bridgestone
MRF
Birla
Ceat
Mundra140,000 MT +24 MW
Palej90,000 MT +12 MW
Kochi90,000 MT + 10 MW
Durgapur1,52,000 MT + 30 MW
Head Office,Kolkata
10
MRF
Apollo
JK
Ceat
New TyreCapacities
Our CB Plants
Under Execution5 MW

11
Exports to more than 50 Countries
IRAN
VIETNAM
JAPAN
S. KOREA
TAIWAN
PHILIPPINES
CHINA
AUSTRALIA
NEW ZEALAND
INDONESIA
MALAYSIA
TURKEY
UAE
KENYA
SPAIN
ISRAEL
SRILANKA
BANGLADESH
SINGAPORE
USA
THAILAND
NEPAL
SOUDI ARABIA
ETHOPIA
BRAZIL
PERU
NIGERIA

12
Forward Integration - Green Power Generation
Waste gases from plants being used
to produce electricity, Surplus power
sold to grid
CPP at Palej is registered as a CDM
Project with UNFCCC
In FY14 power generation is
Waste Gas generated at
the CB Plant
Waste Gas Electricity
Internal plant
requirement
Surplus power
sold to grid
Incineration
Waste Gas Co-
generation plant
earlier
now
Sl.No Location CPP (MW)
capacity
Year of
Commission
1 Palej, Gujarat 12.00 Mar’05
2 Durgapur, W.Bengal 30.00 Apr’08
3 Mundra, Gujarat 24.00 Dec’09
4 Kochi, Kerala 10.00 Apr’11
Total 76.00
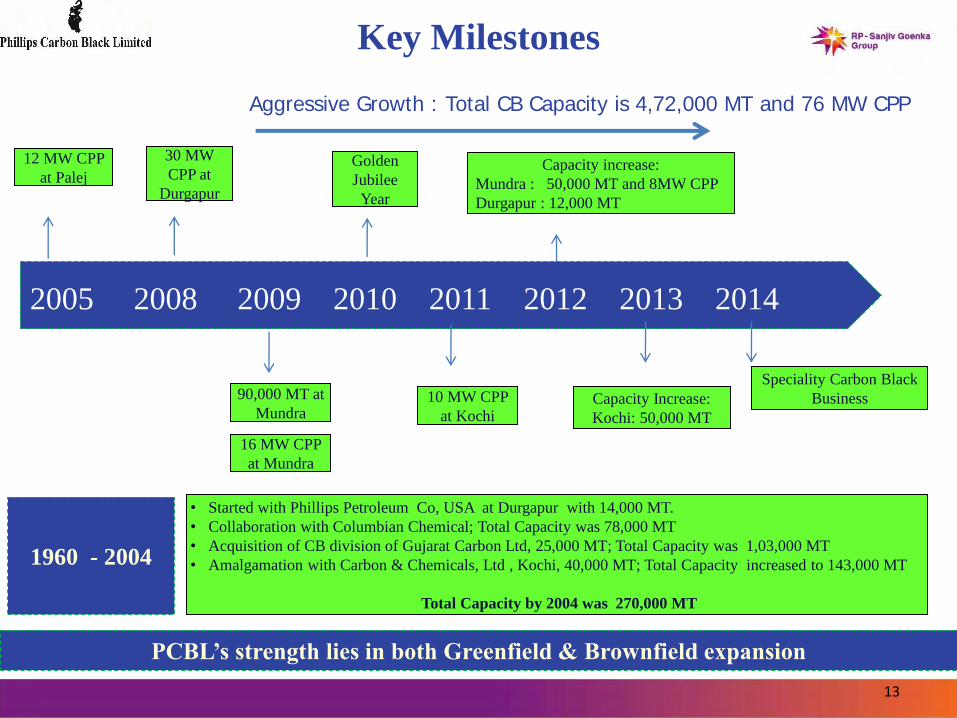
Key Milestones
PCBL’s strength lies in both Greenfield & Brownfield expansion
13
Capacity increase:
Mundra : 50,000 MT and 8MW CPP
Durgapur : 12,000 MT
1960 - 2004
Aggressive Growth : Total CB Capacity is 4,72,000 MT and 76 MW CPP
2005 2008 2009 2010 2011 2012 2013 2014
30 MW
CPP at
Durgapur
Golden
Jubilee
Year
Speciality Carbon Black
Business90,000 MT at
Mundra
16 MW CPP
at Mundra
10 MW CPP
at Kochi
12 MW CPP
at Palej
• Started with Phillips Petroleum Co, USA at Durgapur with 14,000 MT.
• Collaboration with Columbian Chemical; Total Capacity was 78,000 MT
• Acquisition of CB division of Gujarat Carbon Ltd, 25,000 MT; Total Capacity was 1,03,000 MT
• Amalgamation with Carbon & Chemicals, Ltd , Kochi, 40,000 MT; Total Capacity increased to 143,000 MT
Total Capacity by 2004 was 270,000 MT
Capacity Increase:
Kochi: 50,000 MT
14
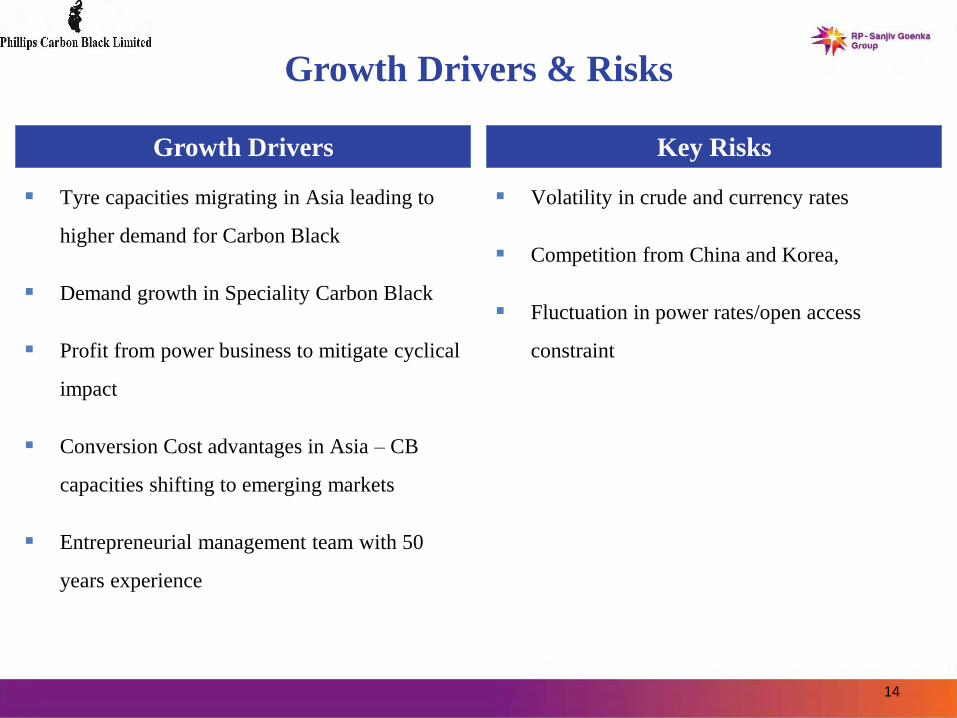
Tyre capacities migrating in Asia leading to
higher demand for Carbon Black
Demand growth in Speciality Carbon Black
Profit from power business to mitigate cyclical
impact
Conversion Cost advantages in Asia – CB
capacities shifting to emerging markets
Entrepreneurial management team with 50
years experience
Volatility in crude and currency rates
Competition from China and Korea,
Fluctuation in power rates/open access
constraint
Growth Drivers Key Risks
Growth Drivers & Risks

15
Carbon Black-Grades & Uses
The hard grades are used in the tyre surface, which
comes in contact with the road and are subject to
higher friction.
The soft grades are used for the side wall of tyres
& also for plastic industry
Specialty grades for plastic and ink industry have
been developed by PCBL
Tyre, 65%
Rubber,15%
Belts & Hoses,
10%
Printing Ink & Other
Speciality, 10%
Utilization of carbon black (Sector-wise)
16
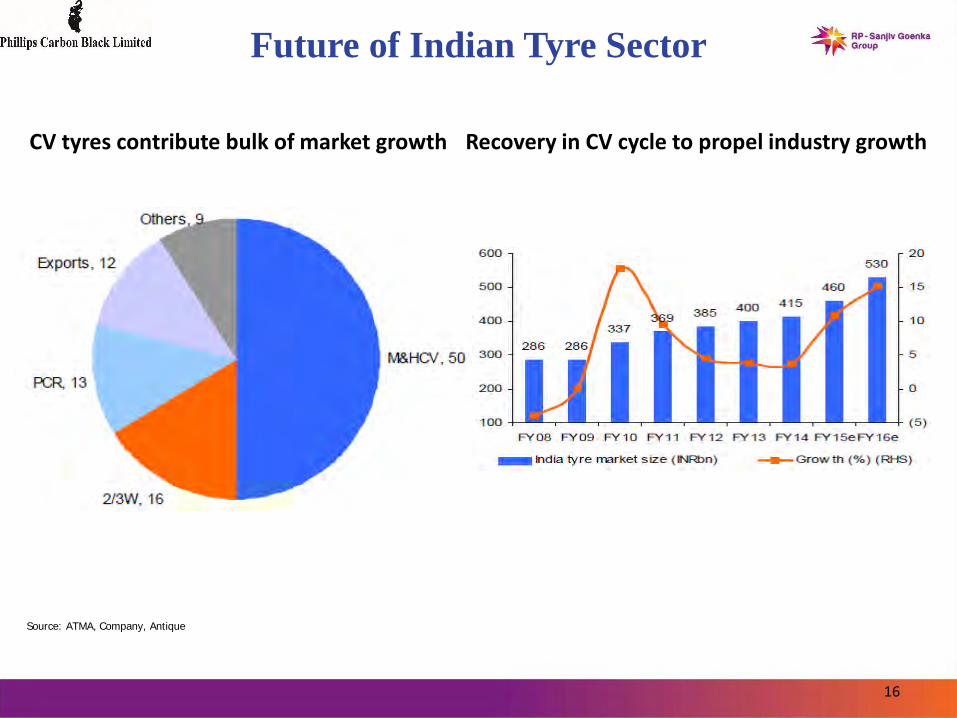
Future of Indian Tyre Sector
Recovery in CV cycle to propel industry growth CV tyres contribute bulk of market growth
Source: ATMA, Company, Antique
17
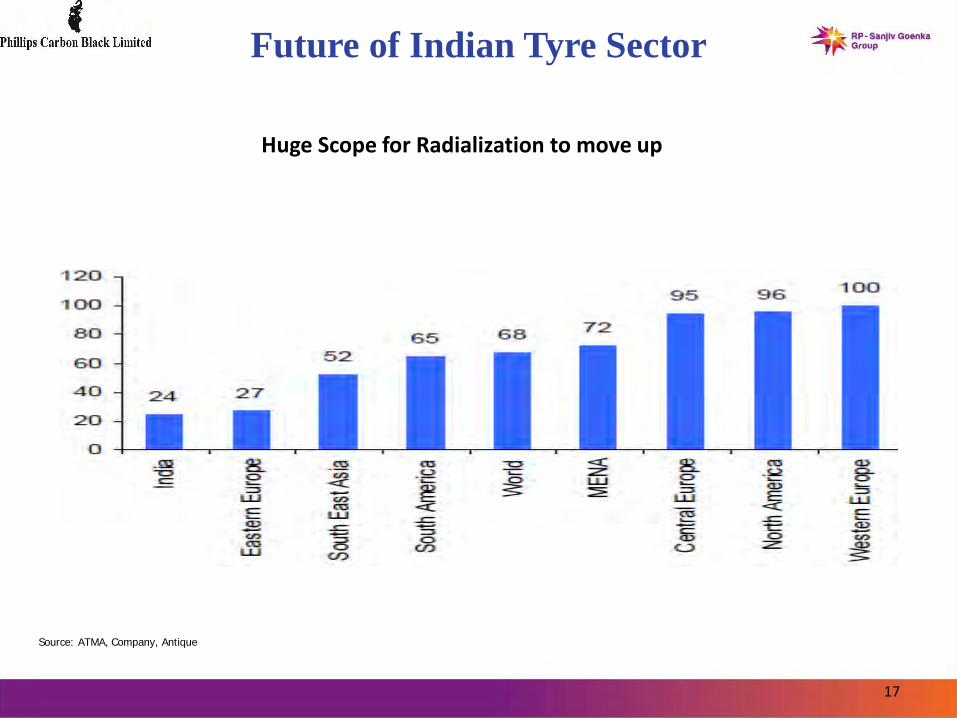
Future of Indian Tyre Sector
Huge Scope for Radialization to move up
Source: ATMA, Company, Antique
18
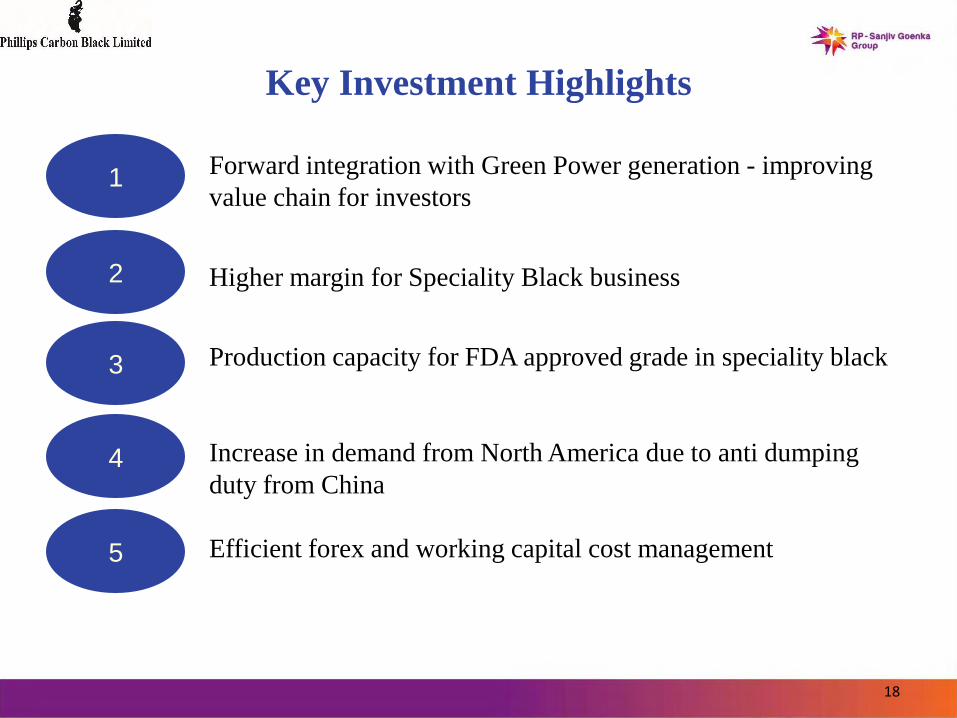
Key Investment Highlights
2
1
5
3
4
Forward integration with Green Power generation - improving
value chain for investors
Increase in demand from North America due to anti dumping
duty from China
Efficient forex and working capital cost management
Production capacity for FDA approved grade in speciality black
Higher margin for Speciality Black business
19
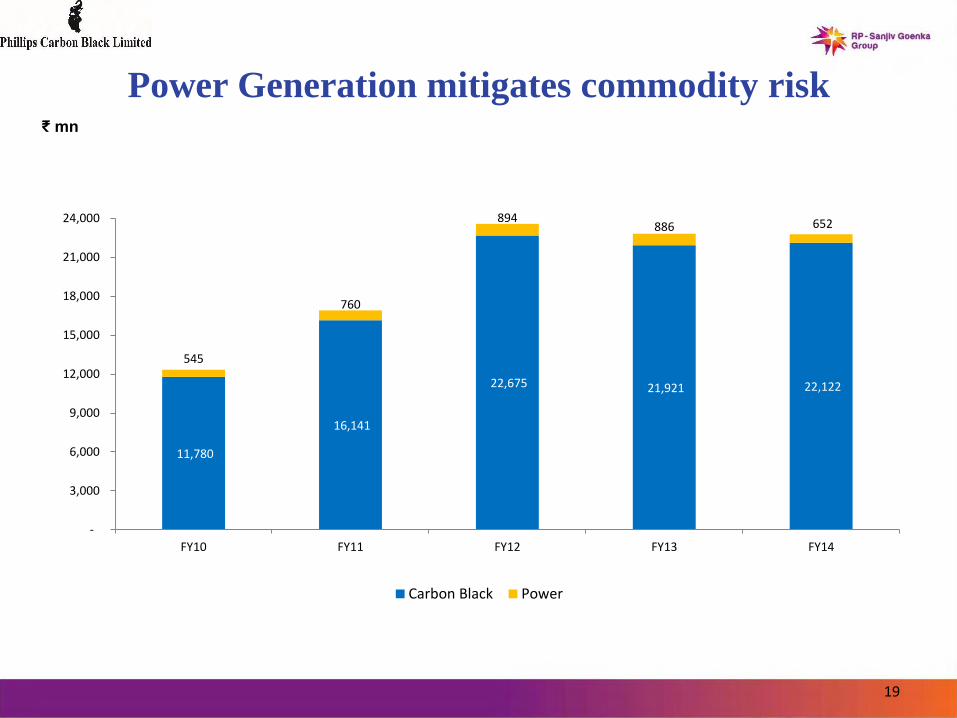
Power Generation mitigates commodity risk ₹ mn
11,780
16,141
22,675 21,921 22,122
545
760
894886 652
-
3,000
6,000
9,000
12,000
15,000
18,000
21,000
24,000
FY10 FY11 FY12 FY13 FY14
Carbon Black Power

20
Efficient Cost Management & Rationalization
60,000
65,000
70,000
75,000
80,000
85,000
Q1FY14 Q2FY14 Q3FY14 Q4FY14 Q1FY15 Q2FY15 Q3FY15
CB Sales Trend (MT)
PAT Trend (Rs Crs)
(60)
(50)
(40)
(30)
(20)
(10)
0
10
Q1FY14 Q2FY14 Q3FY14 Q4FY14 Q1FY15 Q2FY15 Q3FY15
(60)
(50)
(40)
(30)
(20)
(10)
0
10
Q1FY14 Q2FY14 Q3FY14 Q4FY14 Q1FY15 Q2FY15 Q3FY15
EBITDA (bef Forex) Trend (Rs Crs)
450
500
550
600
650
Q1FY14 Q2FY14 Q3FY14 Q4FY14 Q1FY15 Q2FY15
Power Sales Trend (KwH in lacs)

Strong Customer Relationship
Domestic Customers International Customers
21

22
Financial Overview
₹ mn FY10 FY11 FY12 FY13 FY14
Profit & Loss Statement
Net Sales 12,350 16,901 21,867 22,849 22,775
EBITDA 1,907 2,345 2,339 1,097 461
Depreciation 312 386 486 508 537.4
Interest 289 316 582 721 802.3
PBT 1,310 1,643 1034 (400) (879.1)
Tax 79 481 160 (194) (13.1)
PAT 1,230 1,163 874 (206) (866)
Balance Sheet
Sources of Funds
Net Worth 3,244 5,223 5,223 5,891 5,025
Debt 5,555 5,014 5,081 8,767 6,671
Deferred Tax 96 569 520 527 299
Capital Employed 8,895 10,806 10,824 14,656 11,995
Application of Funds
Net Block 5,932 5,783 5,783 7,528 8,576
CWIP 923 2,058 2,059 1,590 674
Investments 378 576 582 724 724
Net Working Capital 1,662 2,389 2,400 (2,646) (2,022)
Miscellaneous Expenditure 0 0 0 0 0
Total Assets 8,895 10,806 10,824 23,025 11,995
Debt/Equity 1.71 0.96 1.16 1.48 1.328
23
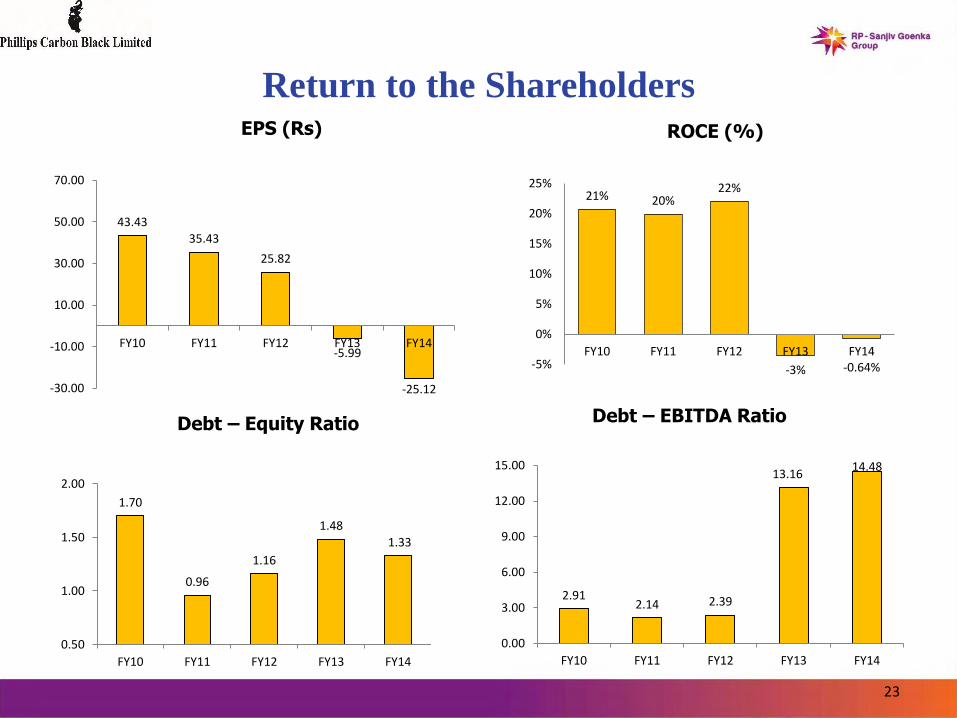
Return to the ShareholdersEPS (Rs) ROCE (%)
Debt – Equity Ratio Debt – EBITDA Ratio
43.43
35.43
25.82
-5.99
-25.12-30.00
-10.00
10.00
30.00
50.00
70.00
FY10 FY11 FY12 FY13 FY14
21% 20%22%
-3% -0.64%-5%
0%
5%
10%
15%
20%
25%
FY10 FY11 FY12 FY13 FY14
1.70
0.96
1.16
1.48
1.33
0.50
1.00
1.50
2.00
FY10 FY11 FY12 FY13 FY14
2.912.14 2.39
13.1614.48
0.00
3.00
6.00
9.00
12.00
15.00
FY10 FY11 FY12 FY13 FY14

24
Performance Summary
Particulars Q4FY15 Q3FY15%Change
(QoQ) Q4FY14
%Change
(YoY)
Production (MT) 73,520 80,292 (8%) 73,867 0%
Capacity Utilization(%) 72% 78% (7%) 80% (11%)
Total Sales Volume (MT) 77,207 77,374 0% 77,298 0%
Domestic (MT) 54,780 55,910 (2%) 50,635 8%
Export (MT) 22,427 21,464 4% 26,663 (16%)
Rs Crs Rs Crs Rs Crs
Net Sales (incl. other income) 599 609 (2%) 603 (1%)
EBITDA (before forex) 32 63 (49%) 43 (24%)
EBITDA% 5.4% 10.3% (5.1%) 7.0% (1.7%)
PBT -4 11 (141%) 2 (332%)
PAT 1 7 (93%) 2 (75%)
Power realization Rate
(Rs/KWH)3.49 3.74 (7%) 2.82 24%

25
Performance Summary - YTD
Particulars FY15 FY14 % Change
Production (MT) 311,823 288,676 8%
Capacity Utilization(%) 76% 78% (3%)
Total Sales Volume (MT) 313,562 287,839 9%
Domestic (MT) 227,150 199,100 14%
Export (MT) 86,412 88,739 (3%)
Rs Crs Rs Crs
Net Sales (incl. other income) 2485 2298 8%
EBITDA (before forex) 210 105 101%
EBITDA% 8.5% 4.5% 3.9%
PBT 14 (88) 116%
PAT 13 (87) 115%
Power realization Rate (Rs/KWH) 3.48 3.19 9%

26
Thank You