Embed Size (px)
Citation preview
0
OPPORTUNITIES IN A GROWING ECONOMY
PHILIPPINES
29 July 2016, Singapore
1
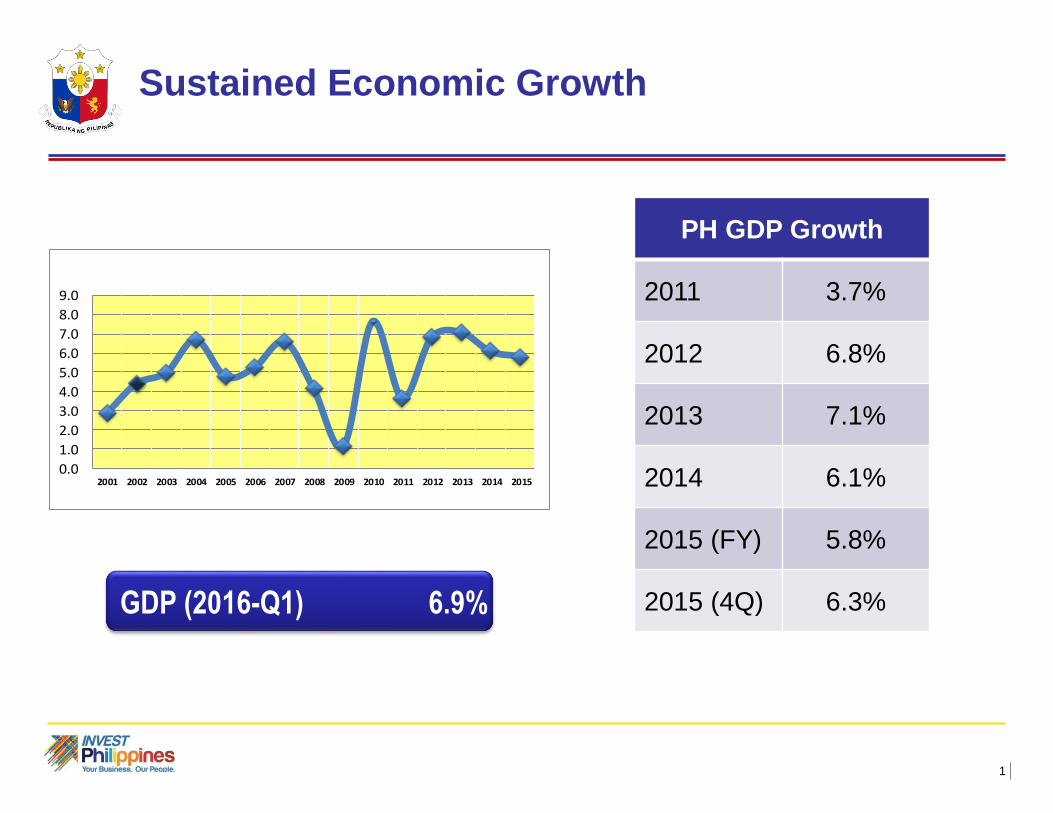
0.0
1.0
2.0
3.0
4.0
5.0
6.0
7.0
8.0
9.0
2001 2002 2003 2004 2005 2006 2007 2008 2009 2010 2011 2012 2013 2014 2015
PH GDP Growth
2011 3.7%
2012 6.8%
2013 7.1%
2014 6.1%
2015 (FY) 5.8%
2015 (4Q) 6.3%
Sustained Economic Growth
GDP (2016-Q1) 6.9%

2
2015 Full Year GDP Growth Rates
BY INDUSTRIAL ORIGIN
BY EXPENDITURE SHARES
Source: NEDA
Sustained Economic Growth

3
Total Imports
Imports of Capital Goods
Imports of Consumer Goods
8%
22%
36%
Strong Growth of Import Demand (1Q-2016)

4
Bicol 4.2%
NCR 5.9%
Ctrl Luzon 9.0%
Davao 9.4%
Caraga 7.8%
Ilocos 5.7%
Ctrl Visayas 8.8%
CaLaBaRZon 5.1%
Cagayan Valley 6.4%Regional Economic
Growth Rates, 2014
Source: National Statistical Coordination Board & National Statistics Office

5
5.9
5.9
5.5
5.1
4.7
4.1
3.6
3.1
2.7
2.4
2
1.7
1.1
0.8
0.6
0.4
0.2
0.1
0.1
0.3
0.4
0.7
1
1.5
1.9
2.3
2.7
3.1
3.6
4.2
4.8
5.3
5.8
6.2
6.2
8 7 6 5 4 3 2 1 1 2 3 4 5 6 7 8
102 million
Source: United Nations, Department of Economic and Social Affairs, Population Division (2011). World Population Prospects: The 2010 Revision.
Percent of total population
25-29
50-54
40-44
30-34
15-19
4-9
55-59
45-49
35-39
20-24
10-14
0-5
60-6465-69
Working age
population:
50.5%
(51M)Male
Female
Young dependents:
46%
(47M)
Aged dependents:
3.5%
Main Source of Competitive Advantage:
Young and growing population

6
Growing Market (100 Million)
Population Projections
PH will enter the Demographic Sweet Spot
(UN)2015
PH will enter Growth Sweet Spot
(Ernst & Young)2019
80 % will have Middle-Class Incomes
or Higher (ADB)2030
Growing Philippine Market

7
Steady Investment Flows

8
Growth of Total Approved Foreign Investments
Share of Manufacturing
Growth over 2014
+31.2%
55%
+23%
Netherlands, Japan, South Korea, USA, Singapore (up 21%)
Approved Foreign Investments, 2015

9
Steady Investment Flows

10
Philippine IT-BPM industry size 2006–2014; Revenue in US$ billion
x% YoY Growth
1 Philippines IT-BPM market as percentage of global offshore services market, in revenue terms Sources: IBPAP, ACPI, CCAP, GDAP, HIMOAP, PSIA, GICC
# FTEs (~‘000)
236 371 424 527
Global share1 5% 6% 6% 7% 8%
3.44.5
6.17.1
8.9
11.0
13.2
16.1
19.0
2006 2007 2008 2009 2010 2011 2012 2013 2014
34% 17%
25% 24%
CAGR:
24%
Copyright ©2015: BPAP. All rights reserved.
FTEs Revenue (US$M)
Rev % inc.
fr ’13
Voice BPO 685,000 11,700 17%
Non-voice BPO/KPO
186,800 3,440 18%
ITO 85,500 2,122 20%
Health Info Mgt & Care
86,867 1,304 32%
Engineering Services
13,112 227 5%
Animation 10,304 142 8%
Game Development
3,850 55 10%
TOTAL 1,071 18,989 18%
19%
298 640
9.5%
777
31% 45%
10.4%
22%
917
11%
1
18%
1,071
13%
Philippine IT-BPM Performance

11
Centers of Excellence
• Metro Manila
• Metro Cebu
• Metro Clark
• Metro Bacolod
Next Wave Cities
ü Baguio City
ü Davao City
ü Dumaguete
ü Iloilo
ü Lipa City
ü Metro Bulacan
ü Metro Cavite
ü Metro Laguna
ü Metro Naga
ü Metro Rizal Next Wave Cities
Centers of Excellence
Next Wave Cities

12
Continuous Inflow of Foreign Exchange
US$ 1.4 B from Singapore, 19% increase

13
TOP 10
Countries
2015
Volume in
Thousand
% Share
1. Korea 1,339.68 24.99
2. USA 779.22 14.54
3. Japan 495.66 9.25
4. China 490.84 9.16
5. Australia 241.19 4.50
6.Singapore 181.18 3.38
7. Canada 177.67 3.31
8. Taiwan 156.36 2.92
9. Malaysia 155.81 2.91
10. UK 154.59 2.88
Increasing Tourist Arrivals

14
Local Tourists
Projected room gap of 32,023 in critical
destination clusters by 2016
44.1M
in 201456.1Mby 2016
Source: DOT (2015)
Booming Local Tourism
15
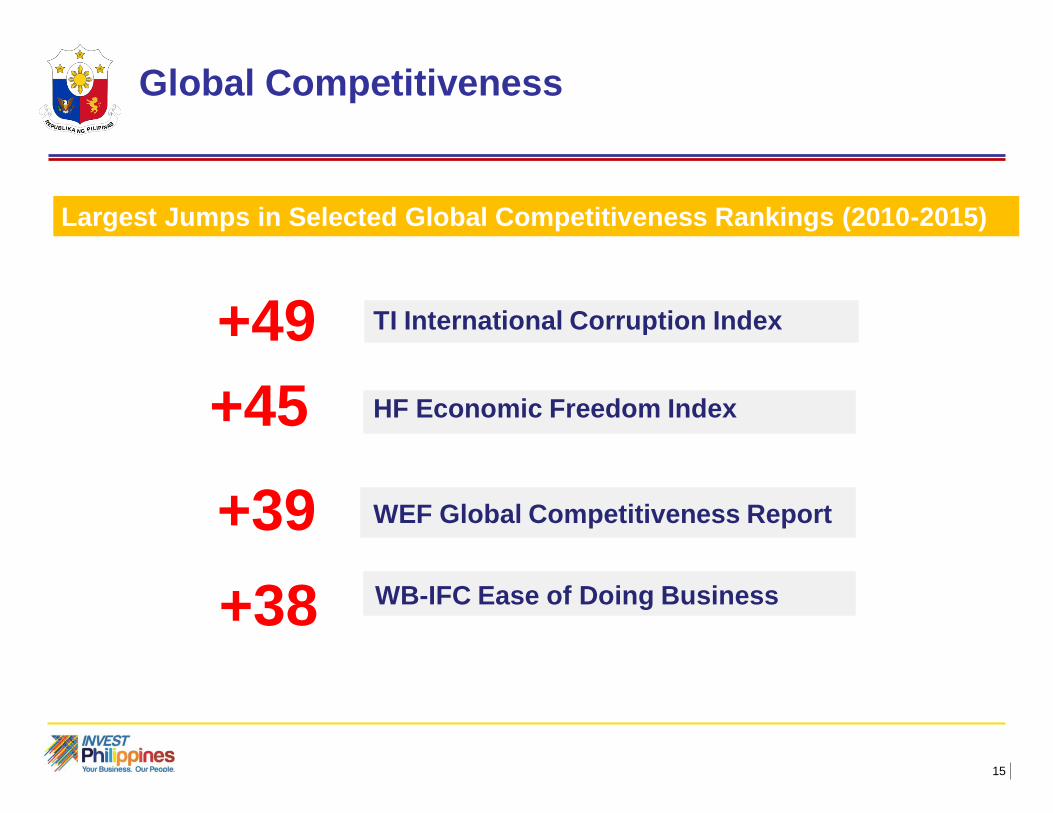
TI International Corruption Index
HF Economic Freedom Index
WEF Global Competitiveness Report
WB-IFC Ease of Doing Business
+49
+39
+38
+45
Largest Jumps in Selected Global Competitiveness Rankings (2010-2015)
Global Competitiveness

16
Global Competitiveness Index (2015/2016)
By World Economic Forum
Economic Freedom Index 2015
By Heritage Foundation
World Competitiveness Report 2015
By International Institute for Management
Global Innovation Index 2015
By World Intellectual Property Organization
+1Out of 60 countries:
From #42 to 41
+5 Out of 140 countries:
From #52 to 47
+17Out of 141 countries:
From #100 to 83
+13Out of 178 countries:
From #89 to 76
Ease of Doing Business

17
World Bank (2015)
Control of Corruption +18
Strengthened Governance
and Anti-Corruption Measures
Most Improved Campaign PERC Report on Corruption 2016

18
BBB-
Baa2
BBB-
Outlook:
Positive
Baa2
Outlook:
Stable
BBBBBB
Outlook:
Stable
Credit Rating Confirms Trust in Economy

19
1. Manufacturing
2. Agribusiness & Fishery
3. Services
4. Economic & Low Cost Housing
5. Hospitals
6. Energy
7. Public Infrastructure & Logistics
8. PPP Projects
I. Preferred Activities
Investment Priorities Plan 2014-2016

20
Manufacture of export products
Services exports
Activities in support of exporters
II. Export Activities
Investment Priorities Plan 2014-2016

21
III. Mandatory List
Investment Priorities Plan 2014-2016
Industrial Tree Plantations
Exploration, Mining & Processing of Minerals
Publication or Printing of Books
Refining, Storage, Marketing & Distribution of
Petroleum Products
Rehabilitation, Self-Development and Self-Reliance
of Persons with Disability
Renewable Energy
Tourism

22
Priority Products/Services
1. Food Products• Premium food products
• Ingredients (industrial, food service)
• Halal
2. Engineering Services (Engineering, Architecture, and
Maintenance, Repair and Overhaul or
MRO of aircraft)
3. IT Services (BPM particularly in finance and
accounting, animation)
Priority Sectors
1. Agribusiness & Food Processing• Plantations
• Value-added Processing (Ingredients)
• Halal
2. Services * IT BPM (Finance & Accounting,
Customer Relations Management,
Animation, Gaming, Health Information
Management)
* Engineering Services (MRO)
3. Infrastructure & PPP Projects
4. Start Ups
Exports Investments
PRIORITY SECTORS FOR PROMOTION
23
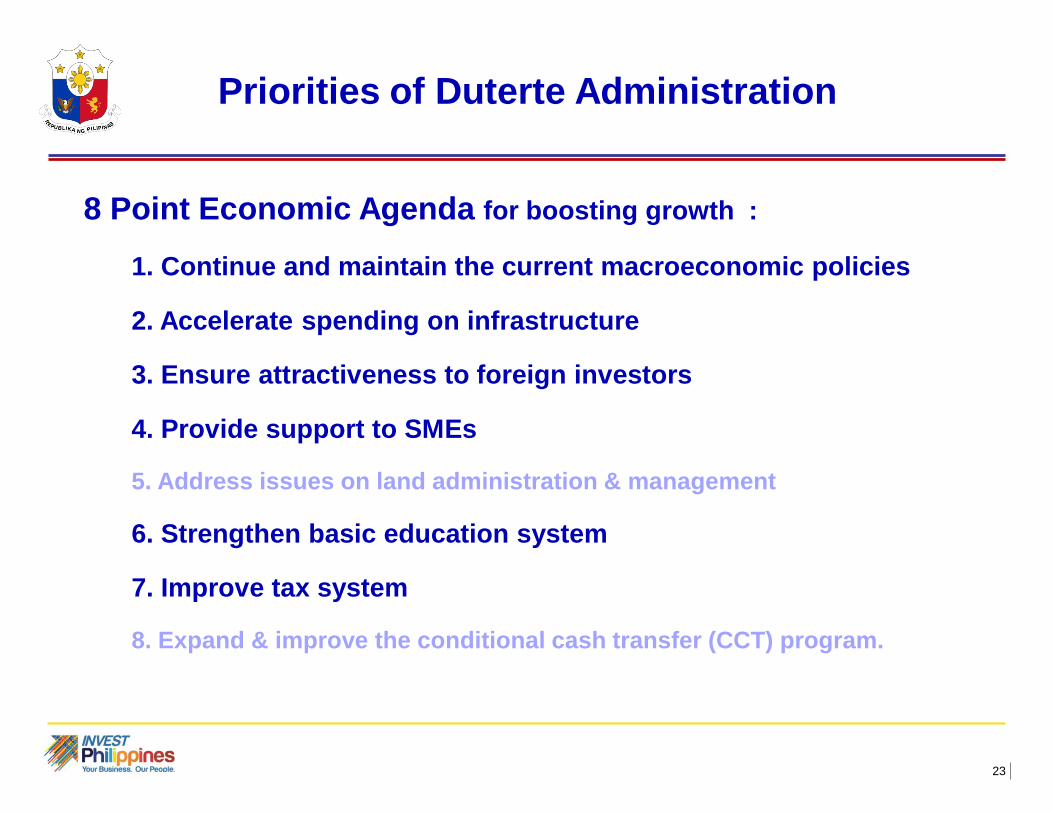
8 Point Economic Agenda for boosting growth :
1. Continue and maintain the current macroeconomic policies
2. Accelerate spending on infrastructure
3. Ensure attractiveness to foreign investors
4. Provide support to SMEs
5. Address issues on land administration & management
6. Strengthen basic education system
7. Improve tax system
8. Expand & improve the conditional cash transfer (CCT) program.
Priorities of Duterte Administration

24
TRADING PARTNER IN ASEANSOURCE OF INVESTMENTS IN ASEAN
SOURCE OF INVESTMENTS WORLDWIDE
TOURISTS, GROWING 18%
#5
181,000
Singapore is part of Philippine Growth Story
The Philippines can be your Growth Story!

25
WHO Glenn G. Peñaranda Commercial Counsellor
WHERE
Your link to opportunities in ASEAN...
07-234 Faber House, 230 Orchard Road, Singapore 238854
(+65) 6887 3186
PhilTradeSG
PhilippineTradeSG philtradesg
www.philippine-embassy.org.sg
-> Doing BusinessThank you!
Philippine Trade & Investment Centre -Singapore
Philippine Trade and Investment Centre - Singapore