Embed Size (px)
Citation preview
Country Profile 2005
PhilippinesThis Country Profile is a reference work, analysing thecountry's history, politics, infrastructure and economy. It isrevised and updated annually. The Economist IntelligenceUnit's Country Reports analyse current trends and provide atwo-year forecast.
The full publishing schedule for Country Profiles is nowavailable on our website at http://www.eiu.com/schedule
The Economist Intelligence Unit15 Regent St, London SW1Y 4LRUnited Kingdom
The Economist Intelligence Unit
The Economist Intelligence Unit is a specialist publisher serving companies establishing and managingoperations across national borders. For over 50 years it has been a source of information on businessdevelopments, economic and political trends, government regulations and corporate practice worldwide.
The Economist Intelligence Unit delivers its information in four ways: through its digital portfolio, where itslatest analysis is updated daily; through printed subscription products ranging from newsletters to annualreference works; through research reports; and by organising seminars and presentations. The firm is amember of The Economist Group.
LondonThe Economist Intelligence Unit15 Regent StLondonSW1Y 4LRUnited KingdomTel: (44.20) 7830 1007Fax: (44.20) 7830 1023E-mail: [email protected]
New YorkThe Economist Intelligence UnitThe Economist Building111 West 57th StreetNew YorkNY 10019, USTel: (1.212) 554 0600Fax: (1.212) 586 0248E-mail: [email protected]
Hong KongThe Economist Intelligence Unit60/F, Central Plaza18 Harbour RoadWanchaiHong KongTel: (852) 2585 3888Fax: (852) 2802 7638E-mail: [email protected]
Website: www.eiu.com
Electronic deliveryThis publication can be viewed by subscribing online at www.store.eiu.com
Reports are also available in various other electronic formats, such as CD-ROM, Lotus Notes, on-line databasesand as direct feeds to corporate intranets. For further information, please contact your nearest EconomistIntelligence Unit office
Copyright© 2005 The Economist Intelligence Unit Limited. All rights reserved. Neither this publication norany part of it may be reproduced, stored in a retrieval system, or transmitted in any form or by any means,electronic, mechanical, photocopying, recording or otherwise, without the prior permissionof The Economist Intelligence Unit Limited.
All information in this report is verified to the best of the author's and the publisher's ability. However, theEconomist Intelligence Unit does not accept responsibility for any loss arising from reliance on it.
ISSN 0269-5979
Symbols for tables"n/a" means not available; "�" means not applicable
Printed and distributed by Patersons Dartford, Questor Trade Park, 151 Avery Way, Dartford, Kent DA1 1JS, UK.
MANILA Quezon City
Cebu
Davao
San JoseSan Jose
Ilagan
SanSantiago
Tuguegarao
San Vicente
Cabanatuan
PasigPasig
Puerto Princesa
Roxas
Brooke�s Point
Quezon
El Nido
Zamboanga
Lamitan
Jolo
DapitanCagayan de OroCagayan de Oro
BacoloBacolod
ButuanGingoogGingoog
Tandag
Surigao
Talibon
Catbalogan
CalbayogCalbayog
Laoang
Balangkayan
Allen
Cadiz
DanaoBaybay
Sorsogon
Coron
CalapanCalapan
Roxas
Looc
Pinamalayan
Santa CruzBoac
LucenaVirac
Bulan
Legaspi
Libmanan NNaga
DaetLopez
San PaSan Pablo
MalolosMalolosSan FernSan Fernando
clobanTaclobanOrmoc
Bayugan
Bislig
Mat
Malaybalay
MINDANAOMINDANAO
SAMAR
LUZONLUZON
MINDORO
PANAYPANAY
NEGROS
LEYTE
Sulu Sea
Celebes Sea
Basilan Is.
Jolo Is.
Pangutaran Is.
Buluanga Is.
Culion Is.
Lubang Is.
Pollilo Is.
Batan Is.
Babuyan Is.
Dumaran Is.
Scarborough Shoal
Balabac Is.
Cagayan Is.
Tawitawi Is.
Tapul Is.
Cuyo Is.
Camiguin Is.
Siquijor Is.
Siargao Is.
Dinagat Is.
LeyteGulf
Moro Gulf
Tablas Is.
Burias Is.
Catanduanes
Masbate Is.
VisayanSea
Sibuyan
Sea
BOHOLBOHOL
PALAWAN
CEBCEBU
South China Sea
Philippine Sea
Iligan
Tagum
General Santos
Datu Piang
Polomoloc
Dipolog
TanjayDumaguete
Bais
IloiloIloiloBago
onCanlaon
Cauayan
n CarSan Carlos
Roxas
Masbate
IrigaIriga
Cotabato
PagadianPagadian
OzamizOzamiz
Tarlac
CarlosSan Carlos
Alaminos
ngelesAngeles
Olongapo
Mariveles
Iba
Batangas
ayTagaytay
CaviteCavite
Mamburao
San Jose
San Fernando
BanaueBanaue
TabukTabuk
Laoag
Vigan
AparriAparri
DagupanDagupan
BaguioBaguioBayombongBayombong
Luzon Strait
DavaoGulf
Balintang Channel
Babuyan Ch a n nel
Bohol Sea
PHILIPPINES
MALAYSIA(SABAH)
Mindoro
Strait
CagayanR.
CagayanR.
' The Economist Intelligence Unit Limited 2005
August 2005
Main railway
Main road
International boundary
Main airport
Capital
Major town
Other town
PHILIPPINES
MALAYSIA
VIETNAM
SpratlyIslands
PACIFICOCEAN
INDIANOCEAN
ParacelIslands
LAOSLAOS
CAMBODIA
MYANMAR
THAILANDTHAILAND
BRUNEI
TAIWANCHINA
I N D O N E S I ASINGAPORE0 km 100 200 300
0 miles 100 200
Country Profile 2005 www.eiu.com © The Economist Intelligence Unit Limited 2005
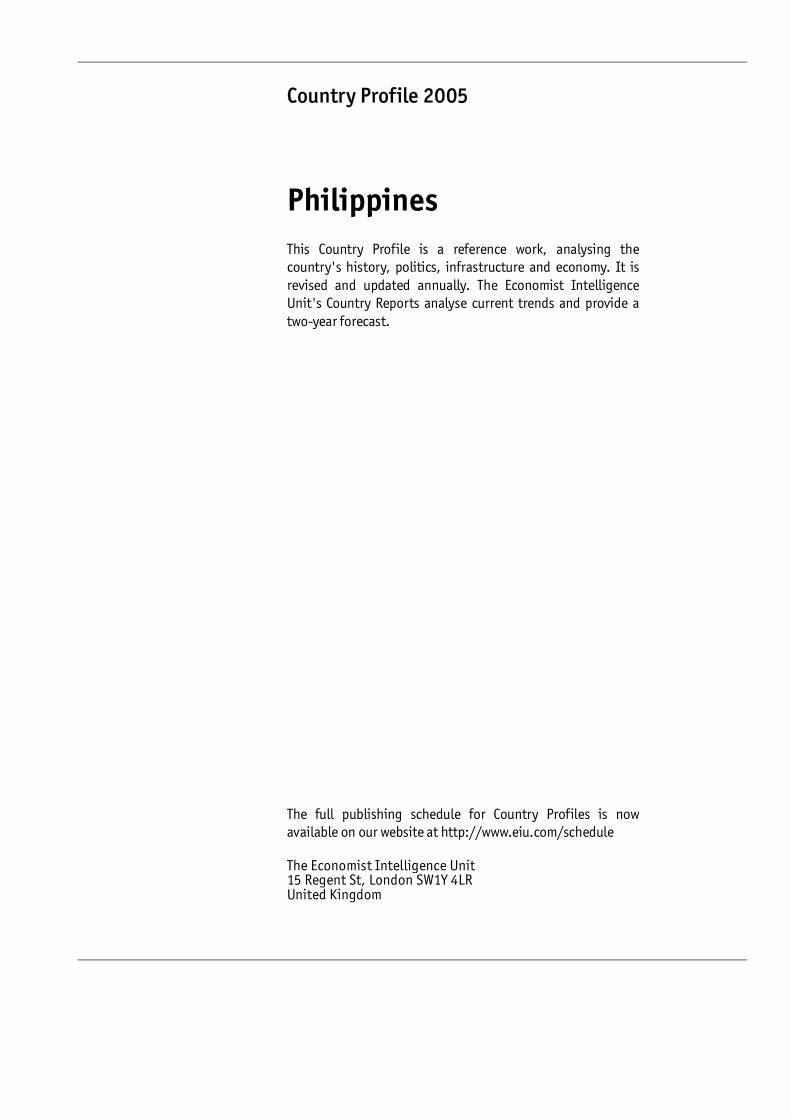
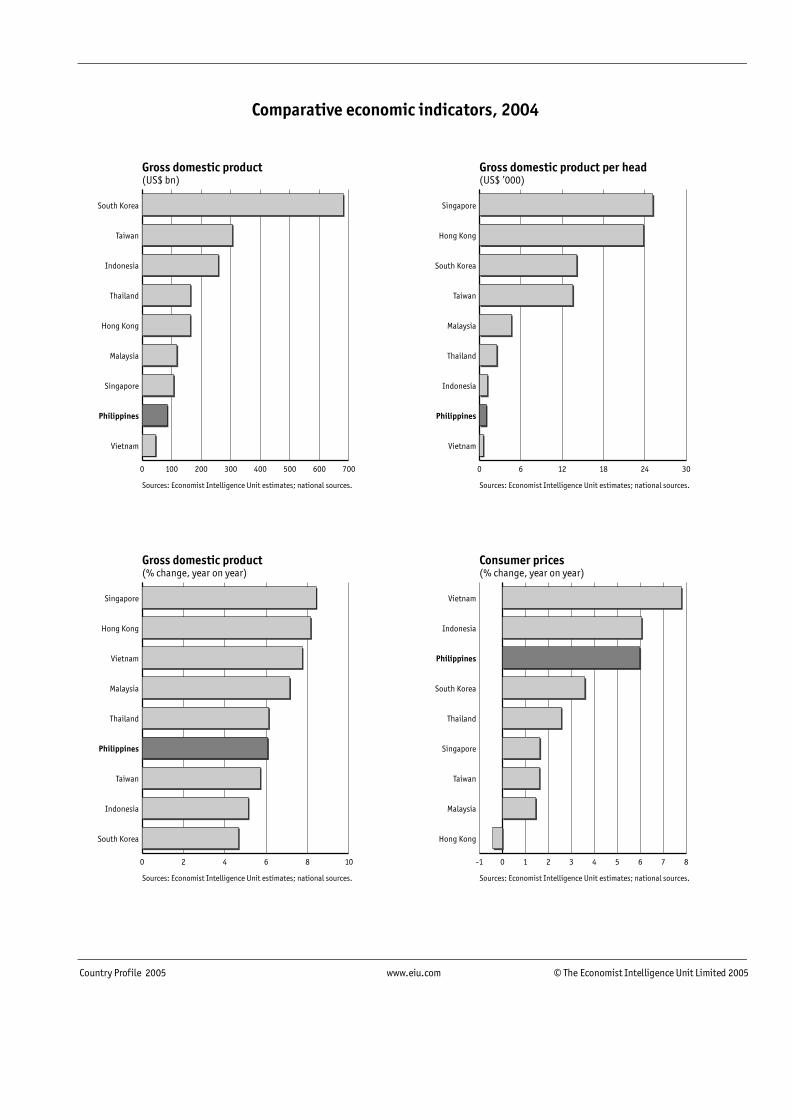
Comparative economic indicators, 2004
Gross domestic product(US$ bn)
Sources: Economist Intelligence Unit estimates; national sources.
0 100 200 300 400 500 600 700
Vietnam
Philippines
Singapore
Malaysia
Hong Kong
Thailand
Indonesia
Taiwan
South Korea
0 6 12 18 24 30
Vietnam
Philippines
Indonesia
Thailand
Malaysia
Taiwan
South Korea
Hong Kong
Singapore
-1 0 1 2 3 4 5 6 7 8
Hong Kong
Malaysia
Taiwan
Singapore
Thailand
South Korea
Philippines
Indonesia
Vietnam
0 2 4 6 8 10
South Korea
Indonesia
Taiwan
Philippines
Thailand
Malaysia
Vietnam
Hong Kong
Singapore
Gross domestic product(% change, year on year)
Sources: Economist Intelligence Unit estimates; national sources.
Consumer prices(% change, year on year)
Sources: Economist Intelligence Unit estimates; national sources.
Gross domestic product per head(US$ �000)
Sources: Economist Intelligence Unit estimates; national sources.
Philippines 1
© The Economist Intelligence Unit Limited 2005 www.eiu.com Country Profile 2005
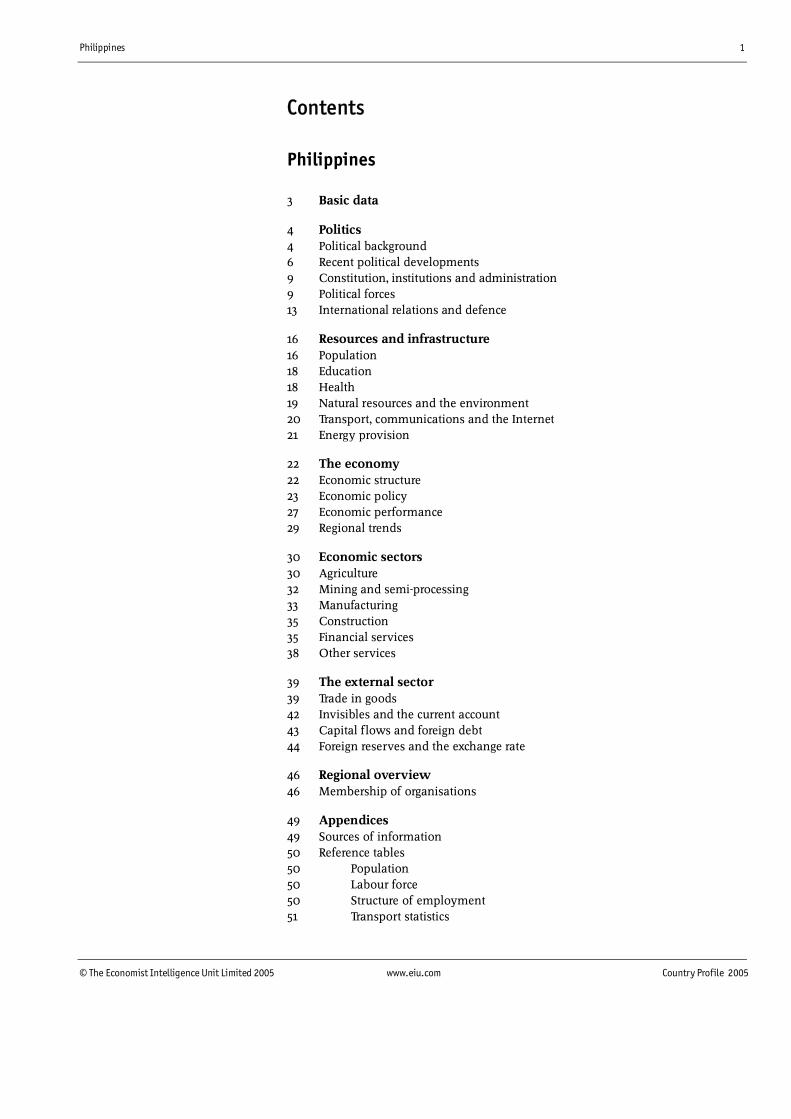
Contents
Philippines
3 Basic data
4 Politics4 Political background6 Recent political developments9 Constitution, institutions and administration9 Political forces13 International relations and defence
16 Resources and infrastructure16 Population18 Education18 Health19 Natural resources and the environment20 Transport, communications and the Internet21 Energy provision
22 The economy22 Economic structure23 Economic policy27 Economic performance29 Regional trends
30 Economic sectors30 Agriculture32 Mining and semi-processing33 Manufacturing35 Construction35 Financial services38 Other services
39 The external sector39 Trade in goods42 Invisibles and the current account43 Capital flows and foreign debt44 Foreign reserves and the exchange rate
46 Regional overview46 Membership of organisations
49 Appendices49 Sources of information50 Reference tables50 Population50 Labour force50 Structure of employment51 Transport statistics
2 Philippines
Country Profile 2005 www.eiu.com © The Economist Intelligence Unit Limited 2005
51 Energy consumption by source51 Outstanding public-sector debt52 Government revenue and expenditure52 Money supply and credit52 Interest rates53 Gross domestic product53 Gross domestic product by expenditure54 Gross domestic product by sector54 Prices54 Meat production55 Production of major crops55 Output of wood products55 Fishing production55 Private construction56 Mineral production56 Manufacturing production56 Philippines Stock Exchange indicators57 Visitor arrivals by country/region of residence57 Exports57 Imports58 Key commodity exports58 Main trading partners59 Balance of payments, IMF series60 External debt60 Net official development assistancea61 Foreign reserves61 Exchange rates
Philippines 3
© The Economist Intelligence Unit Limited 2005 www.eiu.com Country Profile 2005
Philippines
Basic data
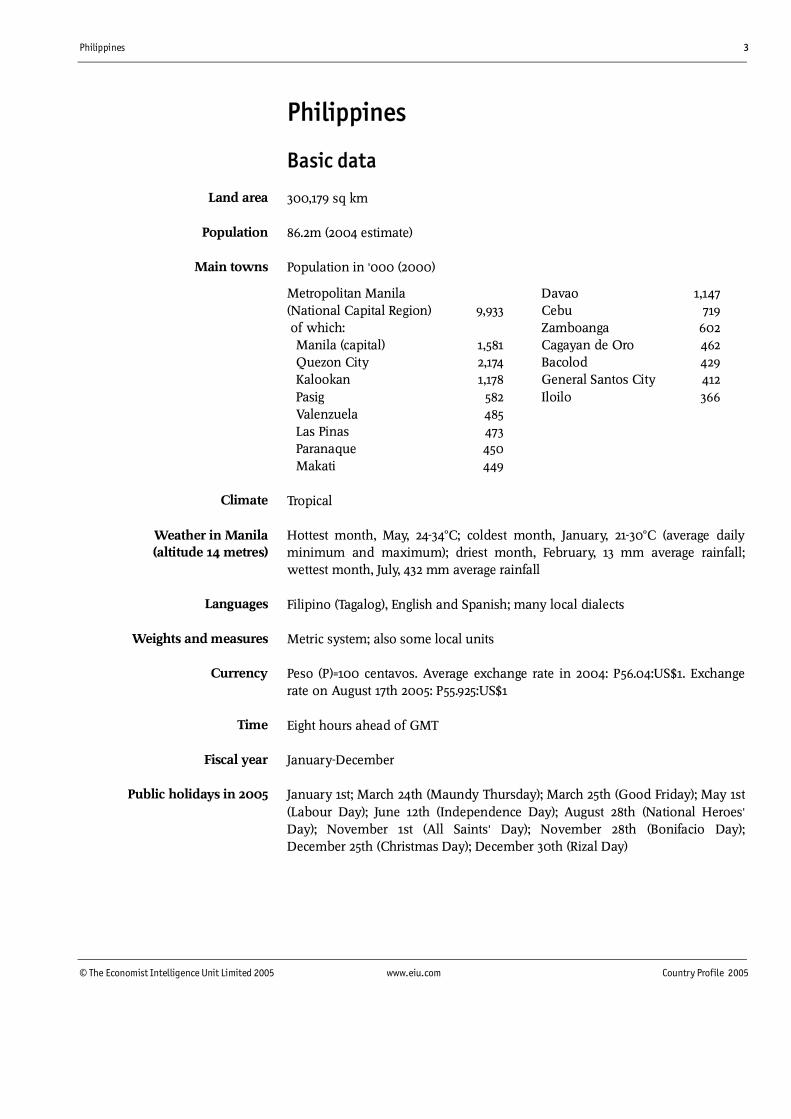
300,179 sq km
86.2m (2004 estimate)
Population in '000 (2000)
Metropolitan Manila Davao 1,147(National Capital Region) 9,933 Cebu 719 of which: Zamboanga 602 Manila (capital) 1,581 Cagayan de Oro 462 Quezon City 2,174 Bacolod 429 Kalookan 1,178 General Santos City 412 Pasig 582 Iloilo 366 Valenzuela 485 Las Pinas 473 Paranaque 450 Makati 449
Tropical
Hottest month, May, 24-34°C; coldest month, January, 21-30°C (average dailyminimum and maximum); driest month, February, 13 mm average rainfall;wettest month, July, 432 mm average rainfall
Filipino (Tagalog), English and Spanish; many local dialects
Metric system; also some local units
Peso (P)=100 centavos. Average exchange rate in 2004: P56.04:US$1. Exchangerate on August 17th 2005: P55.925:US$1
Eight hours ahead of GMT
January-December
January 1st; March 24th (Maundy Thursday); March 25th (Good Friday); May 1st(Labour Day); June 12th (Independence Day); August 28th (National Heroes'Day); November 1st (All Saints' Day); November 28th (Bonifacio Day);December 25th (Christmas Day); December 30th (Rizal Day)
Land area
Population
Main towns
Weather in Manila(altitude 14 metres)
Languages
Weights and measures
Currency
Time
Fiscal year
Public holidays in 2005
Climate
4 Philippines
Country Profile 2005 www.eiu.com © The Economist Intelligence Unit Limited 2005
Politics
The Philippines is a pluralist democracy modelled on the US, with an executivepresidency, a bicameral Congress and a Supreme Court that can rule on theconstitutionality of government actions. In January 2001 Gloria MacapagalArroyo, then vice-president, replaced the incumbent president, Joseph Estrada,in a civilian coup backed by the military. She served out the remainder of hissix-year term before winning re-election in her own right in the May 10th 2004presidential election. The congressional elections held on the same dayproduced a large pro-administration majority, headed by the president's party,Lakas ng Edsa-National Union of Christian Democrats (Lakas), in the House ofRepresentatives (the lower house) and gave the president a larger majority inthe Senate (the upper house). Concerns over the legitimacy of Ms MacapagalArroyo's presidential victory have emerged, plunging the Philippines into anongoing political crisis.
Political background
The Philippine islands, inhabited by Malay peoples, were a colony of Spainfrom the late 1500s until the end of the 19th century. In the early 19th centurythat export crops�sugar, coconuts, abaca (Manila hemp) and tobacco�weredeveloped. At the same time a Chinese entrepreneurial class evolved, marryinginto the indigenous population and forming an elite based on land ownership.Spanish colonial rule ended in December 1898 after the US intervened in apopular rebellion that had broken out two years earlier. Spain ceded thePhilippines to the US. In 1934 the Philippines became an internally self-governing commonwealth, with full independence scheduled for July 4th 1946.The transition to independence was interrupted by the Japanese invasion ofDecember 1941. The Japanese occupation and the battle for liberation destroyedmuch of the Philippines' physical infrastructure.
The independent republic, inaugurated on schedule in 1946, maintainedpreferential economic relations with the US. The constitution was modelled onthat of the US and, as in Washington, power tended to alternate between twoparties, the Nationalists and the Liberals. The fairly peaceful alternation inpower within the political elite was interrupted in September 1972 as thepresident, Ferdinand Marcos, neared the end of his second term. Citing thethreat from "subversive forces", Mr Marcos imposed martial law.
For the next 13 years, until 1986, the Philippines experienced "constitutionalauthoritarianism". The most effective opposition came from the communistNew People's Army (NPA), which was active in rural areas, and from thesouthern areas, where a secessionist Muslim movement had been active sincebefore the introduction of martial law. The situation changed radically inAugust 1983, when Benigno Aquino, the opposition leader regarded as the mostcredible alternative to Mr Marcos, was assassinated minutes after his returnfrom exile and while under military escort. A series of massive demonstrationsfollowed. To reassert his own supremacy, Mr Marcos called an early
The colonial andcommonwealth periods
An independent republicclosely tied to the US
The Marcos autocracy
Philippines 5
© The Economist Intelligence Unit Limited 2005 www.eiu.com Country Profile 2005
presidential election for February 1986. In a close-run contest he was narrowlydefeated by the candidate of a temporarily united opposition, Corazon Aquino,Mr Aquino's widow. The attempt by Mr Marcos to hold on to power set off acoup attempt by the military, backed by the deputy chief of staff, Fidel Ramos,and the defence minister. This received critically important backing fromMrs Aquino's People's Power movement and the local Catholic Church. Underpressure from the US, Mr Marcos went into voluntary exile in Hawaii, where hedied in 1989.
Under the new regime civil liberties were restored, political prisoners werereleased and an attempt was made to negotiate with the NPA. A newconstitution, drawn up by a convention appointed by Mrs Aquino, largelyrestored the set-up that existed before 1972, but with new controls on thepresidency. From July 1986 there was a series of attempted coups, and rumoursof coups, in which elements of the military were involved. In all cases theloyalty of the then chief of staff, Mr Ramos, was critical. Meanwhile, the reformhopes of the early days faded. The much-vaunted land reform was stalled bybureaucratic delay and landlord opposition, widespread corruption continuedand the government was perceived as ineffectual.
Mr Ramos won the mid-1992 presidential election. Within months of coming topower he had built up a large pro-government majority in Congress, secured acessation of hostilities by dissident military groups and begun the process ofpeace negotiations with both communist and Muslim secessionist rebels. Aceasefire was agreed with the Muslim rebels in late 1993, and the communistinsurgency began to weaken. However, deep-rooted economic and socialproblems remained largely unresolved. The president came under increasingpressure from some of his supporters to stand for a second term in 1998. Butthis would have required a revision of the 1987 constitution, and was stronglyopposed by the Roman Catholic church, opposition politicians and someprominent business people, all of whom feared a drift to a constitutionallyrigged autocracy on the Marcos precedent. Mr Ramos endorsed the secretary-general of Lakas as his nominee for the presidency in November 1997.
In the presidential election of May 1998 the administration's candidate wasbeaten by a wide margin by the popular vice-president and former film star,Joseph Estrada. Mr Estrada, who was backed by an alliance of the twoopposition parties, the Nationalist People's Coalition (NPC) and Laban ngDemokratikong Pilipino (Laban, or Struggle for a Democratic Philippines; thepro-administration party under Mrs Aquino), won 40% of the vote in a field often candidates. The Lakas candidate for the vice-presidency, Gloria MacapagalArroyo, won even more resoundingly, with 50% support. The coalition backingMr Estrada won only around 60 of the 208 directly elected seats in the Houseof Representatives, but as the party of the presidential incumbent, renamedLaban ng Masang Pilipino (LAMP, Struggle of the Filipino Masses), it attractedenough defections from Lakas to build a large majority in the lower house byend-1998.
Joseph Estrada is electedpresident by a wide margin
The return to a free democracy
Political stability underFidel Ramos
6 Philippines
Country Profile 2005 www.eiu.com © The Economist Intelligence Unit Limited 2005
Recent political developments
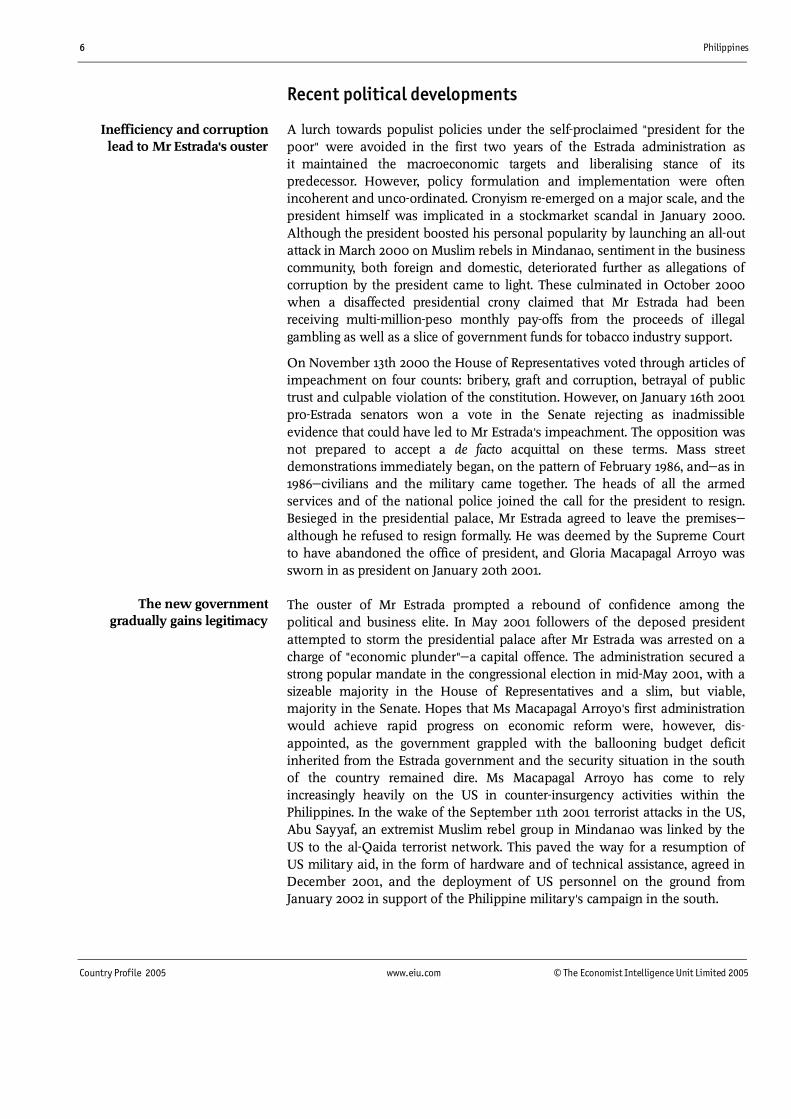
A lurch towards populist policies under the self-proclaimed "president for thepoor" were avoided in the first two years of the Estrada administration asit maintained the macroeconomic targets and liberalising stance of itspredecessor. However, policy formulation and implementation were oftenincoherent and unco-ordinated. Cronyism re-emerged on a major scale, and thepresident himself was implicated in a stockmarket scandal in January 2000.Although the president boosted his personal popularity by launching an all-outattack in March 2000 on Muslim rebels in Mindanao, sentiment in the businesscommunity, both foreign and domestic, deteriorated further as allegations ofcorruption by the president came to light. These culminated in October 2000when a disaffected presidential crony claimed that Mr Estrada had beenreceiving multi-million-peso monthly pay-offs from the proceeds of illegalgambling as well as a slice of government funds for tobacco industry support.
On November 13th 2000 the House of Representatives voted through articles ofimpeachment on four counts: bribery, graft and corruption, betrayal of publictrust and culpable violation of the constitution. However, on January 16th 2001pro-Estrada senators won a vote in the Senate rejecting as inadmissibleevidence that could have led to Mr Estrada's impeachment. The opposition wasnot prepared to accept a de facto acquittal on these terms. Mass streetdemonstrations immediately began, on the pattern of February 1986, and�as in1986�civilians and the military came together. The heads of all the armedservices and of the national police joined the call for the president to resign.Besieged in the presidential palace, Mr Estrada agreed to leave the premises�although he refused to resign formally. He was deemed by the Supreme Courtto have abandoned the office of president, and Gloria Macapagal Arroyo wassworn in as president on January 20th 2001.
The ouster of Mr Estrada prompted a rebound of confidence among thepolitical and business elite. In May 2001 followers of the deposed presidentattempted to storm the presidential palace after Mr Estrada was arrested on acharge of "economic plunder"�a capital offence. The administration secured astrong popular mandate in the congressional election in mid-May 2001, with asizeable majority in the House of Representatives and a slim, but viable,majority in the Senate. Hopes that Ms Macapagal Arroyo's first administrationwould achieve rapid progress on economic reform were, however, dis-appointed, as the government grappled with the ballooning budget deficitinherited from the Estrada government and the security situation in the southof the country remained dire. Ms Macapagal Arroyo has come to relyincreasingly heavily on the US in counter-insurgency activities within thePhilippines. In the wake of the September 11th 2001 terrorist attacks in the US,Abu Sayyaf, an extremist Muslim rebel group in Mindanao was linked by theUS to the al-Qaida terrorist network. This paved the way for a resumption ofUS military aid, in the form of hardware and of technical assistance, agreed inDecember 2001, and the deployment of US personnel on the ground fromJanuary 2002 in support of the Philippine military's campaign in the south.
Inefficiency and corruptionlead to Mr Estrada's ouster
The new governmentgradually gains legitimacy
Philippines 7
© The Economist Intelligence Unit Limited 2005 www.eiu.com Country Profile 2005
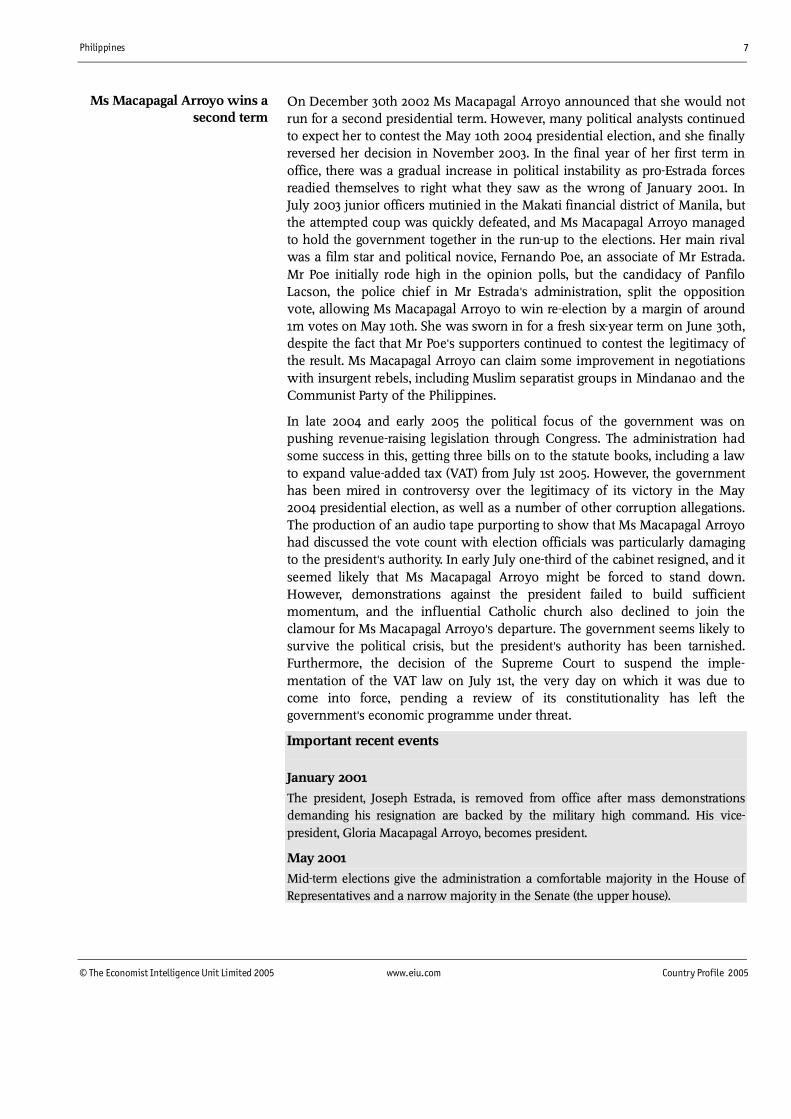
On December 30th 2002 Ms Macapagal Arroyo announced that she would notrun for a second presidential term. However, many political analysts continuedto expect her to contest the May 10th 2004 presidential election, and she finallyreversed her decision in November 2003. In the final year of her first term inoffice, there was a gradual increase in political instability as pro-Estrada forcesreadied themselves to right what they saw as the wrong of January 2001. InJuly 2003 junior officers mutinied in the Makati financial district of Manila, butthe attempted coup was quickly defeated, and Ms Macapagal Arroyo managedto hold the government together in the run-up to the elections. Her main rivalwas a film star and political novice, Fernando Poe, an associate of Mr Estrada.Mr Poe initially rode high in the opinion polls, but the candidacy of PanfiloLacson, the police chief in Mr Estrada's administration, split the oppositionvote, allowing Ms Macapagal Arroyo to win re-election by a margin of around1m votes on May 10th. She was sworn in for a fresh six-year term on June 30th,despite the fact that Mr Poe's supporters continued to contest the legitimacy ofthe result. Ms Macapagal Arroyo can claim some improvement in negotiationswith insurgent rebels, including Muslim separatist groups in Mindanao and theCommunist Party of the Philippines.
In late 2004 and early 2005 the political focus of the government was onpushing revenue-raising legislation through Congress. The administration hadsome success in this, getting three bills on to the statute books, including a lawto expand value-added tax (VAT) from July 1st 2005. However, the governmenthas been mired in controversy over the legitimacy of its victory in the May2004 presidential election, as well as a number of other corruption allegations.The production of an audio tape purporting to show that Ms Macapagal Arroyohad discussed the vote count with election officials was particularly damagingto the president's authority. In early July one-third of the cabinet resigned, and itseemed likely that Ms Macapagal Arroyo might be forced to stand down.However, demonstrations against the president failed to build sufficientmomentum, and the influential Catholic church also declined to join theclamour for Ms Macapagal Arroyo's departure. The government seems likely tosurvive the political crisis, but the president's authority has been tarnished.Furthermore, the decision of the Supreme Court to suspend the imple-mentation of the VAT law on July 1st, the very day on which it was due tocome into force, pending a review of its constitutionality has left thegovernment's economic programme under threat.
Important recent events
January 2001
The president, Joseph Estrada, is removed from office after mass demonstrationsdemanding his resignation are backed by the military high command. His vice-president, Gloria Macapagal Arroyo, becomes president.
May 2001
Mid-term elections give the administration a comfortable majority in the House ofRepresentatives and a narrow majority in the Senate (the upper house).
Ms Macapagal Arroyo wins asecond term
8 Philippines
Country Profile 2005 www.eiu.com © The Economist Intelligence Unit Limited 2005
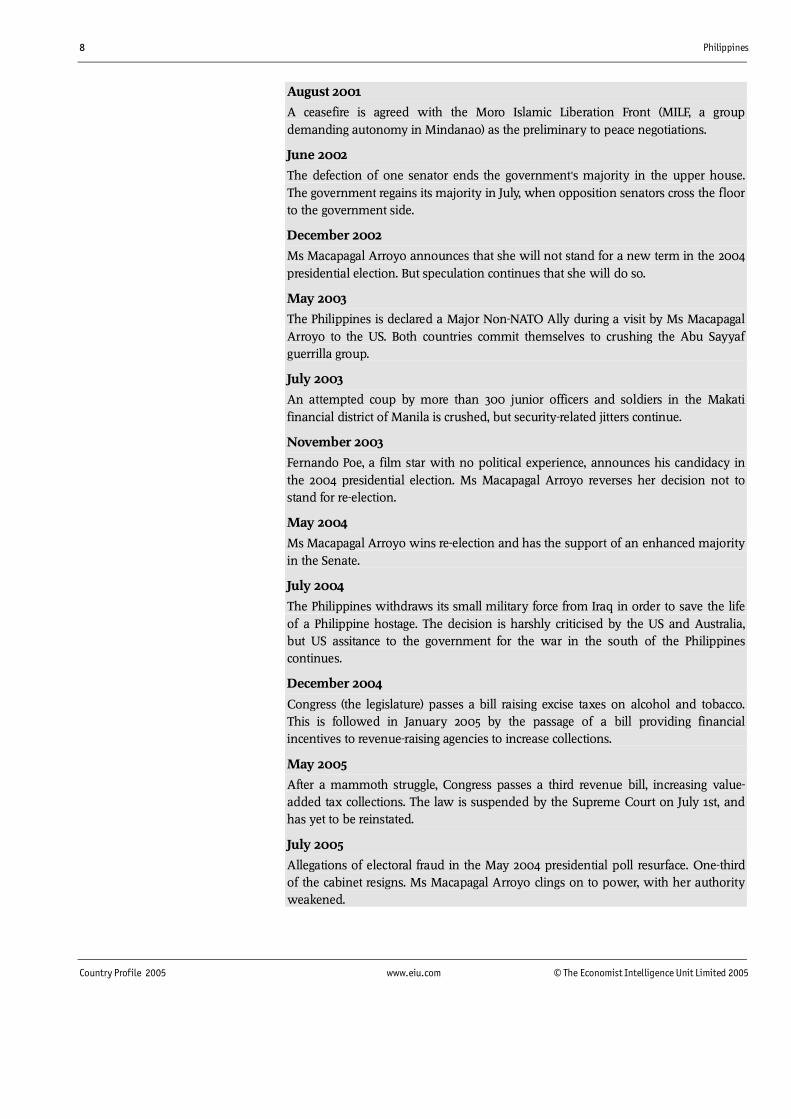
August 2001
A ceasefire is agreed with the Moro Islamic Liberation Front (MILF, a groupdemanding autonomy in Mindanao) as the preliminary to peace negotiations.
June 2002
The defection of one senator ends the government's majority in the upper house.The government regains its majority in July, when opposition senators cross the floorto the government side.
December 2002
Ms Macapagal Arroyo announces that she will not stand for a new term in the 2004presidential election. But speculation continues that she will do so.
May 2003
The Philippines is declared a Major Non-NATO Ally during a visit by Ms MacapagalArroyo to the US. Both countries commit themselves to crushing the Abu Sayyafguerrilla group.
July 2003
An attempted coup by more than 300 junior officers and soldiers in the Makatifinancial district of Manila is crushed, but security-related jitters continue.
November 2003
Fernando Poe, a film star with no political experience, announces his candidacy inthe 2004 presidential election. Ms Macapagal Arroyo reverses her decision not tostand for re-election.
May 2004
Ms Macapagal Arroyo wins re-election and has the support of an enhanced majorityin the Senate.
July 2004
The Philippines withdraws its small military force from Iraq in order to save the lifeof a Philippine hostage. The decision is harshly criticised by the US and Australia,but US assitance to the government for the war in the south of the Philippinescontinues.
December 2004
Congress (the legislature) passes a bill raising excise taxes on alcohol and tobacco.This is followed in January 2005 by the passage of a bill providing financialincentives to revenue-raising agencies to increase collections.
May 2005
After a mammoth struggle, Congress passes a third revenue bill, increasing value-added tax collections. The law is suspended by the Supreme Court on July 1st, andhas yet to be reinstated.
July 2005
Allegations of electoral fraud in the May 2004 presidential poll resurface. One-thirdof the cabinet resigns. Ms Macapagal Arroyo clings on to power, with her authorityweakened.
Philippines 9
© The Economist Intelligence Unit Limited 2005 www.eiu.com Country Profile 2005
Constitution, institutions and administration
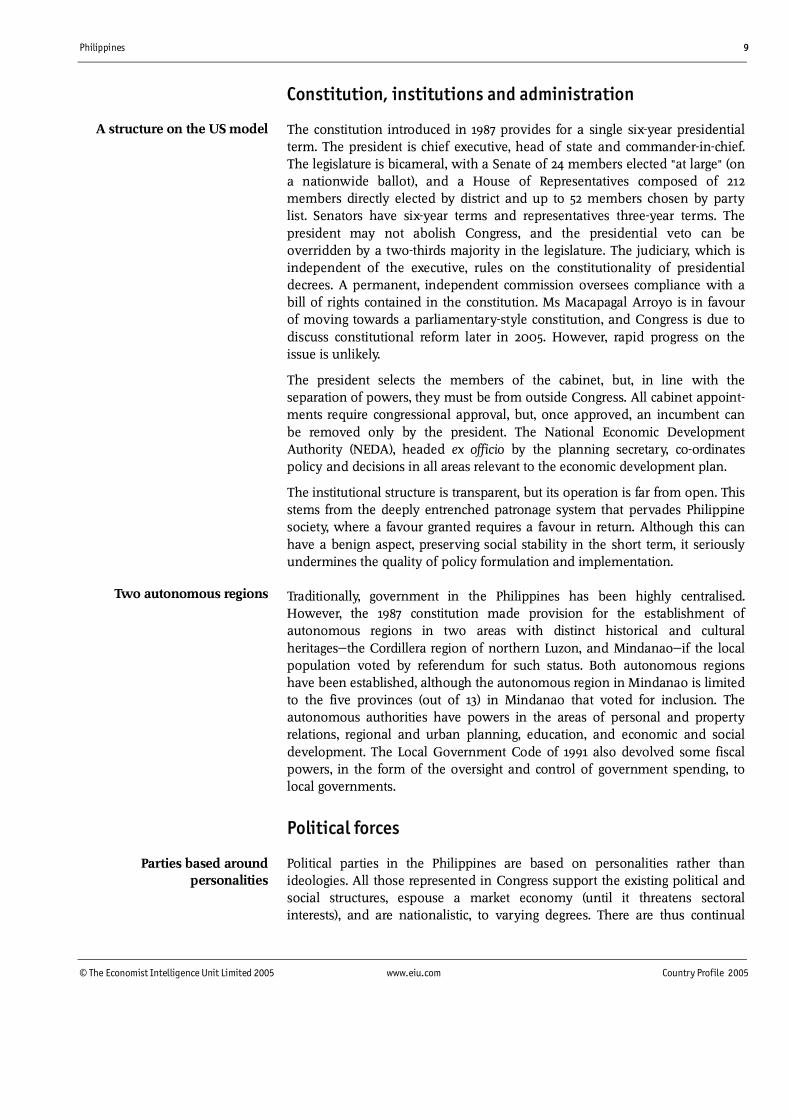
The constitution introduced in 1987 provides for a single six-year presidentialterm. The president is chief executive, head of state and commander-in-chief.The legislature is bicameral, with a Senate of 24 members elected "at large" (ona nationwide ballot), and a House of Representatives composed of 212members directly elected by district and up to 52 members chosen by partylist. Senators have six-year terms and representatives three-year terms. Thepresident may not abolish Congress, and the presidential veto can beoverridden by a two-thirds majority in the legislature. The judiciary, which isindependent of the executive, rules on the constitutionality of presidentialdecrees. A permanent, independent commission oversees compliance with abill of rights contained in the constitution. Ms Macapagal Arroyo is in favourof moving towards a parliamentary-style constitution, and Congress is due todiscuss constitutional reform later in 2005. However, rapid progress on theissue is unlikely.
The president selects the members of the cabinet, but, in line with theseparation of powers, they must be from outside Congress. All cabinet appoint-ments require congressional approval, but, once approved, an incumbent canbe removed only by the president. The National Economic DevelopmentAuthority (NEDA), headed ex officio by the planning secretary, co-ordinatespolicy and decisions in all areas relevant to the economic development plan.
The institutional structure is transparent, but its operation is far from open. Thisstems from the deeply entrenched patronage system that pervades Philippinesociety, where a favour granted requires a favour in return. Although this canhave a benign aspect, preserving social stability in the short term, it seriouslyundermines the quality of policy formulation and implementation.
Traditionally, government in the Philippines has been highly centralised.However, the 1987 constitution made provision for the establishment ofautonomous regions in two areas with distinct historical and culturalheritages�the Cordillera region of northern Luzon, and Mindanao�if the localpopulation voted by referendum for such status. Both autonomous regionshave been established, although the autonomous region in Mindanao is limitedto the five provinces (out of 13) in Mindanao that voted for inclusion. Theautonomous authorities have powers in the areas of personal and propertyrelations, regional and urban planning, education, and economic and socialdevelopment. The Local Government Code of 1991 also devolved some fiscalpowers, in the form of the oversight and control of government spending, tolocal governments.
Political forces
Political parties in the Philippines are based on personalities rather thanideologies. All those represented in Congress support the existing political andsocial structures, espouse a market economy (until it threatens sectoralinterests), and are nationalistic, to varying degrees. There are thus continual
Parties based aroundpersonalities
A structure on the US model
Two autonomous regions
10 Philippines
Country Profile 2005 www.eiu.com © The Economist Intelligence Unit Limited 2005
shifts in allegiance. The president tends to attract a greater following inCongress than the election results would indicate, at least in the early years ofhis term. In the final years of a presidential term of office the parties tend tosplinter as presidential hopefuls emerge and the president has only limitedpatronage to offer.
Following the congressional elections in May 2004, the three major partiesrepresented in Congress were as follows.
The largest party in Congress is the pro-government Lakas ng Edsa-NationalUnion of Christian Democrats (Lakas), which was formed in 1992 to supportthe presidential candidacy of Mr Ramos. Its strength in Congress was erodedafter the May 1998 election, which brought Joseph Estrada to power, but surgedonce more in the 2001 mid-term election following the assumption of thepresidency by the Lakas vice-president, Ms Macapagal Arroyo. Lakas won 91 of212 directly elected seats in the House of Representatives in the May 2004election. Although Ms Macapagal Arroyo won the May 2004 election with thebacking of Lakas, which she co-chaired with the speaker of the House ofRepresentatives, Joe de Venecia, since the election she has attempted to reviveher personal vehicle, Kabalikat ng Malayang Pilipino (Kampi, Ally of the FreeFilipino) by persuading members of other parties to switch loyalties. In August2005 Lakas and Kampi had 79 and 35 seats respectively in the lower house.
The Nationalist People's Coalition (NPC) was originally formed to support thepresidential candidacy of Eduardo Cojuangco (a former Marcos crony) in 1992.In the 1998 election it backed Mr Estrada's presidential candidacy and was thelargest component of the pro-administration coalition, Laban ng MasangPilipino (LAMP, Struggle of the Filipino Masses, now defunct). The NPCremained part of the pro-administration coalition led by Lakas underMs Macapagal Arroyo, and won 58 seats in the May 2004 election, a tally thathad fallen to 42 by August 2005. Together the three main pro-administrationparties have a solid majority in the House of Representatives.
The Liberal Party, led by the president of the Senate, Frank Drilon, was foundedin 1946 and was the party of Ms Macapagal Arroyo's father, DiosdadoMacapagal, who was president from 1961 to 1965. The Liberal Party waspreviously part of the ruling coalition, but joined the calls for Ms MacapagalArroyo's resignation in July 2005. The party has 34 seats in the lower house.
Laban ng Demokratikong Pilipino (Laban, Struggle of the Democratic Filipino)was formed in 1988 to back the Aquino presidency. After the 1992 election itsposition as the largest party in the House of Representatives soon collapsedowing to defections to the new administration party, Lakas. The party gave itssupport to Mr Estrada in 1998 after its leader, Edgardo Angara, abandoned hisown presidential ambitions to run for the vice-presidency. Laban won only 15seats in the May 2004 election, and had only nine seats in August 2005.
Outside the mainstream of congressional politics are political forces for whichideology is the determining factor, as follows.
Lakas and Kampi
The NPC and the Liberal Party
Laban
Philippines 11
© The Economist Intelligence Unit Limited 2005 www.eiu.com Country Profile 2005
The National Democratic Front (NDF) is the umbrella organisation for theMaoist Communist Party and its military wing, the New People's Army (NPA).The Philippines has a long tradition of rural rebellion, and the NPA, founded in1969, took up the fight waged by the Hukbalahap rebel movement in Luzon inthe mid-1950s. The NPA expanded rapidly under martial law, the number of itsregulars rising to an estimated 25,000 by mid-1985. It was then thought tocontrol one-fifth of villages and to be active in 60 of the 75 provinces, as well asin the Manila region. Its attachment to the Maoist dogma that revolution mustcome from the countryside meant that it played no role as an organisation inthe overthrow of Mr Marcos. The post-Marcos regimes have eroded its popularbase by offering amnesties, the legalisation of the Communist Party (in late1992), and land and jobs to surrendering rebels, while maintaining an activemilitary campaign. Peace negotiations with the government are currently noton the agenda, owing to the NDF's insistence that the government firstpersuade the US and other governments to remove the rebel group from theirlists of terrorist organisations.
Another rebel movement, more heavily armed but less cohesive, is that of theMuslim secessionists in Mindanao. In the past, the main rebel group was theMoro National Liberation Front (MNLF). The Moro Islamic Liberation Front(MILF) has been more active in recent years. The secessionist movement has ahistory stretching back several centuries. There is no easy solution to demandsfor secession or autonomy for Mindanao, since migration from Luzon and theVisayas in the 1950s and 1960s has created a Christian majority�or near-parity�in a number of provinces in the region.
A referendum on autonomy was held in Mindanao in August 2001, but it failedto produce an agreement that the whole of Mindanao should come under thecontrol of an autonomous administration. The MILF has recently taken part inpeace talks with the government under Malaysian auspices, and these areexpected to continue, but hardliners within the rebel movement may delayprogress towards a peace accord. A more extreme group, Abu Sayyaf, which issaid to have connections with the al-Qaida international terrorist network,periodically kidnaps foreigners for ransom and is not open to the possibility ofdialogue with the government.
Another important political force is that represented by the Roman Catholicchurch. It played an active part in the civilian opposition to the Marcos regime,and helped the military rebellion that brought Mrs Aquino to power bybringing the population out on to the streets of Manila in its support. Thechurch also took the lead in demands for Mr Estrada's resignation in the wakeof the corruption allegations in late 2000. The church initially gave its blessingto Ms Macapagal Arroyo's disputed victory in the May 2004 presidentialelection, but has since called for an investigation into allegations that thepresident contacted election officials during the vote count.
The NDF rebels
The rebels in Mindanao
The Catholic church
12 Philippines
Country Profile 2005 www.eiu.com © The Economist Intelligence Unit Limited 2005
Main political figures
Gloria Macapagal Arroyo
The president, brought to power in January 2001 in a civilian coup backed by themilitary. Ms Macapagal Arroyo had been elected vice-president in May 1998, withmore than 50% of the vote. She completed the presidential term of the oustedpresident, Joseph Estrada, and won re-election in her own right in May 2004.Ms Macapagal Arroyo's first term was disappointing in terms of economic reform. Inlate 2004 and early 2005 she appeared to be moving more determinedly to addressthe parlous state of the public finances, but allegations of fraud during thepresidential election have weakened her authority and may lead to slower progresson economic reform during the remainder of her term.
Noli de Castro
Elected as vice-president in May 2004. Despite having served as a senator, Mr deCastro is a former television broadcaster, and this constituted his chief appeal to theelectorate. If Ms Macapagal Arroyo were forced out of office, Mr de Castro wouldstand a good chance of gaining the presidency.
Fidel Ramos
A former president and retired general, Mr Ramos continues to play the role of elderstatesman. His influence has been crucial in encouraging the new administration toimplement its reform agenda, and he provided vital support to the president in theshakiest days of the political crisis in early July 2005.
Joe de Venecia
The speaker of the House of Representatives (the lower house of Congress) andco-chairman of a pro-administration party, Lakas, Mr de Venecia's support for theadministration has been vital to its survival. Mr de Venecia supports reform of theconstitution in order to create a unicameral, parliamentary-style republic.
Joseph Estrada
The former president, elected in May 1998 for a six-year term with strong popularbacking. Deposed in January 2001 after the collapse of his impeachment trial inthe Senate (the lower house), he remains under arrest on charges of perjury andeconomic plunder.
Panfilo Lacson
A former police chief in the Estrada administration, Mr Lacson insisted on mountinga separate presidential bid to that of Mr Poe, thus splitting the opposition vote andhanding victory to Ms Macapagal Arroyo. Mr Lacson is surrounded by accusationsthat the Presidential Anti-Crime Commission murdered 11 criminals while heheaded it. As a senator, Mr Lacson remains a leading opponent of the adminis-tration, and has been vocal in calling for Ms Macapagal Arroyo to resign.
Organised labour has little power in the Philippines. In 2003 only 3.97mworkers�equivalent to 13% of employed Filipinos�were members of a tradeunion, although the rate is thought to be significantly higher in multinationalfirms. A tiny proportion (only 556,000 workers in 2002) are covered bycollective-bargaining agreements. This reflects the weak bargaining position ofworkers in a labour-surplus economy.
Weak trade unions
Philippines 13
© The Economist Intelligence Unit Limited 2005 www.eiu.com Country Profile 2005
International relations and defence
A continuing foreign policy priority has been the strengthening of relationswith fellow members of the Association of South-East Asian Nations, orASEAN (see Regional overview: Membership of organisations). Membership ofASEAN gives the Philippines a regional identity independent of relations withthe US. Another reason for Philippine participation in a regional body is tocounterbalance China, which is seen as a threat, notably in the dispute over theSpratly Islands in the South China Sea.
The US has maintained a special relationship, both political and economic,with the Philippines since the latter's independence in 1946. The USadministration has on a number of occasions played a pivotal role in domesticpolitical affairs, inducing Mr Marcos to leave the country in February 1986 andbacking the Aquino administration against coup attempts (on one occasionwith military aircraft). The Philippines was once home to two of the mostimportant US military bases outside US territory, the naval facility at Subic Bayand the nearby air base at Clark Field. The non-renewal of the lease on themilitary bases when it expired in 1991 was the most open sign of thePhilippines' emerging "Asian" identity.
However, the US "war on terror" and the Philippines' own problems withMuslim insurgents have led to a closer military relationship between the USand the Philippines over the past few years. The US has awarded thePhilippines Major Non-NATO Ally status, and US troops and hardware arrivedin 2002 to support the campaign against Abu Sayyaf. The US has continued toassist the Philippines militarily, despite a period of cool relations following thedecision by the Philippine government in mid-2004 to pull its troops out of Iraqin order to save the life of a Filipino hostage held by militants in that country.The US remains an important source of private investment in the Philippines,reflecting links forged during the colonial period and the early decades ofindependence; it has by far the largest Filipino community outside thePhilippines; and its culture remains the dominant foreign influence within thePhilippines.
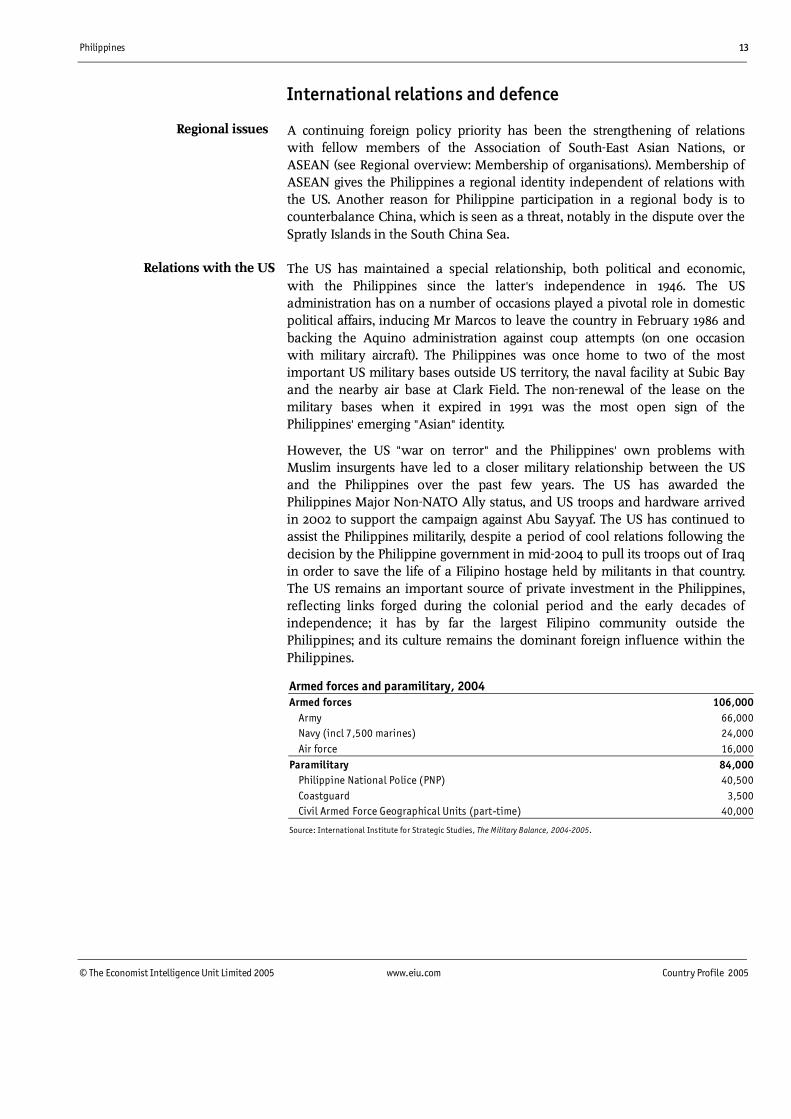
Armed forces and paramilitary, 2004Armed forces 106,000 Army 66,000 Navy (incl 7,500 marines) 24,000 Air force 16,000Paramilitary 84,000 Philippine National Police (PNP) 40,500 Coastguard 3,500 Civil Armed Force Geographical Units (part-time) 40,000
Source: International Institute for Strategic Studies, The Military Balance, 2004-2005.
Relations with the US
Regional issues
14 Philippines
Country Profile 2005 www.eiu.com © The Economist Intelligence Unit Limited 2005
Security risk in the Philippines
I. Armed conflict
Armed conflict is a regular and disturbing feature of the domestic political scene inthe Philippines. Over the years, several groups of armed rebels have been active inthe large southern island of Mindanao, seeking the creation of an independent stateon the island. The two principal secessionist movements are the Moro NationalLiberation Front (MNLF) and the Moro Islamic Liberation Front (MILF). (Moro is theterm traditionally used to describe the Muslim population of the southern islands ofthe Philippines.) The Philippine military has been battling with the rebels for nearlythree decades, although a peace agreement was signed with the MNLF in 1996. Aseparate ceasefire was reached with the MILF in August 2001, but armed conflict hascontinued. Negotiations for a permanent settlement are continuing, but may takesome time to bear fruit.The military has also fought pitched battles against yet another Mindanao rebelgroup, Abu Sayyaf. A small extremist Islamic organisation, Abu Sayyaf claims to befighting for an independent Muslim state, but in fact appears more interested inkidnapping tourists and local residents for ransom. Abu Sayyaf is famously brutal:more than a few of its kidnap victims have been beheaded. Some members of thegroup have reportedly been trained at camps in Afghanistan run by Osama binLaden's al-Qaida terrorist network. The Philippine military intensified its campaignagainst Abu Sayyaf after an American tourist was killed in mid-2001, and thecampaign has received backing in the form of both hardware and personnel fromthe US as part of its "war on terrorism". This involvement has enhanced thePhilippine military's ability to flush out Abu Sayyaf in the difficult terrain of therebel group's island base, Basilan, but could be counterproductive if it is perceived asanti-Muslim and so provokes terrorist acts in other parts of Mindanao. This area ofthe Philippines is clearly unsafe, for foreigners as well as local residents.It is important to note, however, that the Muslim insurgency is far removed from thepolitical and business centre of Manila. Investors who avoid the disputed regions areunlikely to be affected significantly by the secessionist movements and the military'sattempts to subdue them. However, the February 14th 2005 bombings in Manilaindicated that the war in the south could spill over into more central regions of thearchipelago from time to time.The challenge from the communist guerrilla movement, the New People's Army(NPA), is much reduced but not defunct. The NPA's activities are essentially confinedto attacking the security forces and local political leaders, but are more widelyspread, notably in Luzon, and thus are closer to the country's economic hub. Peacenegotiations with the NPA are currently not on the agenda, given the organisation'sinsistence that foreign countries such as the US first remove it from their lists ofterrorist organisations.Externally, the Philippines faces no serious threat. The government maintains itsterritorial claim to some of the Spratly Islands, but has reached a modus vivendi withChina over the issue. There is currently little likelihood of armed conflict betweenthe two countries.
Philippines 15
© The Economist Intelligence Unit Limited 2005 www.eiu.com Country Profile 2005
II. Civil unrest
Large public demonstrations in the Philippines are commonplace; indeed, thecountry's so-called People's Power movement has brought down two governmentsin the past 15 years, most recently in January 2001. Such protests are not particularlyviolent, but are disruptive to the normal functioning of business in the capital.Violence is not, however, uncommon. The run-up to the May 2004 presidential andcongressional elections was characterised by protests and a total of around 150election-related deaths. Opponents of the government who believe that thepresident, Gloria Macapagal Arroyo, did not win re-election fairly may continue toprotest on the streets. Protests over economic issues are common, and demon-strations against the US military presence in support of the campaign against AbuSayyaf are also likely to persist until the withdrawal of US troops.
III. Crime
Street crime is a serious problem in the Philippines, particularly in metropolitanManila. According to official statistics, the incidence of crime in 2003 was 103.2 per100,000 head of population, or 52.6 per 100,000 in the case of "index crimes" (seriouscrimes, such as murder, physical injury, rape, robbery and theft). This was well belowthe recorded peak of 313.6 per 100,000 in 1984. The crime rate in the National CapitalRegion is much higher than the national average, at 192.1 per 100,000 population, or93.2 per 100,000 in the case of index crimes. The authorities acknowledge that 18murders, on average, are committed in the country every day, with a further 11homicides a day that are not classified as murder. Kidnappings, rapes and drug-relatedcrimes are also frequent. The high level of crime is a major reason why foreigninvestors shun the Philippines, and is a factor in the failure of tourism in thePhilippines to take off. The problem is made worse by the apparent complicity of somepolice officials in criminal enterprises.
IV. Organised crime
Violent drug-trafficking organisations are well established in the Philippines, and thenarcotic trade is massive. The huge sums to be earned in the drug trade attractpoliticians, law enforcement officials and leading business figures, and undermineattempts to reduce official corruption. The government has created a new NationalAnti-Crime Commission and has designated an "anti-crime czar", but they have hadfew successes so far. Organised crime is not confined to drugs, however; it alsoencompasses gambling, prostitution, kidnapping, smuggling and extortion.Organised criminal gangs are believed to launder money through a network of localbanks. The Philippines was originally cited by the Financial Action Task Force (FATF, aninternational policy body) as "non-co-operative" in anti-money-laundering efforts.Following the introduction of legislation against money-laundering by the Philippinegovernment in 2003, in early 2005 the FATF dropped the Philippines from its blacklist.
V. Kidnapping
Kidnapping is rampant in the Philippines, and is carried out by a wide range ofgroups: Islamist insurgents in the southern islands, sophisticated drug gangsthroughout the country and smaller groups of bandits. It is a major concern forcompanies in the Philippines, including foreign firms, and the affluent Chinesebusiness community has been a prime target. In addition, Abu Sayyaf, the notoriousMuslim secessionist group based on the southern island of Basilan, has kidnapped
16 Philippines
Country Profile 2005 www.eiu.com © The Economist Intelligence Unit Limited 2005
dozens of local residents and tourists, ostensibly for political reasons. When ransomsare not forthcoming, Abu Sayyaf, like other kidnap gangs, has been prepared to carryout its threat to execute hostages. It is widely suspected locally that members of thesecurity forces co-operate with kidnap gangs to extort ransoms. In late 2003Ms Macapagal Arroyo lifted a moratorium on the use of the death penalty, followingthe kidnapping and murder of an executive with a US soft-drinks firm, Coca Cola.However, no executions have taken place since Ms Macapagal Arroyo becamepresident.
VI. Terrorism
Terrorism is a serious concern, although it is mainly confined to the southern islands.Abu Sayyaf carries out bombings, kidnappings and murders that clearly qualify asterrorist acts. The group is included on the US State Department's list of knownterrorist organisations. Abu Sayyaf claims that some of its members have beentrained by the al-Qaida network in Afghanistan, although Abu Sayyaf seemsmotivated less by religious or political fervour than by financial gain from itskidnappings. The southern Philippines, nonetheless, is now widely regarded as asignificant breeding ground for terrorists, with its large population of alienated,impoverished Muslim youth.
Resources and infrastructure
Population
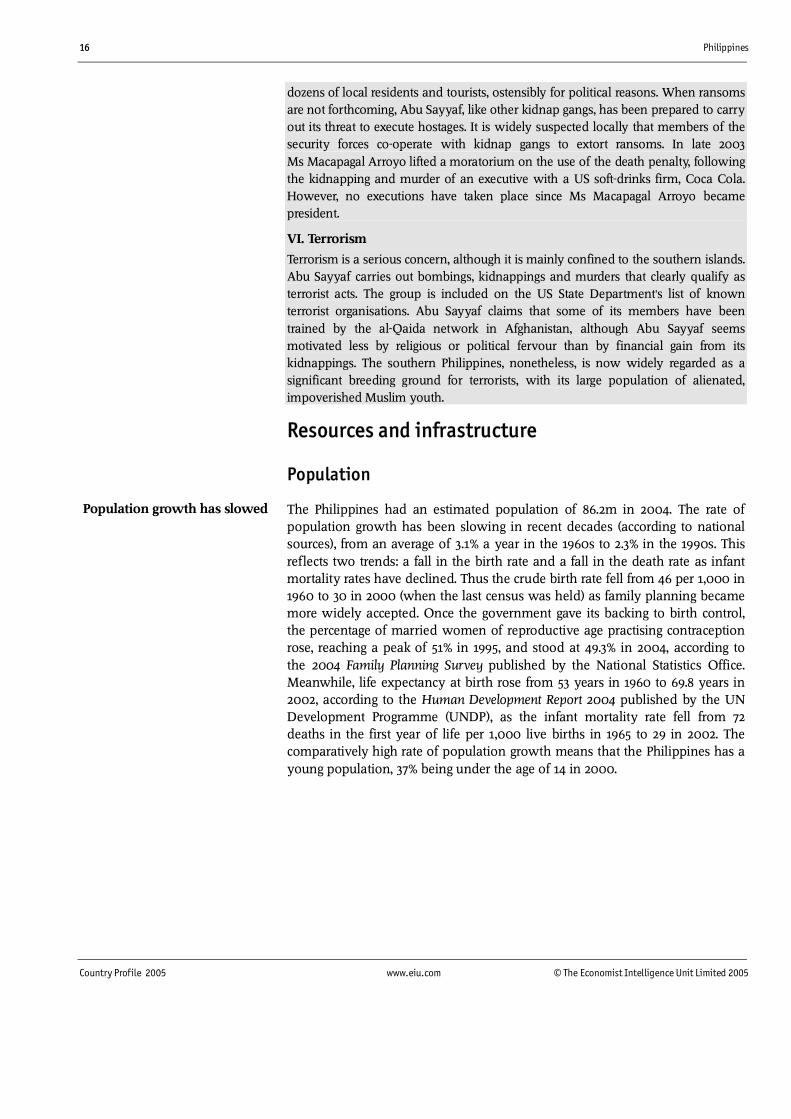
The Philippines had an estimated population of 86.2m in 2004. The rate ofpopulation growth has been slowing in recent decades (according to nationalsources), from an average of 3.1% a year in the 1960s to 2.3% in the 1990s. Thisreflects two trends: a fall in the birth rate and a fall in the death rate as infantmortality rates have declined. Thus the crude birth rate fell from 46 per 1,000 in1960 to 30 in 2000 (when the last census was held) as family planning becamemore widely accepted. Once the government gave its backing to birth control,the percentage of married women of reproductive age practising contraceptionrose, reaching a peak of 51% in 1995, and stood at 49.3% in 2004, according tothe 2004 Family Planning Survey published by the National Statistics Office.Meanwhile, life expectancy at birth rose from 53 years in 1960 to 69.8 years in2002, according to the Human Development Report 2004 published by the UNDevelopment Programme (UNDP), as the infant mortality rate fell from 72deaths in the first year of life per 1,000 live births in 1965 to 29 in 2002. Thecomparatively high rate of population growth means that the Philippines has ayoung population, 37% being under the age of 14 in 2000.
Population growth has slowed
Philippines 17
© The Economist Intelligence Unit Limited 2005 www.eiu.com Country Profile 2005
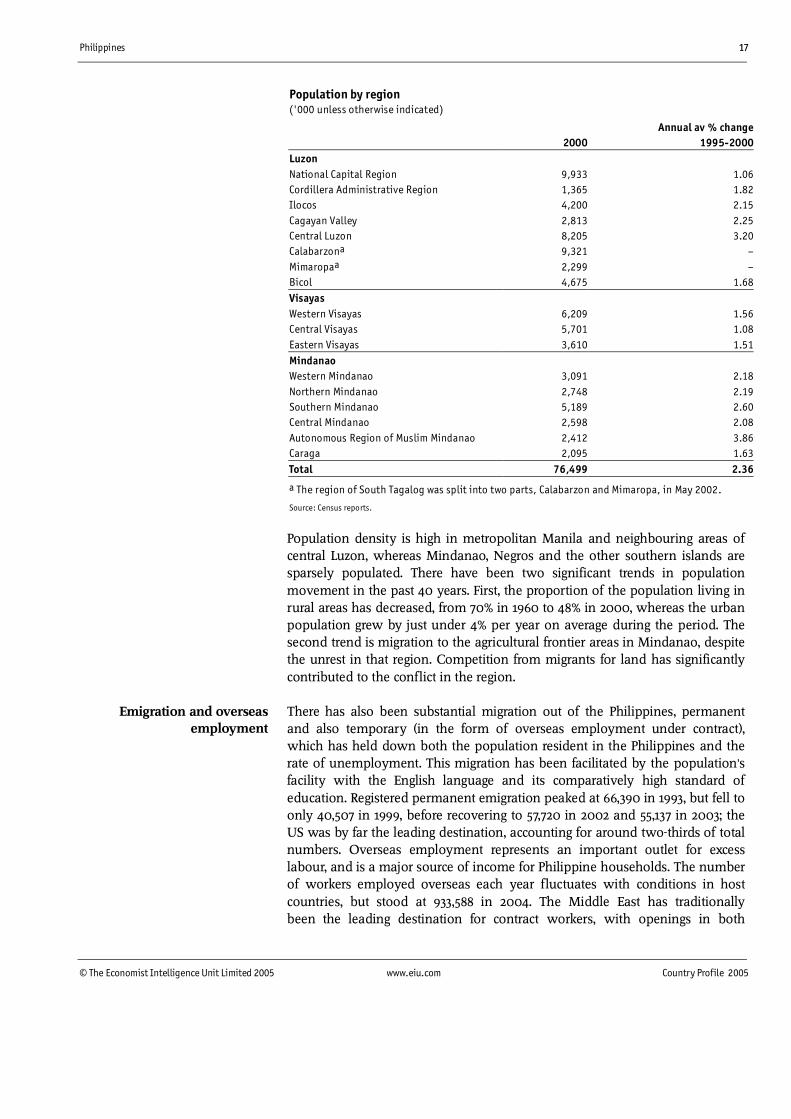
Population by region('000 unless otherwise indicated)
Annual av % change2000 1995-2000
LuzonNational Capital Region 9,933 1.06Cordillera Administrative Region 1,365 1.82Ilocos 4,200 2.15Cagayan Valley 2,813 2.25Central Luzon 8,205 3.20Calabarzona 9,321 �Mimaropaa 2,299 �Bicol 4,675 1.68VisayasWestern Visayas 6,209 1.56Central Visayas 5,701 1.08Eastern Visayas 3,610 1.51MindanaoWestern Mindanao 3,091 2.18Northern Mindanao 2,748 2.19Southern Mindanao 5,189 2.60Central Mindanao 2,598 2.08Autonomous Region of Muslim Mindanao 2,412 3.86Caraga 2,095 1.63Total 76,499 2.36
a The region of South Tagalog was split into two parts, Calabarzon and Mimaropa, in May 2002.
Source: Census reports.
Population density is high in metropolitan Manila and neighbouring areas ofcentral Luzon, whereas Mindanao, Negros and the other southern islands aresparsely populated. There have been two significant trends in populationmovement in the past 40 years. First, the proportion of the population living inrural areas has decreased, from 70% in 1960 to 48% in 2000, whereas the urbanpopulation grew by just under 4% per year on average during the period. Thesecond trend is migration to the agricultural frontier areas in Mindanao, despitethe unrest in that region. Competition from migrants for land has significantlycontributed to the conflict in the region.
There has also been substantial migration out of the Philippines, permanentand also temporary (in the form of overseas employment under contract),which has held down both the population resident in the Philippines and therate of unemployment. This migration has been facilitated by the population'sfacility with the English language and its comparatively high standard ofeducation. Registered permanent emigration peaked at 66,390 in 1993, but fell toonly 40,507 in 1999, before recovering to 57,720 in 2002 and 55,137 in 2003; theUS was by far the leading destination, accounting for around two-thirds of totalnumbers. Overseas employment represents an important outlet for excesslabour, and is a major source of income for Philippine households. The numberof workers employed overseas each year fluctuates with conditions in hostcountries, but stood at 933,588 in 2004. The Middle East has traditionallybeen the leading destination for contract workers, with openings in both
Emigration and overseasemployment
18 Philippines
Country Profile 2005 www.eiu.com © The Economist Intelligence Unit Limited 2005
construction work and private services, but East and South-east Asia havegrown in significance as destinations. A recent agreement with Japan willprovide more employment opportunities for Filipino care workers in Japan.
Education
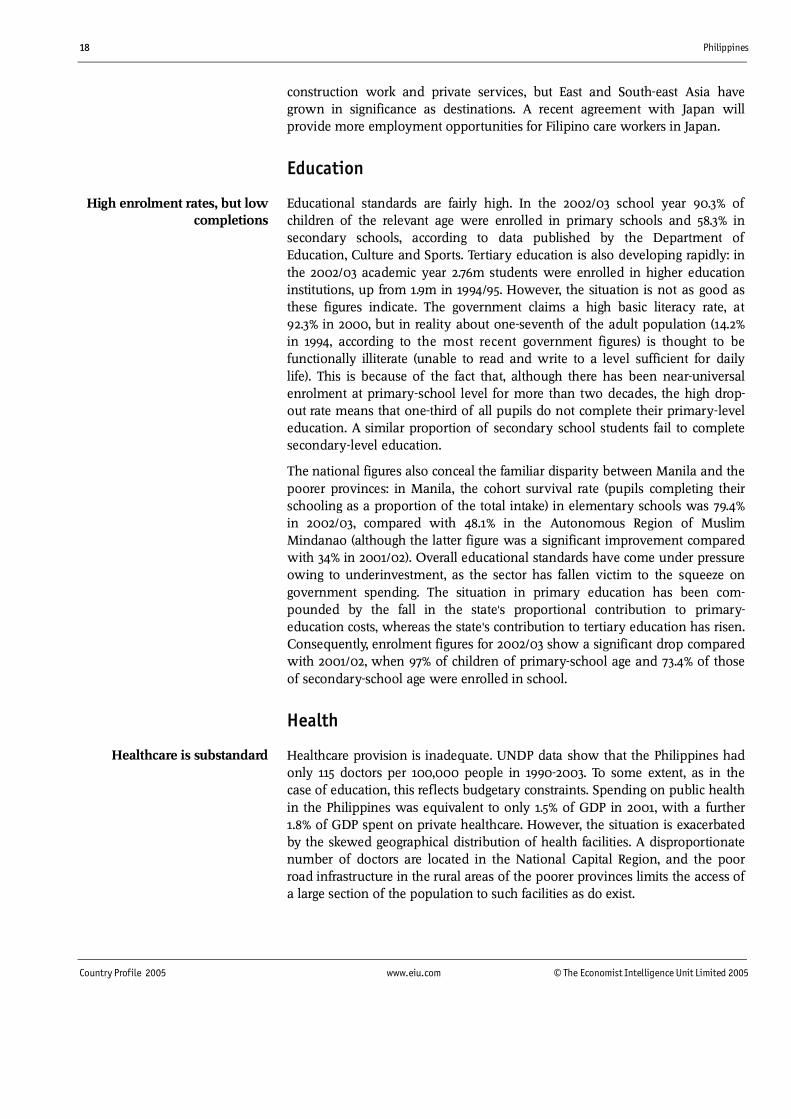
Educational standards are fairly high. In the 2002/03 school year 90.3% ofchildren of the relevant age were enrolled in primary schools and 58.3% insecondary schools, according to data published by the Department ofEducation, Culture and Sports. Tertiary education is also developing rapidly: inthe 2002/03 academic year 2.76m students were enrolled in higher educationinstitutions, up from 1.9m in 1994/95. However, the situation is not as good asthese figures indicate. The government claims a high basic literacy rate, at92.3% in 2000, but in reality about one-seventh of the adult population (14.2%in 1994, according to the most recent government figures) is thought to befunctionally illiterate (unable to read and write to a level sufficient for dailylife). This is because of the fact that, although there has been near-universalenrolment at primary-school level for more than two decades, the high drop-out rate means that one-third of all pupils do not complete their primary-leveleducation. A similar proportion of secondary school students fail to completesecondary-level education.
The national figures also conceal the familiar disparity between Manila and thepoorer provinces: in Manila, the cohort survival rate (pupils completing theirschooling as a proportion of the total intake) in elementary schools was 79.4%in 2002/03, compared with 48.1% in the Autonomous Region of MuslimMindanao (although the latter figure was a significant improvement comparedwith 34% in 2001/02). Overall educational standards have come under pressureowing to underinvestment, as the sector has fallen victim to the squeeze ongovernment spending. The situation in primary education has been com-pounded by the fall in the state's proportional contribution to primary-education costs, whereas the state's contribution to tertiary education has risen.Consequently, enrolment figures for 2002/03 show a significant drop comparedwith 2001/02, when 97% of children of primary-school age and 73.4% of thoseof secondary-school age were enrolled in school.
Health
Healthcare provision is inadequate. UNDP data show that the Philippines hadonly 115 doctors per 100,000 people in 1990-2003. To some extent, as in thecase of education, this reflects budgetary constraints. Spending on public healthin the Philippines was equivalent to only 1.5% of GDP in 2001, with a further1.8% of GDP spent on private healthcare. However, the situation is exacerbatedby the skewed geographical distribution of health facilities. A disproportionatenumber of doctors are located in the National Capital Region, and the poorroad infrastructure in the rural areas of the poorer provinces limits the access ofa large section of the population to such facilities as do exist.
High enrolment rates, but lowcompletions
Healthcare is substandard
Philippines 19
© The Economist Intelligence Unit Limited 2005 www.eiu.com Country Profile 2005
Natural resources and the environment
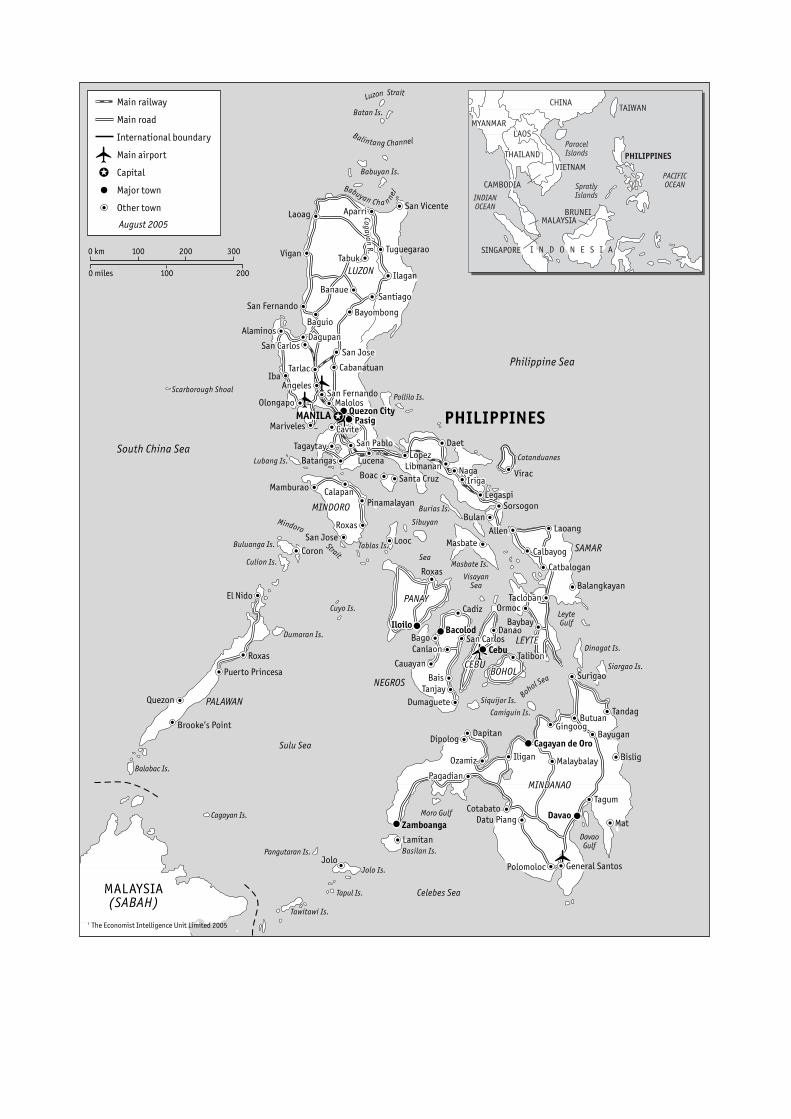
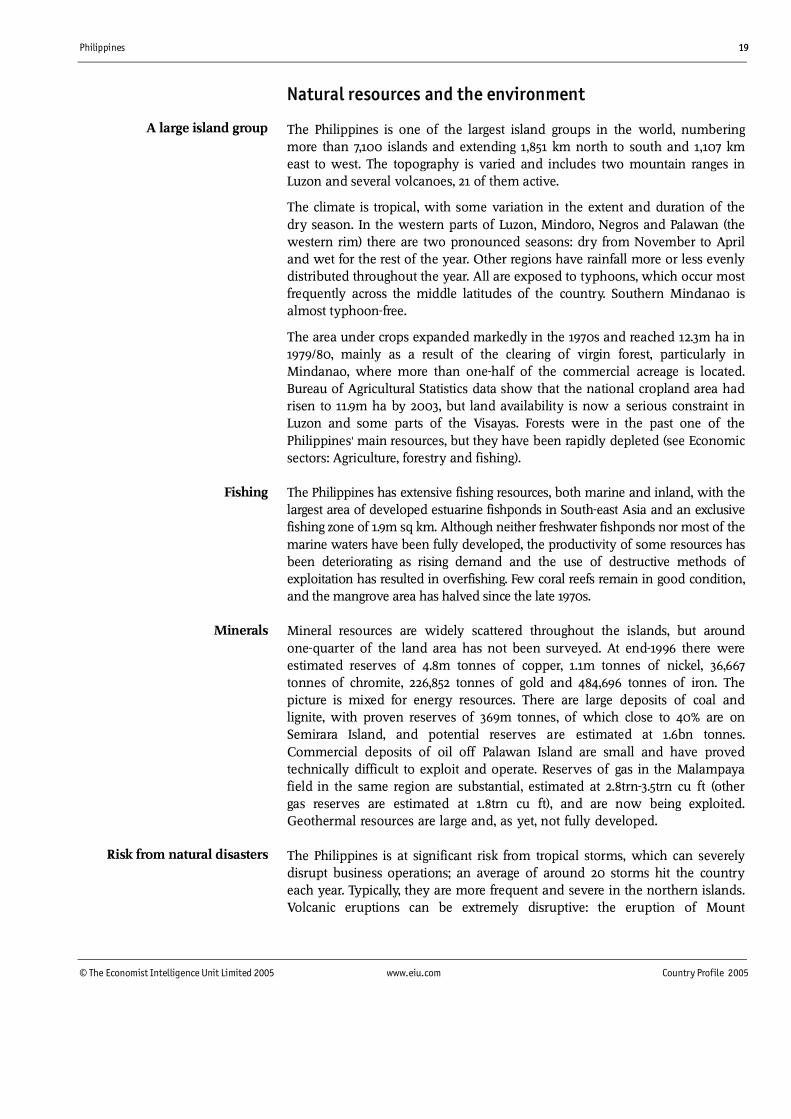
The Philippines is one of the largest island groups in the world, numberingmore than 7,100 islands and extending 1,851 km north to south and 1,107 kmeast to west. The topography is varied and includes two mountain ranges inLuzon and several volcanoes, 21 of them active.
The climate is tropical, with some variation in the extent and duration of thedry season. In the western parts of Luzon, Mindoro, Negros and Palawan (thewestern rim) there are two pronounced seasons: dry from November to Apriland wet for the rest of the year. Other regions have rainfall more or less evenlydistributed throughout the year. All are exposed to typhoons, which occur mostfrequently across the middle latitudes of the country. Southern Mindanao isalmost typhoon-free.
The area under crops expanded markedly in the 1970s and reached 12.3m ha in1979/80, mainly as a result of the clearing of virgin forest, particularly inMindanao, where more than one-half of the commercial acreage is located.Bureau of Agricultural Statistics data show that the national cropland area hadrisen to 11.9m ha by 2003, but land availability is now a serious constraint inLuzon and some parts of the Visayas. Forests were in the past one of thePhilippines' main resources, but they have been rapidly depleted (see Economicsectors: Agriculture, forestry and fishing).
The Philippines has extensive fishing resources, both marine and inland, with thelargest area of developed estuarine fishponds in South-east Asia and an exclusivefishing zone of 1.9m sq km. Although neither freshwater fishponds nor most of themarine waters have been fully developed, the productivity of some resources hasbeen deteriorating as rising demand and the use of destructive methods ofexploitation has resulted in overfishing. Few coral reefs remain in good condition,and the mangrove area has halved since the late 1970s.
Mineral resources are widely scattered throughout the islands, but aroundone-quarter of the land area has not been surveyed. At end-1996 there wereestimated reserves of 4.8m tonnes of copper, 1.1m tonnes of nickel, 36,667tonnes of chromite, 226,852 tonnes of gold and 484,696 tonnes of iron. Thepicture is mixed for energy resources. There are large deposits of coal andlignite, with proven reserves of 369m tonnes, of which close to 40% are onSemirara Island, and potential reserves are estimated at 1.6bn tonnes.Commercial deposits of oil off Palawan Island are small and have provedtechnically difficult to exploit and operate. Reserves of gas in the Malampayafield in the same region are substantial, estimated at 2.8trn-3.5trn cu ft (othergas reserves are estimated at 1.8trn cu ft), and are now being exploited.Geothermal resources are large and, as yet, not fully developed.
The Philippines is at significant risk from tropical storms, which can severelydisrupt business operations; an average of around 20 storms hit the countryeach year. Typically, they are more frequent and severe in the northern islands.Volcanic eruptions can be extremely disruptive: the eruption of Mount
A large island group
Fishing
Risk from natural disasters
Minerals
20 Philippines
Country Profile 2005 www.eiu.com © The Economist Intelligence Unit Limited 2005
Pinatubo in 1991 caused massive damage to a wide area of Luzon north of thecapital and closed Manila airport for a period.
Transport, communications and the Internet
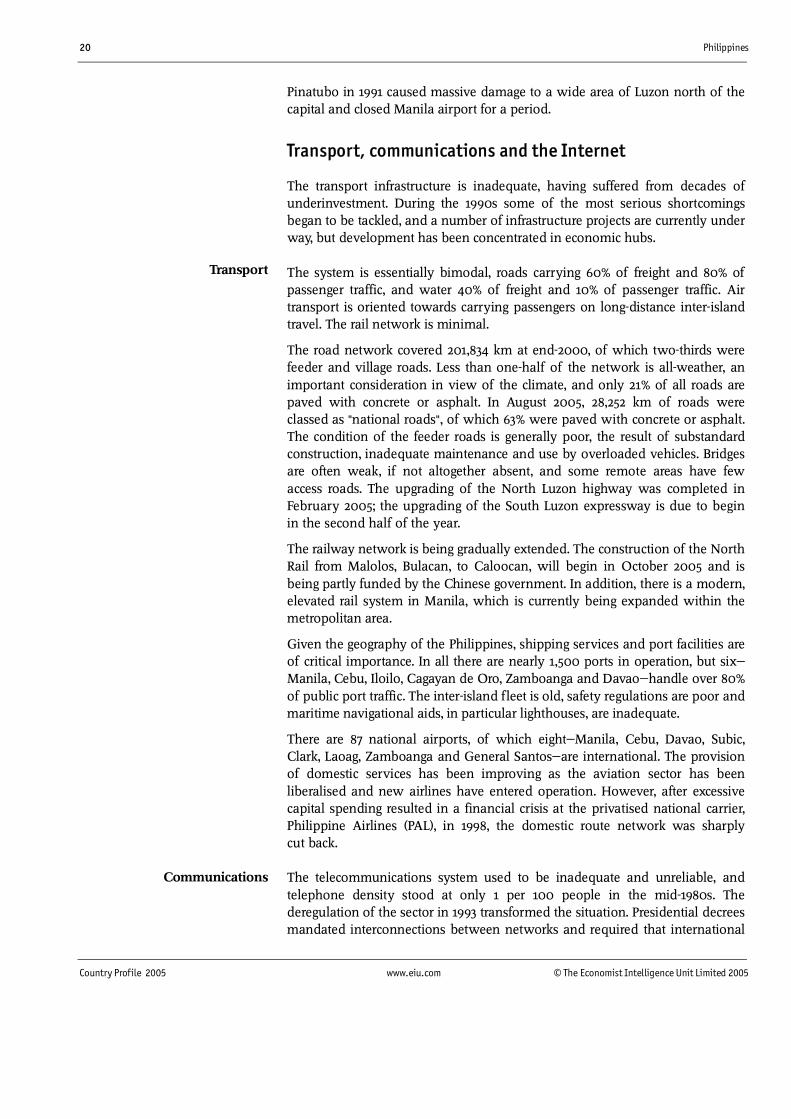
The transport infrastructure is inadequate, having suffered from decades ofunderinvestment. During the 1990s some of the most serious shortcomingsbegan to be tackled, and a number of infrastructure projects are currently underway, but development has been concentrated in economic hubs.
The system is essentially bimodal, roads carrying 60% of freight and 80% ofpassenger traffic, and water 40% of freight and 10% of passenger traffic. Airtransport is oriented towards carrying passengers on long-distance inter-islandtravel. The rail network is minimal.
The road network covered 201,834 km at end-2000, of which two-thirds werefeeder and village roads. Less than one-half of the network is all-weather, animportant consideration in view of the climate, and only 21% of all roads arepaved with concrete or asphalt. In August 2005, 28,252 km of roads wereclassed as "national roads", of which 63% were paved with concrete or asphalt.The condition of the feeder roads is generally poor, the result of substandardconstruction, inadequate maintenance and use by overloaded vehicles. Bridgesare often weak, if not altogether absent, and some remote areas have fewaccess roads. The upgrading of the North Luzon highway was completed inFebruary 2005; the upgrading of the South Luzon expressway is due to beginin the second half of the year.
The railway network is being gradually extended. The construction of the NorthRail from Malolos, Bulacan, to Caloocan, will begin in October 2005 and isbeing partly funded by the Chinese government. In addition, there is a modern,elevated rail system in Manila, which is currently being expanded within themetropolitan area.
Given the geography of the Philippines, shipping services and port facilities areof critical importance. In all there are nearly 1,500 ports in operation, but six�Manila, Cebu, Iloilo, Cagayan de Oro, Zamboanga and Davao�handle over 80%of public port traffic. The inter-island fleet is old, safety regulations are poor andmaritime navigational aids, in particular lighthouses, are inadequate.
There are 87 national airports, of which eight�Manila, Cebu, Davao, Subic,Clark, Laoag, Zamboanga and General Santos�are international. The provisionof domestic services has been improving as the aviation sector has beenliberalised and new airlines have entered operation. However, after excessivecapital spending resulted in a financial crisis at the privatised national carrier,Philippine Airlines (PAL), in 1998, the domestic route network was sharplycut back.
The telecommunications system used to be inadequate and unreliable, andtelephone density stood at only 1 per 100 people in the mid-1980s. Thederegulation of the sector in 1993 transformed the situation. Presidential decreesmandated interconnections between networks and required that international
Communications
Transport
Philippines 21
© The Economist Intelligence Unit Limited 2005 www.eiu.com Country Profile 2005
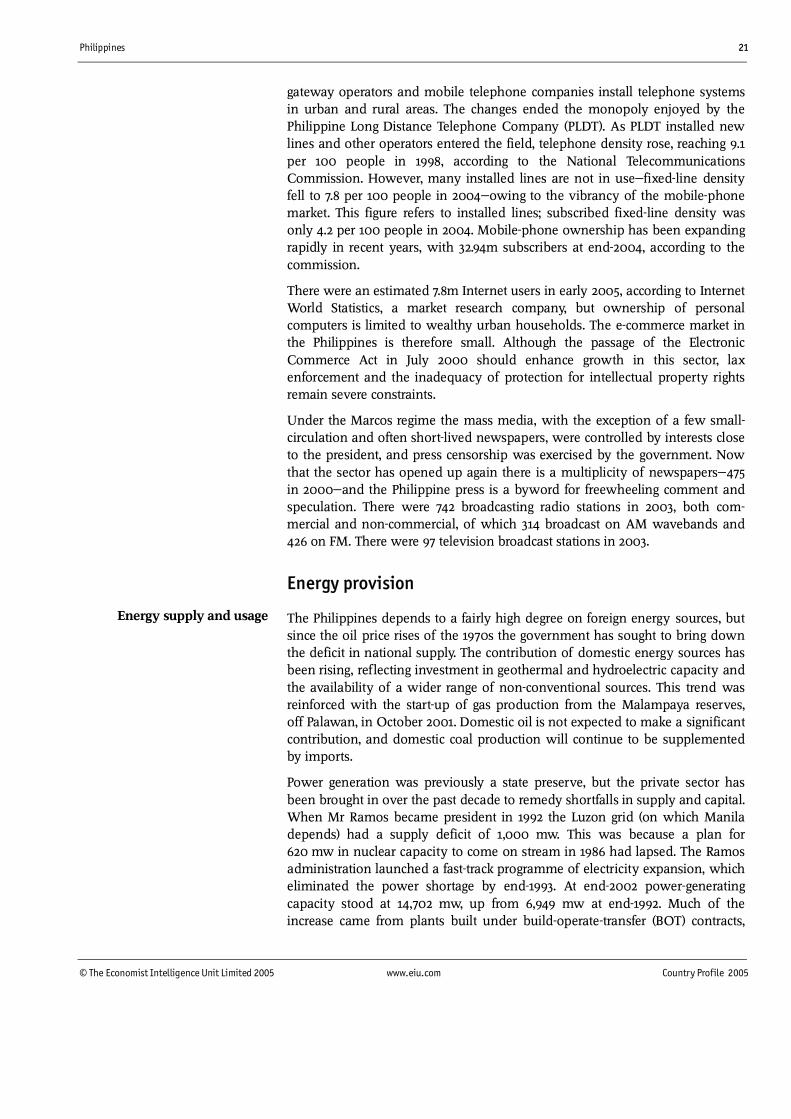
gateway operators and mobile telephone companies install telephone systemsin urban and rural areas. The changes ended the monopoly enjoyed by thePhilippine Long Distance Telephone Company (PLDT). As PLDT installed newlines and other operators entered the field, telephone density rose, reaching 9.1per 100 people in 1998, according to the National TelecommunicationsCommission. However, many installed lines are not in use�fixed-line densityfell to 7.8 per 100 people in 2004�owing to the vibrancy of the mobile-phonemarket. This figure refers to installed lines; subscribed fixed-line density wasonly 4.2 per 100 people in 2004. Mobile-phone ownership has been expandingrapidly in recent years, with 32.94m subscribers at end-2004, according to thecommission.
There were an estimated 7.8m Internet users in early 2005, according to InternetWorld Statistics, a market research company, but ownership of personalcomputers is limited to wealthy urban households. The e-commerce market inthe Philippines is therefore small. Although the passage of the ElectronicCommerce Act in July 2000 should enhance growth in this sector, laxenforcement and the inadequacy of protection for intellectual property rightsremain severe constraints.
Under the Marcos regime the mass media, with the exception of a few small-circulation and often short-lived newspapers, were controlled by interests closeto the president, and press censorship was exercised by the government. Nowthat the sector has opened up again there is a multiplicity of newspapers�475in 2000�and the Philippine press is a byword for freewheeling comment andspeculation. There were 742 broadcasting radio stations in 2003, both com-mercial and non-commercial, of which 314 broadcast on AM wavebands and426 on FM. There were 97 television broadcast stations in 2003.
Energy provision
The Philippines depends to a fairly high degree on foreign energy sources, butsince the oil price rises of the 1970s the government has sought to bring downthe deficit in national supply. The contribution of domestic energy sources hasbeen rising, reflecting investment in geothermal and hydroelectric capacity andthe availability of a wider range of non-conventional sources. This trend wasreinforced with the start-up of gas production from the Malampaya reserves,off Palawan, in October 2001. Domestic oil is not expected to make a significantcontribution, and domestic coal production will continue to be supplementedby imports.
Power generation was previously a state preserve, but the private sector hasbeen brought in over the past decade to remedy shortfalls in supply and capital.When Mr Ramos became president in 1992 the Luzon grid (on which Maniladepends) had a supply deficit of 1,000 mw. This was because a plan for620 mw in nuclear capacity to come on stream in 1986 had lapsed. The Ramosadministration launched a fast-track programme of electricity expansion, whicheliminated the power shortage by end-1993. At end-2002 power-generatingcapacity stood at 14,702 mw, up from 6,949 mw at end-1992. Much of theincrease came from plants built under build-operate-transfer (BOT) contracts,
Energy supply and usage
22 Philippines
Country Profile 2005 www.eiu.com © The Economist Intelligence Unit Limited 2005
and the use of such arrangements, as well as of build-own-operate (BOO)agreements, has become common, being used also for the development ofcapacity that utilises gas from the Malampaya field. The greatest long-termpotential for expansion in power-generation capacity lies in geothermal energy.Geothermal power generation on a commercial scale began in 1979, andcapacity in 2002, at 1,931 mw, was second only to that of the US. The latestdevelopment plan of the Department of Energy envisages additional capacityof 990 mw by 2011.
The liberalisation of the energy sector took another, more far-reaching, stepforward in 2001 with the passage of legislation to privatise the state-ownedutility, the National Power Corporation (Napocor). Even so, attempts to sell offNapocor have stumbled, and a major policy challenge for the new governmentelected in May 2004 is to make progress on the sell-off of both generating andtransmission assets. Several generating assets were sold off in late 2004, but nofurther progress on privatisation had been made by August 2005.
The economy
Economic structureMain economic indicators, 2004GDP (US$ bn) 84.6Real GDP growth (at constant 1985 prices; %) 6.1
Population (m)a 86.2Current-account balance (US$ bn) 2.4Foreign debt (US$ bn)a 65.8
Exchange rate (av; P:US$) 56.0
a Estimates.
Sources: Bangko Sentral ng Pilipinas; US Census Bureau; Economist Intelligence Unit.
Reflecting its varied resource endowment, both physical and human, theeconomy is diversified. In recent years the contribution to GDP of the manu-facturing sector has been around 23-24%, that of the agriculture, fishing andforestry sector 13-14% and that of the services sector around 54%. The informalsector is large, particularly in the towns, where over one-half of the populationnow lives.
The economy is marked by great disparities: in ownership of assets, in income,in levels of technology in production and in the geographical concentration ofactivity. The National Capital Region (NCR), centred on Manila, contains 13% ofthe population and generates more than one-third of GDP. Income per head in2003 in the NCR, the richest region, was 11.7 times that in the poorest region,the Autonomous Region of Muslim Mindanao (see Regional trends). A widegap also exists on the human development measure (which takes into accountother indicators), with the index score for Sulu, one of the Muslim provinces,being just over one-half of the national average in 2000 and only around two-fifths that of the NCR. An even greater disparity is evident nationwide betweenthe richest and poorest households. In 2000 the richest 10% of the population
Income disparities
Philippines 23
© The Economist Intelligence Unit Limited 2005 www.eiu.com Country Profile 2005
had an income 23 times that of the poorest 10%. Those living in poverty wereestimated at 34% of the population in the same year, whereas the poverty ratein the NCR was only 7.6%.
Comparative economic indicators, 2004Philippines Indonesia Malaysia Taiwan Thailand
Real GDP growth (%) 6.1 5.1 7.1 5.7 6.1
Consumer price inflation (av; %) 6.0 6.1 1.5 1.6 2.8Current-account balance (US$ bn) 2.4 2.9 14.8 18.7 7.3
Exports of goods (US$ bn) 38.7 71.7 126.6 173.2 96.1Imports of goods (US$ bn) 44.8 50.5 99.1 157.0 85.0
Source: Economist Intelligence Unit.
Economic policy
The major economic policy requirement in the Philippines is to raise the levelof budget revenue on a sustainable basis. The low ratio of tax revenue to GDP�around 15% in most years�has meant that the government has never investedadequately in physical and social infrastructure, generating serious bottlenecksin mobilising the Philippines' considerable resources. The situation has beenexacerbated by the primacy accorded to achieving fiscal equilibrium, with thespending side bearing the burden of making up revenue shortfalls.
Progress was made under the presidency of Fidel Ramos from 1992 to 1998,with a small budget surplus registered each year in 1994-97. However, after asteady narrowing of the surplus, the budget was back in the red in 1998 to thetune of P50bn (US$1.2bn). The deficit more than doubled in 1999, and roseagain in both 2000 and 2001. A record deficit of P212.7bn (5.4% of GDP) wasrecorded in 2002. The primary reason for the reversal was the onset of theAsian economic crisis in 1997. This had an immediate and severe impact on thebudget. The depreciation of the peso and the steep rise in interest rates pushedup the cost of servicing the government's debt, at the same time that theslowing of economic growth and the onset of recession in 1998 hit tax revenue.
However, the deterioration cannot be attributed entirely to poorer GDP results.Economic growth in 2000 was close to the revised official forecast, yet thedeficit of P136.1bn (4.1% of GDP) was double the target. The results in 2000were partly caused by worsening investor sentiment as the political situationdeteriorated. Moreover, the sharp fall in the peso in October, and the steep risein interest rates aimed at containing the fall, greatly boosted interest outgoingson government debt. The most serious deterioration was in the proceeds of theBureau of Internal Revenue (BIR), which were P43bn below the revised targetand up by only 4.3% compared with 1999. As a result, and despite better thanforecast results from customs receipts in both 1999 and 2000, the revenue ratiofell from 17.4% of GDP in 1998 to 16.1% in 1999 and 15.1% in 2000.
Setting aside the issue of large-scale tax evasion by well-placed individuals, theessential problem lies in the system itself. The comprehensive tax reformintroduced under Mr Ramos did not produce an increase in revenue as apercentage of GDP. A study by the IMF in late 2000 showed that the reform
The fiscal priority: enhancingrevenue
Progress in the mid-1990s issoon reversed
24 Philippines
Country Profile 2005 www.eiu.com © The Economist Intelligence Unit Limited 2005
had been broadly revenue-neutral; proceeds from value-added tax (VAT) had infact fallen as a percentage of GDP since 1994 because of the exemptionsintroduced. A Philippine think-tank that has conducted a study of this area hasclaimed that evasion of personal income tax has worsened under thesimplified structure. It is widely recognised that part of the solution lies inimproving tax compliance by tightening up on tax administration and reducingthe opportunities for corruption. It was in part through a reinforced collectioneffort, aided by a tax amnesty scheme, that the budget deficit in 2001 was heldclose to the target of P145bn, coming in at P147.1bn. However, the ratio of thebudget deficit to GDP remained steady at 4.1% in 2000 and 2001.
The government had hoped to begin reining in the budget deficit in 2002, withan elimination of the deficit altogether by 2006. However, poor collection bythe BIR and a massive overspend meant that the original forecast for the 2002deficit of P130bn was grossly exceeded: the budget deficit for the year rose toP212.7bn, equivalent to 5.4% of GDP. The government has adjusted its budgetforecasts for the next few years accordingly, and does not now expect fiscalbalance to be achieved until 2008. In 2003 the government held the budgetdeficit just below the target of P202bn at P199.9bn, aided by relatively strongGDP growth and sustained government focus on budgetary results. In 2004 thedeficit came in significantly below the unambitious target of P197.8bn, atP186.1bn, in a sign that the government under the president, Gloria MacapagalArroyo, was starting to prioritise a return to fiscal balance.
Having won re-election in May 2004, the government announced a package ofeight measures to raise revenue, and by December 2004 the first of these, a billraising excise taxes on alcohol and tobacco, was on the statute books. This wasfollowed in January 2005 by a bill providing financial incentives to revenue-collection agencies to collect more tax. However, the most important of thegovernment's measures to raise tax collection is legislation expanding VAT,which was pushed through the legislature after months of wrangling andsigned into law in May. The act provides for the elimination of a number ofVAT exemptions from July 2005, and gives the president the power to vary therate of VAT from 10% to 12% from January 2006 if the previous year's budgetdeficit has exceeded 1.5% of GDP or VAT collections have exceeded 2.8% of GDP(the latter provision is designed to encourage the government to collect agreater proportion of the revenue owing to it). A further provision temporarilyraises corporate income tax from 32% to 35% for three years, after which the ratefalls back to 30%. Together these measures promised a large reduction in thebudget deficit by end-2006.
The Supreme Court's decision to suspend the VAT act on the first day of itsoperation, July 1st 2005, pending a review of its constitutionality has cast a longshadow over the government's economic policy. The other five measures in thegovernment's revenue-raising package are on the back burner. Consequently,without the VAT law the government will have to rely on better collection toraise revenue. Even before the VAT law had been passed, the governmentachieved a monthly budget surplus in April 2005, the first for four years, andanother in June. The result was a 15.7% year-on-year fall in the budget deficit inJanuary-June 2005, to P67.5bn. The government is therefore on track to meet its
The deficit edges down as thegovernment focus on the issue
Philippines 25
© The Economist Intelligence Unit Limited 2005 www.eiu.com Country Profile 2005
(admittedly unambitious) target of reducing the deficit to P180bn in 2005, buta more significant fall in the deficit will require the implementation of theVAT act.
Budget targets and results(P bn)
2004 2005Target Actual Target
Revenue 671.2 699.8 783.2 Bureau of Internal Revenue 488.6 468.2 547.5 Bureau of Customs 105.2 122.5 151.0Expenditure 869.0 886.8 963.2 Interest 271.5 260.9 301.7
Balance -197.8 -187.1 -180.0
Source: Department of Finance.
The other economic policy priority, pursued since the administration ofCorazon Aquino (1986�92), has been the restructuring and liberalisation of thePhilippine economy. The core purpose is to remove the structural constraintsthat had distorted the development, and depressed the growth, of an economythat at the end of the 1950s had been the most industrialised in South-east Asia.The constraints had their origin in the rentier economy of the colonial periodand the persistent and high level of protectionism in the decades sinceindependence. The major strands of the liberalisation programme are:
• the elimination of monopolies;
• the opening of restricted or banned sectors to foreign investment;
• the privatisation, wholly or in part, of all government corporate holdingsand such core services as are appropriate;
• the easing or lifting of tariff and non-tariff barriers; and
• a simplification and widening of the tax system in order to yield enhancedtax receipts.
To varying degrees, all of these policies challenge entrenched interests, which findstrong protection in Congress. Nevertheless, major structural reforms wereintroduced during the Aquino and Ramos administrations. They were supple-mented by the opening of another closed sector, retail trade, and by further bankliberalisation, during the presidency of Joseph Estrada. Within months of comingto power the current president, Gloria Macapagal Arroyo, secured congressionalapproval for the long-mooted liberalisation of the power sector, including as itsmajor component the privatisation of the electricity utility, the National PowerCorporation (Napocor).
However, little progress on the Napocor sell-off has since been made: an attemptto privatise the National Transmission Corporation (Transco), which holdsNapocor's power transmission assets, proved a flop in July 2003, when only onebid was received. A few small generating assets and one larger one were sold in2004, but no further progress had been made by August 2005. Other proposalsaired during the Estrada administration�lifting the ban on foreign ownership ofland, and easing restrictions on foreign involvement in the media, education and
A sustained restructuring andliberalisation of the economy
26 Philippines
Country Profile 2005 www.eiu.com © The Economist Intelligence Unit Limited 2005
utilities�remain on the agenda, but progress will be slow for domestic politicalreasons. Some of these proposals may be addressed when the reform of theconstitution is discussed later in 2005, but progress on constitutional reform islikely to be slow, and complicated by the unpopularity of the administration.
Main economic policy developments
May 2000
An amendment to the General Banking Law permits 100% ownership by a foreignbank of a local bank classified as distressed.
June 2001
The power sector is liberalised with the passage of the Electricity Power IndustryReform Act, which provides for the privatisation of the state utility.
December 2002
The special-purpose asset vehicle law is passed, making it easier for banks to spin offbad loans to asset-management companies.
November 2003
Political pressures and the need to raise revenue lead the government to increaseimport tariffs on 464 manufactured goods from 3-10% to 5-15%. The new rates are to lastuntil 2007.
January 2004
The Supreme Court rules that foreign investment in the mining industry isunconstitutional.
December 2004
The Supreme Court reverses its earlier ruling on foreign investment in mining,potentially paving the way for large-scale investments.
January 2005
The government assumes P200bn (US$3.57bn) of the debts of the state-ownedNational Power Corporation (Napocor) in order to facilitate the privatisation of theindebted power utility.
A key policy change on the monetary side has been the switch to inflationtargeting by the Bangko Sentral ng Pilipinas (BSP, the autonomous central bank)at the beginning of 2001. It had traditionally set interest rates to meet monetarytargets monitored by the IMF, and with an eye to countering sharp fluctuationsin the peso's value and providing some degree of support when it wasdepreciating rapidly. The target range for 2002 was initially set at 5-6%.
In view of the rapid fall in consumer price inflation during the final months of2001 and the first quarter of 2002, and against a background of slowing growthin money supply and credit and the steep fall in the US federal funds rate in thewake of the September 11th 2001 terrorist attacks, the BSP introduced a markedrelaxation in monetary conditions. Its overnight rates were reduced in everymonth from December 2001 to March 2002, reaching their lowest level sinceSeptember 1995. Interest rates were raised in 2003 as the BSP sought to defendthe peso in the aftermath of the attempted coup in July 2003. Overnight
A switch to inflation targeting
Philippines 27
© The Economist Intelligence Unit Limited 2005 www.eiu.com Country Profile 2005
borrowing and lending rates, which had been held steady since March 2002,were cut by a further 25 basis points in early July 2003, to 6.75% and 9%respectively.
The BSP repeatedly passed up a number of opportunities to raise interest rates,despite a 225-basis-point increase in the US federal funds rate betweenmid-2004 and mid-2005. However, persistently high inflation finally forced thecentral bank to raise the overnight borrowing and lending rates by 25 basispoints each on April 7th 2005, to 7% and 9.25% respectively. Given that inflationis running in excess of 8% a year, well above the BSP's target range, real interestrates are now barely positive.
Economic performance
The notable feature of the GDP record in recent years has been the overallresilience of the economy in difficult conditions. A sustained period ofaccelerating growth in GDP from the mid-1990s on came to an end when thetwo pillars of growth�exports and investment�were hit by the regionaleconomic and financial crisis of 1997-98. The steep rise in interest rates and inimport costs, owing to the rapid devaluation in the peso, caused a sharpcontraction in fixed capital formation in 1998. The 21% contraction in exports(national-accounts measure) caused a deterioration in the net foreign balancesince the fall in imports�although steep�was lower, at 14.7%. An aggravatingfactor on the supply side was the fall in agricultural output owing to theEl Niño weather phenomenon, which hit the rice and maize crops. GDPconsequently fell by 0.6% in 1998, a sharp turnaround compared with growthof 5.8% in 1996 and 5.2% in 1997, but a much smaller deterioration than thatregistered by other economies in the region.
The recession was also short-lived. The following two years saw a generallystrengthening recovery, with real GDP growth reaching 3.4% in 1999 and 6% in2000. In 2000 the combination of double-digit export growth, as the USeconomy hit the peak of its cycle, and a modest rise in import spendingproduced another fall in the net foreign deficit, equivalent to an increment of4.9% in GDP. Private consumption growth picked up once more, and annualgross fixed investment growth shot up to 19.9%. On the supply side the mostsignificant feature was the strengthening recovery in manufacturing, whichposted growth of 5.6% in 2000, offsetting the slackening in agricultural growth.
These trends were reversed in 2001, when continuing strong growth inagriculture buoyed up private consumption and hence domestic demandduring a period when a severe deterioration in the external environment�particularly the weakening in US growth and a cyclical downturn in theelectronics market�pushed up the net foreign deficit, which exerted a3.4-percentage-point drag on GDP growth. GDP growth consequently fell to 1.8%in 2001. In 2002 GDP growth recovered to 4.3%�despite the negative foreignbalance, which held GDP growth back by 0.9 percentage points�as theagricultural sector continued to grow strongly and faster growth was recordedin the manufacturing sector.
A record of resilience indifficult conditions
Rates begin to move upwardsagain
28 Philippines
Country Profile 2005 www.eiu.com © The Economist Intelligence Unit Limited 2005
GDP growth fell back to 3.6% in 2003 as the foreign balance deterioratedfurther, subtracting 3.3 percentage points from overall growth. However, a 5.3%expansion in private consumption�the best performance for this componentsince 1990�was recorded as agricultural growth held up and the services sectorwas buoyed by inflows of remittances from overseas Filipino workers. Privateconsumption was thus able to more than offset a lacklustre 2.5% increase ingovernment consumption (as the government sought to hold down the budgetdeficit) as well as an increase of only 3.1% in gross fixed investment (which wasat least partly related to political and security jitters in advance of the 2004presidential election).
In 2004 private consumption remained strong, growing by 5.8% year on year, asremittances from overseas Filipino workers grew rapidly. Government con-sumption was flat as the administration focused on the need to bring thepublic finances back into balance, and investment spending was sluggish,growing by 4.2% year on year. However, a solid 2.9-percentage-point contri-bution to GDP growth was made by the foreign balance in what was a goodyear for global trade growth. Private consumption is likely to remain relativelyfirm in 2005, but poorer prospects for external trade will reduce GDP growthcompared with last year.
Remittance inflows
The importance of the Filipino community abroad
The economy's resilience owes much to the inflow of remittances from Filipinosoverseas, both contract workers and emigrants. Remittances from overseas workersreached US$8.5bn in 2004, and continued to grow strongly in early 2005, aided bythe fact that Filipino workers abroad are increasingly likely to be doctors andnurses in OECD countries, rather than poorly paid maids in South-east Asia andthe Middle East.Investments by overseas Filipinos in domestic assets are also sizeable, especiallysince exchange controls were liberalised in 1992 and the economy entered a periodof more stable and sustained growth. An approximate indication of their value wasgiven by a payments measure on the invisibles account, unique to the Philippines,which was abandoned after 1998�inflows through the conversion to pesos offoreign-currency deposits. In 1995-98 peso conversions averaged around US$5bn ayear, of which a significant proportion is likely to have represented inflows fromFilipinos abroad. Trends in these inflows consequently have an impact on the paceof overall economic growth, as they represent a significant source of income forFilipino households and generate demand for Philippine assets.
Consumer price inflation was steady at around the 8% level through much ofthe early and mid-1990s, when GDP growth was tending to rise, largely owingto the stability of the peso against the US dollar. It was the steep fall in thepeso's value in the second half of 1997 in the wake of the regional financialcrisis, and the price pressure resulting from a much smaller rice crop, thatpushed the year-on-year inflation rate up to 10-11% in May 1998-January 1999and to an average of 9.2% in 1998 as a whole (calculated according to the newbasket, which uses 2000 as the base year).
Inflation takes off again after aperiod of easing
Private consumptionunderpins growth
Philippines 29
© The Economist Intelligence Unit Limited 2005 www.eiu.com Country Profile 2005
With the rebound in the rice crop, and despite the recovery in oil prices, theyear-on-year rate of consumer price inflation fell in virtually every month of1999, to record an average of 6% for the year as a whole. The rate fell to 4% in2000 as the government countered the surge in energy prices through subsidiesto control the price of state-supplied rice. The plummeting of the peso inresponse to the political crisis surrounding the ouster of Mr Estrada from thepresidency caused annual average inflation to creep up to 6.8% in 2001.However, a plentiful rice supply and a steadying of the peso then allowedconsumer price inflation to ease to 3% in 2002. Low prices for foodstuffs and oilkept inflationary pressures subdued in 2003, when an average inflation rate of3.5% was recorded. Inflation has since crept up, reaching an average of 6% in2004 and exceeding 8% year on year between November 2004 and May 2005,owing to the depreciation of the peso and the impact of high global oil prices.Inflation had fallen back to 7.1% by July 2005, but the prospect of continuedhigh oil prices means that further sharp falls are unlikely during the remainderof the year.
For most of the 1990s real wages were in decline. Wages tended to lag behindthe rise in prices, with sudden catch-up increases in response to pressures suchas a surge in food prices or an imminent national election. Although the trendhas fluctuated in recent years, overall wage increases have not kept pace withconsumer price inflation. National Statistics Office figures, compiled on thebasis of legislated wage rates for non-agricultural workers in the NationalCapital Region, show that real wages fell by 3.8% in 2003 and then dropped bya further 0.2% in 2004, despite the implementation of an increase in thelegislated wage rate in the middle of the latter year. Following increases inpower and transport tariffs and the passage of a law extending VAT, thegovernment is currently facing further pressure to allow an increase in wagerates. However, minimum wage rates remain much higher than in China, forexample, which has a slightly higher level of GDP per head.
Regional trends
There is a wide disparity in wealth between different regions. The NationalCapital Region (NCR) accounts for more than one-third of the economy'soutput, and its GDP per head is nearly three times the national average. In2003, the latest year for which statistics are available, only one other region�theCordillera Administrative Region�recorded a level of income per head abovethe national average, at P52,238 (US$932), whereas income per head in the fourautonomous provinces in Muslim Mindanao was less than one-quarter of thenational average. This reflects the concentration of manufacturing activity inthe Manila area. However, growth points have been developing in otherregions�notably in Southern Tagalog, where industrial parks have been thefocus for much investment, both domestic and foreign, in recent years.
Wage increases broadly lagbehind price inflation
There are wide regionaldisparities in wealth
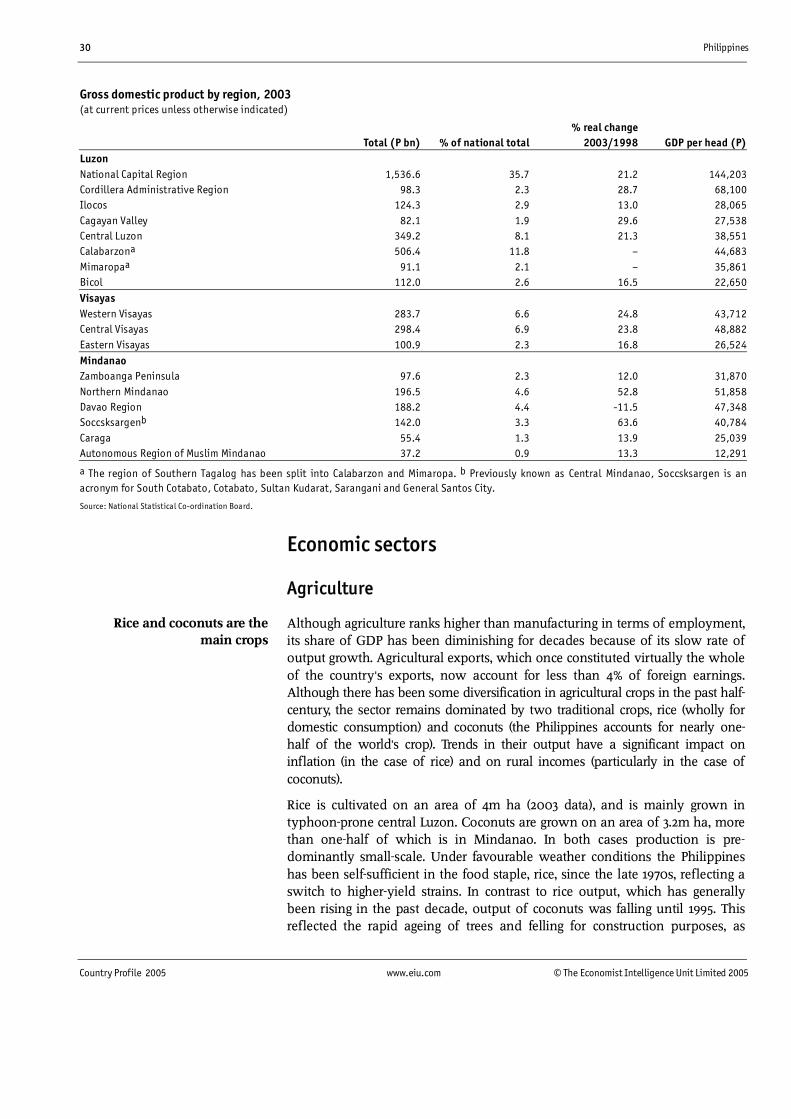
30 Philippines
Country Profile 2005 www.eiu.com © The Economist Intelligence Unit Limited 2005
Gross domestic product by region, 2003(at current prices unless otherwise indicated)
% real changeTotal (P bn) % of national total 2003/1998 GDP per head (P)
LuzonNational Capital Region 1,536.6 35.7 21.2 144,203Cordillera Administrative Region 98.3 2.3 28.7 68,100Ilocos 124.3 2.9 13.0 28,065Cagayan Valley 82.1 1.9 29.6 27,538Central Luzon 349.2 8.1 21.3 38,551Calabarzona 506.4 11.8 � 44,683Mimaropaa 91.1 2.1 � 35,861Bicol 112.0 2.6 16.5 22,650VisayasWestern Visayas 283.7 6.6 24.8 43,712Central Visayas 298.4 6.9 23.8 48,882Eastern Visayas 100.9 2.3 16.8 26,524MindanaoZamboanga Peninsula 97.6 2.3 12.0 31,870Northern Mindanao 196.5 4.6 52.8 51,858Davao Region 188.2 4.4 -11.5 47,348Soccsksargenb 142.0 3.3 63.6 40,784Caraga 55.4 1.3 13.9 25,039Autonomous Region of Muslim Mindanao 37.2 0.9 13.3 12,291
a The region of Southern Tagalog has been split into Calabarzon and Mimaropa. b Previously known as Central Mindanao, Soccsksargen is anacronym for South Cotabato, Cotabato, Sultan Kudarat, Sarangani and General Santos City.
Source: National Statistical Co-ordination Board.
Economic sectors
Agriculture
Although agriculture ranks higher than manufacturing in terms of employment,its share of GDP has been diminishing for decades because of its slow rate ofoutput growth. Agricultural exports, which once constituted virtually the wholeof the country's exports, now account for less than 4% of foreign earnings.Although there has been some diversification in agricultural crops in the past half-century, the sector remains dominated by two traditional crops, rice (wholly fordomestic consumption) and coconuts (the Philippines accounts for nearly one-half of the world's crop). Trends in their output have a significant impact oninflation (in the case of rice) and on rural incomes (particularly in the case ofcoconuts).
Rice is cultivated on an area of 4m ha (2003 data), and is mainly grown intyphoon-prone central Luzon. Coconuts are grown on an area of 3.2m ha, morethan one-half of which is in Mindanao. In both cases production is pre-dominantly small-scale. Under favourable weather conditions the Philippineshas been self-sufficient in the food staple, rice, since the late 1970s, reflecting aswitch to higher-yield strains. In contrast to rice output, which has generallybeen rising in the past decade, output of coconuts was falling until 1995. Thisreflected the rapid ageing of trees and felling for construction purposes, as
Rice and coconuts are themain crops
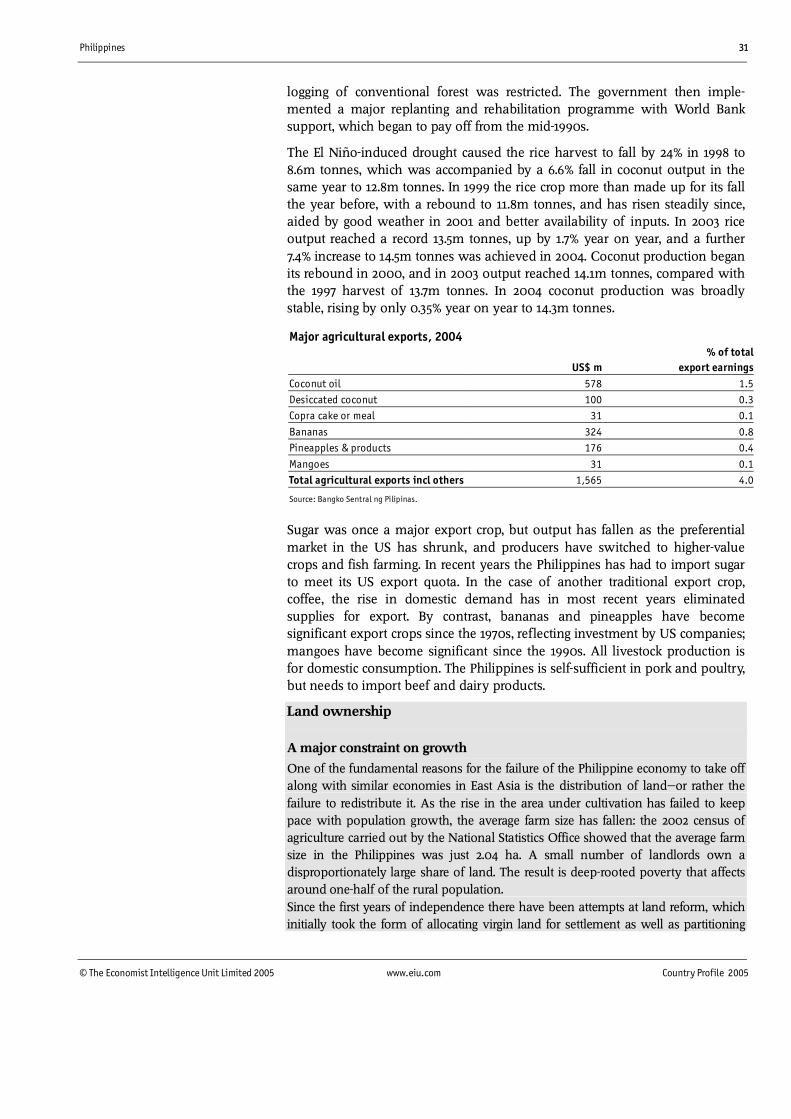
Philippines 31
© The Economist Intelligence Unit Limited 2005 www.eiu.com Country Profile 2005
logging of conventional forest was restricted. The government then imple-mented a major replanting and rehabilitation programme with World Banksupport, which began to pay off from the mid-1990s.
The El Niño-induced drought caused the rice harvest to fall by 24% in 1998 to8.6m tonnes, which was accompanied by a 6.6% fall in coconut output in thesame year to 12.8m tonnes. In 1999 the rice crop more than made up for its fallthe year before, with a rebound to 11.8m tonnes, and has risen steadily since,aided by good weather in 2001 and better availability of inputs. In 2003 riceoutput reached a record 13.5m tonnes, up by 1.7% year on year, and a further7.4% increase to 14.5m tonnes was achieved in 2004. Coconut production beganits rebound in 2000, and in 2003 output reached 14.1m tonnes, compared withthe 1997 harvest of 13.7m tonnes. In 2004 coconut production was broadlystable, rising by only 0.35% year on year to 14.3m tonnes.
Major agricultural exports, 2004% of total
US$ m export earningsCoconut oil 578 1.5Desiccated coconut 100 0.3Copra cake or meal 31 0.1
Bananas 324 0.8Pineapples & products 176 0.4
Mangoes 31 0.1Total agricultural exports incl others 1,565 4.0
Source: Bangko Sentral ng Pilipinas.
Sugar was once a major export crop, but output has fallen as the preferentialmarket in the US has shrunk, and producers have switched to higher-valuecrops and fish farming. In recent years the Philippines has had to import sugarto meet its US export quota. In the case of another traditional export crop,coffee, the rise in domestic demand has in most recent years eliminatedsupplies for export. By contrast, bananas and pineapples have becomesignificant export crops since the 1970s, reflecting investment by US companies;mangoes have become significant since the 1990s. All livestock production isfor domestic consumption. The Philippines is self-sufficient in pork and poultry,but needs to import beef and dairy products.
Land ownership
A major constraint on growth
One of the fundamental reasons for the failure of the Philippine economy to take offalong with similar economies in East Asia is the distribution of land�or rather thefailure to redistribute it. As the rise in the area under cultivation has failed to keeppace with population growth, the average farm size has fallen: the 2002 census ofagriculture carried out by the National Statistics Office showed that the average farmsize in the Philippines was just 2.04 ha. A small number of landlords own adisproportionately large share of land. The result is deep-rooted poverty that affectsaround one-half of the rural population.Since the first years of independence there have been attempts at land reform, whichinitially took the form of allocating virgin land for settlement as well as partitioning
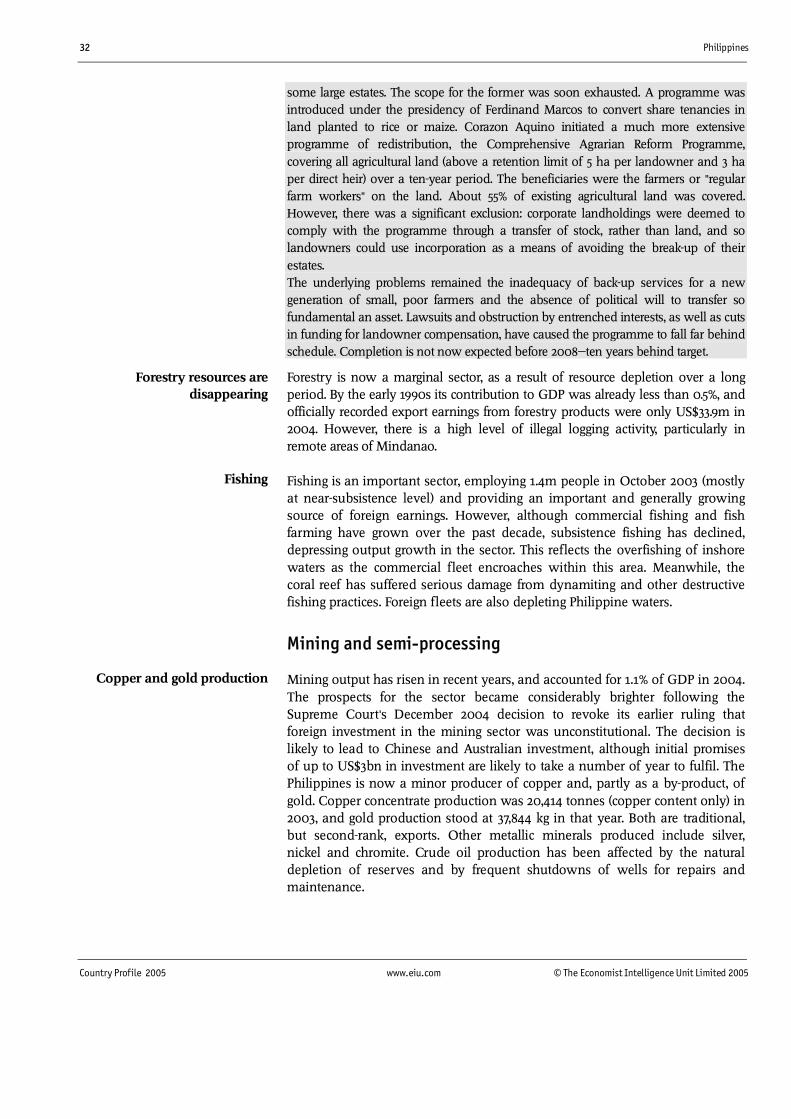
32 Philippines
Country Profile 2005 www.eiu.com © The Economist Intelligence Unit Limited 2005
some large estates. The scope for the former was soon exhausted. A programme wasintroduced under the presidency of Ferdinand Marcos to convert share tenancies inland planted to rice or maize. Corazon Aquino initiated a much more extensiveprogramme of redistribution, the Comprehensive Agrarian Reform Programme,covering all agricultural land (above a retention limit of 5 ha per landowner and 3 haper direct heir) over a ten-year period. The beneficiaries were the farmers or "regularfarm workers" on the land. About 55% of existing agricultural land was covered.However, there was a significant exclusion: corporate landholdings were deemed tocomply with the programme through a transfer of stock, rather than land, and solandowners could use incorporation as a means of avoiding the break-up of theirestates.The underlying problems remained the inadequacy of back-up services for a newgeneration of small, poor farmers and the absence of political will to transfer sofundamental an asset. Lawsuits and obstruction by entrenched interests, as well as cutsin funding for landowner compensation, have caused the programme to fall far behindschedule. Completion is not now expected before 2008�ten years behind target.
Forestry is now a marginal sector, as a result of resource depletion over a longperiod. By the early 1990s its contribution to GDP was already less than 0.5%, andofficially recorded export earnings from forestry products were only US$33.9m in2004. However, there is a high level of illegal logging activity, particularly inremote areas of Mindanao.
Fishing is an important sector, employing 1.4m people in October 2003 (mostlyat near-subsistence level) and providing an important and generally growingsource of foreign earnings. However, although commercial fishing and fishfarming have grown over the past decade, subsistence fishing has declined,depressing output growth in the sector. This reflects the overfishing of inshorewaters as the commercial fleet encroaches within this area. Meanwhile, thecoral reef has suffered serious damage from dynamiting and other destructivefishing practices. Foreign fleets are also depleting Philippine waters.
Mining and semi-processing
Mining output has risen in recent years, and accounted for 1.1% of GDP in 2004.The prospects for the sector became considerably brighter following theSupreme Court's December 2004 decision to revoke its earlier ruling thatforeign investment in the mining sector was unconstitutional. The decision islikely to lead to Chinese and Australian investment, although initial promisesof up to US$3bn in investment are likely to take a number of year to fulfil. ThePhilippines is now a minor producer of copper and, partly as a by-product, ofgold. Copper concentrate production was 20,414 tonnes (copper content only) in2003, and gold production stood at 37,844 kg in that year. Both are traditional,but second-rank, exports. Other metallic minerals produced include silver,nickel and chromite. Crude oil production has been affected by the naturaldepletion of reserves and by frequent shutdowns of wells for repairs andmaintenance.
Forestry resources aredisappearing
Fishing
Copper and gold production
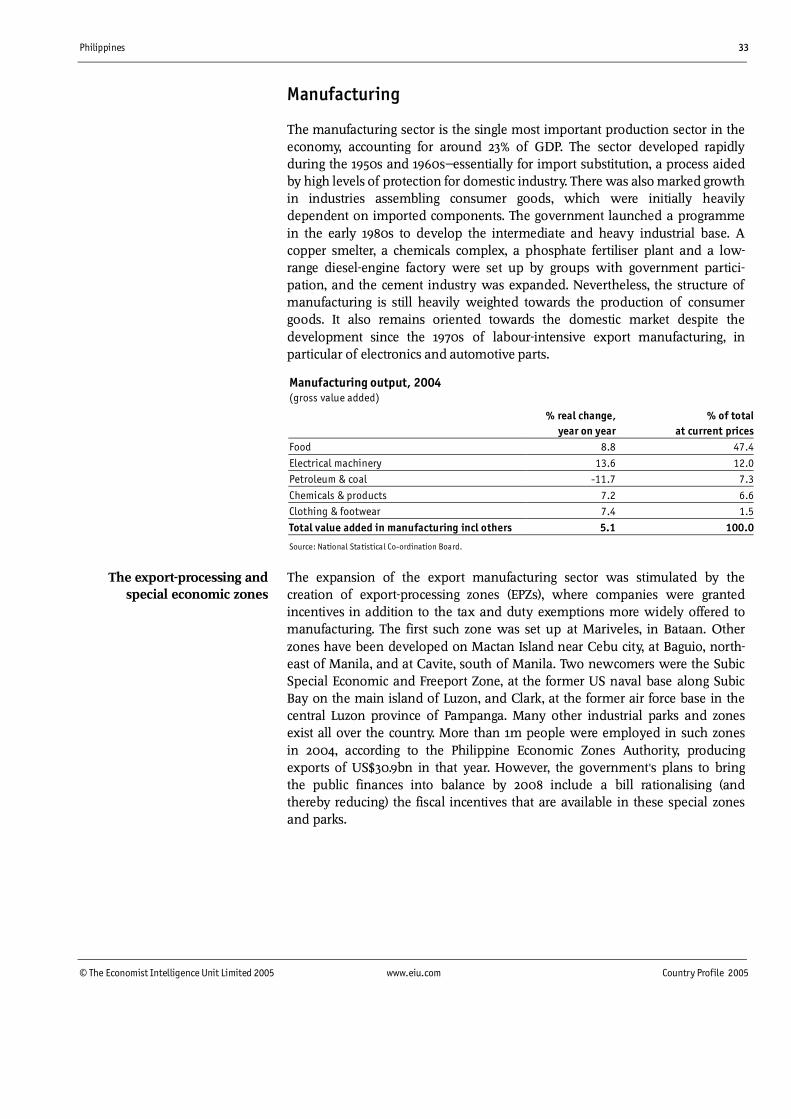
Philippines 33
© The Economist Intelligence Unit Limited 2005 www.eiu.com Country Profile 2005
Manufacturing
The manufacturing sector is the single most important production sector in theeconomy, accounting for around 23% of GDP. The sector developed rapidlyduring the 1950s and 1960s�essentially for import substitution, a process aidedby high levels of protection for domestic industry. There was also marked growthin industries assembling consumer goods, which were initially heavilydependent on imported components. The government launched a programmein the early 1980s to develop the intermediate and heavy industrial base. Acopper smelter, a chemicals complex, a phosphate fertiliser plant and a low-range diesel-engine factory were set up by groups with government partici-pation, and the cement industry was expanded. Nevertheless, the structure ofmanufacturing is still heavily weighted towards the production of consumergoods. It also remains oriented towards the domestic market despite thedevelopment since the 1970s of labour-intensive export manufacturing, inparticular of electronics and automotive parts.
Manufacturing output, 2004(gross value added)
% real change, % of totalyear on year at current prices
Food 8.8 47.4
Electrical machinery 13.6 12.0Petroleum & coal -11.7 7.3
Chemicals & products 7.2 6.6Clothing & footwear 7.4 1.5
Total value added in manufacturing incl others 5.1 100.0
Source: National Statistical Co-ordination Board.
The expansion of the export manufacturing sector was stimulated by thecreation of export-processing zones (EPZs), where companies were grantedincentives in addition to the tax and duty exemptions more widely offered tomanufacturing. The first such zone was set up at Mariveles, in Bataan. Otherzones have been developed on Mactan Island near Cebu city, at Baguio, north-east of Manila, and at Cavite, south of Manila. Two newcomers were the SubicSpecial Economic and Freeport Zone, at the former US naval base along SubicBay on the main island of Luzon, and Clark, at the former air force base in thecentral Luzon province of Pampanga. Many other industrial parks and zonesexist all over the country. More than 1m people were employed in such zonesin 2004, according to the Philippine Economic Zones Authority, producingexports of US$30.9bn in that year. However, the government's plans to bringthe public finances into balance by 2008 include a bill rationalising (andthereby reducing) the fiscal incentives that are available in these special zonesand parks.
The export-processing andspecial economic zones
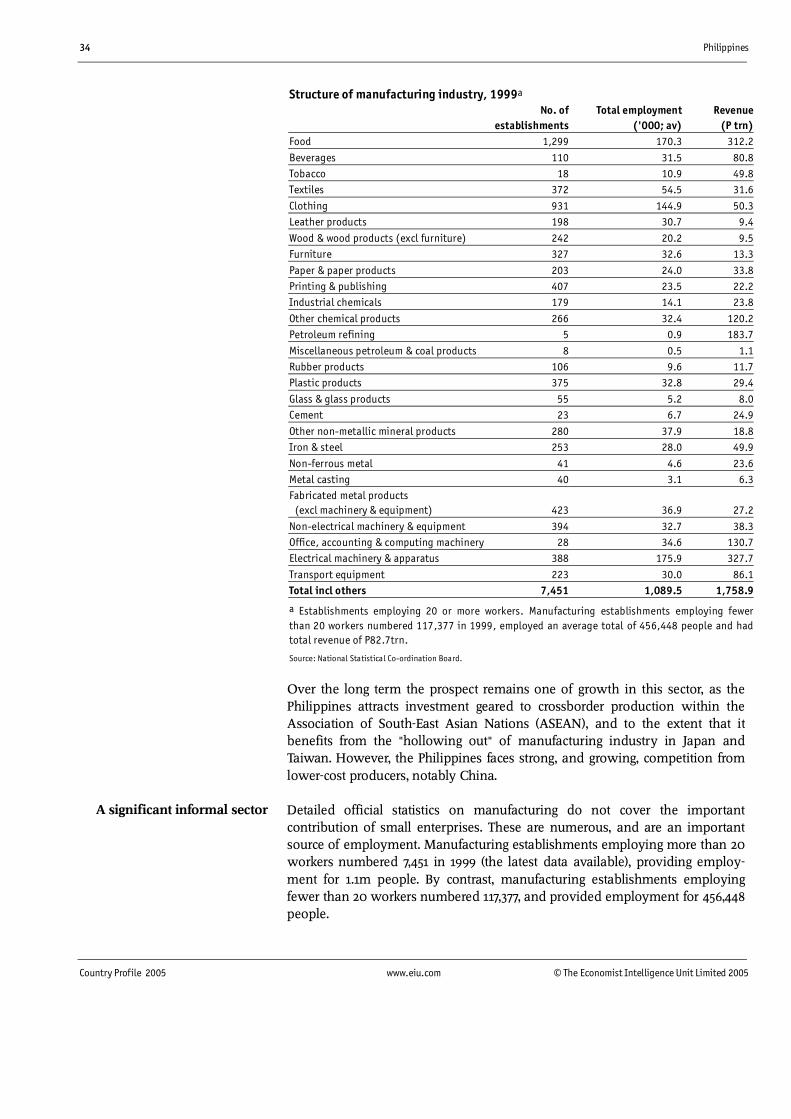
34 Philippines
Country Profile 2005 www.eiu.com © The Economist Intelligence Unit Limited 2005
Structure of manufacturing industry, 1999a
No. of Total employment Revenueestablishments ('000; av) (P trn)
Food 1,299 170.3 312.2
Beverages 110 31.5 80.8Tobacco 18 10.9 49.8Textiles 372 54.5 31.6
Clothing 931 144.9 50.3Leather products 198 30.7 9.4
Wood & wood products (excl furniture) 242 20.2 9.5Furniture 327 32.6 13.3
Paper & paper products 203 24.0 33.8Printing & publishing 407 23.5 22.2Industrial chemicals 179 14.1 23.8
Other chemical products 266 32.4 120.2Petroleum refining 5 0.9 183.7
Miscellaneous petroleum & coal products 8 0.5 1.1Rubber products 106 9.6 11.7Plastic products 375 32.8 29.4
Glass & glass products 55 5.2 8.0Cement 23 6.7 24.9
Other non-metallic mineral products 280 37.9 18.8Iron & steel 253 28.0 49.9
Non-ferrous metal 41 4.6 23.6Metal casting 40 3.1 6.3Fabricated metal products
(excl machinery & equipment) 423 36.9 27.2
Non-electrical machinery & equipment 394 32.7 38.3Office, accounting & computing machinery 28 34.6 130.7Electrical machinery & apparatus 388 175.9 327.7
Transport equipment 223 30.0 86.1Total incl others 7,451 1,089.5 1,758.9
a Establishments employing 20 or more workers. Manufacturing establishments employing fewerthan 20 workers numbered 117,377 in 1999, employed an average total of 456,448 people and hadtotal revenue of P82.7trn.
Source: National Statistical Co-ordination Board.
Over the long term the prospect remains one of growth in this sector, as thePhilippines attracts investment geared to crossborder production within theAssociation of South-East Asian Nations (ASEAN), and to the extent that itbenefits from the "hollowing out" of manufacturing industry in Japan andTaiwan. However, the Philippines faces strong, and growing, competition fromlower-cost producers, notably China.
Detailed official statistics on manufacturing do not cover the importantcontribution of small enterprises. These are numerous, and are an importantsource of employment. Manufacturing establishments employing more than 20workers numbered 7,451 in 1999 (the latest data available), providing employ-ment for 1.1m people. By contrast, manufacturing establishments employingfewer than 20 workers numbered 117,377, and provided employment for 456,448people.
A significant informal sector
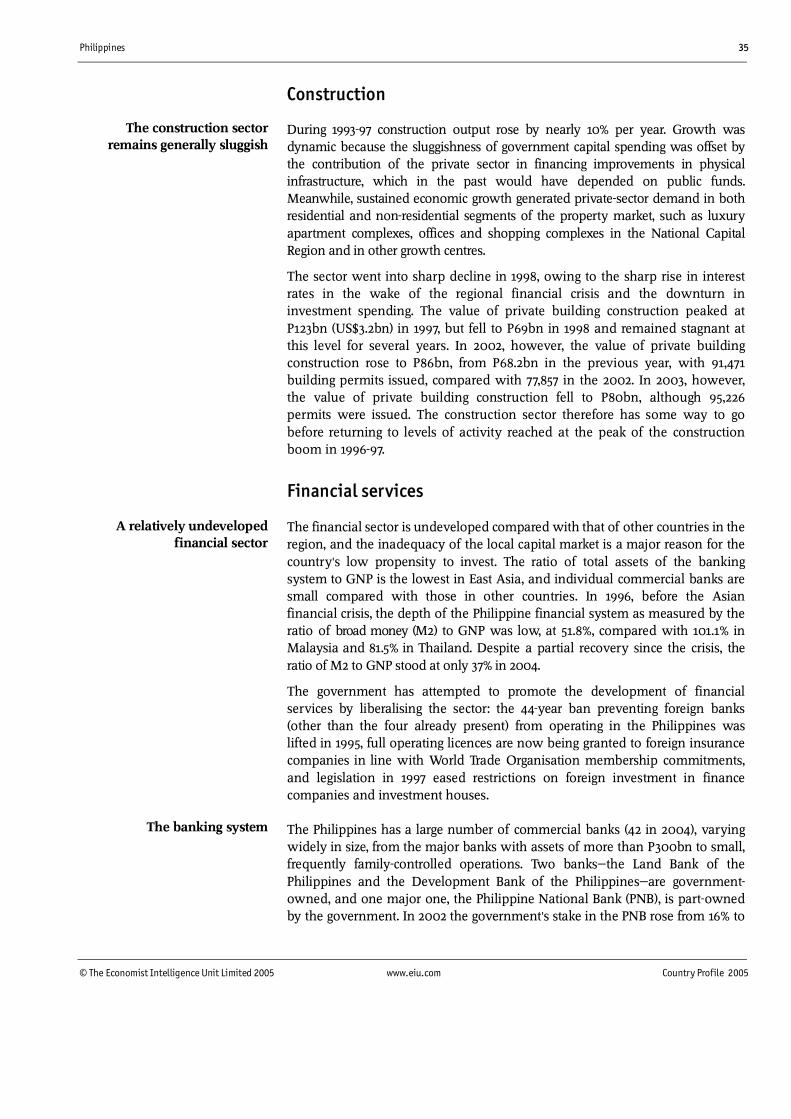
Philippines 35
© The Economist Intelligence Unit Limited 2005 www.eiu.com Country Profile 2005
Construction
During 1993-97 construction output rose by nearly 10% per year. Growth wasdynamic because the sluggishness of government capital spending was offset bythe contribution of the private sector in financing improvements in physicalinfrastructure, which in the past would have depended on public funds.Meanwhile, sustained economic growth generated private-sector demand in bothresidential and non-residential segments of the property market, such as luxuryapartment complexes, offices and shopping complexes in the National CapitalRegion and in other growth centres.
The sector went into sharp decline in 1998, owing to the sharp rise in interestrates in the wake of the regional financial crisis and the downturn ininvestment spending. The value of private building construction peaked atP123bn (US$3.2bn) in 1997, but fell to P69bn in 1998 and remained stagnant atthis level for several years. In 2002, however, the value of private buildingconstruction rose to P86bn, from P68.2bn in the previous year, with 91,471building permits issued, compared with 77,857 in the 2002. In 2003, however,the value of private building construction fell to P80bn, although 95,226permits were issued. The construction sector therefore has some way to gobefore returning to levels of activity reached at the peak of the constructionboom in 1996-97.
Financial services
The financial sector is undeveloped compared with that of other countries in theregion, and the inadequacy of the local capital market is a major reason for thecountry's low propensity to invest. The ratio of total assets of the bankingsystem to GNP is the lowest in East Asia, and individual commercial banks aresmall compared with those in other countries. In 1996, before the Asianfinancial crisis, the depth of the Philippine financial system as measured by theratio of broad money (M2) to GNP was low, at 51.8%, compared with 101.1% inMalaysia and 81.5% in Thailand. Despite a partial recovery since the crisis, theratio of M2 to GNP stood at only 37% in 2004.
The government has attempted to promote the development of financialservices by liberalising the sector: the 44-year ban preventing foreign banks(other than the four already present) from operating in the Philippines waslifted in 1995, full operating licences are now being granted to foreign insurancecompanies in line with World Trade Organisation membership commitments,and legislation in 1997 eased restrictions on foreign investment in financecompanies and investment houses.
The Philippines has a large number of commercial banks (42 in 2004), varyingwidely in size, from the major banks with assets of more than P300bn to small,frequently family-controlled operations. Two banks�the Land Bank of thePhilippines and the Development Bank of the Philippines�are government-owned, and one major one, the Philippine National Bank (PNB), is part-ownedby the government. In 2002 the government's stake in the PNB rose from 16% to
The construction sectorremains generally sluggish
The banking system
A relatively undevelopedfinancial sector
36 Philippines
Country Profile 2005 www.eiu.com © The Economist Intelligence Unit Limited 2005
45% as debt owed to the state was converted into equity. It is envisaged that therehabilitated bank will eventually be sold back to the private sector. The statealso owns a small Islamic bank, the Al-Amanah Islamic Investment Bank,which serves Muslim areas in the south of the Philippines.
Assets of the top ten commercial banks, 2004(P bn; year-end)
Metrobank 535.6
Bank of the Philippine Islands 465.8Equitable PCI Bank 306.6
Land Bank of the Philippinesa 291.6Citibank 229.0
Philippine National Bank 221.1Rizal Commercial Banking Corporation 183.6Banco de Oro 175.0
Development Bank of the Philippinesa 158.0Standard Chartered Bank 144.9
Total assets of commercial banks 3,952.2
a Government-owned.
Source: Press reports.
The general trend towards merger and consolidation was reinforced in thewake of the 1997-98 regional economic and financial crisis when highercapitalisation was demanded of all banks. In 2000 the Bank of the PhilippineIslands teamed up with Far East Bank & Trust, briefly displacing Metrobank asthe country's largest bank. Banco de Oro merged with the local unit of theHong Kong-based Dao Heng Bank in June 2001 and Planters DevelopmentBank bought a thrift institution, Active Bank, in July 2002. The passage of theSpecial-Purpose Assets Vehicle (SPAV) bill by Congress (the legislature) inDecember 2002 was designed to make it easier for banks to spin off bad loansto asset-management companies. However, banks were slow to avail them-selves of the law's provisions, and only P52bn (US$945m at current exchangerates) had been transferred by the deadline of April 2005. Congress is nowconsidering extending the SPAV act by two years to give banks a furtheropportunity to transfer their bad loans.
For 44 years, until 1995, only four foreign banks were permitted to operatebranches in the Philippines�the US-based Citibank and Bank of America,together with Hongkong & Shanghai Bank and Standard Chartered (both ofwhich are now UK-headquartered). Following the lifting of the ban, operatinglicences were granted to ten other foreign banks, mainly from the Asia andPacific region. These banks have concentrated on wholesale corporate services.It was originally envisaged that a further ten licences would be issued after atransitional period of three to five years. This target was abandoned, with theBangko Sentral ng Pilipinas (the central bank) favouring more consolidationamong domestic commercial banks before other foreign banks were allowed toenter. However, the entry of foreign banks was liberalised in the GeneralBanking Law of 2000, which raised the maximum foreign ownership level ofbanks to 40% of voting stock. In addition, under certain conditions the centralbank can allow a foreign bank to own 100% of a domestic bank. In 2004 a total
Philippines 37
© The Economist Intelligence Unit Limited 2005 www.eiu.com Country Profile 2005
of 18 foreign banks were operating in the country, but only two�Citibank andStandard Chartered�ranked among the top ten in terms of assets.
The biggest investment house is PDCP Bank, formerly known as the PrivateDevelopment Corporation, followed by the Bank of the Philippine IslandsInvestment Corporation (formerly the Ayala Investment Corporation). Thegovernment-owned Development Bank of the Philippines is an importantsource of investment for agriculture and small- and medium-scale industry. Inaddition, there is an offshore banking and foreign-currency deposit system.Offshore banking licences are available only to foreign banks, but allcommercial banks are permitted to operate foreign-currency deposit units.
The Philippines Stock Exchange (PSE) received a double boost in the early andmid-1990s from the general international interest in emerging markets and theprogramme of investment liberalisation and privatisation. The marketcapitalisation of the stockmarket rose from only P353bn at end-1992 to P2.12trn(US$80.9bn) by end-1996. However, it remained both small and highlyvulnerable to trends in world equity markets and nervousness about thedomestic political climate. Thus in 1997 the main PHISIX index fell by 41% overthe year and market capitalisation was nearly halved. The index continued tofall, reaching a seven-year low of 1,082 in September 1998.
New highs were reached in June 1999, when the main PHISIX index hit 2,487 atthe end of the month. However, falling confidence in the administration ofJoseph Estrada, which was not offset by the relative resilience of the economyin 2000, served to push down the index once more, so that it dipped below1,450 in mid-January 2001, when Mr Estrada was ousted as president. Residualpolitical uncertainty and the deterioration in demand for emerging marketequities pushed the index down even further, and it stood at just above 1,200when the September 11th terrorist attacks on the US occurred. Thereafter thePHISIX index fell along with other world markets, ending October 2001 at just993. By the end of 2001 it had recovered to 1,168, buoyed by unexpectedly goodGDP results. The PHISIX index rallied to a high of 1,470 in February 2002, butcontinuing bouts of bearish sentiment, relating to the trial of Mr Estrada andthe security problems in the south of the country, took their toll, and the indexfinished the year at 1,018. It then dipped further in early 2003.
A hesitant recovery was stalled by the attempted coup in July 2003 andpolitical concerns in advance of the 2004 elections, but the index rallied to end2003 at 1,442 as the incumbent president, Gloria Macapagal Arroyo, announcedher candidacy in the presidential election. The index ended 2004 at 1,823 inresponse to investor relief following Ms Macapagal Arroyo's victory in the Mayelection, and also in a reflection of a very good year for economic growth andof the government's new-found determination to address the public finances.In early 2005 a long period of wrangling in Congress over the VAT bill took itstoll on the market, but since April the index has generally been rising, andended July at 2,000.
Regulation of the equities market is governed by the Securities Act, which waspassed in 2000. This tightened the definition of insider trading, required fulldisclosure by listed companies, set a one-year deadline for the demutualisation
The securities market
38 Philippines
Country Profile 2005 www.eiu.com © The Economist Intelligence Unit Limited 2005
of the Philippines Stock Exchange (effected in August 2001) and enhanced thepowers of the regulatory body, the Securities and Exchange Commission (SEC).However, the quality of regulation will continue to be undermined by thepervasive personal networks active in this sector, which deter new entrants,keeping the equity market small and making it an inadequate means ofmobilising domestic savings. Much more also needs to be done to strengthenpublic listing requirements to improve corporate governance.
Other services
The retail sector was, for many decades, closed to foreign participation. Thiswas nominally to protect small corner shops from foreign competition, but theban acted to keep the bulk of retail trade small-scale, much of it in the informalsector. The 2000 Census of Philippine Business and Industry showed that in1999 the Philippines had 298,764 retail outlets (excluding retail trade in motorvehicles), employing 1.2m people. However, a trend was established in the late1980s and 1990s for the development of large shopping complexes, many ofthem in the vicinity of Manila and geared towards the higher incomes inthis region.
Tourism is an important sector, the potential of which is largely untapped. Themajor constraints are: the concentration of first-class hotel accommodation inthe capital, whereas capacity in areas offering a more varied tourist experienceis limited; inadequate domestic transport links; and the Philippines' poor imagein terms of security, which has been greatly exacerbated by the targeting oftourists by the Abu Sayyaf guerrilla group.
Tourism earnings peaked at US$2.8bn in 1997, when 2.22m visitors (includingoverseas Filipinos on home visits) came to the archipelago. However, theregional economic crisis of 1997-98 led to a downturn in arrivals, whichremained below their 1997 peak until 2004, when 2.29m visitors arrived in thePhilippines. Despite this new peak in arrivals, tourism receipts, at just underUS$2bn, were still lower than in 1997. The US, Japan and South Korea are theleading sources of foreign visitors; in 2004 the US accounted for 478,000visitors (20.9% of the total), while Japan and South Korea accounted for 382,000(16.7%) and 379,000 (16.5%) respectively.
In the first six months of 2005 visitor arrivals grew by 12.7% year on year to1.29m. Visitors from the US reached 284,000, increasing by 12.3% year on year toaccount for 22.1% of the total. A 25.6% increase in arrivals from South Koreaallowed that country to emerge as the second-largest source of arrivals, at225,000 (17.5% of the total), whereas Japanese arrivals rose by a more modest9.1% year on year to 201,000 (15.6% of the total). Arrivals from China still makeup only a small proportion of the total, at 46,000 (3.6% of the total) in the firsthalf of 2005, but Chinese arrivals are the fastest-growing category, recording ayear-on-year increase of 138.9% during the six-month period.
The retail sector
Tourism
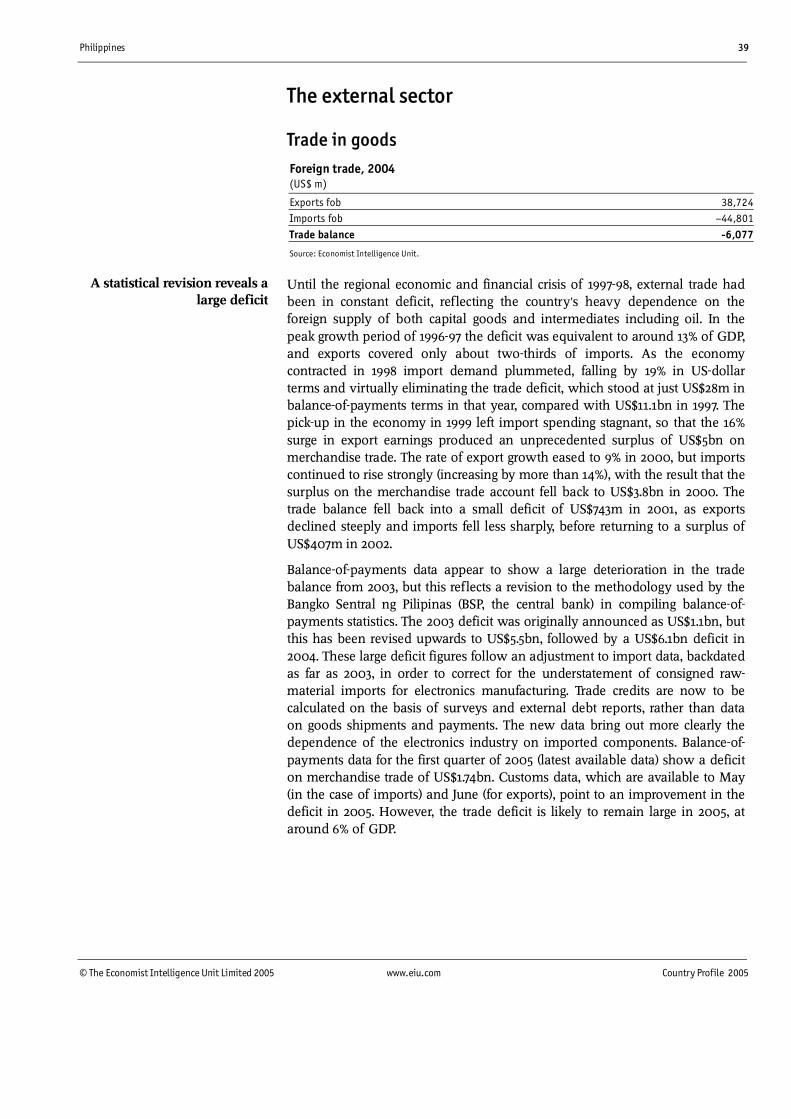
Philippines 39
© The Economist Intelligence Unit Limited 2005 www.eiu.com Country Profile 2005
The external sector
Trade in goodsForeign trade, 2004(US$ m)
Exports fob 38,724Imports fob �44,801
Trade balance -6,077
Source: Economist Intelligence Unit.
Until the regional economic and financial crisis of 1997-98, external trade hadbeen in constant deficit, reflecting the country's heavy dependence on theforeign supply of both capital goods and intermediates including oil. In thepeak growth period of 1996-97 the deficit was equivalent to around 13% of GDP,and exports covered only about two-thirds of imports. As the economycontracted in 1998 import demand plummeted, falling by 19% in US-dollarterms and virtually eliminating the trade deficit, which stood at just US$28m inbalance-of-payments terms in that year, compared with US$11.1bn in 1997. Thepick-up in the economy in 1999 left import spending stagnant, so that the 16%surge in export earnings produced an unprecedented surplus of US$5bn onmerchandise trade. The rate of export growth eased to 9% in 2000, but importscontinued to rise strongly (increasing by more than 14%), with the result that thesurplus on the merchandise trade account fell back to US$3.8bn in 2000. Thetrade balance fell back into a small deficit of US$743m in 2001, as exportsdeclined steeply and imports fell less sharply, before returning to a surplus ofUS$407m in 2002.
Balance-of-payments data appear to show a large deterioration in the tradebalance from 2003, but this reflects a revision to the methodology used by theBangko Sentral ng Pilipinas (BSP, the central bank) in compiling balance-of-payments statistics. The 2003 deficit was originally announced as US$1.1bn, butthis has been revised upwards to US$5.5bn, followed by a US$6.1bn deficit in2004. These large deficit figures follow an adjustment to import data, backdatedas far as 2003, in order to correct for the understatement of consigned raw-material imports for electronics manufacturing. Trade credits are now to becalculated on the basis of surveys and external debt reports, rather than dataon goods shipments and payments. The new data bring out more clearly thedependence of the electronics industry on imported components. Balance-of-payments data for the first quarter of 2005 (latest available data) show a deficiton merchandise trade of US$1.74bn. Customs data, which are available to May(in the case of imports) and June (for exports), point to an improvement in thedeficit in 2005. However, the trade deficit is likely to remain large in 2005, ataround 6% of GDP.
A statistical revision reveals alarge deficit
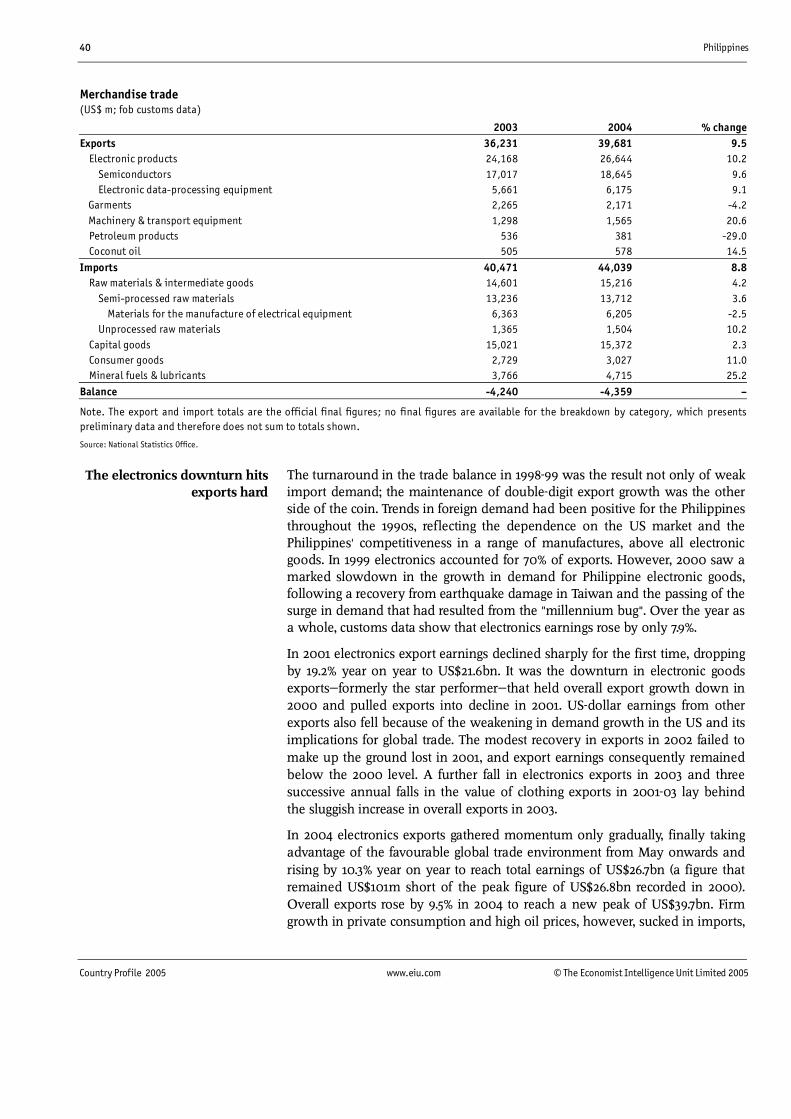
40 Philippines
Country Profile 2005 www.eiu.com © The Economist Intelligence Unit Limited 2005
Merchandise trade(US$ m; fob customs data)
2003 2004 % changeExports 36,231 39,681 9.5 Electronic products 24,168 26,644 10.2 Semiconductors 17,017 18,645 9.6 Electronic data-processing equipment 5,661 6,175 9.1 Garments 2,265 2,171 -4.2 Machinery & transport equipment 1,298 1,565 20.6 Petroleum products 536 381 -29.0 Coconut oil 505 578 14.5
Imports 40,471 44,039 8.8 Raw materials & intermediate goods 14,601 15,216 4.2 Semi-processed raw materials 13,236 13,712 3.6 Materials for the manufacture of electrical equipment 6,363 6,205 -2.5 Unprocessed raw materials 1,365 1,504 10.2 Capital goods 15,021 15,372 2.3 Consumer goods 2,729 3,027 11.0 Mineral fuels & lubricants 3,766 4,715 25.2
Balance -4,240 -4,359 �
Note. The export and import totals are the official final figures; no final figures are available for the breakdown by category, which presentspreliminary data and therefore does not sum to totals shown.
Source: National Statistics Office.
The turnaround in the trade balance in 1998-99 was the result not only of weakimport demand; the maintenance of double-digit export growth was the otherside of the coin. Trends in foreign demand had been positive for the Philippinesthroughout the 1990s, reflecting the dependence on the US market and thePhilippines' competitiveness in a range of manufactures, above all electronicgoods. In 1999 electronics accounted for 70% of exports. However, 2000 saw amarked slowdown in the growth in demand for Philippine electronic goods,following a recovery from earthquake damage in Taiwan and the passing of thesurge in demand that had resulted from the "millennium bug". Over the year asa whole, customs data show that electronics earnings rose by only 7.9%.
In 2001 electronics export earnings declined sharply for the first time, droppingby 19.2% year on year to US$21.6bn. It was the downturn in electronic goodsexports�formerly the star performer�that held overall export growth down in2000 and pulled exports into decline in 2001. US-dollar earnings from otherexports also fell because of the weakening in demand growth in the US and itsimplications for global trade. The modest recovery in exports in 2002 failed tomake up the ground lost in 2001, and export earnings consequently remainedbelow the 2000 level. A further fall in electronics exports in 2003 and threesuccessive annual falls in the value of clothing exports in 2001-03 lay behindthe sluggish increase in overall exports in 2003.
In 2004 electronics exports gathered momentum only gradually, finally takingadvantage of the favourable global trade environment from May onwards andrising by 10.3% year on year to reach total earnings of US$26.7bn (a figure thatremained US$101m short of the peak figure of US$26.8bn recorded in 2000).Overall exports rose by 9.5% in 2004 to reach a new peak of US$39.7bn. Firmgrowth in private consumption and high oil prices, however, sucked in imports,
The electronics downturn hitsexports hard
Philippines 41
© The Economist Intelligence Unit Limited 2005 www.eiu.com Country Profile 2005
which grew by 8.8% in 2004 to US$44bn, producing a trade deficit (in customsterms) of US$4.36bn. In the first six months of 2005 the regional and globalslowdowns in trade growth led to a very anaemic trade picture for thePhilippines. Export growth averaged just over 3% year on year during the six-month period, whereas in January-May imports recorded year-on-year declinesin every month. As exports are import-intensive, this points to continuedsluggish growth in external trade over the rest of the year.
Trade liberalisation in the region
For over two decades now the Philippines has been broadly lowering its (tariffand non-tariff) trade barriers�globally in line with its subscription to theGeneral Agreement on Tariffs and Trade (GATT) and subsequent membershipof the World Trade Organisation (WTO), and regionally as a member ofthe Association of South-East Asian Nations (ASEAN). The regional tradeliberalisation programme began in 1978 when a mutual preference agreementcame into effect, covering specified goods including rice, sugar, crude oil,cement and chemicals. A programme of tariff reduction was agreed in 1992,designed to lead to the setting up of a free-trade area (the ASEAN Free-TradeArea, or AFTA) within 15 years, with a ceiling of 20% for tariffs onmanufactured and processed goods within five to eight years, and 5% by theend of the 15-year period. An accelerated programme, reducing the schedule toseven years, applied to 15 priority products. In 1993 the 15-year period wasshortened to ten years, with tariffs then below 20% falling to 5% by 2000, andthose over 20% scheduled to reach this level by 2003. For some goods the 0-5%rate was to be implemented by 1998. Tariffs within ASEAN would thus fall toan average of 2.6% by 2003, from 13.4% in 1994. The goods excluded from theAFTA liberalisation were to be reduced in number, so that the programme'scoverage of intra-ASEAN trade would rise from 85% to nearly 100%. Thisschedule fell victim to the regional economic and financial crisis of 1997-98when economic growth in ASEAN slowed sharply, generating protectionistpressures to varying degrees. Consequently it was agreed in late 2000 to relaxthe tariff-cutting schedule, and member states were permitted to keep productson the temporary exclusion list longer.
Despite the impact of the Asian financial crisis, the Philippines had reduced theoverall average trade-weighted tariff on imports to 3.64% by 2003. A series oftariff increases were implemented in late 2003 and early 2004, but according tothe Philippine Tariff Commission these have increased the average trade-weighted tariff to just 3.78% in 2004 (on a non-trade weighted basis, the simpleaverage tariff increased from 6.03% in 2002 to 7.51% in 2004). The increasescame in response to political pressure from businesses and unions alike toincrease tariffs in the run-up to the elections, but were much smaller than thosedemanded by interest groups. First, the scheduled reduction was suspended forpetrochemical resins and certain finished plastic products. Then, more compre-hensively, duties were raised from November 2003 through to 2007 on a list of464 manufactured goods including pharmaceuticals, clothing accessories, shoesand wooden furniture. In the following month the recommendations of thegovernment agency reviewing commitments under the WTO were accepted:
Tariff levels are broadly low
42 Philippines
Country Profile 2005 www.eiu.com © The Economist Intelligence Unit Limited 2005
increases in import duty on 671 items produced locally were implemented, andthe sharply higher rates imposed on some agricultural products in May 2003were retained.
Exports, once highly concentrated on the US market (which took around 35%of Philippine exports during most of the 1990s), have in recent years becomemore clearly focused on Asia. In 2004 the US accounted for 17.9% of Philippineexports, with Japan emerging as the largest market, taking 20.1%; theNetherlands is in third place, taking 9.1%. Japan is also the leading source ofimports, at 19.8% of the total, owing to its dominance as a provider of aidfunds and its investment in manufacturing in the Philippines. In 2004 around13.7% of imports were sourced from the US and 7.7% from mainland China. In2004 the ASEAN countries took 17.2% of Philippine exports, almost as much asthe US, and were ahead of the US as a source of imports, providing 17.2% ofthe total. The Philippines' largest trade partner in ASEAN is Singapore.
Invisibles and the current account
In contrast to trade in goods, the balance on invisibles has always been in surplus.Historically, this was not enough to push the current-account balance into theblack, but trade surpluses or small trade deficits in recent years allowed a seriesof current-account surplus to be recorded in 1998-2004. The peak figure for thecurrent-account surplus was the US$7.2bn recorded (according to the nationalseries) in 1999, as exports recovered in the wake of the regional financial crisis.The surplus had narrowed to US$1.3bn by 2001, during a difficult period forelectronics exports, but recovered to US$4.4bn in 2002. The revision to theBSP's balance-of-payments methodology (see Trade in goods) means that alarge rise in the trade deficit was recorded in 2003-04, but this was largelyoffset by a fuller recording of current transfers credits (largely consisting ofremittances from overseas Filipino workers, or OFWs) to capture remittancesthrough informal channels, with the result that the current account remainedin surplus in 2003 and 2004.
A further change to the balance-of-payments statistical methodology has beento split remittances, previously classified as income credits, into earnings ofresident OFWs, recorded in the income account, and remittances of non-resident OFWs, which have been moved to the current transfers account. (Thismeans that data from 2003 cannot be compared with data up to 2002.) It isremittances from OFWs that are responsible for keeping the overall currentaccount in surplus. BSP data show that such remittances rose by 21.5% year onyear in the first half of 2005, to US$4.9bn. However, tourism also makes auseful contribution: the national presentation of balance-of-payments datashows that the travel account made a net contribution to the current-accountsurplus of US$697m in 2004. By far the most important outflow on invisibles isinterest, arising from the Philippines' substantial stock of external borrowing.Transfers other than workers' remittances make a minor positive contribution tothe invisibles account, but the official component has changed little in mostrecent years, as the Philippines' middle-income status renders it ineligible formuch in the way of grant funding.
External trade becomes morefocused on Asia
A structural surplus
Philippines 43
© The Economist Intelligence Unit Limited 2005 www.eiu.com Country Profile 2005
The sizeable surplus on the current account in 1999 and 2000 temporarilyremoved a major funding requirement from the Philippine economy, but thefall in the current-account surplus and the increase in principal repayments onexternal debt has left the Philippines with a large funding requirement, whichreached US$6bn in 2003 (the most recent year for which World Bank data areavailable). The Philippines is likely to maintain a large financing requirementuntil significant progress is made on paring back the country's large stock offoreign borrowing.
Capital flows and foreign debt
In every year from 1997 to 2000 there was a marked deterioration in thefinancial account balance, which fell to a deficit of US$4bn in 2000, comparedwith a surplus of US$11.1bn in 1996. The deficit in 2000 was sufficient to offsetthe record surplus on the current account, and helped to push the overallpayments balance into deficit to the tune of US$376m (according IMF balance-of-payments data). Payments moved back into the black in 2001, but smalldeficits were once again recorded in 2002-03. In 2004 an increase in portfoliooutflows pushed the overall balance of payments into a deficit of US$1.59bn,amid continuing concerns over the sustainability of the country's public debtposition.
It is clear that the financial account lies at the heart of the weakness of thePhilippine balance of payments, fully offsetting the structural surplus on thecurrent account built up as a result of the large number of Filipinos workingabroad. Direct investment inflows have been relatively low given the size of theeconomy and the guarantees enshrined in the constitution, and until 2002generally fell between US$1.5bn and US$2bn a year. However, politicalinstability, the country's struggle to compete with China in the area ofmanufactured exports and concern over the possibility of a fiscal crisis reduceddirect investment inflows to just US$347m in 2003 and US$469m in 2004.Portfolio investment flows, inherently more volatile, have reflected inter-national and regional economic developments (such as the regional financialcrisis in 1997), trends in the interest differential on peso assets and foreignperceptions of political risk. Thus portfolio investment registered a net inflow(not including foreign-currency bonds) of US$6.9bn in 1999, but posted netoutflows of US$1.3bn in 2003 and US$1.4bn in 2004, according to the nationalbalance-of-payments presentation.
The Philippines' large financing requirement in the past has traditionally beenmet mainly by borrowing, from both official and private sources, and by aid.Foreign borrowing continues to be used to finance the budget deficit, to buildup reserves and as a mechanism to improve the maturity and reduce the costof foreign debt. According to World Bank statistics, foreign debt rose fromUS$24.4bn at end-1984 to US$62.7bn at end-2003 (the latest year for which theBank publishes data). For most of this period the maturity profile of the debtwas shifting away from short-term debt; as a proportion of total debt, short-term debt fell from an average of 37.6% in 1983-85 to 9.9% in 2003. ThePhilippine use of international private-sector finance to fund the budget deficit
A long-term fall in short-termliabilities
A weaker financial account
44 Philippines
Country Profile 2005 www.eiu.com © The Economist Intelligence Unit Limited 2005
means that official creditors accounted for 33.8% of total external debt at end-2003, compared with 26% in 1985.
The Philippines was in arrears on its foreign debt from the early 1980s to theearly 1990s, but has met its obligations consistently since 1993. The debt/GDPratio in the Philippines is high, at 80.7% at end-2003; this compared with a ratioof 53.1% at end-1996, before the regional financial crisis. The Philippines is notin imminent danger of default, but the risk of a payments crisis cannot bediscounted. The foreign portion of the public debt stock stood at P1.81trn(US$32.3bn) at end-2004, up from P1.65trn at end-2003, and debt interestpayments, whether on foreign or domestic public debt, now consume aroundone-third of the government's budget. The certainty of continuing budgetdeficits over the next few years means that the government will continue toneed to tap international markets. Moreover, as exports of goods and servicescontinue to grow relatively sluggishly, the debt-service ratio (debt-servicepayments due as a percentage of the value of exports of goods and services)will remain high. In 2003, the most recent year for which actual data areprovided by the World Bank, the debt-service ratio was 20.6%.
Foreign reserves and the exchange rate
Foreign-exchange reserves steadied to US$12bn-14bn in 1999-2001 following thesharp fall registered during the regional financial crisis of 1997, and remainedaround this level until early 2005. The maintenance of this level of reservesreflects the role of the surplus on the current account in keeping the overallbalance of payments in near-balance in recent years. IMF figures show thatreserves (excluding gold) had risen to a record level of US$15.1bn at end-June2005. The Philippines' foreign-exchange reserves are equivalent to around fourmonths of import cover.
Over the long term the peso has depreciated against the US dollar. However,this depreciation has tended to be realised through sharp one-off correctionsafter periods when the steadiness of the peso against the dollar has producedan appreciation in real terms as a result of the large inflation differential. Aradical correction occurred during the regional economic crisis of 1997. After thepeso was floated in July 1997, it depreciated by 34% against the US dollar withinsix months, ending the year at P39.98:US$1. The currency then hovered aroundthis level for most of 1998 and into 1999.
Paradoxically, although the current account recorded a large surplus in 2000,the peso weakened sharply in that year and fell further in 2001. Initially thisstemmed from the rise in the US federal funds rates as Philippine interest ratesheld steady, which sapped demand for peso-denominated assets. However,from the beginning of 2000 political factors came into play, culminating inOctober, when the corruption allegations against the former president, JosephEstrada, caused the peso to plunge to P51.43:US$1 at end-October. This broughtthe depreciation since the beginning of 2000 to 24%. The peso then brieflystabilised�although with sharp daily fluctuations in response to every twist inthe impeachment proceedings.
Debt repayment risk
The peso suffers from bouts ofweakness
Reserves remain adequate
Philippines 45
© The Economist Intelligence Unit Limited 2005 www.eiu.com Country Profile 2005
The currency entered a period of relative stability after Gloria MacapagalArroyo took over the presidency in late January 2001, fluctuating within anarrow band around the P50:US$1 mark and ending the year at P51.4:US$1. Thedepreciation of 13.3% in the peso's average value in 2001 was in line with trendsshown by other major currencies against the US dollar. The attempted mutinyin July 2003 led to a further bout of peso weakness, and the announcementthat a populist film star, Fernando Poe, would contest the 2004 presidentialelection brought the peso down to P55.77:US$1 at end-November 2003. Thepeso fell below P56:US$1 in early 2004 as a result of political- and security-related jitters, and remained weak at the end of June 2004, at P56.18:US$1(despite the inauguration of Ms Macapagal Arroyo for a six-year presidentialterm) and ended the year at P56.27:US$1 amid concern over the government'sability to rein in the fiscal deficit.
In the early part of 2005 the peso rallied strongly, as the government seemed tobe getting to grips with the public finances. By end-April the currency wastrading at P54.37:US$1. However, the peso has since been pounded by thepolitical crisis over allegations of electoral fraud in the May 2004 presidentialelections and a slew of corruption allegations. Despite an improvement in thefiscal deficit, the peso ended July 2005 at P56.11:US$1, having lost nearly all ofthe gains that it made earlier in the year. The peso was trading at P55.93:US$1 onAugust 17th.
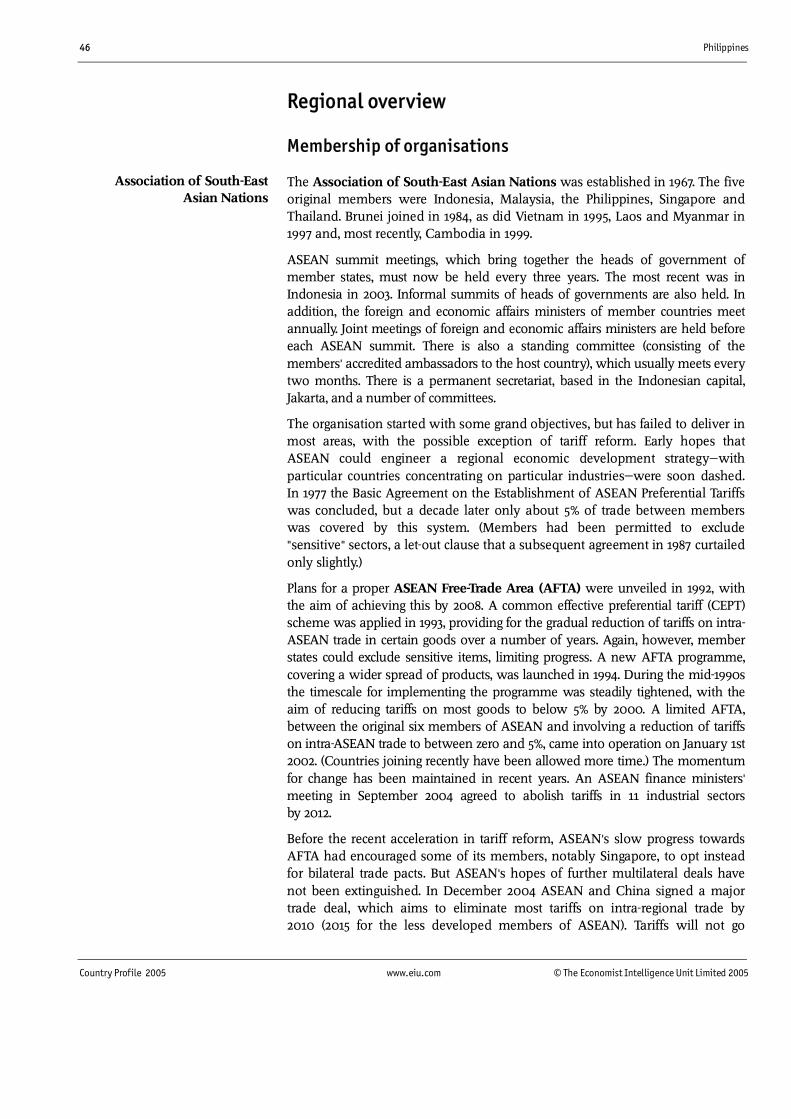
46 Philippines
Country Profile 2005 www.eiu.com © The Economist Intelligence Unit Limited 2005
Regional overview
Membership of organisations
The Association of South-East Asian Nations was established in 1967. The fiveoriginal members were Indonesia, Malaysia, the Philippines, Singapore andThailand. Brunei joined in 1984, as did Vietnam in 1995, Laos and Myanmar in1997 and, most recently, Cambodia in 1999.
ASEAN summit meetings, which bring together the heads of government ofmember states, must now be held every three years. The most recent was inIndonesia in 2003. Informal summits of heads of governments are also held. Inaddition, the foreign and economic affairs ministers of member countries meetannually. Joint meetings of foreign and economic affairs ministers are held beforeeach ASEAN summit. There is also a standing committee (consisting of themembers' accredited ambassadors to the host country), which usually meets everytwo months. There is a permanent secretariat, based in the Indonesian capital,Jakarta, and a number of committees.
The organisation started with some grand objectives, but has failed to deliver inmost areas, with the possible exception of tariff reform. Early hopes thatASEAN could engineer a regional economic development strategy�withparticular countries concentrating on particular industries�were soon dashed.In 1977 the Basic Agreement on the Establishment of ASEAN Preferential Tariffswas concluded, but a decade later only about 5% of trade between memberswas covered by this system. (Members had been permitted to exclude"sensitive" sectors, a let-out clause that a subsequent agreement in 1987 curtailedonly slightly.)
Plans for a proper ASEAN Free-Trade Area (AFTA) were unveiled in 1992, withthe aim of achieving this by 2008. A common effective preferential tariff (CEPT)scheme was applied in 1993, providing for the gradual reduction of tariffs on intra-ASEAN trade in certain goods over a number of years. Again, however, memberstates could exclude sensitive items, limiting progress. A new AFTA programme,covering a wider spread of products, was launched in 1994. During the mid-1990sthe timescale for implementing the programme was steadily tightened, with theaim of reducing tariffs on most goods to below 5% by 2000. A limited AFTA,between the original six members of ASEAN and involving a reduction of tariffson intra-ASEAN trade to between zero and 5%, came into operation on January 1st2002. (Countries joining recently have been allowed more time.) The momentumfor change has been maintained in recent years. An ASEAN finance ministers'meeting in September 2004 agreed to abolish tariffs in 11 industrial sectorsby 2012.
Before the recent acceleration in tariff reform, ASEAN's slow progress towardsAFTA had encouraged some of its members, notably Singapore, to opt insteadfor bilateral trade pacts. But ASEAN's hopes of further multilateral deals havenot been extinguished. In December 2004 ASEAN and China signed a majortrade deal, which aims to eliminate most tariffs on intra-regional trade by2010 (2015 for the less developed members of ASEAN). Tariffs will not go
Association of South-EastAsian Nations
Philippines 47
© The Economist Intelligence Unit Limited 2005 www.eiu.com Country Profile 2005
completely: countries will be able to designate a number of sectors as sensitive,and the greatest liberalisation is therefore likely to occur in areas where Chineseand ASEAN trade is complementary. Tariff reductions in agricultural trade havealready started.
The 1997-98 regional financial crisis exposed ASEAN's failings in other areas ina brutal fashion. The organisation was unable to stop the regional currencydevaluations or alleviate the subsequent economic hardship. A Statement onBold Measures, released at end-1998, was exactly the opposite of what the titleimplied. Unfolding events in Indonesia then moved the focus on to theorganisation's security plans. ASEAN members' commitment to the principle ofnon-interference in the internal affairs of other member countries complicatedthe response to the crisis in East Timor. (Some members did eventuallyparticipate in the multinational force that intervened in East Timor, but notunder ASEAN auspices.) It has also enabled the ruling military junta inMyanmar to escape strong criticism from the governments of other ASEANmember countries. However, in July 2005 Myanmar gave in to internationalpressure and agreed to forgo its turn to chair the association, thus sparingASEAN embarrassment in its relations with the US and the EU. The Philippineswill now chair the grouping for one year from mid-2006 in Myanmar�s place.
The organisation's political hopes could be severely tested in the next fewyears. Changing governments in member countries could undermine anyremaining pretence of political consensus in the region. On the security front,the ASEAN Regional Forums (ARFs, which bring together the ASEAN ministersof foreign affairs with those of other countries, notably China) are likely toremain little more than talking shops, with negligible impact on changinggeopolitical trends.
APEC started life as a forum for informal discussion between six members ofthe Association of South-East Asian Nations (ASEAN)�Brunei, Indonesia,Malaysia, the Philippines, Thailand and Singapore�and their six dialoguepartners in the Pacific, namely Australia, Canada, Japan, New Zealand, SouthKorea and the US. In 1991 China, Hong Kong and Taiwan became members,followed by Mexico and Papua New Guinea in 1993 and Chile in 1994. Peru,Russia and Vietnam joined in 1998. APEC describes itself as "the primaryvehicle for promoting open trade and practical economic co-operation" in theregion, with the goal of advancing "Asia-Pacific economic dynamism and senseof community".
APEC has had a permanent secretariat since 1992, and also runs four perma-nent committees�on budget and managerial issues, trade and investment,economic trends generally, and economic and technical co-operation. Inaddition, there are 11 working groups�on agricultural technical co-operation,energy, fisheries, human resources, industrial science and technology, marineresource co-operation, small and medium-sized enterprises, telecommuni-cations, tourism, trade promotion and transport. There is also an APEC businessadvisory council (ABAC), which includes up to three senior private-sectorrepresentatives from each member country. APEC as a whole has its head-quarters in Singapore, while ABAC is based in the Philippines. APEC's main
Asia-Pacific EconomicCo-operation (APEC) forum
48 Philippines
Country Profile 2005 www.eiu.com © The Economist Intelligence Unit Limited 2005
business is done at annual meetings of member states' ministers of foreign andeconomic affairs, which are followed by informal gatherings of heads of state.Every other ministerial meeting is held in a South-east Asian country. Thechairmanship of APEC rotates on a yearly basis.
During the 1990s APEC's star first waxed brighter and then started to wane. Thehigh point was probably reached in 1994, when members agreed a timetablefor the liberalisation of trade across the region: the ambitious aim was toeliminate all trade barriers by 2020 and then to extend reciprocal concessionsto non-members. In 1995 and 1996 APEC debated how best to achieve thistarget, but discussions in 1997 and 1998 were driven off course by the regionalfinancial crisis. APEC's response to the crisis�generally worded exhortations tomember states to develop financial and capital markets, and so on�was farfrom convincing and signalled the inherent weaknesses of the organisation.Subsequent meetings also provided other distractions from the theme of tradeliberalisation: East Timor in 1999, information technology in 2000 and security(following the September 11th terrorist attacks on the US) in 2001. Discussionreturned to trade relations in 2002, but was only very general in nature.
The 2003 meeting in the Thai capital, Bangkok, made little further progress,concluding with broad commitments to multilateral trade and investmentliberalisation and to improving regional security arrangements. Thesecommitments were reiterated at the November 2004 meeting, held in theChilean capital, Santiago. The meeting's communiqué also acknowledged thegrowing number of regional and bilateral trading arrangements (without eithercondemning or commending them), and touched in the most general way oncontemporary problems such as maritime security and HIV/AIDS. The nextmeeting is scheduled to take place in November 2005 in Busan, South Korea.The unfortunate conclusion to be drawn from recent meetings is that APEC hasin effect gone back to its roots and become an informal talking shop, giving upall aspirations to be a serious regional reformer.
Philippines 49
© The Economist Intelligence Unit Limited 2005 www.eiu.com Country Profile 2005
Appendices
Sources of information
Bangko Sentral ng Pilipinas (BSP), Selected Philippine Economic Indicators, Manila
National Statistical Co-ordination Board (NSCB), Philippines Statistical Yearbook,Manila
National Statistics Office (NSO), Monthly Bulletin of Statistics, Manila
Bank for International Settlements, International Banking and Financial MarketDevelopments (quarterly)
Food and Agriculture Organisation, Quarterly Bulletin of Statistics, Rome
IMF, International Financial Statistics (monthly)
International Finance Corporation, Emerging Stockmarkets Factbook (annual)
International Institute for Strategic Studies, The Military Balance (annual),London
OECD, Geographical Distribution of Financial Flows to Aid Recipients (annual)
World Bank, Global Development Finance (annual)
World Bank, World Development Report (annual)
World Bureau of Metal Statistics, World Metal Statistics Yearbook
Arsenio M Balisacan and Hal Hill (eds), The Philippine Economy: Development,Policies and Challenges, Oxford University Press, New York, 2003
Eva Lotta Hedman and John T Sidel (eds), Philippines Politics and Society in theTwentieth Century, Colonial Legacies and Post-colonial Trajectories, Routledge,London, 2000
Peter Krinks, The Economy of the Philippines: Elites, Inequalities and EconomicRestructuring, RoutledgeCurzon, London, 2002
National Economic Development Agency, Medium-term Philippine DevelopmentPlan 2004-2010, Manila, 2004
World Bank, Philippines: From Crisis to Opportunity, World Bank, WashingtonDC, 1999
Bangko Sentral ng Pilipinas (the central bank): www.bsp.gov.ph
Department of Finance: www.dof.gov.ph
National Statistical Co-ordination Board: www.nscb.gov.ph
National Statistical Office: www.census.gov.ph
National statistical sources
International statistical sources
Select bibliography andwebsites
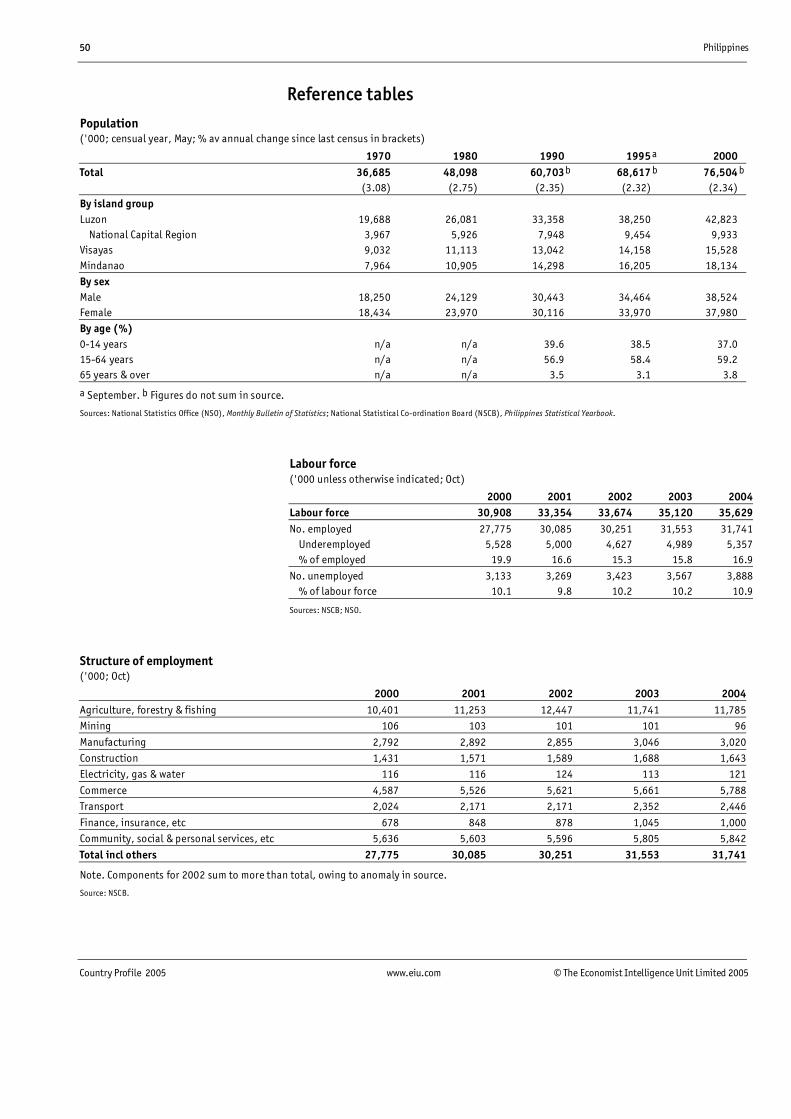
50 Philippines
Country Profile 2005 www.eiu.com © The Economist Intelligence Unit Limited 2005
Reference tables
Population('000; censual year, May; % av annual change since last census in brackets)
1970 1980 1990 1995 a 2000Total 36,685 48,098 60,703b 68,617 b 76,504 b
(3.08) (2.75) (2.35) (2.32) (2.34)By island groupLuzon 19,688 26,081 33,358 38,250 42,823 National Capital Region 3,967 5,926 7,948 9,454 9,933Visayas 9,032 11,113 13,042 14,158 15,528Mindanao 7,964 10,905 14,298 16,205 18,134By sexMale 18,250 24,129 30,443 34,464 38,524Female 18,434 23,970 30,116 33,970 37,980By age (%)0-14 years n/a n/a 39.6 38.5 37.015-64 years n/a n/a 56.9 58.4 59.265 years & over n/a n/a 3.5 3.1 3.8
a September. b Figures do not sum in source.
Sources: National Statistics Office (NSO), Monthly Bulletin of Statistics; National Statistical Co-ordination Board (NSCB), Philippines Statistical Yearbook.
Labour force('000 unless otherwise indicated; Oct)
2000 2001 2002 2003 2004Labour force 30,908 33,354 33,674 35,120 35,629No. employed 27,775 30,085 30,251 31,553 31,741 Underemployed 5,528 5,000 4,627 4,989 5,357 % of employed 19.9 16.6 15.3 15.8 16.9
No. unemployed 3,133 3,269 3,423 3,567 3,888 % of labour force 10.1 9.8 10.2 10.2 10.9
Sources: NSCB; NSO.
Structure of employment('000; Oct)
2000 2001 2002 2003 2004Agriculture, forestry & fishing 10,401 11,253 12,447 11,741 11,785Mining 106 103 101 101 96
Manufacturing 2,792 2,892 2,855 3,046 3,020Construction 1,431 1,571 1,589 1,688 1,643Electricity, gas & water 116 116 124 113 121
Commerce 4,587 5,526 5,621 5,661 5,788Transport 2,024 2,171 2,171 2,352 2,446
Finance, insurance, etc 678 848 878 1,045 1,000Community, social & personal services, etc 5,636 5,603 5,596 5,805 5,842
Total incl others 27,775 30,085 30,251 31,553 31,741
Note. Components for 2002 sum to more than total, owing to anomaly in source.
Source: NSCB.
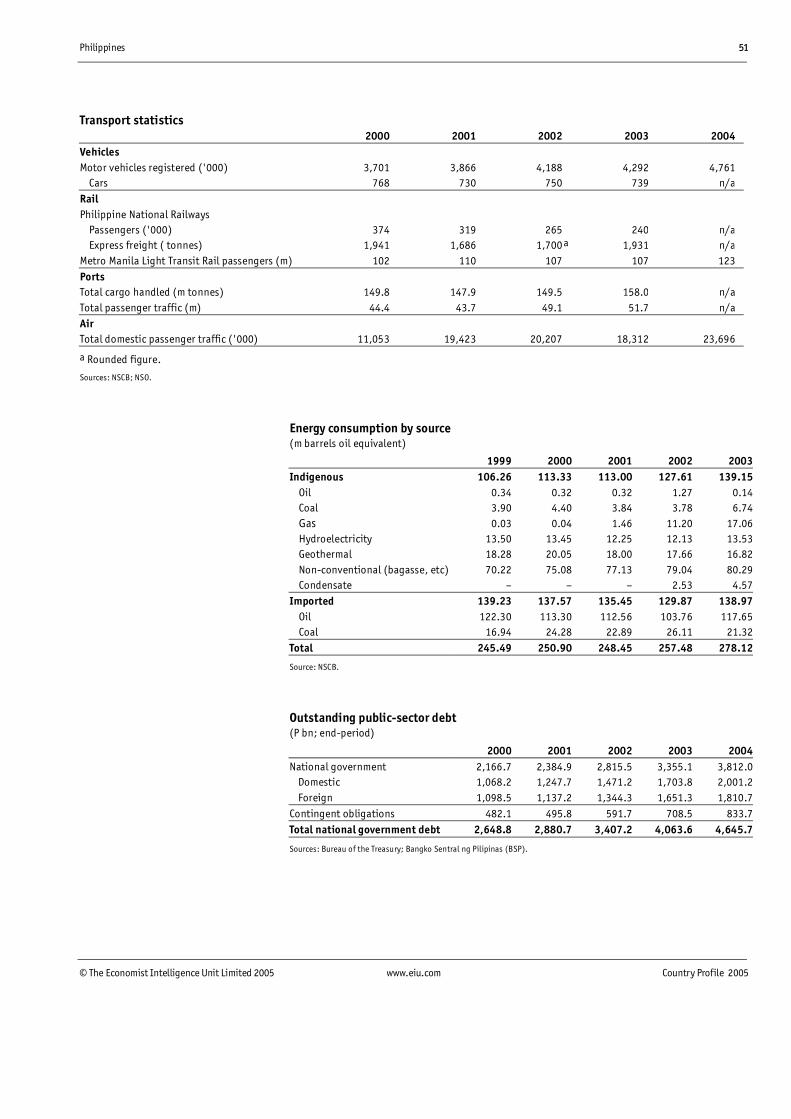
Philippines 51
© The Economist Intelligence Unit Limited 2005 www.eiu.com Country Profile 2005
Transport statistics2000 2001 2002 2003 2004
VehiclesMotor vehicles registered ('000) 3,701 3,866 4,188 4,292 4,761 Cars 768 730 750 739 n/aRailPhilippine National Railways Passengers ('000) 374 319 265 240 n/a Express freight ( tonnes) 1,941 1,686 1,700 a 1,931 n/aMetro Manila Light Transit Rail passengers (m) 102 110 107 107 123PortsTotal cargo handled (m tonnes) 149.8 147.9 149.5 158.0 n/aTotal passenger traffic (m) 44.4 43.7 49.1 51.7 n/aAirTotal domestic passenger traffic ('000) 11,053 19,423 20,207 18,312 23,696
a Rounded figure.
Sources: NSCB; NSO.
Energy consumption by source(m barrels oil equivalent)
1999 2000 2001 2002 2003Indigenous 106.26 113.33 113.00 127.61 139.15 Oil 0.34 0.32 0.32 1.27 0.14 Coal 3.90 4.40 3.84 3.78 6.74 Gas 0.03 0.04 1.46 11.20 17.06 Hydroelectricity 13.50 13.45 12.25 12.13 13.53 Geothermal 18.28 20.05 18.00 17.66 16.82 Non-conventional (bagasse, etc) 70.22 75.08 77.13 79.04 80.29 Condensate � � � 2.53 4.57Imported 139.23 137.57 135.45 129.87 138.97 Oil 122.30 113.30 112.56 103.76 117.65 Coal 16.94 24.28 22.89 26.11 21.32Total 245.49 250.90 248.45 257.48 278.12
Source: NSCB.
Outstanding public-sector debt(P bn; end-period)
2000 2001 2002 2003 2004National government 2,166.7 2,384.9 2,815.5 3,355.1 3,812.0 Domestic 1,068.2 1,247.7 1,471.2 1,703.8 2,001.2 Foreign 1,098.5 1,137.2 1,344.3 1,651.3 1,810.7Contingent obligations 482.1 495.8 591.7 708.5 833.7Total national government debt 2,648.8 2,880.7 3,407.2 4,063.6 4,645.7
Sources: Bureau of the Treasury; Bangko Sentral ng Pilipinas (BSP).
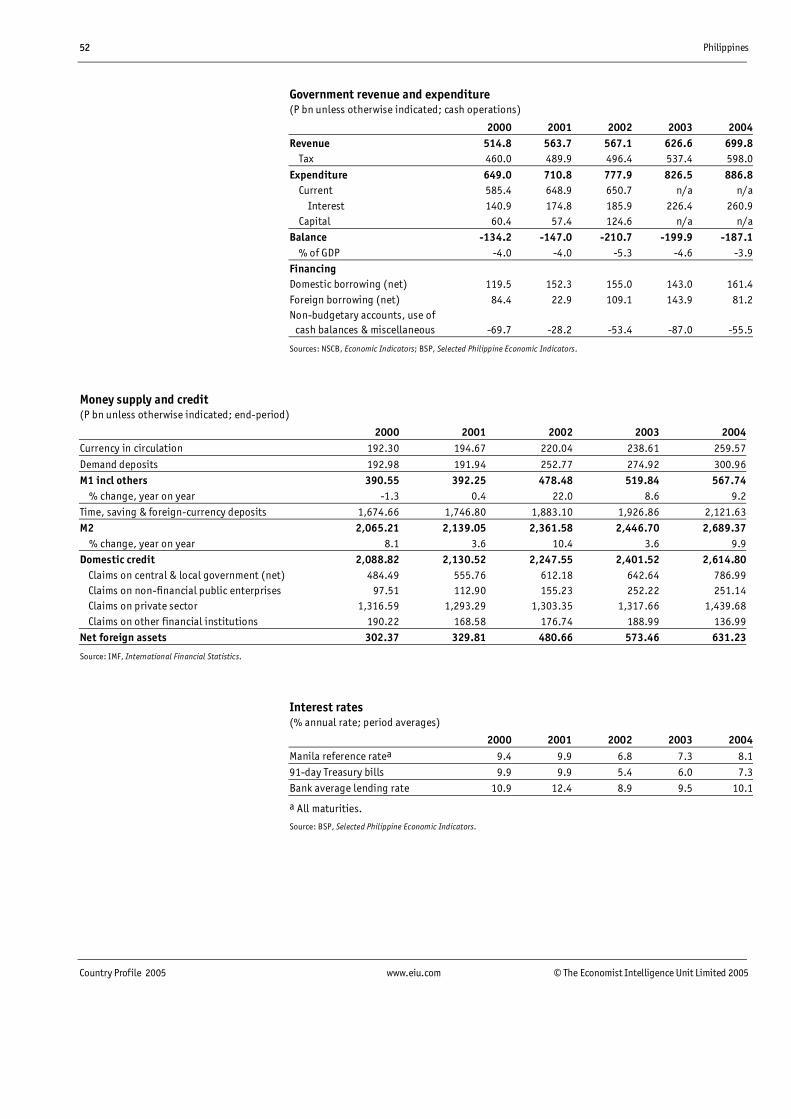
52 Philippines
Country Profile 2005 www.eiu.com © The Economist Intelligence Unit Limited 2005
Government revenue and expenditure(P bn unless otherwise indicated; cash operations)
2000 2001 2002 2003 2004Revenue 514.8 563.7 567.1 626.6 699.8 Tax 460.0 489.9 496.4 537.4 598.0
Expenditure 649.0 710.8 777.9 826.5 886.8 Current 585.4 648.9 650.7 n/a n/a Interest 140.9 174.8 185.9 226.4 260.9 Capital 60.4 57.4 124.6 n/a n/aBalance -134.2 -147.0 -210.7 -199.9 -187.1 % of GDP -4.0 -4.0 -5.3 -4.6 -3.9FinancingDomestic borrowing (net) 119.5 152.3 155.0 143.0 161.4Foreign borrowing (net) 84.4 22.9 109.1 143.9 81.2Non-budgetary accounts, use of
cash balances & miscellaneous -69.7 -28.2 -53.4 -87.0 -55.5
Sources: NSCB, Economic Indicators; BSP, Selected Philippine Economic Indicators.
Money supply and credit(P bn unless otherwise indicated; end-period)
2000 2001 2002 2003 2004Currency in circulation 192.30 194.67 220.04 238.61 259.57
Demand deposits 192.98 191.94 252.77 274.92 300.96M1 incl others 390.55 392.25 478.48 519.84 567.74 % change, year on year -1.3 0.4 22.0 8.6 9.2Time, saving & foreign-currency deposits 1,674.66 1,746.80 1,883.10 1,926.86 2,121.63M2 2,065.21 2,139.05 2,361.58 2,446.70 2,689.37 % change, year on year 8.1 3.6 10.4 3.6 9.9Domestic credit 2,088.82 2,130.52 2,247.55 2,401.52 2,614.80 Claims on central & local government (net) 484.49 555.76 612.18 642.64 786.99 Claims on non-financial public enterprises 97.51 112.90 155.23 252.22 251.14 Claims on private sector 1,316.59 1,293.29 1,303.35 1,317.66 1,439.68 Claims on other financial institutions 190.22 168.58 176.74 188.99 136.99Net foreign assets 302.37 329.81 480.66 573.46 631.23
Source: IMF, International Financial Statistics.
Interest rates(% annual rate; period averages)
2000 2001 2002 2003 2004Manila reference ratea 9.4 9.9 6.8 7.3 8.191-day Treasury bills 9.9 9.9 5.4 6.0 7.3Bank average lending rate 10.9 12.4 8.9 9.5 10.1
a All maturities.
Source: BSP, Selected Philippine Economic Indicators.

Philippines 53
© The Economist Intelligence Unit Limited 2005 www.eiu.com Country Profile 2005
Gross domestic product2000 2001 2002 2003 2004
Total (P bn)At current prices 3,354.7 3,631.5 3,959.6 4,210.5 4,739.1At constant (1985) prices 973.0 990.0 1,033.0 1,070.0 1,134.9 % change, year on year 6.0 1.8 4.3 3.6 6.1Per head (P)At current prices 43,687 46,208 49,231 51,370 56,648At constant (1985) prices 12,670 12,598 12,843 13,054 13,567 % change, year on year 6.0 -0.6 1.9 1.6 3.9
Sources: NSCB, National Accounts of the Philippines; Economist Intelligence Unit.
Gross domestic product by expenditure(P bn at constant 1985 prices; % change year on year in brackets)
2000 2001 2002 2003 2004Private consumption 752.1 779.0 810.8 853.6 903.1
(3.5) (3.6) (4.1) (5.3) (5.8)
Government consumption 79.7 75.4 72.6 74.4 74.4(6.2) (-5.3) (-3.7) (2.5) (0.0)
Fixed capital formation 240.1 208.8 211.7 218.2 227.3(19.9) (-13.0) (1.4) (3.1) (4.2)
Change in stocks -1.0 12.8 -1.2 -2.9 8.5
Exports of goods & services 445.7 430.3 445.8 464.1 529.6(17.1) (-3.4) (4.0) (4.1) (14.1)
Imports of goods & services 490.8 508.0 532.1 584.4 619.1(4.3) (3.5) (4.7) (9.8) (5.9)
GDPa 973.0 990.0 1,033.0 1,070.0 1,134.9(6.0) (1.8) (4.3) (3.6) (6.1)
Net factor income from abroad 64.9 71.2 74.0 81.8 88.8(26.8) (9.8) (3.9) (10.5) (8.5)
GNP 1,037.9 1,061.3 1,107.0 1,151.8 1,223.7(7.1) (2.3) (4.3) (4.0) (6.2)
a Including statistical discrepancy.
Sources: NSCB; National Economic Development Authority (NEDA).
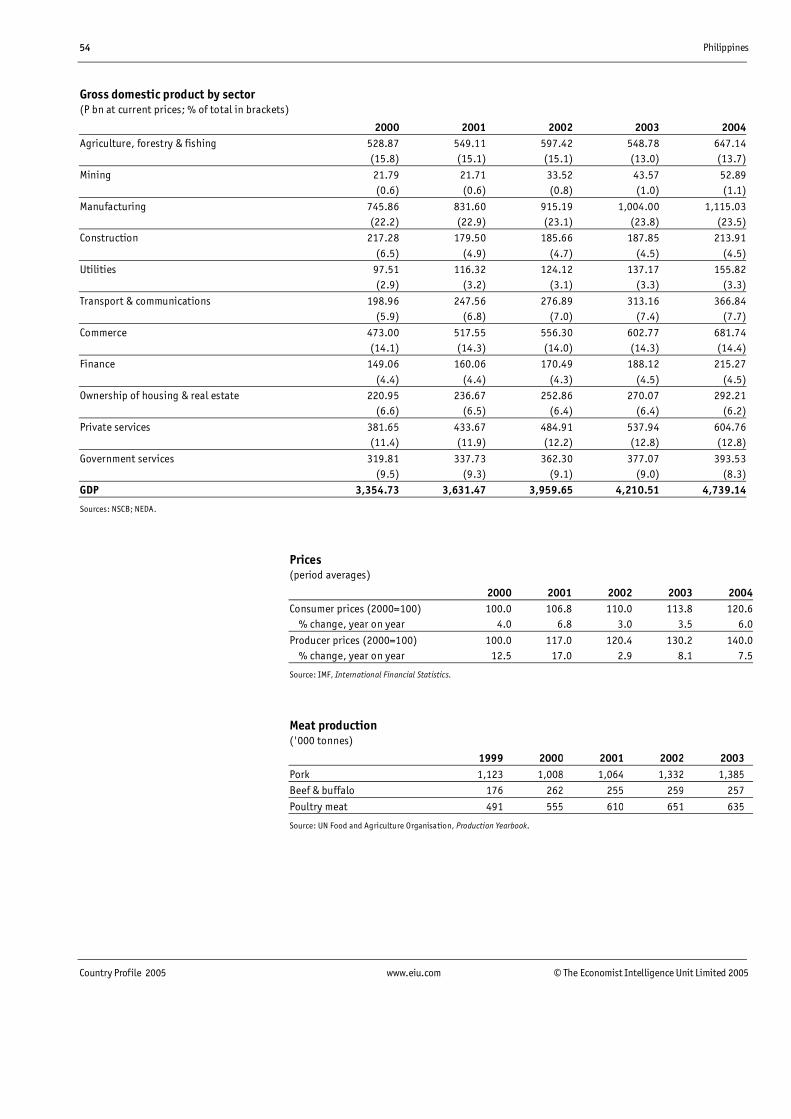
54 Philippines
Country Profile 2005 www.eiu.com © The Economist Intelligence Unit Limited 2005
Gross domestic product by sector(P bn at current prices; % of total in brackets)
2000 2001 2002 2003 2004Agriculture, forestry & fishing 528.87 549.11 597.42 548.78 647.14
(15.8) (15.1) (15.1) (13.0) (13.7)
Mining 21.79 21.71 33.52 43.57 52.89(0.6) (0.6) (0.8) (1.0) (1.1)
Manufacturing 745.86 831.60 915.19 1,004.00 1,115.03(22.2) (22.9) (23.1) (23.8) (23.5)
Construction 217.28 179.50 185.66 187.85 213.91(6.5) (4.9) (4.7) (4.5) (4.5)
Utilities 97.51 116.32 124.12 137.17 155.82(2.9) (3.2) (3.1) (3.3) (3.3)
Transport & communications 198.96 247.56 276.89 313.16 366.84(5.9) (6.8) (7.0) (7.4) (7.7)
Commerce 473.00 517.55 556.30 602.77 681.74(14.1) (14.3) (14.0) (14.3) (14.4)
Finance 149.06 160.06 170.49 188.12 215.27(4.4) (4.4) (4.3) (4.5) (4.5)
Ownership of housing & real estate 220.95 236.67 252.86 270.07 292.21(6.6) (6.5) (6.4) (6.4) (6.2)
Private services 381.65 433.67 484.91 537.94 604.76(11.4) (11.9) (12.2) (12.8) (12.8)
Government services 319.81 337.73 362.30 377.07 393.53(9.5) (9.3) (9.1) (9.0) (8.3)
GDP 3,354.73 3,631.47 3,959.65 4,210.51 4,739.14
Sources: NSCB; NEDA.
Prices(period averages)
2000 2001 2002 2003 2004Consumer prices (2000=100) 100.0 106.8 110.0 113.8 120.6 % change, year on year 4.0 6.8 3.0 3.5 6.0
Producer prices (2000=100) 100.0 117.0 120.4 130.2 140.0 % change, year on year 12.5 17.0 2.9 8.1 7.5
Source: IMF, International Financial Statistics.
Meat production('000 tonnes)
1999 2000 2001 2002 2003Pork 1,123 1,008 1,064 1,332 1,385Beef & buffalo 176 262 255 259 257
Poultry meat 491 555 610 651 635
Source: UN Food and Agriculture Organisation, Production Yearbook.
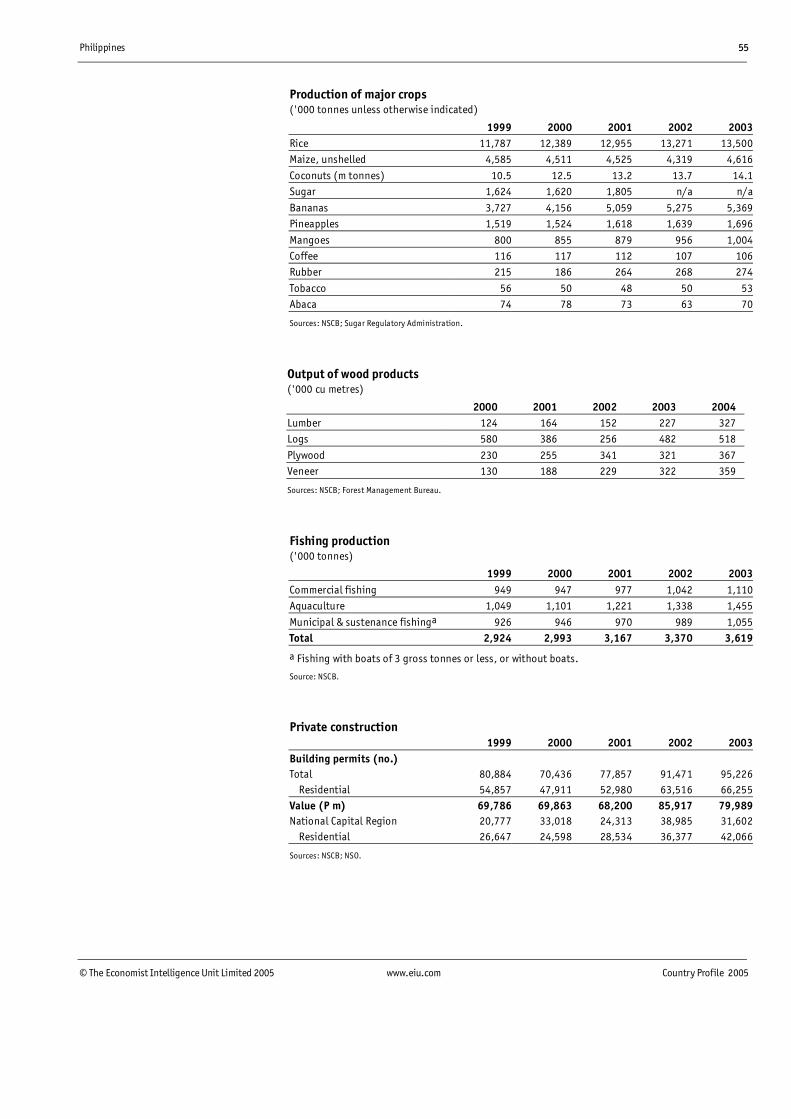
Philippines 55
© The Economist Intelligence Unit Limited 2005 www.eiu.com Country Profile 2005
Production of major crops('000 tonnes unless otherwise indicated)
1999 2000 2001 2002 2003Rice 11,787 12,389 12,955 13,271 13,500Maize, unshelled 4,585 4,511 4,525 4,319 4,616
Coconuts (m tonnes) 10.5 12.5 13.2 13.7 14.1Sugar 1,624 1,620 1,805 n/a n/a
Bananas 3,727 4,156 5,059 5,275 5,369Pineapples 1,519 1,524 1,618 1,639 1,696
Mangoes 800 855 879 956 1,004Coffee 116 117 112 107 106Rubber 215 186 264 268 274
Tobacco 56 50 48 50 53Abaca 74 78 73 63 70
Sources: NSCB; Sugar Regulatory Administration.
Output of wood products('000 cu metres)
2000 2001 2002 2003 2004Lumber 124 164 152 227 327Logs 580 386 256 482 518
Plywood 230 255 341 321 367Veneer 130 188 229 322 359
Sources: NSCB; Forest Management Bureau.
Fishing production('000 tonnes)
1999 2000 2001 2002 2003Commercial fishing 949 947 977 1,042 1,110Aquaculture 1,049 1,101 1,221 1,338 1,455
Municipal & sustenance fishinga 926 946 970 989 1,055Total 2,924 2,993 3,167 3,370 3,619
a Fishing with boats of 3 gross tonnes or less, or without boats.
Source: NSCB.
Private construction1999 2000 2001 2002 2003
Building permits (no.)Total 80,884 70,436 77,857 91,471 95,226 Residential 54,857 47,911 52,980 63,516 66,255Value (P m) 69,786 69,863 68,200 85,917 79,989National Capital Region 20,777 33,018 24,313 38,985 31,602 Residential 26,647 24,598 28,534 36,377 42,066
Sources: NSCB; NSO.
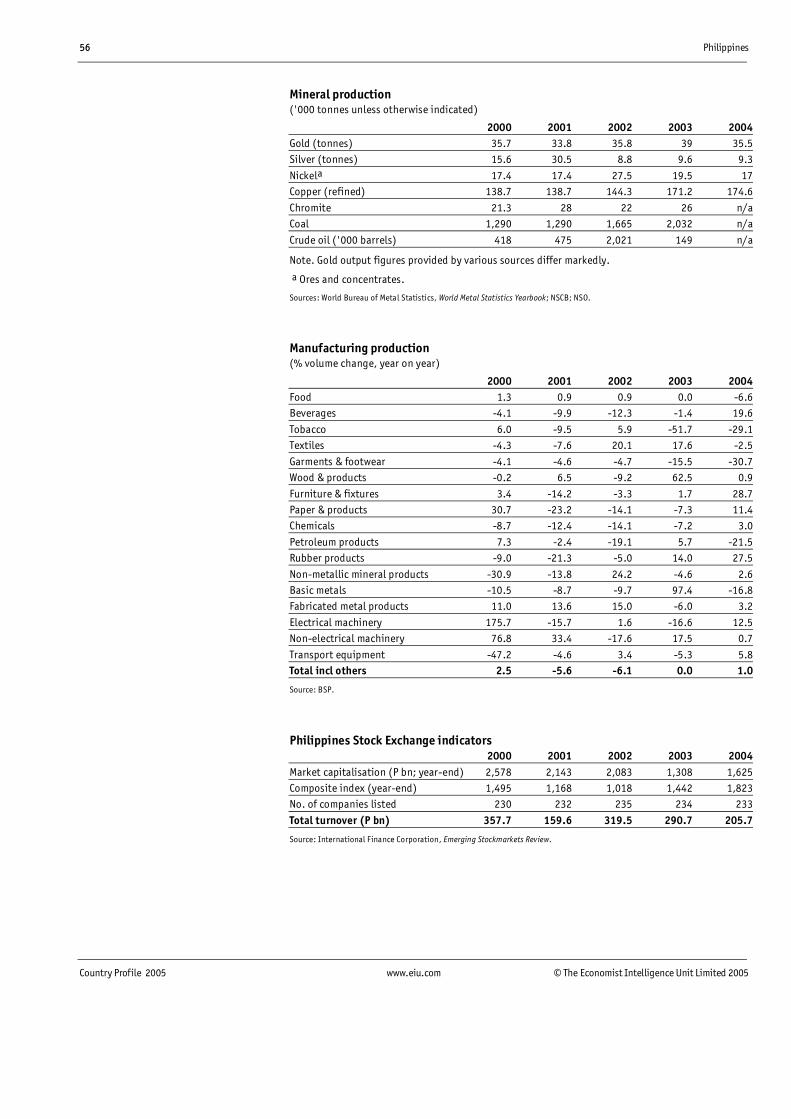
56 Philippines
Country Profile 2005 www.eiu.com © The Economist Intelligence Unit Limited 2005
Mineral production('000 tonnes unless otherwise indicated)
2000 2001 2002 2003 2004Gold (tonnes) 35.7 33.8 35.8 39 35.5Silver (tonnes) 15.6 30.5 8.8 9.6 9.3
Nickela 17.4 17.4 27.5 19.5 17Copper (refined) 138.7 138.7 144.3 171.2 174.6
Chromite 21.3 28 22 26 n/aCoal 1,290 1,290 1,665 2,032 n/a
Crude oil ('000 barrels) 418 475 2,021 149 n/a
Note. Gold output figures provided by various sources differ markedly.
a Ores and concentrates.
Sources: World Bureau of Metal Statistics, World Metal Statistics Yearbook; NSCB; NSO.
Manufacturing production(% volume change, year on year)
2000 2001 2002 2003 2004Food 1.3 0.9 0.9 0.0 -6.6Beverages -4.1 -9.9 -12.3 -1.4 19.6
Tobacco 6.0 -9.5 5.9 -51.7 -29.1Textiles -4.3 -7.6 20.1 17.6 -2.5
Garments & footwear -4.1 -4.6 -4.7 -15.5 -30.7Wood & products -0.2 6.5 -9.2 62.5 0.9
Furniture & fixtures 3.4 -14.2 -3.3 1.7 28.7Paper & products 30.7 -23.2 -14.1 -7.3 11.4Chemicals -8.7 -12.4 -14.1 -7.2 3.0
Petroleum products 7.3 -2.4 -19.1 5.7 -21.5Rubber products -9.0 -21.3 -5.0 14.0 27.5
Non-metallic mineral products -30.9 -13.8 24.2 -4.6 2.6Basic metals -10.5 -8.7 -9.7 97.4 -16.8Fabricated metal products 11.0 13.6 15.0 -6.0 3.2
Electrical machinery 175.7 -15.7 1.6 -16.6 12.5Non-electrical machinery 76.8 33.4 -17.6 17.5 0.7
Transport equipment -47.2 -4.6 3.4 -5.3 5.8Total incl others 2.5 -5.6 -6.1 0.0 1.0
Source: BSP.
Philippines Stock Exchange indicators2000 2001 2002 2003 2004
Market capitalisation (P bn; year-end) 2,578 2,143 2,083 1,308 1,625Composite index (year-end) 1,495 1,168 1,018 1,442 1,823No. of companies listed 230 232 235 234 233
Total turnover (P bn) 357.7 159.6 319.5 290.7 205.7
Source: International Finance Corporation, Emerging Stockmarkets Review.
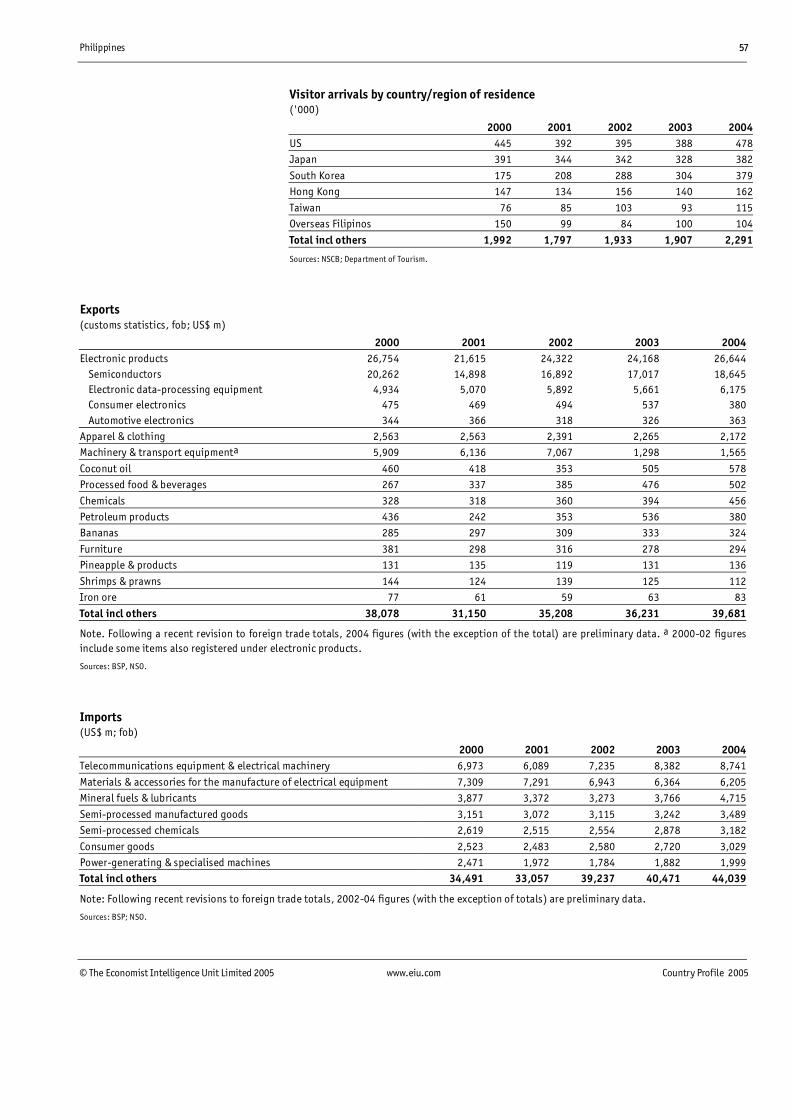
Philippines 57
© The Economist Intelligence Unit Limited 2005 www.eiu.com Country Profile 2005
Visitor arrivals by country/region of residence('000)
2000 2001 2002 2003 2004US 445 392 395 388 478Japan 391 344 342 328 382
South Korea 175 208 288 304 379Hong Kong 147 134 156 140 162
Taiwan 76 85 103 93 115Overseas Filipinos 150 99 84 100 104
Total incl others 1,992 1,797 1,933 1,907 2,291
Sources: NSCB; Department of Tourism.
Exports(customs statistics, fob; US$ m)
2000 2001 2002 2003 2004Electronic products 26,754 21,615 24,322 24,168 26,644 Semiconductors 20,262 14,898 16,892 17,017 18,645 Electronic data-processing equipment 4,934 5,070 5,892 5,661 6,175 Consumer electronics 475 469 494 537 380 Automotive electronics 344 366 318 326 363Apparel & clothing 2,563 2,563 2,391 2,265 2,172Machinery & transport equipmenta 5,909 6,136 7,067 1,298 1,565
Coconut oil 460 418 353 505 578Processed food & beverages 267 337 385 476 502
Chemicals 328 318 360 394 456Petroleum products 436 242 353 536 380Bananas 285 297 309 333 324
Furniture 381 298 316 278 294Pineapple & products 131 135 119 131 136
Shrimps & prawns 144 124 139 125 112Iron ore 77 61 59 63 83
Total incl others 38,078 31,150 35,208 36,231 39,681
Note. Following a recent revision to foreign trade totals, 2004 figures (with the exception of the total) are preliminary data. a 2000-02 figuresinclude some items also registered under electronic products.
Sources: BSP, NSO.
Imports(US$ m; fob)
2000 2001 2002 2003 2004Telecommunications equipment & electrical machinery 6,973 6,089 7,235 8,382 8,741
Materials & accessories for the manufacture of electrical equipment 7,309 7,291 6,943 6,364 6,205Mineral fuels & lubricants 3,877 3,372 3,273 3,766 4,715
Semi-processed manufactured goods 3,151 3,072 3,115 3,242 3,489Semi-processed chemicals 2,619 2,515 2,554 2,878 3,182
Consumer goods 2,523 2,483 2,580 2,720 3,029Power-generating & specialised machines 2,471 1,972 1,784 1,882 1,999Total incl others 34,491 33,057 39,237 40,471 44,039
Note: Following recent revisions to foreign trade totals, 2002-04 figures (with the exception of totals) are preliminary data.
Sources: BSP; NSO.
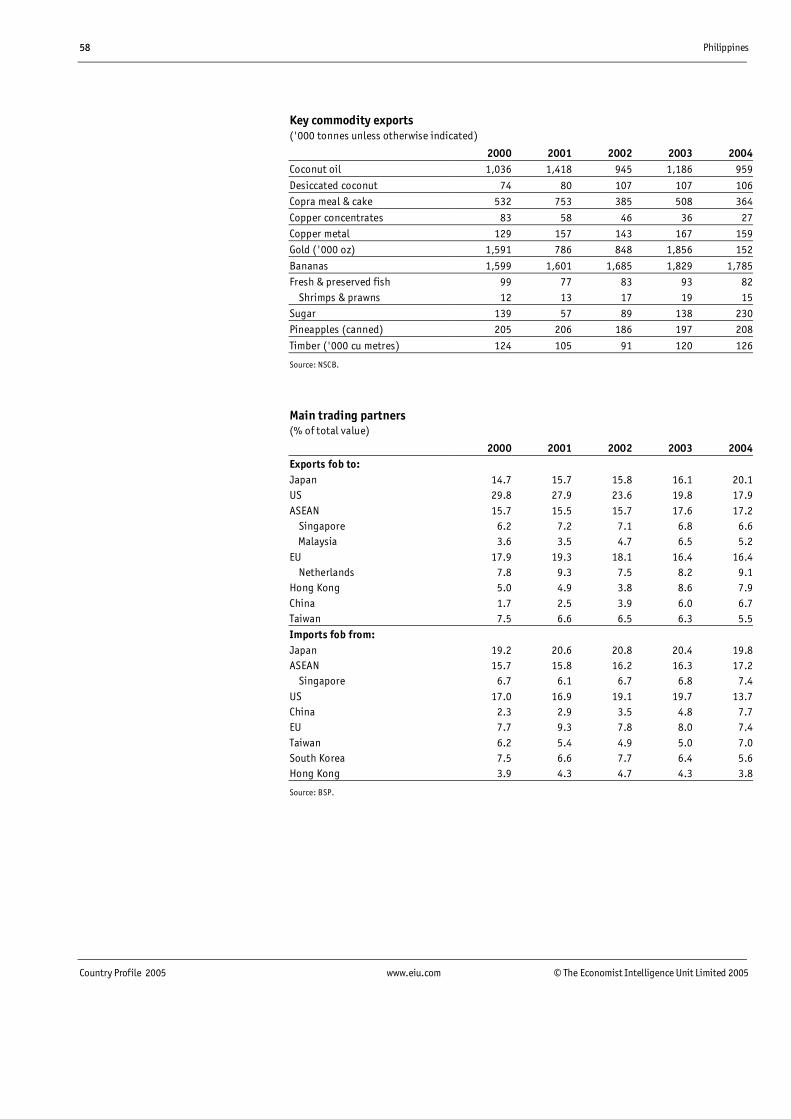
58 Philippines
Country Profile 2005 www.eiu.com © The Economist Intelligence Unit Limited 2005
Key commodity exports('000 tonnes unless otherwise indicated)
2000 2001 2002 2003 2004Coconut oil 1,036 1,418 945 1,186 959
Desiccated coconut 74 80 107 107 106Copra meal & cake 532 753 385 508 364
Copper concentrates 83 58 46 36 27Copper metal 129 157 143 167 159Gold ('000 oz) 1,591 786 848 1,856 152
Bananas 1,599 1,601 1,685 1,829 1,785Fresh & preserved fish 99 77 83 93 82 Shrimps & prawns 12 13 17 19 15Sugar 139 57 89 138 230Pineapples (canned) 205 206 186 197 208
Timber ('000 cu metres) 124 105 91 120 126
Source: NSCB.
Main trading partners(% of total value)
2000 2001 2002 2003 2004Exports fob to:Japan 14.7 15.7 15.8 16.1 20.1US 29.8 27.9 23.6 19.8 17.9ASEAN 15.7 15.5 15.7 17.6 17.2 Singapore 6.2 7.2 7.1 6.8 6.6 Malaysia 3.6 3.5 4.7 6.5 5.2EU 17.9 19.3 18.1 16.4 16.4 Netherlands 7.8 9.3 7.5 8.2 9.1Hong Kong 5.0 4.9 3.8 8.6 7.9China 1.7 2.5 3.9 6.0 6.7Taiwan 7.5 6.6 6.5 6.3 5.5Imports fob from:Japan 19.2 20.6 20.8 20.4 19.8ASEAN 15.7 15.8 16.2 16.3 17.2 Singapore 6.7 6.1 6.7 6.8 7.4US 17.0 16.9 19.1 19.7 13.7China 2.3 2.9 3.5 4.8 7.7EU 7.7 9.3 7.8 8.0 7.4Taiwan 6.2 5.4 4.9 5.0 7.0South Korea 7.5 6.6 7.7 6.4 5.6Hong Kong 3.9 4.3 4.7 4.3 3.8
Source: BSP.
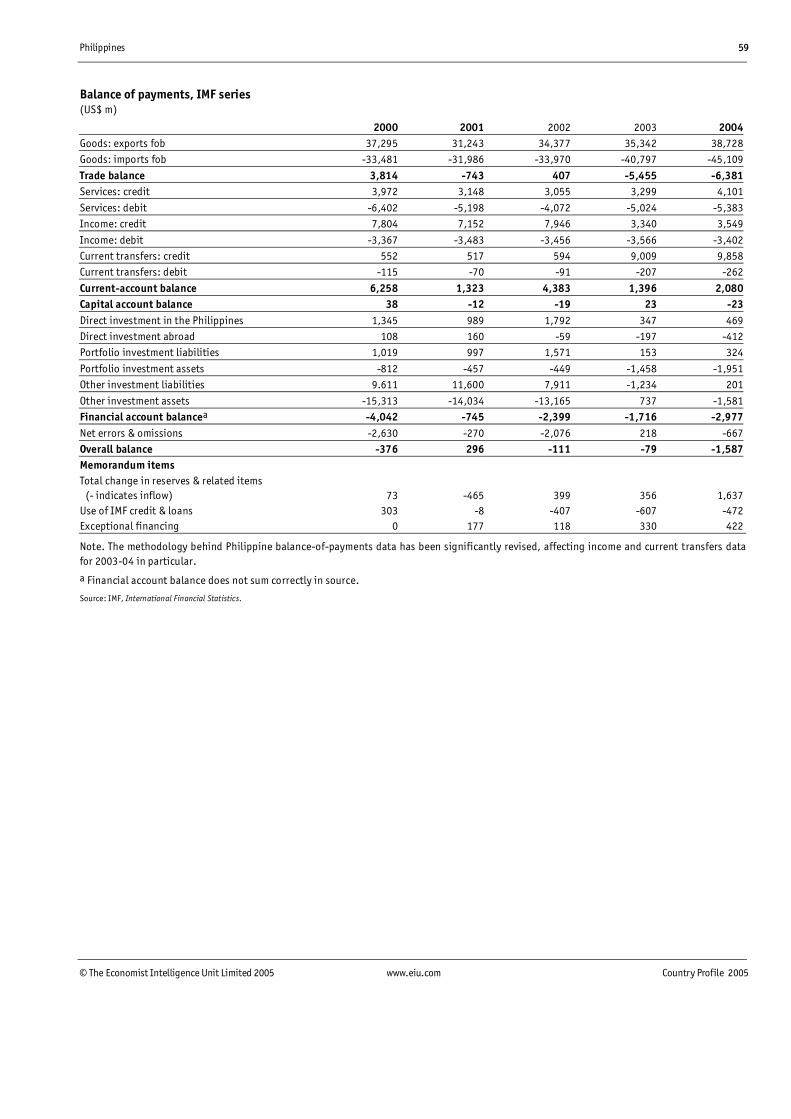
Philippines 59
© The Economist Intelligence Unit Limited 2005 www.eiu.com Country Profile 2005
Balance of payments, IMF series(US$ m)
2000 2001 2002 2003 2004Goods: exports fob 37,295 31,243 34,377 35,342 38,728Goods: imports fob -33,481 -31,986 -33,970 -40,797 -45,109
Trade balance 3,814 -743 407 -5,455 -6,381Services: credit 3,972 3,148 3,055 3,299 4,101
Services: debit -6,402 -5,198 -4,072 -5,024 -5,383Income: credit 7,804 7,152 7,946 3,340 3,549
Income: debit -3,367 -3,483 -3,456 -3,566 -3,402Current transfers: credit 552 517 594 9,009 9,858Current transfers: debit -115 -70 -91 -207 -262
Current-account balance 6,258 1,323 4,383 1,396 2,080Capital account balance 38 -12 -19 23 -23Direct investment in the Philippines 1,345 989 1,792 347 469Direct investment abroad 108 160 -59 -197 -412Portfolio investment liabilities 1,019 997 1,571 153 324
Portfolio investment assets -812 -457 -449 -1,458 -1,951Other investment liabilities 9.611 11,600 7,911 -1,234 201
Other investment assets -15,313 -14,034 -13,165 737 -1,581Financial account balancea -4,042 -745 -2,399 -1,716 -2,977Net errors & omissions -2,630 -270 -2,076 218 -667Overall balance -376 296 -111 -79 -1,587Memorandum itemsTotal change in reserves & related items
(- indicates inflow) 73 -465 399 356 1,637Use of IMF credit & loans 303 -8 -407 -607 -472Exceptional financing 0 177 118 330 422
Note. The methodology behind Philippine balance-of-payments data has been significantly revised, affecting income and current transfers datafor 2003-04 in particular.
a Financial account balance does not sum correctly in source.
Source: IMF, International Financial Statistics.
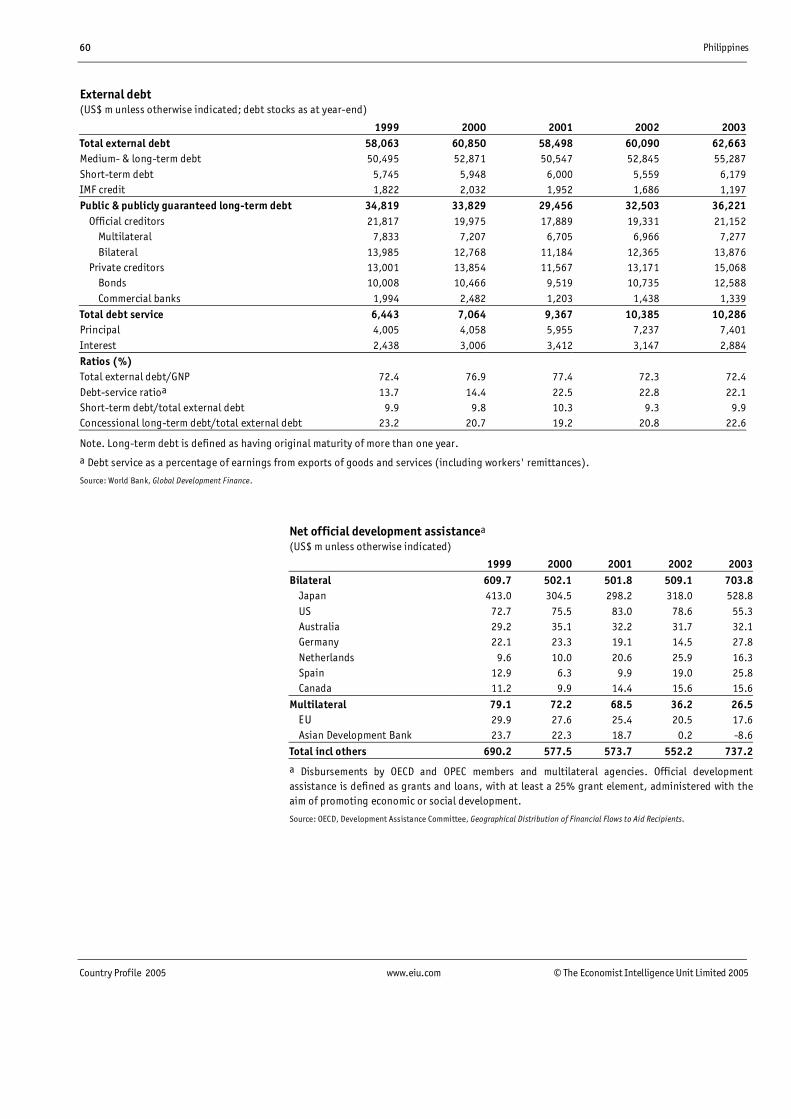
60 Philippines
Country Profile 2005 www.eiu.com © The Economist Intelligence Unit Limited 2005
External debt(US$ m unless otherwise indicated; debt stocks as at year-end)
1999 2000 2001 2002 2003Total external debt 58,063 60,850 58,498 60,090 62,663Medium- & long-term debt 50,495 52,871 50,547 52,845 55,287Short-term debt 5,745 5,948 6,000 5,559 6,179IMF credit 1,822 2,032 1,952 1,686 1,197Public & publicly guaranteed long-term debt 34,819 33,829 29,456 32,503 36,221 Official creditors 21,817 19,975 17,889 19,331 21,152 Multilateral 7,833 7,207 6,705 6,966 7,277 Bilateral 13,985 12,768 11,184 12,365 13,876 Private creditors 13,001 13,854 11,567 13,171 15,068 Bonds 10,008 10,466 9,519 10,735 12,588 Commercial banks 1,994 2,482 1,203 1,438 1,339Total debt service 6,443 7,064 9,367 10,385 10,286Principal 4,005 4,058 5,955 7,237 7,401Interest 2,438 3,006 3,412 3,147 2,884Ratios (%)Total external debt/GNP 72.4 76.9 77.4 72.3 72.4Debt-service ratioa 13.7 14.4 22.5 22.8 22.1Short-term debt/total external debt 9.9 9.8 10.3 9.3 9.9Concessional long-term debt/total external debt 23.2 20.7 19.2 20.8 22.6
Note. Long-term debt is defined as having original maturity of more than one year.
a Debt service as a percentage of earnings from exports of goods and services (including workers' remittances).
Source: World Bank, Global Development Finance.
Net official development assistancea
(US$ m unless otherwise indicated)
1999 2000 2001 2002 2003Bilateral 609.7 502.1 501.8 509.1 703.8 Japan 413.0 304.5 298.2 318.0 528.8 US 72.7 75.5 83.0 78.6 55.3 Australia 29.2 35.1 32.2 31.7 32.1 Germany 22.1 23.3 19.1 14.5 27.8 Netherlands 9.6 10.0 20.6 25.9 16.3 Spain 12.9 6.3 9.9 19.0 25.8 Canada 11.2 9.9 14.4 15.6 15.6
Multilateral 79.1 72.2 68.5 36.2 26.5 EU 29.9 27.6 25.4 20.5 17.6 Asian Development Bank 23.7 22.3 18.7 0.2 -8.6
Total incl others 690.2 577.5 573.7 552.2 737.2
a Disbursements by OECD and OPEC members and multilateral agencies. Official developmentassistance is defined as grants and loans, with at least a 25% grant element, administered with theaim of promoting economic or social development.
Source: OECD, Development Assistance Committee, Geographical Distribution of Financial Flows to Aid Recipients.
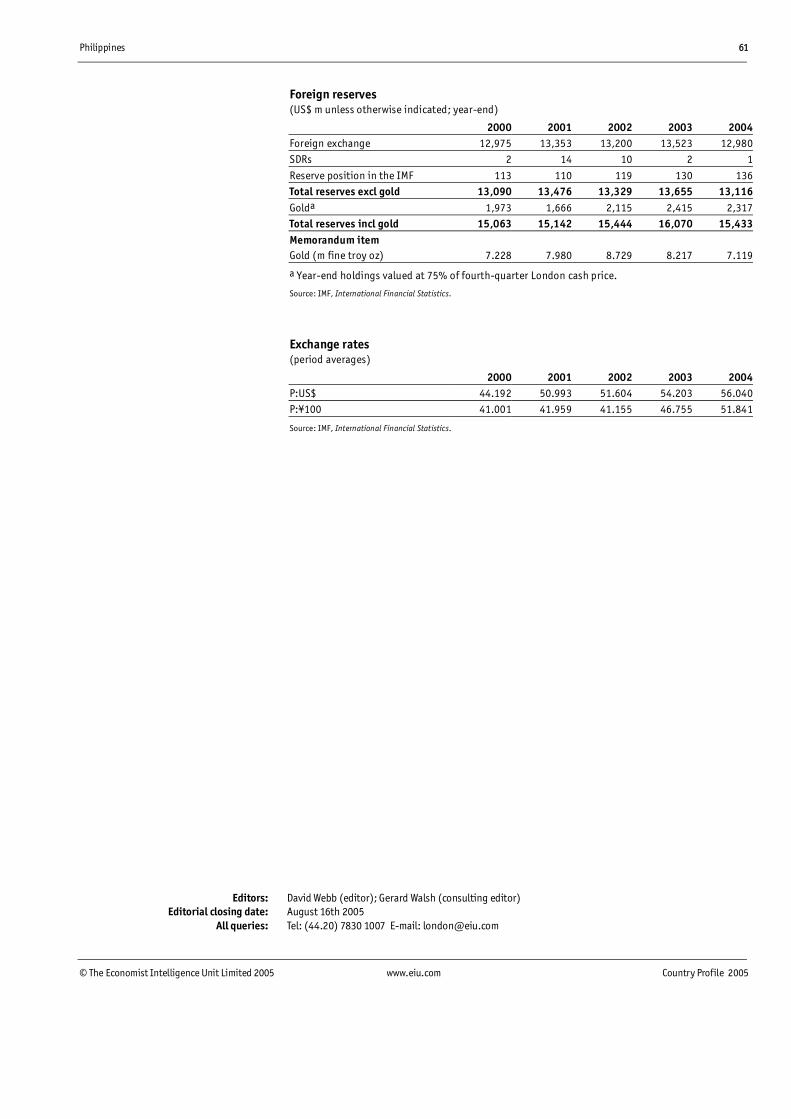
Philippines 61
© The Economist Intelligence Unit Limited 2005 www.eiu.com Country Profile 2005
Foreign reserves(US$ m unless otherwise indicated; year-end)
2000 2001 2002 2003 2004Foreign exchange 12,975 13,353 13,200 13,523 12,980SDRs 2 14 10 2 1
Reserve position in the IMF 113 110 119 130 136Total reserves excl gold 13,090 13,476 13,329 13,655 13,116Golda 1,973 1,666 2,115 2,415 2,317Total reserves incl gold 15,063 15,142 15,444 16,070 15,433Memorandum itemGold (m fine troy oz) 7.228 7.980 8.729 8.217 7.119
a Year-end holdings valued at 75% of fourth-quarter London cash price.
Source: IMF, International Financial Statistics.
Exchange rates(period averages)
2000 2001 2002 2003 2004P:US$ 44.192 50.993 51.604 54.203 56.040P:¥100 41.001 41.959 41.155 46.755 51.841
Source: IMF, International Financial Statistics.
Editors: David Webb (editor); Gerard Walsh (consulting editor)Editorial closing date: August 16th 2005
All queries: Tel: (44.20) 7830 1007 E-mail: [email protected]