Embed Size (px)
Citation preview
AGRICULTURAL STRUCTURE AND RESOURCES
PHILIPPINE STATISTICS AUTHORITY
ISSN-2012-0435
REPORT No. 2017-2
PHILIPPINE STATISTICS AUTHORITY 16
th Floor. ETON Cyberpod Centris 3
EDSA. Corner Quezon Avenue, Quezon City
www.psa.gov.ph
Republic of the Philippines
Philippine Statistics Authority

AGRICULTURAL STRUCTURE AND RESOURCES
PHILIPPINE STATISTICS AUTHORITY
TERMS OF USE Agricultural Indicators System (AIS) is a publication of the Philippine Statistics Authority. The PSA reserves exclusive right to reproduce this publication in whatever form. Should any portion of this publication be included in a report/article, the title of the publication and the PSA should be cited as the source of the data. The PSA will not be responsible for any information derived from the processing of data contained in this publication.
ISSN-2012-0435 AUGUST 2017
AGRICULTURAL STRUCTURE AND RESOURCES
PHILIPPINE STATISTICS AUTHORITY
MODULES OF THE AGRICULTURAL INDICATORS SYSTEM
1. Output and Productivity
2. Agricultural Structures and Resources
3. Agricultural Credit
4. Food Sufficiency and Security
5. Food Consumption and Nutrition
6. Population and Labor Force
7. Redistribution of Land
8. Agricultural Exports and Imports
9. Gender-based Indicators of Labor and Employment in Agriculture 10. Economic Growth
11. Prices and Marketing of Agricultural Commodities
12. Inputs
i
AGRICULTURAL STRUCTURE AND RESOURCES
PHILIPPINE STATISTICS AUTHORITY
TABLE OF CONTENTS
iii 20
Tab
le 9
aG
row
th r
ates
in n
um
ber
of
du
ck in
all
farm
s b
y re
gio
n, P
hili
pp
ines
, 201
2-20
16
(Gro
wth
rat
es in
per
cen
t)
12-1
313
-14
14-1
515
-16
AV
ERA
GE
2012
-201
6
Phili
ppin
es10
,518
,539
1.23
-2.4
61.
834.
491.
27
CA
R20
9,05
1-8
.54
-0.2
76.
601.
96-0
.06
Iloco
s R
egio
n39
6,91
4-0
.08
-1.6
95.
572.
911.
68C
agay
an V
alle
y1,
119,
997
3.02
-2.4
41.
460.
400.
61
Cen
tral
Luz
on3,
410,
575
10.0
04.
987.
876.
317.
29C
ALA
BA
RZO
N31
4,09
9-1
.84
-3.0
7-6
.02
8.31
-0.6
5M
IMA
RO
PA20
2,36
2-1
.69
3.70
3.27
-7.2
9-0
.50
Bic
ol R
egio
n 42
5,88
9-8
.89
5.15
7.88
8.97
3.28
Wes
tern
Vis
ayas
1,42
0,07
6-9
.05
-1.5
8-1
.87
1.88
-2.6
6C
entr
al V
isay
as14
4,69
8-6
.90
1.79
-3.6
90.
88-1
.98
East
ern
Vis
ayas
265,
452
-11.
15-5
.10
-4.8
6-1
2.99
-8.5
2Za
mbo
anga
Pen
insu
la16
5,97
712
.51
-2.6
4-5
.05
10.2
33.
76N
orth
ern
Min
dana
o43
1,30
4-0
.36
-1.7
83.
941.
180.
74
Dav
ao R
egio
n50
1,46
6-1
.90
2.17
4.00
10.2
43.
63SO
CC
SKSA
RG
EN1,
245,
859
1.13
-8.2
5-0
.63
12.5
11.
19C
arag
a12
2,04
44.
121.
62-3
.08
-6.7
8-1
.03
AR
MM
142,
776
16.1
2-5
0.73
-37.
861.
35-1
7.78
REG
ION
2016
LEV
EL
(BIR
DS)
GR
OW
TH R
ATE
S
FOREWORD i
LIST OF TABLES iii
AGRICULTURAL STRUCTURE AND RESOURCES
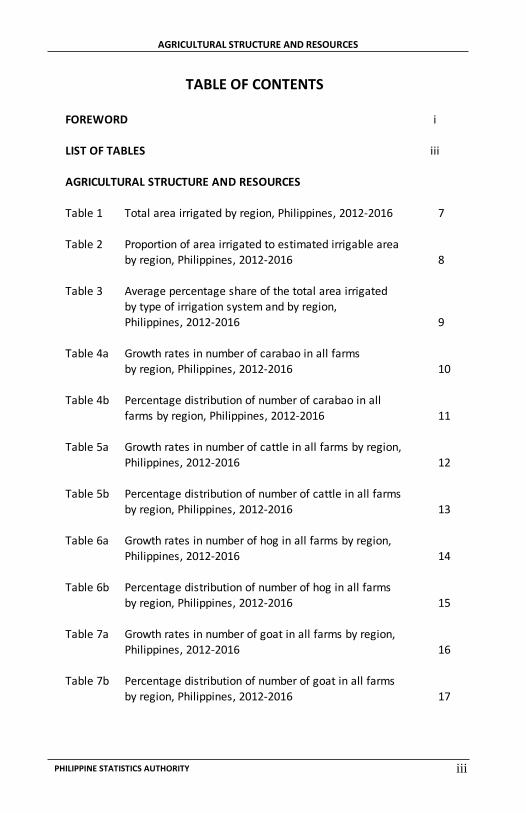
Table 1 Total area irrigated by region, Philippines, 2012-2016 7
Table 2 Proportion of area irrigated to estimated irrigable areaby region, Philippines, 2012-2016 8
Table 3 Average percentage share of the total area irrigatedby type of irrigation system and by region,Philippines, 2012-2016 9
Table 4a Growth rates in number of carabao in all farmsby region, Philippines, 2012-2016 10
Table 4b Percentage distribution of number of carabao in allfarms by region, Philippines, 2012-2016 11
Table 5a Growth rates in number of cattle in all farms by region,Philippines, 2012-2016 12
Table 5b Percentage distribution of number of cattle in all farmsby region, Philippines, 2012-2016 13
Table 6a Growth rates in number of hog in all farms by region,Philippines, 2012-2016 14
Table 6b Percentage distribution of number of hog in all farmsby region, Philippines, 2012-2016 15
Table 7a Growth rates in number of goat in all farms by region,Philippines, 2012-2016 16
Table 7b Percentage distribution of number of goat in all farmsby region, Philippines, 2012-2016 17
AGRICULTURAL STRUCTURE AND RESOURCES
PHILIPPINE STATISTICS AUTHORITY
TABLE OF CONTENTS
19
Tab
le 8
bP
erce
nta
ge d
istr
ibu
tio
n o
f n
um
ber
of
chic
ken
in a
ll fa
rms
by
regi
on
,
Ph
ilip
pin
es, 2
012-
2016
REG
ION
2012
2013
2014
2015
2016
Phili
ppin
es10
0.00
100.
0010
0.00
100.
0010
0.00
CA
R0.
930.
970.
910.
900.
87Ilo
cos
Reg
ion
6.16
7.09
6.58
6.53
6.51
Cag
ayan
Val
ley
4.54
4.66
3.78
3.86
3.95
Cen
tral
Luz
on17
.20
18.0
219
.67
19.6
519
.46
CA
LAB
AR
ZON
17.2
115
.88
16.6
715
.44
15.1
6M
IMA
RO
PA2.
192.
182.
222.
312.
31B
icol
Reg
ion
4.08
3.87
4.94
4.65
5.59
Wes
tern
Vis
ayas
11.2
811
.72
11.2
711
.12
10.9
6C
entr
al V
isay
as7.
647.
687.
007.
227.
29Ea
ster
n V
isay
as2.
331.
850.
970.
981.
27Za
mbo
anga
Pen
insu
la3.
163.
133.
023.
113.
16N
orth
ern
Min
dana
o11
.75
11.5
111
.00
10.5
210
.60
Dav
ao R
egio
n5.
115.
166.
087.
477.
04SO
CC
SKSA
RG
EN3.
933.
973.
643.
863.
68C
arag
a1.
010.
991.
061.
181.
08A
RM
M1.
481.
311.
201.
191.
07
Table 8a Growth rates in number of chicken in all farms by region,
Philippines, 2012-2016 18
Table 8b Percentage distribution of number of chicken in all farms
by region, Philippines, 2012-2016 19
Table 9a Growth rates in number of duck in all farms by region,Philippines, 2012-2016 20
Table 9b Percentage distribution of number of duck in all farms
by region, Philippines, 2012-2016 21

AGRICULTURAL STRUCTURE AND RESOURCES
PHILIPPINE STATISTICS AUTHORITY
18
Tab
le 8
aG
row
th r
ates
in n
um
ber
of
chic
ken
in a
ll fa
rms
by
regi
on
, Ph
ilip
pin
es, 2
012-
2016
(G
row
th r
ates
in p
erce
nt)
12-1
313
-14
14-1
515
-16
AV
ERA
GE
2012
-201
6
Phili
ppin
es17
8,79
2,80
71.
340.
775.
251.
322.
17
CA
R1,
564,
252
6.19
-6.1
44.
28-1
.19
0.79
Iloco
s R
egio
n11
,631
,311
16.6
8-6
.53
4.46
0.96
3.89
Cag
ayan
Val
ley
7,05
8,39
63.
93-1
8.15
7.39
3.59
-0.8
1C
entr
al L
uzon
34,7
88,2
086.
209.
985.
160.
305.
41C
ALA
BA
RZO
N27
,105
,692
-6.5
15.
79-2
.50
-0.5
3-0
.94
MIM
AR
OPA
4,12
5,67
00.
712.
679.
541.
133.
51B
icol
Reg
ion
9,99
2,14
6-3
.82
28.5
4-0
.98
21.8
311
.39
Wes
tern
Vis
ayas
19,5
93,8
965.
29-3
.11
3.82
-0.1
51.
46C
entr
al V
isay
as13
,037
,027
1.91
-8.1
88.
552.
341.
15Ea
ster
n V
isay
as2,
272,
502
-19.
48-4
7.35
7.18
30.8
9-7
.19
Zam
boan
ga P
enin
sula
5,64
3,35
50.
44-2
.77
8.55
2.75
2.24
Nor
ther
n M
inda
nao
18,9
55,9
39-0
.76
-3.6
60.
632.
10-0
.42
Dav
ao R
egio
n12
,589
,929
2.33
18.7
529
.43
-4.5
211
.50
SOC
CSK
SAR
GEN
6,58
5,73
82.
29-7
.61
11.8
0-3
.42
0.76
Car
aga
1,93
1,33
9-0
.15
7.33
16.9
5-6
.92
4.30
AR
MM
1,91
7,40
7-1
0.49
-7.7
34.
29-8
.64
-5.6
4
REG
ION
2016
LEV
EL
(BIR
DS)
GR
OW
TH R
ATE
S

AGRICULTURAL STRUCTURE AND RESOURCES
PHILIPPINE STATISTICS AUTHORITY
1 16
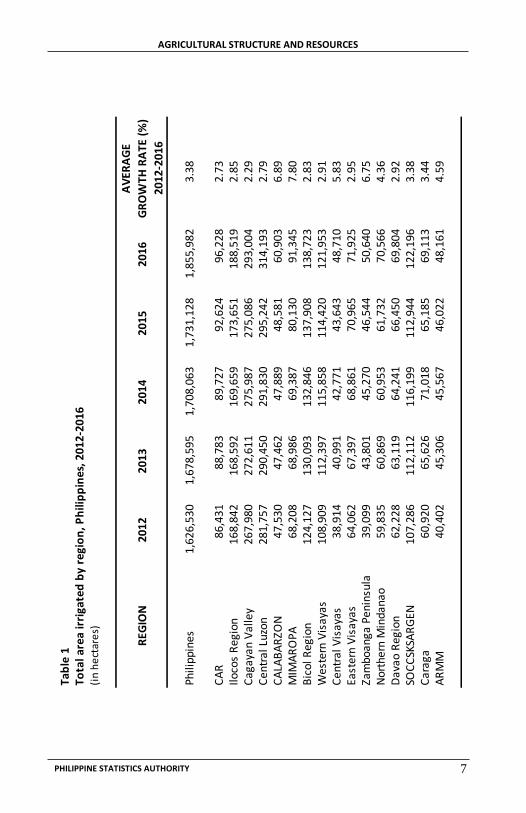
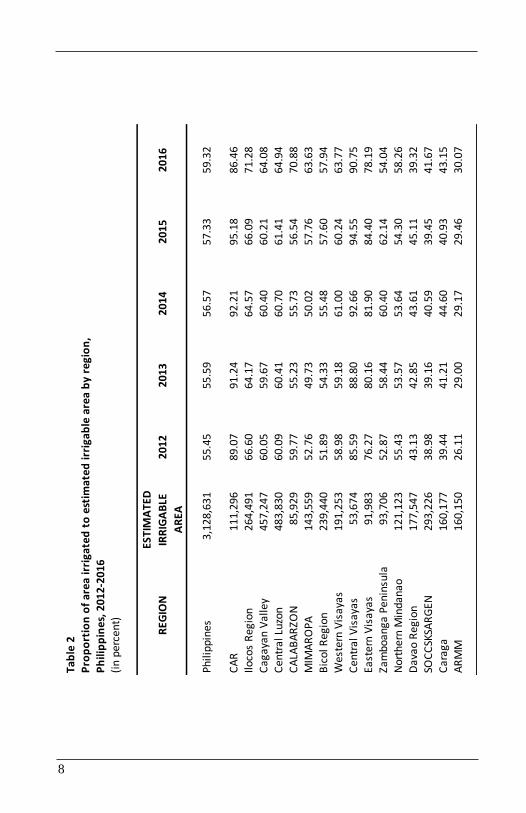
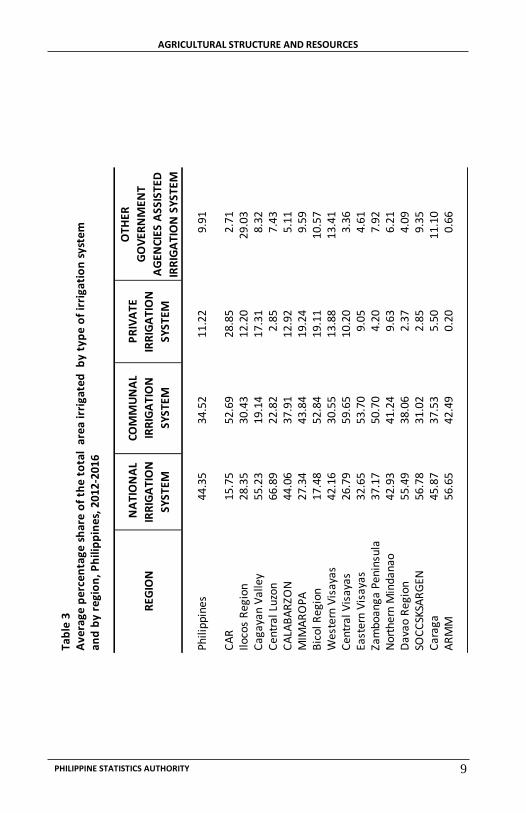
Irrigation Development and Types of Irrigation System Indicators on irrigation development allow the measurement of the extent of enhancement in the use of agricultural lands in the country. Indicators are shown in terms of the rate of growth of irrigated land over the years and the types of irrigation system used. The country’s irrigated area in 2016 reached 1.86 million hectares. It grew yearly by an average of 3.38 percent during the period 2012 to 2016. At the regional level, the biggest yearly expansion of irrigated land was reported in MIMAROPA with an average growth rate of 7.80 percent. CALABARZON and Zamboanga Peninsula came next with average annual increases of 6.89 percent and 6.75 percent, respectively. An average expansion of around 2.0 percent in irrigated areas was noted in the majority of the regions, namely, CAR, Ilocos Region, Cagayan Valley, Central Luzon, Bicol Region, Western Visayas, Eastern Visayas and Davao Region (Table 1). The 2016 total irrigated land at 1.86 million hectares comprised 59.32 percent of the estimated irrigable areas of 3.13 million hectares. This irrigation development was 1.99 percentage points higher than the last year’s record of 57.33 percent. Most of the regions exhibited increasing irrigation development. Among regions, the biggest proportions of irrigation development were recorded in Central Visayas at 90.75 percent and CAR at 86.46 percent. About 63.63 percent to 78.19 percent were noted in Ilocos Region, Cagayan Valley, Central Luzon, CALABARZON, MIMAROPA, Western Visayas and Eastern Visayas. In contrast, the least proportion was still observed in ARMM at 30.07 percent in 2016 (Table 2). During the five-year reference period, the national irrigation system was the major supplier of water accounting for an average of 44.35 percent of the country’s irrigated lands. About 34.52 percent were sourced from the communal irrigation system and 11.22 percent from private irrigation system. The remaining 9.91 percent covered the irrigation provided by other government agencies. Across regions, the national irrigation system was the primary provider of water to Cagayan Valley, Central Luzon, Davao Region, SOCCSKSARGEN and ARMM as it supplied about 55 to 66 percent of the region’s irrigated farmlands. The communal irrigation system was dominantly used in Central Visayas, covering 59.65 percent of the region’s irrigated areas.
Tab
le 7
aG
row
th r
ates
in n
um
ber
of
goat
in a
ll fa
rms
by
regi
on
, Ph
ilip
pin
es, 2
012-
2016
(G
row
th r
ates
in p
erce
nt)
12-1
313
-14
14-1
515
-16
AV
ERA
GE
2012
-201
6
Phili
ppin
es3,
663,
060
-0.5
70.
04-0
.58
-0.3
0-0
.35
CA
R68
,287
1.17
-2.3
0-1
.72
-3.3
0-1
.54
Iloco
s R
egio
n40
6,32
10.
210.
99-0
.39
-4.1
3-0
.83
Cag
ayan
Val
ley
115,
533
0.93
1.83
-0.3
21.
170.
90C
entr
al L
uzon
351,
922
5.75
12.3
07.
81-2
.40
5.87
CA
LAB
AR
ZON
252,
275
1.24
3.19
3.75
2.16
2.59
MIM
AR
OPA
178,
143
0.80
-0.5
40.
901.
660.
70B
icol
Reg
ion
145,
460
1.56
7.57
6.68
6.77
5.64
Wes
tern
Vis
ayas
516,
075
-1.1
5-0
.61
-4.3
3-0
.60
-1.6
7C
entr
al V
isay
as49
3,41
5-1
.41
-0.5
2-0
.88
0.52
-0.5
7Ea
ster
n V
isay
as34
,514
-21.
14-2
1.80
-13.
89-4
.44
-15.
32Za
mbo
anga
Pen
insu
la12
0,07
62.
53-1
.45
1.17
2.22
1.12
Nor
ther
n M
inda
nao
236,
752
0.22
-3.3
2-0
.32
1.39
-0.5
1D
avao
Reg
ion
313,
428
-0.2
7-8
.31
-7.9
1-0
.77
-4.3
1SO
CC
SKSA
RG
EN22
9,89
9-4
.58
0.13
-0.9
4-0
.06
-1.3
6
Car
aga
53,1
554.
350.
910.
87-2
.21
0.98
AR
MM
147,
805
-7.4
31.
81-0
.95
-0.9
3-1
.87
REG
ION
2016
LEV
EL
(HEA
D)
GR
OW
TH R
ATE
S
AGRICULTURAL STRUCTURE AND RESOURCES
PHILIPPINE STATISTICS AUTHORITY
59.65 percent of the region’s irrigated areas. In CAR, about 28.85 percent of the irrigated lands were serviced by the private irrigation system. Meanwhile, a bigger proportion of irrigated areas in Ilocos Region at 29.03 percent sourced water from other government agencies assisted irrigation system (Table 3).
Inventory of Livestock and Poultry Livestock and poultry population forms part of agricultural holdings of the country. The performance of the livestock and poultry sector can be monitored through the inventory and distribution of the various types of animals and birds across regions.
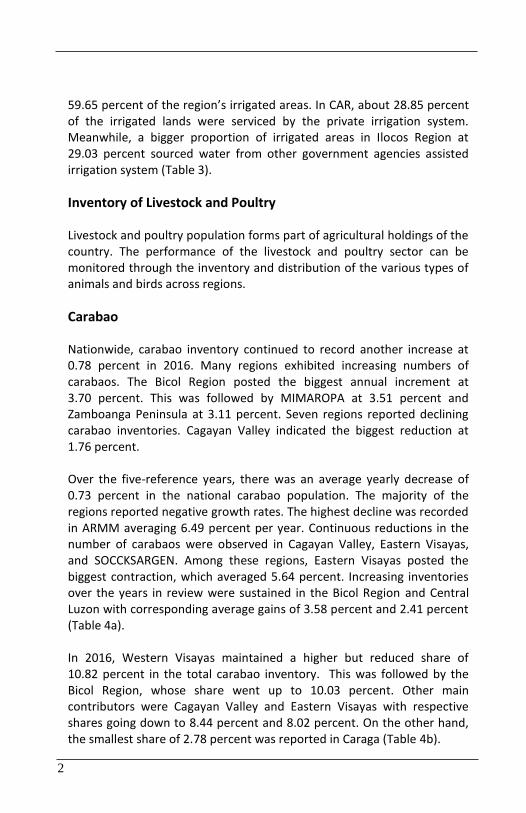
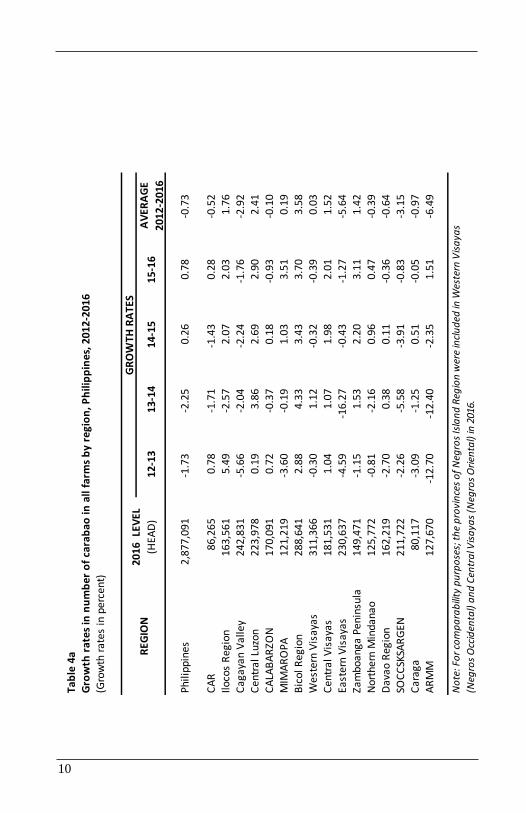
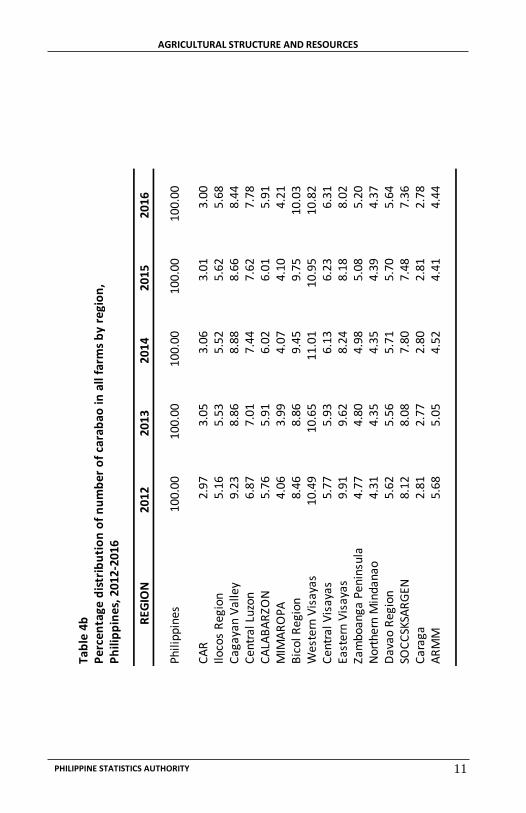
Carabao Nationwide, carabao inventory continued to record another increase at 0.78 percent in 2016. Many regions exhibited increasing numbers of carabaos. The Bicol Region posted the biggest annual increment at 3.70 percent. This was followed by MIMAROPA at 3.51 percent and Zamboanga Peninsula at 3.11 percent. Seven regions reported declining carabao inventories. Cagayan Valley indicated the biggest reduction at 1.76 percent. Over the five-reference years, there was an average yearly decrease of 0.73 percent in the national carabao population. The majority of the regions reported negative growth rates. The highest decline was recorded in ARMM averaging 6.49 percent per year. Continuous reductions in the number of carabaos were observed in Cagayan Valley, Eastern Visayas, and SOCCKSARGEN. Among these regions, Eastern Visayas posted the biggest contraction, which averaged 5.64 percent. Increasing inventories over the years in review were sustained in the Bicol Region and Central Luzon with corresponding average gains of 3.58 percent and 2.41 percent (Table 4a). In 2016, Western Visayas maintained a higher but reduced share of 10.82 percent in the total carabao inventory. This was followed by the Bicol Region, whose share went up to 10.03 percent. Other main contributors were Cagayan Valley and Eastern Visayas with respective shares going down to 8.44 percent and 8.02 percent. On the other hand, the smallest share of 2.78 percent was reported in Caraga (Table 4b). Cattle
15 2
Tab
le 6
bP
erce
nta
ge d
istr
ibu
tio
n o
f n
um
ber
of
ho
g in
all
farm
s b
y re
gio
n,
Ph
ilip
pin
es, 2
012-
2016
REG
ION
2012
2013
2014
2015
2016
Phili
ppin
es10
0.00
100.
0010
0.00
100.
0010
0.00
CA
R1.
771.
791.
781.
641.
59Ilo
cos
Reg
ion
4.51
4.47
4.42
4.35
4.45
Cag
ayan
Val
ley
3.21
3.20
3.31
3.37
3.39
Cen
tral
Luz
on13
.07
15.1
416
.06
16.1
317
.93
CA
LAB
AR
ZON
13.8
413
.20
13.1
713
.12
13.3
4M
IMA
RO
PA4.
354.
384.
554.
634.
57B
icol
Reg
ion
6.41
6.74
7.27
7.20
6.87
Wes
tern
Vis
ayas
11.0
211
.15
11.0
510
.80
10.3
7C
entr
al V
isay
as8.
097.
857.
627.
837.
67Ea
ster
n V
isay
as4.
964.
002.
772.
802.
58Za
mbo
anga
Pen
insu
la4.
224.
334.
264.
314.
10N
orth
ern
Min
dana
o7.
567.
617.
627.
377.
33D
avao
Reg
ion
7.24
6.85
6.81
7.07
7.04
SOC
CSK
SAR
GEN
6.79
6.72
6.70
6.74
6.32
Car
aga
2.03
2.03
2.04
2.09
1.98
AR
MM
0.92
0.55
0.58
0.56
0.47
AGRICULTURAL STRUCTURE AND RESOURCES
PHILIPPINE STATISTICS AUTHORITY
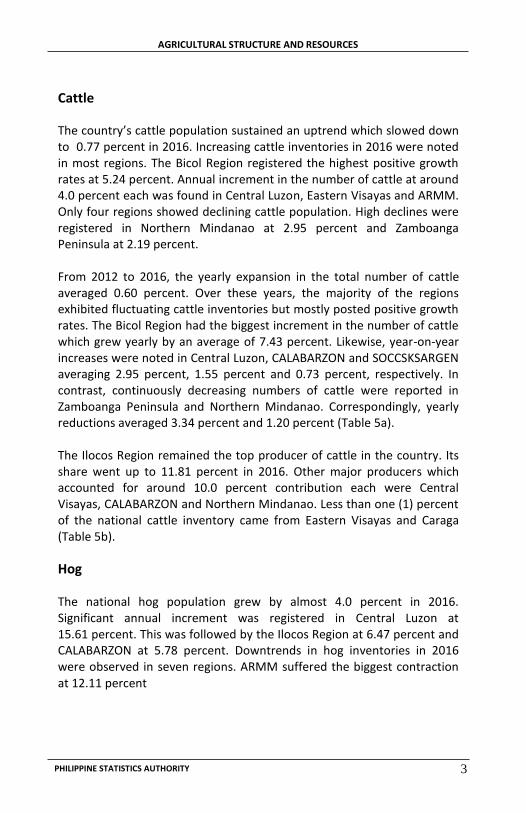
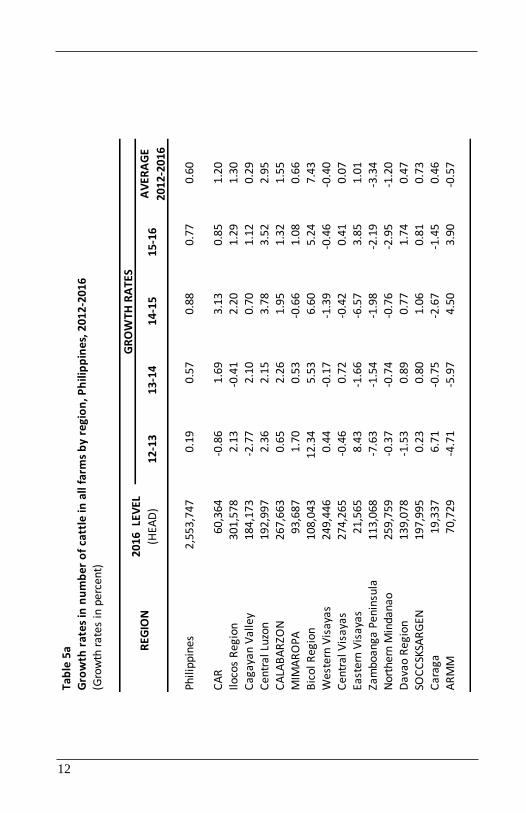
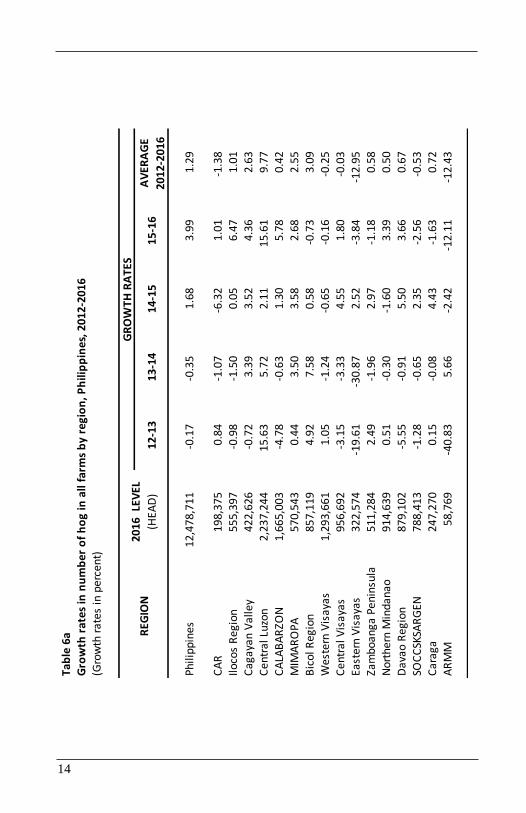
Cattle The country’s cattle population sustained an uptrend which slowed down to 0.77 percent in 2016. Increasing cattle inventories in 2016 were noted in most regions. The Bicol Region registered the highest positive growth rates at 5.24 percent. Annual increment in the number of cattle at around 4.0 percent each was found in Central Luzon, Eastern Visayas and ARMM. Only four regions showed declining cattle population. High declines were registered in Northern Mindanao at 2.95 percent and Zamboanga Peninsula at 2.19 percent. From 2012 to 2016, the yearly expansion in the total number of cattle averaged 0.60 percent. Over these years, the majority of the regions exhibited fluctuating cattle inventories but mostly posted positive growth rates. The Bicol Region had the biggest increment in the number of cattle which grew yearly by an average of 7.43 percent. Likewise, year-on-year increases were noted in Central Luzon, CALABARZON and SOCCSKSARGEN averaging 2.95 percent, 1.55 percent and 0.73 percent, respectively. In contrast, continuously decreasing numbers of cattle were reported in Zamboanga Peninsula and Northern Mindanao. Correspondingly, yearly reductions averaged 3.34 percent and 1.20 percent (Table 5a). The Ilocos Region remained the top producer of cattle in the country. Its share went up to 11.81 percent in 2016. Other major producers which accounted for around 10.0 percent contribution each were Central Visayas, CALABARZON and Northern Mindanao. Less than one (1) percent of the national cattle inventory came from Eastern Visayas and Caraga (Table 5b). Hog The national hog population grew by almost 4.0 percent in 2016. Significant annual increment was registered in Central Luzon at 15.61 percent. This was followed by the Ilocos Region at 6.47 percent and CALABARZON at 5.78 percent. Downtrends in hog inventories in 2016 were observed in seven regions. ARMM suffered the biggest contraction at 12.11 percent
3 14
Tab
le 6
aG
row
th r
ates
in n
um
ber
of
ho
g in
all
farm
s b
y re
gio
n, P
hili
pp
ines
, 201
2-20
16
(Gro
wth
rat
es in
per
cent
)
12-1
313
-14
14-1
515
-16
AV
ERA
GE
2012
-201
6
Phili
ppin
es12
,478
,711
-0.1
7-0
.35
1.68
3.99
1.29
CA
R19
8,37
50.
84-1
.07
-6.3
21.
01-1
.38
Iloco
s R
egio
n55
5,39
7-0
.98
-1.5
00.
056.
471.
01C
agay
an V
alle
y42
2,62
6-0
.72
3.39
3.52
4.36
2.63
Cen
tral
Luz
on2,
237,
244
15.6
35.
722.
1115
.61
9.77
CA
LAB
AR
ZON
1,66
5,00
3-4
.78
-0.6
31.
305.
780.
42
MIM
AR
OPA
570,
543
0.44
3.50
3.58
2.68
2.55
Bic
ol R
egio
n 85
7,11
94.
927.
580.
58-0
.73
3.09
Wes
tern
Vis
ayas
1,29
3,66
11.
05-1
.24
-0.6
5-0
.16
-0.2
5C
entr
al V
isay
as95
6,69
2-3
.15
-3.3
34.
551.
80-0
.03
East
ern
Vis
ayas
322,
574
-19.
61-3
0.87
2.52
-3.8
4-1
2.95
Zam
boan
ga P
enin
sula
511,
284
2.49
-1.9
62.
97-1
.18
0.58
Nor
ther
n M
inda
nao
914,
639
0.51
-0.3
0-1
.60
3.39
0.50
Dav
ao R
egio
n87
9,10
2-5
.55
-0.9
15.
503.
660.
67SO
CC
SKSA
RG
EN78
8,41
3-1
.28
-0.6
52.
35-2
.56
-0.5
3
Car
aga
247,
270
0.15
-0.0
84.
43-1
.63
0.72
AR
MM
58,7
69-4
0.83
5.66
-2.4
2-1
2.11
-12.
43
REG
ION
2016
LEV
EL
(HEA
D)
GR
OW
TH R
ATE
S
AGRICULTURAL STRUCTURE AND RESOURCES
PHILIPPINE STATISTICS AUTHORITY
The total number of hogs improved annually by an average of 1.29 percent during the five-year period. At the regional level, up and down movement in hog inventory was commonly observed. However, the majority of the regions, on the average, exhibited positive growth rates. Uptrends throughout the reference years were maintained in Central Luzon and MIMAROPA, recording average gains at 9.77 percent and 2.55 percent, respectively. Meanwhile, the biggest reductions in hog population were noted in Eastern Visayas and ARMM, which averaged 12.95 percent and 12.43 percent, respectively (Table 6a). Throughout the years in review, Central Luzon and CALABARZON recorded the most number of hogs in the country. Respective shares rose to 17.93 percent and 13.34 percent in 2016. Western Visayas came next where share slid to 10.37 percent. In contrast, the least share was still noted in ARMM which further dropped to 0.47 percent (Table 6b).
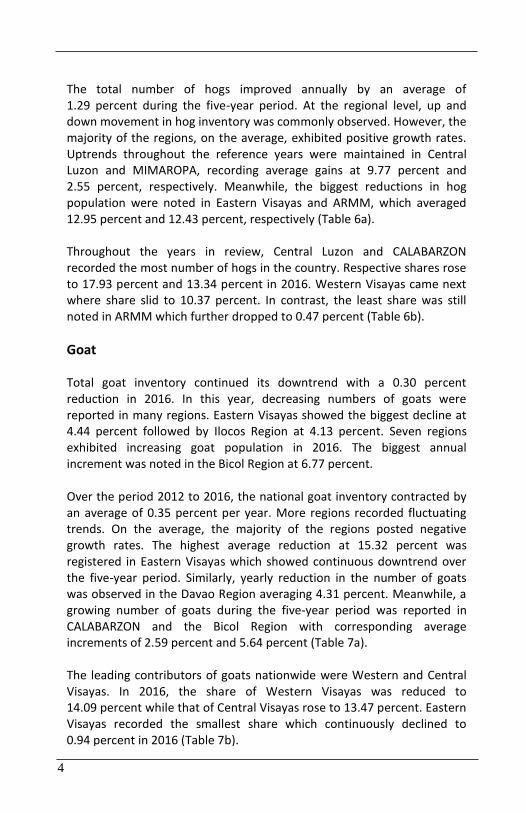
Goat Total goat inventory continued its downtrend with a 0.30 percent reduction in 2016. In this year, decreasing numbers of goats were reported in many regions. Eastern Visayas showed the biggest decline at 4.44 percent followed by Ilocos Region at 4.13 percent. Seven regions exhibited increasing goat population in 2016. The biggest annual increment was noted in the Bicol Region at 6.77 percent.
Over the period 2012 to 2016, the national goat inventory contracted by an average of 0.35 percent per year. More regions recorded fluctuating trends. On the average, the majority of the regions posted negative growth rates. The highest average reduction at 15.32 percent was registered in Eastern Visayas which showed continuous downtrend over the five-year period. Similarly, yearly reduction in the number of goats was observed in the Davao Region averaging 4.31 percent. Meanwhile, a growing number of goats during the five-year period was reported in CALABARZON and the Bicol Region with corresponding average increments of 2.59 percent and 5.64 percent (Table 7a). The leading contributors of goats nationwide were Western and Central Visayas. In 2016, the share of Western Visayas was reduced to 14.09 percent while that of Central Visayas rose to 13.47 percent. Eastern Visayas recorded the smallest share which continuously declined to 0.94 percent in 2016 (Table 7b).
13 4
Tab
le 5
bP
erce
nta
ge d
istr
ibu
tio
n o
f n
um
ber
of
catt
le in
all
farm
s b
y re
gio
n,
Ph
ilip
pin
es, 2
012-
2016
REG
ION
2012
2013
2014
2015
2016
Phili
ppin
es10
0.00
100.
0010
0.00
100.
0010
0.00
CA
R2.
312.
292.
312.
362.
36Ilo
cos
Reg
ion
11.4
911
.71
11.6
011
.75
11.8
1C
agay
an V
alle
y7.
317.
097.
207.
197.
21C
entr
al L
uzon
6.89
7.04
7.15
7.36
7.56
CA
LAB
AR
ZON
10.1
010
.14
10.3
110
.42
10.4
8M
IMA
RO
PA3.
663.
723.
713.
663.
67B
icol
Reg
ion
3.26
3.65
3.83
4.05
4.23
Wes
tern
Vis
ayas
10.1
710
.19
10.1
29.
899.
77C
entr
al V
isay
as10
.97
10.9
010
.92
10.7
810
.74
East
ern
Vis
ayas
0.84
0.90
0.88
0.82
0.84
Zam
boan
ga P
enin
sula
5.20
4.80
4.69
4.56
4.43
Nor
ther
n M
inda
nao
10.9
410
.88
10.7
410
.56
10.1
7D
avao
Reg
ion
5.48
5.38
5.40
5.39
5.45
SOC
CSK
SAR
GEN
7.72
7.72
7.74
7.75
7.75
Car
aga
0.76
0.81
0.80
0.77
0.76
AR
MM
2.92
2.77
2.59
2.69
2.77
AGRICULTURAL STRUCTURE AND RESOURCES
PHILIPPINE STATISTICS AUTHORITY
Chicken At the national level, chicken population growth slowed down to 1.32 percent in 2016. In this year, notable annual increments were observed in Eastern Visayas at 30.89 percent and the Bicol Region at 21.83 percent. Decreases in the number of chicken were noted in seven regions. ARMM reported the highest annual reduction at 8.64 percent.
On the average, the total chicken inventories from 2012 to 2016 expanded by 2.17 percent per year. Despite the up and down trend in the number of chicken over the five-year period, positive growth rates, on the average, were recorded in most regions. Significant average increments were posted in the Davao Region at 11.50 percent and the Bicol Region at 11.39 percent. Increasing chicken inventories throughout the reference years were observed in Central Luzon and MIMAROPA, averaging 5.41 percent and 3.51 percent per year, respectively. The decline was high in Eastern Visayas, which averaged 7.19 percent (Table 8a). The biggest shares in the country’s chicken population came from Central Luzon and CALABARZON. However, its corresponding shares in 2016 slid to 19.46 percent and 15.16 percent. Western Visayas and Northern Mindanao were other main contributors sharing around 10 percent each. CAR comprised the least share of 0.87 percent in the total chicken inventory (Table 8b).
Duck The number of ducks in the country indicated a higher increment in 2016 at 4.49 percent. Except for MIMAROPA, Eastern Visayas and Caraga, all the other regions had increasing duck population. SOCCSKSARGEN and Zamboanga Peninsula recovered from the previous year’s downtrend and came up with bigger annual increments at 12.51 percent and 10.23 percent, respectively, in 2016. A 10.24 percent gain was reported in Northern Mindanao. Eastern Visayas showed another downtrend and posted the biggest reduction at 12.99 percent in 2016.
5 12
Tab
le 5
aG
row
th r
ates
in n
um
ber
of
catt
le in
all
farm
s b
y re
gio
n, P
hili
pp
ines
, 201
2-20
16
(Gro
wth
rat
es in
per
cen
t)
12-1
313
-14
14-1
515
-16
AV
ERA
GE
2012
-201
6
Phili
ppin
es2,
553,
747
0.19
0.57
0.88
0.77
0.60
CA
R60
,364
-0.8
61.
693.
130.
851.
20Ilo
cos
Reg
ion
301,
578
2.13
-0.4
12.
201.
291.
30C
agay
an V
alle
y18
4,17
3-2
.77
2.10
0.70
1.12
0.29
Cen
tral
Luz
on19
2,99
72.
362.
153.
783.
522.
95
CA
LAB
AR
ZON
267,
663
0.65
2.26
1.95
1.32
1.55
MIM
AR
OPA
93,6
871.
700.
53-0
.66
1.08
0.66
Bic
ol R
egio
n 10
8,04
312
.34
5.53
6.60
5.24
7.43
Wes
tern
Vis
ayas
249,
446
0.44
-0.1
7-1
.39
-0.4
6-0
.40
Cen
tral
Vis
ayas
274,
265
-0.4
60.
72-0
.42
0.41
0.07
East
ern
Vis
ayas
21,5
658.
43-1
.66
-6.5
73.
851.
01Za
mbo
anga
Pen
insu
la11
3,06
8-7
.63
-1.5
4-1
.98
-2.1
9-3
.34
Nor
ther
n M
inda
nao
259,
759
-0.3
7-0
.74
-0.7
6-2
.95
-1.2
0
Dav
ao R
egio
n13
9,07
8-1
.53
0.89
0.77
1.74
0.47
SOC
CSK
SAR
GEN
197,
995
0.23
0.80
1.06
0.81
0.73
Car
aga
19,3
376.
71-0
.75
-2.6
7-1
.45
0.46
AR
MM
70,7
29-4
.71
-5.9
74.
503.
90-0
.57
REG
ION
2016
LEV
EL
(HEA
D)
GR
OW
TH R
ATE
S

AGRICULTURAL STRUCTURE AND RESOURCES
PHILIPPINE STATISTICS AUTHORITY
Countrywide, duck inventory grew by a yearly average of 1.27 percent for the period 2012 to 2016. Over these years, sustained increases were noted only in Central Luzon with an average annual gain of 7.29 percent. On the other hand, year-on-year declines were observed in Eastern Visayas, averaging 8.52 percent. ARMM indicated notable average reduction at 17.78 percent per year (Table 9a). Central Luzon was still the top contributor of ducks nationwide. Its share continued to increase to 32.42 percent in 2016. Western Visayas was another major producer but its share went down to 13.50 percent. Around 11 percent share each was reported in Cagayan Valley and SOCCSKSARGEN. Declining and low contribution continued in Caraga at 1.16 percent in 2016 (Table 9b).
11 6
Tab
le 4
bP
erce
nta
ge d
istr
ibu
tio
n o
f n
um
ber
of
cara
bao
in a
ll fa
rms
by
regi
on
,P
hili
pp
ines
, 201
2-20
16
REG
ION
2012
2013
2014
2015
2016
Phili
ppin
es10
0.00
100.
0010
0.00
100.
0010
0.00
CA
R2.
973.
053.
063.
013.
00Ilo
cos
Reg
ion
5.16
5.53
5.52
5.62
5.68
Cag
ayan
Val
ley
9.23
8.86
8.88
8.66
8.44
Cen
tral
Luz
on6.
877.
017.
447.
627.
78C
ALA
BA
RZO
N5.
765.
916.
026.
015.
91M
IMA
RO
PA4.
063.
994.
074.
104.
21B
icol
Reg
ion
8.46
8.86
9.45
9.75
10.0
3W
este
rn V
isay
as10
.49
10.6
511
.01
10.9
510
.82
Cen
tral
Vis
ayas
5.77
5.93
6.13
6.23
6.31
East
ern
Vis
ayas
9.91
9.62
8.24
8.18
8.02
Zam
boan
ga P
enin
sula
4.77
4.80
4.98
5.08
5.20
Nor
ther
n M
inda
nao
4.31
4.35
4.35
4.39
4.37
Dav
ao R
egio
n5.
625.
565.
715.
705.
64SO
CC
SKSA
RG
EN8.
128.
087.
807.
487.
36C
arag
a2.
812.
772.
802.
812.
78A
RM
M5.
685.
054.
524.
414.
44
AGRICULTURAL STRUCTURE AND RESOURCES
PHILIPPINE STATISTICS AUTHORITY
7 10
Tab
le 1
Tota
l are
a ir
riga
ted
by
regi
on
, Ph
ilip
pin
es, 2
012-
2016
(in
he
ctar
es)
REG
ION
2012
2013
2014
2015
2016
AV
ERA
GE
GR
OW
TH R
ATE
(%
)
2012
-201
6
Phili
ppin
es1,
626,
530
1,67
8,59
51,
708,
063
1,73
1,12
81,
855,
982
3.38
CA
R86
,431
88,7
8389
,727
92,6
2496
,228
2.73
Iloco
s R
egio
n16
8,84
216
8,59
216
9,65
917
3,65
118
8,51
92.
85C
agay
an V
alle
y26
7,98
027
2,61
127
5,98
727
5,08
629
3,00
42.
29C
entr
al L
uzon
281,
757
290,
450
291,
830
295,
242
314,
193
2.79
CA
LAB
AR
ZON
47,5
3047
,462
47,8
8948
,581
60,9
036.
89M
IMA
RO
PA68
,208
68,9
8669
,387
80,1
3091
,345
7.80
Bic
ol R
egio
n 12
4,12
713
0,09
313
2,84
613
7,90
813
8,72
32.
83W
este
rn V
isay
as10
8,90
911
2,39
711
5,85
811
4,42
012
1,95
32.
91C
entr
al V
isay
as38
,914
40,9
9142
,771
43,6
4348
,710
5.83
East
ern
Vis
ayas
64,0
6267
,397
68,8
6170
,965
71,9
252.
95Za
mbo
anga
Pen
insu
la39
,099
43,8
0145
,270
46,5
4450
,640
6.75
Nor
ther
n M
inda
nao
59,8
3560
,869
60,9
5361
,732
70,5
664.
36D
avao
Reg
ion
62,2
2863
,119
64,2
4166
,450
69,8
042.
92SO
CC
SKSA
RG
EN10
7,28
611
2,11
211
6,19
911
2,94
412
2,19
63.
38C
arag
a60
,920
65,6
2671
,018
65,1
8569
,113
3.44
AR
MM
40,4
0245
,306
45,5
6746
,022
48,1
614.
59
Tab
le 4
aG
row
th r
ates
in n
um
ber
of
cara
bao
in a
ll fa
rms
by
regi
on
, Ph
ilip
pin
es, 2
012-
2016
(G
row
th r
ates
in p
erce
nt)
12-1
313
-14
14-1
515
-16
AV
ERA
GE
2012
-201
6
Phili
ppin
es2,
877,
091
-1.7
3-2
.25
0.26
0.78
-0.7
3
CA
R86
,265
0.78
-1.7
1-1
.43
0.28
-0.5
2Ilo
cos
Reg
ion
163,
561
5.49
-2.5
72.
072.
031.
76C
agay
an V
alle
y24
2,83
1-5
.66
-2.0
4-2
.24
-1.7
6-2
.92
Cen
tral
Luz
on22
3,97
80.
193.
862.
692.
902.
41C
ALA
BA
RZO
N17
0,09
10.
72-0
.37
0.18
-0.9
3-0
.10
MIM
AR
OPA
121,
219
-3.6
0-0
.19
1.03
3.51
0.19
Bic
ol R
egio
n 28
8,64
12.
884.
333.
433.
703.
58W
este
rn V
isay
as31
1,36
6-0
.30
1.12
-0.3
2-0
.39
0.03
Cen
tral
Vis
ayas
181,
531
1.04
1.07
1.98
2.01
1.52
East
ern
Vis
ayas
230,
637
-4.5
9-1
6.27
-0.4
3-1
.27
-5.6
4
Zam
boan
ga P
enin
sula
149,
471
-1.1
51.
532.
203.
111.
42N
orth
ern
Min
dana
o12
5,77
2-0
.81
-2.1
60.
960.
47-0
.39
Dav
ao R
egio
n16
2,21
9-2
.70
0.38
0.11
-0.3
6-0
.64
SOC
CSK
SAR
GEN
211,
722
-2.2
6-5
.58
-3.9
1-0
.83
-3.1
5C
arag
a80
,117
-3.0
9-1
.25
0.51
-0.0
5-0
.97
AR
MM
127,
670
-12.
70-1
2.40
-2.3
51.
51-6
.49
REG
ION
2016
LEV
EL
(HEA
D)
GR
OW
TH R
ATE
S
No
te: F
or
com
pa
rab
ility
pu
rpo
ses;
th
e p
rovi
nce
s o
f N
egro
s Is
lan
d R
egio
n w
ere
incl
ud
ed in
Wes
tern
Vis
aya
s
(Neg
ros
Occ
iden
tal)
an
d C
entr
al V
isa
yas
(Neg
ros
Ori
enta
l) in
201
6.
AGRICULTURAL STRUCTURE AND RESOURCES
PHILIPPINE STATISTICS AUTHORITY
9 8
Tab
le 3
Ave
rage
per
cen
tage
sh
are
of
the
tota
l ar
ea ir
riga
ted
by
typ
e o
f ir
riga
tio
n s
yste
m
and
by
regi
on
, Ph
ilip
pin
es, 2
012-
2016
REG
ION
NA
TIO
NA
L
IRR
IGA
TIO
N
SYST
EM
COM
MU
NA
L
IRR
IGA
TIO
N
SYST
EM
PR
IVA
TE
IRR
IGA
TIO
N
SYST
EM
OTH
ER
GO
VER
NM
ENT
AG
ENCI
ES A
SSIS
TED
IRR
IGA
TIO
N S
YSTE
M
Phili
ppin
es44
.35
34.5
211
.22
9.91
CA
R15
.75
52.6
928
.85
2.71
Iloco
s R
egio
n28
.35
30.4
312
.20
29.0
3C
agay
an V
alle
y55
.23
19.1
417
.31
8.32
Cen
tral
Luz
on66
.89
22.8
22.
857.
43C
ALA
BA
RZO
N44
.06
37.9
112
.92
5.11
MIM
AR
OPA
27.3
443
.84
19.2
49.
59B
icol
Reg
ion
17.4
852
.84
19.1
110
.57
Wes
tern
Vis
ayas
42.1
630
.55
13.8
813
.41
Cen
tral
Vis
ayas
26.7
959
.65
10.2
03.
36Ea
ster
n V
isay
as32
.65
53.7
09.
054.
61Za
mbo
anga
Pen
insu
la37
.17
50.7
04.
207.
92N
orth
ern
Min
dana
o42
.93
41.2
49.
636.
21D
avao
Reg
ion
55.4
938
.06
2.37
4.09
SOC
CSK
SAR
GEN
56.7
831
.02
2.85
9.35
Car
aga
45.8
737
.53
5.50
11.1
0A
RM
M56
.65
42.4
90.
200.
66
Tab
le 2
Pro
po
rtio
n o
f ar
ea ir
riga
ted
to
est
imat
ed ir
riga
ble
are
a b
y re
gio
n,
Ph
ilip
pin
es, 2
012-
2016
(in
perc
ent)
REG
ION
ESTI
MA
TED
IRR
IGA
BLE
AR
EA
2012
2013
2014
2015
2016
Phili
ppin
es3,
128,
631
55.4
555
.59
56.5
757
.33
59.3
2
CA
R11
1,29
689
.07
91.2
492
.21
95.1
886
.46
Iloco
s R
egio
n26
4,49
166
.60
64.1
764
.57
66.0
971
.28
Cag
ayan
Val
ley
457,
247
60.0
559
.67
60.4
060
.21
64.0
8C
entr
al L
uzon
483,
830
60.0
960
.41
60.7
061
.41
64.9
4C
ALA
BA
RZO
N85
,929
59.7
755
.23
55.7
356
.54
70.8
8M
IMA
RO
PA14
3,55
952
.76
49.7
350
.02
57.7
663
.63
Bic
ol R
egio
n 23
9,44
051
.89
54.3
355
.48
57.6
057
.94
Wes
tern
Vis
ayas
191,
253
58.9
859
.18
61.0
060
.24
63.7
7C
entr
al V
isay
as53
,674
85.5
988
.80
92.6
694
.55
90.7
5Ea
ster
n V
isay
as91
,983
76.2
780
.16
81.9
084
.40
78.1
9
Zam
boan
ga P
enin
sula
93,7
0652
.87
58.4
460
.40
62.1
454
.04
Nor
ther
n M
inda
nao
121,
123
55.4
353
.57
53.6
454
.30
58.2
6D
avao
Reg
ion
177,
547
43.1
342
.85
43.6
145
.11
39.3
2SO
CC
SKSA
RG
EN29
3,22
638
.98
39.1
640
.59
39.4
541
.67
Car
aga
160,
177
39.4
441
.21
44.6
040
.93
43.1
5A
RM
M16
0,15
026
.11
29.0
029
.17
29.4
630
.07
AGRICULTURAL STRUCTURE AND RESOURCES
PHILIPPINE STATISTICS AUTHORITY
7 10
Tab
le 1
Tota
l are
a ir
riga
ted
by
regi
on
, Ph
ilip
pin
es, 2
012-
2016
(in
he
ctar
es)
REG
ION
2012
2013
2014
2015
2016
AV
ERA
GE
GR
OW
TH R
ATE
(%
)
2012
-201
6
Phili
ppin
es1,
626,
530
1,67
8,59
51,
708,
063
1,73
1,12
81,
855,
982
3.38
CA
R86
,431
88,7
8389
,727
92,6
2496
,228
2.73
Iloco
s R
egio
n16
8,84
216
8,59
216
9,65
917
3,65
118
8,51
92.
85C
agay
an V
alle
y26
7,98
027
2,61
127
5,98
727
5,08
629
3,00
42.
29C
entr
al L
uzon
281,
757
290,
450
291,
830
295,
242
314,
193
2.79
CA
LAB
AR
ZON
47,5
3047
,462
47,8
8948
,581
60,9
036.
89M
IMA
RO
PA68
,208
68,9
8669
,387
80,1
3091
,345
7.80
Bic
ol R
egio
n 12
4,12
713
0,09
313
2,84
613
7,90
813
8,72
32.
83W
este
rn V
isay
as10
8,90
911
2,39
711
5,85
811
4,42
012
1,95
32.
91C
entr
al V
isay
as38
,914
40,9
9142
,771
43,6
4348
,710
5.83
East
ern
Vis
ayas
64,0
6267
,397
68,8
6170
,965
71,9
252.
95Za
mbo
anga
Pen
insu
la39
,099
43,8
0145
,270
46,5
4450
,640
6.75
Nor
ther
n M
inda
nao
59,8
3560
,869
60,9
5361
,732
70,5
664.
36D
avao
Reg
ion
62,2
2863
,119
64,2
4166
,450
69,8
042.
92SO
CC
SKSA
RG
EN10
7,28
611
2,11
211
6,19
911
2,94
412
2,19
63.
38C
arag
a60
,920
65,6
2671
,018
65,1
8569
,113
3.44
AR
MM
40,4
0245
,306
45,5
6746
,022
48,1
614.
59
Tab
le 4
aG
row
th r
ates
in n
um
ber
of
cara
bao
in a
ll fa
rms
by
regi
on
, Ph
ilip
pin
es, 2
012-
2016
(G
row
th r
ates
in p
erce
nt)
12-1
313
-14
14-1
515
-16
AV
ERA
GE
2012
-201
6
Phili
ppin
es2,
877,
091
-1.7
3-2
.25
0.26
0.78
-0.7
3
CA
R86
,265
0.78
-1.7
1-1
.43
0.28
-0.5
2Ilo
cos
Reg
ion
163,
561
5.49
-2.5
72.
072.
031.
76C
agay
an V
alle
y24
2,83
1-5
.66
-2.0
4-2
.24
-1.7
6-2
.92
Cen
tral
Luz
on22
3,97
80.
193.
862.
692.
902.
41C
ALA
BA
RZO
N17
0,09
10.
72-0
.37
0.18
-0.9
3-0
.10
MIM
AR
OPA
121,
219
-3.6
0-0
.19
1.03
3.51
0.19
Bic
ol R
egio
n 28
8,64
12.
884.
333.
433.
703.
58W
este
rn V
isay
as31
1,36
6-0
.30
1.12
-0.3
2-0
.39
0.03
Cen
tral
Vis
ayas
181,
531
1.04
1.07
1.98
2.01
1.52
East
ern
Vis
ayas
230,
637
-4.5
9-1
6.27
-0.4
3-1
.27
-5.6
4
Zam
boan
ga P
enin
sula
149,
471
-1.1
51.
532.
203.
111.
42N
orth
ern
Min
dana
o12
5,77
2-0
.81
-2.1
60.
960.
47-0
.39
Dav
ao R
egio
n16
2,21
9-2
.70
0.38
0.11
-0.3
6-0
.64
SOC
CSK
SAR
GEN
211,
722
-2.2
6-5
.58
-3.9
1-0
.83
-3.1
5C
arag
a80
,117
-3.0
9-1
.25
0.51
-0.0
5-0
.97
AR
MM
127,
670
-12.
70-1
2.40
-2.3
51.
51-6
.49
REG
ION
2016
LEV
EL
(HEA
D)
GR
OW
TH R
ATE
S
No
te: F
or
com
pa
rab
ility
pu
rpo
ses;
th
e p
rovi
nce
s o
f N
egro
s Is
lan
d R
egio
n w
ere
incl
ud
ed in
Wes
tern
Vis
aya
s
(Neg
ros
Occ
iden
tal)
an
d C
entr
al V
isa
yas
(Neg
ros
Ori
enta
l) in
201
6.
AGRICULTURAL STRUCTURE AND RESOURCES
PHILIPPINE STATISTICS AUTHORITY
Countrywide, duck inventory grew by a yearly average of 1.27 percent for the period 2012 to 2016. Over these years, sustained increases were noted only in Central Luzon with an average annual gain of 7.29 percent. On the other hand, year-on-year declines were observed in Eastern Visayas, averaging 8.52 percent. ARMM indicated notable average reduction at 17.78 percent per year (Table 9a). Central Luzon was still the top contributor of ducks nationwide. Its share continued to increase to 32.42 percent in 2016. Western Visayas was another major producer but its share went down to 13.50 percent. Around 11 percent share each was reported in Cagayan Valley and SOCCSKSARGEN. Declining and low contribution continued in Caraga at 1.16 percent in 2016 (Table 9b).
11 6
Tab
le 4
bP
erce
nta
ge d
istr
ibu
tio
n o
f n
um
ber
of
cara
bao
in a
ll fa
rms
by
regi
on
,P
hili
pp
ines
, 201
2-20
16
REG
ION
2012
2013
2014
2015
2016
Phili
ppin
es10
0.00
100.
0010
0.00
100.
0010
0.00
CA
R2.
973.
053.
063.
013.
00Ilo
cos
Reg
ion
5.16
5.53
5.52
5.62
5.68
Cag
ayan
Val
ley
9.23
8.86
8.88
8.66
8.44
Cen
tral
Luz
on6.
877.
017.
447.
627.
78C
ALA
BA
RZO
N5.
765.
916.
026.
015.
91M
IMA
RO
PA4.
063.
994.
074.
104.
21B
icol
Reg
ion
8.46
8.86
9.45
9.75
10.0
3W
este
rn V
isay
as10
.49
10.6
511
.01
10.9
510
.82
Cen
tral
Vis
ayas
5.77
5.93
6.13
6.23
6.31
East
ern
Vis
ayas
9.91
9.62
8.24
8.18
8.02
Zam
boan
ga P
enin
sula
4.77
4.80
4.98
5.08
5.20
Nor
ther
n M
inda
nao
4.31
4.35
4.35
4.39
4.37
Dav
ao R
egio
n5.
625.
565.
715.
705.
64SO
CC
SKSA
RG
EN8.
128.
087.
807.
487.
36C
arag
a2.
812.
772.
802.
812.
78A
RM
M5.
685.
054.
524.
414.
44
AGRICULTURAL STRUCTURE AND RESOURCES
PHILIPPINE STATISTICS AUTHORITY
Chicken At the national level, chicken population growth slowed down to 1.32 percent in 2016. In this year, notable annual increments were observed in Eastern Visayas at 30.89 percent and the Bicol Region at 21.83 percent. Decreases in the number of chicken were noted in seven regions. ARMM reported the highest annual reduction at 8.64 percent.
On the average, the total chicken inventories from 2012 to 2016 expanded by 2.17 percent per year. Despite the up and down trend in the number of chicken over the five-year period, positive growth rates, on the average, were recorded in most regions. Significant average increments were posted in the Davao Region at 11.50 percent and the Bicol Region at 11.39 percent. Increasing chicken inventories throughout the reference years were observed in Central Luzon and MIMAROPA, averaging 5.41 percent and 3.51 percent per year, respectively. The decline was high in Eastern Visayas, which averaged 7.19 percent (Table 8a). The biggest shares in the country’s chicken population came from Central Luzon and CALABARZON. However, its corresponding shares in 2016 slid to 19.46 percent and 15.16 percent. Western Visayas and Northern Mindanao were other main contributors sharing around 10 percent each. CAR comprised the least share of 0.87 percent in the total chicken inventory (Table 8b).
Duck The number of ducks in the country indicated a higher increment in 2016 at 4.49 percent. Except for MIMAROPA, Eastern Visayas and Caraga, all the other regions had increasing duck population. SOCCSKSARGEN and Zamboanga Peninsula recovered from the previous year’s downtrend and came up with bigger annual increments at 12.51 percent and 10.23 percent, respectively, in 2016. A 10.24 percent gain was reported in Northern Mindanao. Eastern Visayas showed another downtrend and posted the biggest reduction at 12.99 percent in 2016.
5 12
Tab
le 5
aG
row
th r
ates
in n
um
ber
of
catt
le in
all
farm
s b
y re
gio
n, P
hili
pp
ines
, 201
2-20
16
(Gro
wth
rat
es in
per
cen
t)
12-1
313
-14
14-1
515
-16
AV
ERA
GE
2012
-201
6
Phili
ppin
es2,
553,
747
0.19
0.57
0.88
0.77
0.60
CA
R60
,364
-0.8
61.
693.
130.
851.
20Ilo
cos
Reg
ion
301,
578
2.13
-0.4
12.
201.
291.
30C
agay
an V
alle
y18
4,17
3-2
.77
2.10
0.70
1.12
0.29
Cen
tral
Luz
on19
2,99
72.
362.
153.
783.
522.
95
CA
LAB
AR
ZON
267,
663
0.65
2.26
1.95
1.32
1.55
MIM
AR
OPA
93,6
871.
700.
53-0
.66
1.08
0.66
Bic
ol R
egio
n 10
8,04
312
.34
5.53
6.60
5.24
7.43
Wes
tern
Vis
ayas
249,
446
0.44
-0.1
7-1
.39
-0.4
6-0
.40
Cen
tral
Vis
ayas
274,
265
-0.4
60.
72-0
.42
0.41
0.07
East
ern
Vis
ayas
21,5
658.
43-1
.66
-6.5
73.
851.
01Za
mbo
anga
Pen
insu
la11
3,06
8-7
.63
-1.5
4-1
.98
-2.1
9-3
.34
Nor
ther
n M
inda
nao
259,
759
-0.3
7-0
.74
-0.7
6-2
.95
-1.2
0
Dav
ao R
egio
n13
9,07
8-1
.53
0.89
0.77
1.74
0.47
SOC
CSK
SAR
GEN
197,
995
0.23
0.80
1.06
0.81
0.73
Car
aga
19,3
376.
71-0
.75
-2.6
7-1
.45
0.46
AR
MM
70,7
29-4
.71
-5.9
74.
503.
90-0
.57
REG
ION
2016
LEV
EL
(HEA
D)
GR
OW
TH R
ATE
S

AGRICULTURAL STRUCTURE AND RESOURCES
PHILIPPINE STATISTICS AUTHORITY
The total number of hogs improved annually by an average of 1.29 percent during the five-year period. At the regional level, up and down movement in hog inventory was commonly observed. However, the majority of the regions, on the average, exhibited positive growth rates. Uptrends throughout the reference years were maintained in Central Luzon and MIMAROPA, recording average gains at 9.77 percent and 2.55 percent, respectively. Meanwhile, the biggest reductions in hog population were noted in Eastern Visayas and ARMM, which averaged 12.95 percent and 12.43 percent, respectively (Table 6a). Throughout the years in review, Central Luzon and CALABARZON recorded the most number of hogs in the country. Respective shares rose to 17.93 percent and 13.34 percent in 2016. Western Visayas came next where share slid to 10.37 percent. In contrast, the least share was still noted in ARMM which further dropped to 0.47 percent (Table 6b).
Goat Total goat inventory continued its downtrend with a 0.30 percent reduction in 2016. In this year, decreasing numbers of goats were reported in many regions. Eastern Visayas showed the biggest decline at 4.44 percent followed by Ilocos Region at 4.13 percent. Seven regions exhibited increasing goat population in 2016. The biggest annual increment was noted in the Bicol Region at 6.77 percent.
Over the period 2012 to 2016, the national goat inventory contracted by an average of 0.35 percent per year. More regions recorded fluctuating trends. On the average, the majority of the regions posted negative growth rates. The highest average reduction at 15.32 percent was registered in Eastern Visayas which showed continuous downtrend over the five-year period. Similarly, yearly reduction in the number of goats was observed in the Davao Region averaging 4.31 percent. Meanwhile, a growing number of goats during the five-year period was reported in CALABARZON and the Bicol Region with corresponding average increments of 2.59 percent and 5.64 percent (Table 7a). The leading contributors of goats nationwide were Western and Central Visayas. In 2016, the share of Western Visayas was reduced to 14.09 percent while that of Central Visayas rose to 13.47 percent. Eastern Visayas recorded the smallest share which continuously declined to 0.94 percent in 2016 (Table 7b).
13 4
Tab
le 5
bP
erce
nta
ge d
istr
ibu
tio
n o
f n
um
ber
of
catt
le in
all
farm
s b
y re
gio
n,
Ph
ilip
pin
es, 2
012-
2016
REG
ION
2012
2013
2014
2015
2016
Phili
ppin
es10
0.00
100.
0010
0.00
100.
0010
0.00
CA
R2.
312.
292.
312.
362.
36Ilo
cos
Reg
ion
11.4
911
.71
11.6
011
.75
11.8
1C
agay
an V
alle
y7.
317.
097.
207.
197.
21C
entr
al L
uzon
6.89
7.04
7.15
7.36
7.56
CA
LAB
AR
ZON
10.1
010
.14
10.3
110
.42
10.4
8M
IMA
RO
PA3.
663.
723.
713.
663.
67B
icol
Reg
ion
3.26
3.65
3.83
4.05
4.23
Wes
tern
Vis
ayas
10.1
710
.19
10.1
29.
899.
77C
entr
al V
isay
as10
.97
10.9
010
.92
10.7
810
.74
East
ern
Vis
ayas
0.84
0.90
0.88
0.82
0.84
Zam
boan
ga P
enin
sula
5.20
4.80
4.69
4.56
4.43
Nor
ther
n M
inda
nao
10.9
410
.88
10.7
410
.56
10.1
7D
avao
Reg
ion
5.48
5.38
5.40
5.39
5.45
SOC
CSK
SAR
GEN
7.72
7.72
7.74
7.75
7.75
Car
aga
0.76
0.81
0.80
0.77
0.76
AR
MM
2.92
2.77
2.59
2.69
2.77
AGRICULTURAL STRUCTURE AND RESOURCES
PHILIPPINE STATISTICS AUTHORITY
Cattle The country’s cattle population sustained an uptrend which slowed down to 0.77 percent in 2016. Increasing cattle inventories in 2016 were noted in most regions. The Bicol Region registered the highest positive growth rates at 5.24 percent. Annual increment in the number of cattle at around 4.0 percent each was found in Central Luzon, Eastern Visayas and ARMM. Only four regions showed declining cattle population. High declines were registered in Northern Mindanao at 2.95 percent and Zamboanga Peninsula at 2.19 percent. From 2012 to 2016, the yearly expansion in the total number of cattle averaged 0.60 percent. Over these years, the majority of the regions exhibited fluctuating cattle inventories but mostly posted positive growth rates. The Bicol Region had the biggest increment in the number of cattle which grew yearly by an average of 7.43 percent. Likewise, year-on-year increases were noted in Central Luzon, CALABARZON and SOCCSKSARGEN averaging 2.95 percent, 1.55 percent and 0.73 percent, respectively. In contrast, continuously decreasing numbers of cattle were reported in Zamboanga Peninsula and Northern Mindanao. Correspondingly, yearly reductions averaged 3.34 percent and 1.20 percent (Table 5a). The Ilocos Region remained the top producer of cattle in the country. Its share went up to 11.81 percent in 2016. Other major producers which accounted for around 10.0 percent contribution each were Central Visayas, CALABARZON and Northern Mindanao. Less than one (1) percent of the national cattle inventory came from Eastern Visayas and Caraga (Table 5b). Hog The national hog population grew by almost 4.0 percent in 2016. Significant annual increment was registered in Central Luzon at 15.61 percent. This was followed by the Ilocos Region at 6.47 percent and CALABARZON at 5.78 percent. Downtrends in hog inventories in 2016 were observed in seven regions. ARMM suffered the biggest contraction at 12.11 percent
3 14
Tab
le 6
aG
row
th r
ates
in n
um
ber
of
ho
g in
all
farm
s b
y re
gio
n, P
hili
pp
ines
, 201
2-20
16
(Gro
wth
rat
es in
per
cent
)
12-1
313
-14
14-1
515
-16
AV
ERA
GE
2012
-201
6
Phili
ppin
es12
,478
,711
-0.1
7-0
.35
1.68
3.99
1.29
CA
R19
8,37
50.
84-1
.07
-6.3
21.
01-1
.38
Iloco
s R
egio
n55
5,39
7-0
.98
-1.5
00.
056.
471.
01C
agay
an V
alle
y42
2,62
6-0
.72
3.39
3.52
4.36
2.63
Cen
tral
Luz
on2,
237,
244
15.6
35.
722.
1115
.61
9.77
CA
LAB
AR
ZON
1,66
5,00
3-4
.78
-0.6
31.
305.
780.
42
MIM
AR
OPA
570,
543
0.44
3.50
3.58
2.68
2.55
Bic
ol R
egio
n 85
7,11
94.
927.
580.
58-0
.73
3.09
Wes
tern
Vis
ayas
1,29
3,66
11.
05-1
.24
-0.6
5-0
.16
-0.2
5C
entr
al V
isay
as95
6,69
2-3
.15
-3.3
34.
551.
80-0
.03
East
ern
Vis
ayas
322,
574
-19.
61-3
0.87
2.52
-3.8
4-1
2.95
Zam
boan
ga P
enin
sula
511,
284
2.49
-1.9
62.
97-1
.18
0.58
Nor
ther
n M
inda
nao
914,
639
0.51
-0.3
0-1
.60
3.39
0.50
Dav
ao R
egio
n87
9,10
2-5
.55
-0.9
15.
503.
660.
67SO
CC
SKSA
RG
EN78
8,41
3-1
.28
-0.6
52.
35-2
.56
-0.5
3
Car
aga
247,
270
0.15
-0.0
84.
43-1
.63
0.72
AR
MM
58,7
69-4
0.83
5.66
-2.4
2-1
2.11
-12.
43
REG
ION
2016
LEV
EL
(HEA
D)
GR
OW
TH R
ATE
S

AGRICULTURAL STRUCTURE AND RESOURCES
PHILIPPINE STATISTICS AUTHORITY
59.65 percent of the region’s irrigated areas. In CAR, about 28.85 percent of the irrigated lands were serviced by the private irrigation system. Meanwhile, a bigger proportion of irrigated areas in Ilocos Region at 29.03 percent sourced water from other government agencies assisted irrigation system (Table 3).
Inventory of Livestock and Poultry Livestock and poultry population forms part of agricultural holdings of the country. The performance of the livestock and poultry sector can be monitored through the inventory and distribution of the various types of animals and birds across regions.
Carabao Nationwide, carabao inventory continued to record another increase at 0.78 percent in 2016. Many regions exhibited increasing numbers of carabaos. The Bicol Region posted the biggest annual increment at 3.70 percent. This was followed by MIMAROPA at 3.51 percent and Zamboanga Peninsula at 3.11 percent. Seven regions reported declining carabao inventories. Cagayan Valley indicated the biggest reduction at 1.76 percent. Over the five-reference years, there was an average yearly decrease of 0.73 percent in the national carabao population. The majority of the regions reported negative growth rates. The highest decline was recorded in ARMM averaging 6.49 percent per year. Continuous reductions in the number of carabaos were observed in Cagayan Valley, Eastern Visayas, and SOCCKSARGEN. Among these regions, Eastern Visayas posted the biggest contraction, which averaged 5.64 percent. Increasing inventories over the years in review were sustained in the Bicol Region and Central Luzon with corresponding average gains of 3.58 percent and 2.41 percent (Table 4a). In 2016, Western Visayas maintained a higher but reduced share of 10.82 percent in the total carabao inventory. This was followed by the Bicol Region, whose share went up to 10.03 percent. Other main contributors were Cagayan Valley and Eastern Visayas with respective shares going down to 8.44 percent and 8.02 percent. On the other hand, the smallest share of 2.78 percent was reported in Caraga (Table 4b). Cattle
15 2
Tab
le 6
bP
erce
nta
ge d
istr
ibu
tio
n o
f n
um
ber
of
ho
g in
all
farm
s b
y re
gio
n,
Ph
ilip
pin
es, 2
012-
2016
REG
ION
2012
2013
2014
2015
2016
Phili
ppin
es10
0.00
100.
0010
0.00
100.
0010
0.00
CA
R1.
771.
791.
781.
641.
59Ilo
cos
Reg
ion
4.51
4.47
4.42
4.35
4.45
Cag
ayan
Val
ley
3.21
3.20
3.31
3.37
3.39
Cen
tral
Luz
on13
.07
15.1
416
.06
16.1
317
.93
CA
LAB
AR
ZON
13.8
413
.20
13.1
713
.12
13.3
4M
IMA
RO
PA4.
354.
384.
554.
634.
57B
icol
Reg
ion
6.41
6.74
7.27
7.20
6.87
Wes
tern
Vis
ayas
11.0
211
.15
11.0
510
.80
10.3
7C
entr
al V
isay
as8.
097.
857.
627.
837.
67Ea
ster
n V
isay
as4.
964.
002.
772.
802.
58Za
mbo
anga
Pen
insu
la4.
224.
334.
264.
314.
10N
orth
ern
Min
dana
o7.
567.
617.
627.
377.
33D
avao
Reg
ion
7.24
6.85
6.81
7.07
7.04
SOC
CSK
SAR
GEN
6.79
6.72
6.70
6.74
6.32
Car
aga
2.03
2.03
2.04
2.09
1.98
AR
MM
0.92
0.55
0.58
0.56
0.47

AGRICULTURAL STRUCTURE AND RESOURCES
PHILIPPINE STATISTICS AUTHORITY
1 16
Irrigation Development and Types of Irrigation System Indicators on irrigation development allow the measurement of the extent of enhancement in the use of agricultural lands in the country. Indicators are shown in terms of the rate of growth of irrigated land over the years and the types of irrigation system used. The country’s irrigated area in 2016 reached 1.86 million hectares. It grew yearly by an average of 3.38 percent during the period 2012 to 2016. At the regional level, the biggest yearly expansion of irrigated land was reported in MIMAROPA with an average growth rate of 7.80 percent. CALABARZON and Zamboanga Peninsula came next with average annual increases of 6.89 percent and 6.75 percent, respectively. An average expansion of around 2.0 percent in irrigated areas was noted in the majority of the regions, namely, CAR, Ilocos Region, Cagayan Valley, Central Luzon, Bicol Region, Western Visayas, Eastern Visayas and Davao Region (Table 1). The 2016 total irrigated land at 1.86 million hectares comprised 59.32 percent of the estimated irrigable areas of 3.13 million hectares. This irrigation development was 1.99 percentage points higher than the last year’s record of 57.33 percent. Most of the regions exhibited increasing irrigation development. Among regions, the biggest proportions of irrigation development were recorded in Central Visayas at 90.75 percent and CAR at 86.46 percent. About 63.63 percent to 78.19 percent were noted in Ilocos Region, Cagayan Valley, Central Luzon, CALABARZON, MIMAROPA, Western Visayas and Eastern Visayas. In contrast, the least proportion was still observed in ARMM at 30.07 percent in 2016 (Table 2). During the five-year reference period, the national irrigation system was the major supplier of water accounting for an average of 44.35 percent of the country’s irrigated lands. About 34.52 percent were sourced from the communal irrigation system and 11.22 percent from private irrigation system. The remaining 9.91 percent covered the irrigation provided by other government agencies. Across regions, the national irrigation system was the primary provider of water to Cagayan Valley, Central Luzon, Davao Region, SOCCSKSARGEN and ARMM as it supplied about 55 to 66 percent of the region’s irrigated farmlands. The communal irrigation system was dominantly used in Central Visayas, covering 59.65 percent of the region’s irrigated areas.
Tab
le 7
aG
row
th r
ates
in n
um
ber
of
goat
in a
ll fa
rms
by
regi
on
, Ph
ilip
pin
es, 2
012-
2016
(G
row
th r
ates
in p
erce
nt)
12-1
313
-14
14-1
515
-16
AV
ERA
GE
2012
-201
6
Phili
ppin
es3,
663,
060
-0.5
70.
04-0
.58
-0.3
0-0
.35
CA
R68
,287
1.17
-2.3
0-1
.72
-3.3
0-1
.54
Iloco
s R
egio
n40
6,32
10.
210.
99-0
.39
-4.1
3-0
.83
Cag
ayan
Val
ley
115,
533
0.93
1.83
-0.3
21.
170.
90C
entr
al L
uzon
351,
922
5.75
12.3
07.
81-2
.40
5.87
CA
LAB
AR
ZON
252,
275
1.24
3.19
3.75
2.16
2.59
MIM
AR
OPA
178,
143
0.80
-0.5
40.
901.
660.
70B
icol
Reg
ion
145,
460
1.56
7.57
6.68
6.77
5.64
Wes
tern
Vis
ayas
516,
075
-1.1
5-0
.61
-4.3
3-0
.60
-1.6
7C
entr
al V
isay
as49
3,41
5-1
.41
-0.5
2-0
.88
0.52
-0.5
7Ea
ster
n V
isay
as34
,514
-21.
14-2
1.80
-13.
89-4
.44
-15.
32Za
mbo
anga
Pen
insu
la12
0,07
62.
53-1
.45
1.17
2.22
1.12
Nor
ther
n M
inda
nao
236,
752
0.22
-3.3
2-0
.32
1.39
-0.5
1D
avao
Reg
ion
313,
428
-0.2
7-8
.31
-7.9
1-0
.77
-4.3
1SO
CC
SKSA
RG
EN22
9,89
9-4
.58
0.13
-0.9
4-0
.06
-1.3
6
Car
aga
53,1
554.
350.
910.
87-2
.21
0.98
AR
MM
147,
805
-7.4
31.
81-0
.95
-0.9
3-1
.87
REG
ION
2016
LEV
EL
(HEA
D)
GR
OW
TH R
ATE
S

AGRICULTURAL STRUCTURE AND RESOURCES
PHILIPPINE STATISTICS AUTHORITY
17
Tab
le 7
bP
erce
nta
ge d
istr
ibu
tio
n o
f n
um
ber
of
goat
in a
ll fa
rms
by
regi
on
,P
hili
pp
ines
, 201
2-20
16
REG
ION
2012
2013
2014
2015
2016
Phili
ppin
es10
0.00
100.
0010
0.00
100.
0010
0.00
CA
R1.
961.
991.
941.
921.
86Ilo
cos
Reg
ion
11.3
211
.41
11.5
111
.54
11.0
9C
agay
an V
alle
y3.
003.
053.
103.
113.
15C
entr
al L
uzon
7.58
8.06
9.05
9.81
9.61
CA
LAB
AR
ZON
6.13
6.24
6.44
6.72
6.89
MIM
AR
OPA
4.66
4.73
4.70
4.77
4.86
Bic
ol R
egio
n 3.
153.
213.
463.
713.
97W
este
rn V
isay
as14
.87
14.7
814
.68
14.1
314
.09
Cen
tral
Vis
ayas
13.5
913
.47
13.4
013
.36
13.4
7Ea
ster
n V
isay
as1.
831.
451.
130.
980.
94Za
mbo
anga
Pen
insu
la3.
093.
193.
143.
203.
28N
orth
ern
Min
dana
o6.
516.
566.
346.
366.
46D
avao
Reg
ion
10.0
910
.13
9.28
8.60
8.56
SOC
CSK
SAR
GEN
6.54
6.28
6.28
6.26
6.28
Car
aga
1.38
1.45
1.46
1.48
1.45
AR
MM
4.30
4.00
4.08
4.06
4.04

AGRICULTURAL STRUCTURE AND RESOURCES
PHILIPPINE STATISTICS AUTHORITY
18
Tab
le 8
aG
row
th r
ates
in n
um
ber
of
chic
ken
in a
ll fa
rms
by
regi
on
, Ph
ilip
pin
es, 2
012-
2016
(G
row
th r
ates
in p
erce
nt)
12-1
313
-14
14-1
515
-16
AV
ERA
GE
2012
-201
6
Phili
ppin
es17
8,79
2,80
71.
340.
775.
251.
322.
17
CA
R1,
564,
252
6.19
-6.1
44.
28-1
.19
0.79
Iloco
s R
egio
n11
,631
,311
16.6
8-6
.53
4.46
0.96
3.89
Cag
ayan
Val
ley
7,05
8,39
63.
93-1
8.15
7.39
3.59
-0.8
1C
entr
al L
uzon
34,7
88,2
086.
209.
985.
160.
305.
41C
ALA
BA
RZO
N27
,105
,692
-6.5
15.
79-2
.50
-0.5
3-0
.94
MIM
AR
OPA
4,12
5,67
00.
712.
679.
541.
133.
51B
icol
Reg
ion
9,99
2,14
6-3
.82
28.5
4-0
.98
21.8
311
.39
Wes
tern
Vis
ayas
19,5
93,8
965.
29-3
.11
3.82
-0.1
51.
46C
entr
al V
isay
as13
,037
,027
1.91
-8.1
88.
552.
341.
15Ea
ster
n V
isay
as2,
272,
502
-19.
48-4
7.35
7.18
30.8
9-7
.19
Zam
boan
ga P
enin
sula
5,64
3,35
50.
44-2
.77
8.55
2.75
2.24
Nor
ther
n M
inda
nao
18,9
55,9
39-0
.76
-3.6
60.
632.
10-0
.42
Dav
ao R
egio
n12
,589
,929
2.33
18.7
529
.43
-4.5
211
.50
SOC
CSK
SAR
GEN
6,58
5,73
82.
29-7
.61
11.8
0-3
.42
0.76
Car
aga
1,93
1,33
9-0
.15
7.33
16.9
5-6
.92
4.30
AR
MM
1,91
7,40
7-1
0.49
-7.7
34.
29-8
.64
-5.6
4
REG
ION
2016
LEV
EL
(BIR
DS)
GR
OW
TH R
ATE
S
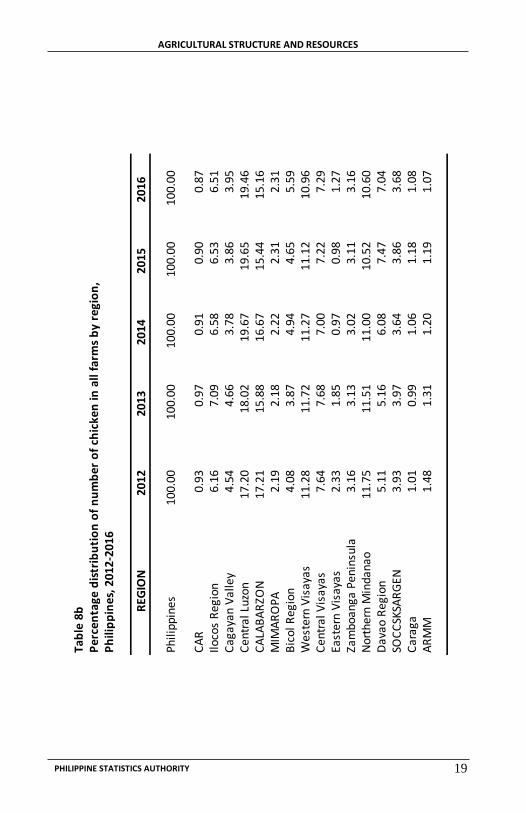
AGRICULTURAL STRUCTURE AND RESOURCES
PHILIPPINE STATISTICS AUTHORITY
TABLE OF CONTENTS
19
Tab
le 8
bP
erce
nta
ge d
istr
ibu
tio
n o
f n
um
ber
of
chic
ken
in a
ll fa
rms
by
regi
on
,
Ph
ilip
pin
es, 2
012-
2016
REG
ION
2012
2013
2014
2015
2016
Phili
ppin
es10
0.00
100.
0010
0.00
100.
0010
0.00
CA
R0.
930.
970.
910.
900.
87Ilo
cos
Reg
ion
6.16
7.09
6.58
6.53
6.51
Cag
ayan
Val
ley
4.54
4.66
3.78
3.86
3.95
Cen
tral
Luz
on17
.20
18.0
219
.67
19.6
519
.46
CA
LAB
AR
ZON
17.2
115
.88
16.6
715
.44
15.1
6M
IMA
RO
PA2.
192.
182.
222.
312.
31B
icol
Reg
ion
4.08
3.87
4.94
4.65
5.59
Wes
tern
Vis
ayas
11.2
811
.72
11.2
711
.12
10.9
6C
entr
al V
isay
as7.
647.
687.
007.
227.
29Ea
ster
n V
isay
as2.
331.
850.
970.
981.
27Za
mbo
anga
Pen
insu
la3.
163.
133.
023.
113.
16N
orth
ern
Min
dana
o11
.75
11.5
111
.00
10.5
210
.60
Dav
ao R
egio
n5.
115.
166.
087.
477.
04SO
CC
SKSA
RG
EN3.
933.
973.
643.
863.
68C
arag
a1.
010.
991.
061.
181.
08A
RM
M1.
481.
311.
201.
191.
07
Table 8a Growth rates in number of chicken in all farms by region,
Philippines, 2012-2016 18
Table 8b Percentage distribution of number of chicken in all farms
by region, Philippines, 2012-2016 19
Table 9a Growth rates in number of duck in all farms by region,Philippines, 2012-2016 20
Table 9b Percentage distribution of number of duck in all farms
by region, Philippines, 2012-2016 21

AGRICULTURAL STRUCTURE AND RESOURCES
PHILIPPINE STATISTICS AUTHORITY
TABLE OF CONTENTS
iii 20
Tab
le 9
aG
row
th r
ates
in n
um
ber
of
du
ck in
all
farm
s b
y re
gio
n, P
hili
pp
ines
, 201
2-20
16
(Gro
wth
rat
es in
per
cen
t)
12-1
313
-14
14-1
515
-16
AV
ERA
GE
2012
-201
6
Phili
ppin
es10
,518
,539
1.23
-2.4
61.
834.
491.
27
CA
R20
9,05
1-8
.54
-0.2
76.
601.
96-0
.06
Iloco
s R
egio
n39
6,91
4-0
.08
-1.6
95.
572.
911.
68C
agay
an V
alle
y1,
119,
997
3.02
-2.4
41.
460.
400.
61
Cen
tral
Luz
on3,
410,
575
10.0
04.
987.
876.
317.
29C
ALA
BA
RZO
N31
4,09
9-1
.84
-3.0
7-6
.02
8.31
-0.6
5M
IMA
RO
PA20
2,36
2-1
.69
3.70
3.27
-7.2
9-0
.50
Bic
ol R
egio
n 42
5,88
9-8
.89
5.15
7.88
8.97
3.28
Wes
tern
Vis
ayas
1,42
0,07
6-9
.05
-1.5
8-1
.87
1.88
-2.6
6C
entr
al V
isay
as14
4,69
8-6
.90
1.79
-3.6
90.
88-1
.98
East
ern
Vis
ayas
265,
452
-11.
15-5
.10
-4.8
6-1
2.99
-8.5
2Za
mbo
anga
Pen
insu
la16
5,97
712
.51
-2.6
4-5
.05
10.2
33.
76N
orth
ern
Min
dana
o43
1,30
4-0
.36
-1.7
83.
941.
180.
74
Dav
ao R
egio
n50
1,46
6-1
.90
2.17
4.00
10.2
43.
63SO
CC
SKSA
RG
EN1,
245,
859
1.13
-8.2
5-0
.63
12.5
11.
19C
arag
a12
2,04
44.
121.
62-3
.08
-6.7
8-1
.03
AR
MM
142,
776
16.1
2-5
0.73
-37.
861.
35-1
7.78
REG
ION
2016
LEV
EL
(BIR
DS)
GR
OW
TH R
ATE
SFOREWORD i
LIST OF TABLES iii
AGRICULTURAL STRUCTURE AND RESOURCES
Table 1 Total area irrigated by region, Philippines, 2012-2016 7
Table 2 Proportion of area irrigated to estimated irrigable areaby region, Philippines, 2012-2016 8
Table 3 Average percentage share of the total area irrigatedby type of irrigation system and by region,Philippines, 2012-2016 9
Table 4a Growth rates in number of carabao in all farmsby region, Philippines, 2012-2016 10
Table 4b Percentage distribution of number of carabao in allfarms by region, Philippines, 2012-2016 11
Table 5a Growth rates in number of cattle in all farms by region,Philippines, 2012-2016 12
Table 5b Percentage distribution of number of cattle in all farmsby region, Philippines, 2012-2016 13
Table 6a Growth rates in number of hog in all farms by region,Philippines, 2012-2016 14
Table 6b Percentage distribution of number of hog in all farmsby region, Philippines, 2012-2016 15
Table 7a Growth rates in number of goat in all farms by region,Philippines, 2012-2016 16
Table 7b Percentage distribution of number of goat in all farmsby region, Philippines, 2012-2016 17

AGRICULTURAL STRUCTURE AND RESOURCES
PHILIPPINE STATISTICS AUTHORITY
Table 7Producer's share in consumer peso, selected agricultural commodities,Philippines, 2009-2013(in percent)
COMM0DITIES 2009 2010 2011 2012 2013
Cereals Rice special 43 43 44 42 42 Corngrain yellow 52 58 60 58 53 Corngrain white 55 56 76 68 73
Commercial Coconut, matured 30 37 41 30 30
Vegetables & Legumes Garlic 48 47 59 47 41 Ginger 47 47 41 33 41 Onion Red Creole 53 47 61 67 51 Cabbage 32 22 34 29 29 Pechay, native 39 40 40 39 40 Ampalaya 51 46 48 50 49 Eggplant 46 43 49 46 43 Squash 44 41 42 42 39 Tomato 34 35 34 33 35 Carrots 40 25 38 33 33 Gabi (for ginataan) 42 42 36 35 34 White potato 49 43 44 43 48 Sweet potato 43 44 47 45 43 Habitchuelas 40 35 36 37 38 Mongo, green, labo 66 66 66 60 65 Peanut without shell, dry 82 82 77 80 78 Stringbeans 47 48 48 46 48
Fruits
Banana, Lakatan (green) 43 48 44 44 45 Calamansi 48 39 48 42 37 Mango, Carabao (green) 48 45 45 44 43 Papaya, Hawaiian 57 51 59 47 45 Pineapple, Hawaiian 39 36 42 45 42
21
Tab
le 9
bP
erce
nta
ge d
istr
ibu
tio
n o
f n
um
ber
of
du
ck in
all
farm
s b
y re
gio
n,
Ph
ilip
pin
es, 2
012-
2016
REG
ION
2012
2013
2014
2015
2016
Phili
ppin
es10
0.00
100.
0010
0.00
100.
0010
0.00
CA
R2.
111.
901.
952.
041.
99Ilo
cos
Reg
ion
3.72
3.67
3.70
3.83
3.77
Cag
ayan
Val
ley
10.9
311
.12
11.1
211
.08
10.6
5C
entr
al L
uzon
25.7
227
.95
30.0
931
.87
32.4
2C
ALA
BA
RZO
N3.
243.
143.
122.
882.
99M
IMA
RO
PA2.
072.
012.
142.
171.
92B
icol
Reg
ion
3.78
3.40
3.66
3.88
4.05
Wes
tern
Vis
ayas
15.8
514
.24
14.3
713
.85
13.5
0C
entr
al V
isay
as1.
571.
441.
511.
421.
38Ea
ster
n V
isay
as3.
803.
333.
243.
032.
52Za
mbo
anga
Pen
insu
la1.
451.
611.
601.
501.
58N
orth
ern
Min
dana
o4.
194.
124.
154.
234.
10D
avao
Reg
ion
4.36
4.22
4.42
4.52
4.77
SOC
CSK
SAR
GEN
12.0
011
.98
11.2
711
.00
11.8
4C
arag
a1.
281.
311.
371.
301.
16A
RM
M3.
964.
542.
291.
401.
36
AGRICULTURAL STRUCTURE AND RESOURCES
PHILIPPINE STATISTICS AUTHORITY
MODULES OF THE AGRICULTURAL INDICATORS SYSTEM
1. Output and Productivity
2. Agricultural Structures and Resources
3. Agricultural Credit
4. Food Sufficiency and Security
5. Food Consumption and Nutrition
6. Population and Labor Force
7. Redistribution of Land
8. Agricultural Exports and Imports
9. Gender-based Indicators of Labor and Employment in Agriculture 10. Economic Growth
11. Prices and Marketing of Agricultural Commodities
12. Inputs
i

AGRICULTURAL STRUCTURE AND RESOURCES
PHILIPPINE STATISTICS AUTHORITY
ISSN-2012-0435
REPORT No. 2017-2
PHILIPPINE STATISTICS AUTHORITY 16
th Floor. ETON Cyberpod Centris 3
EDSA. Corner Quezon Avenue, Quezon City
www.psa.gov.ph
Republic of the Philippines
Philippine Statistics Authority