Embed Size (px)
Citation preview
Philippine Country Report Asia Securities Forum
Bangkok, Thailand
5-7 November 2014
Philippine Association of Securities Brokers and Dealers, Inc.

Philippine Country Report
• PHL Economy
• PHL Financial Markets: Equities and Fixed-Income
• PHL Capital Markets Development Programme

Philippine Economy

Philippine GDP Growing At Robust Pace Of 6.0% In 1H14
• Major contributors:
• Services and Household
Consumption
• High-growth sectors:
• Manufacturing, Fixed Capital
and Exports
• Foreign direct investments rose 77% to $3.6b
• Laggards
• Capital Formation and
Government Consumption
Higher Growth Expected In 2H14: Official Forecast Of 6.5% To 7.5% For Full-year 2014
1

Philippine Inflation Gaining Momentum +4.4% YTD BSP Responds With Proactive Stance: Raised Rates By 50 bps To 4.0%
• August inflation +4.9%, upper end
• Food prices +8.7% YTD
• Manila truck ban
• BSP raised key policy interest rates by 25 bps in July and 25 bps in September
Within Target Range Of 3% To 5% In 2014; Will Ease To 2% To 4% In 2015
2

Philippine M3 Growth Towards Optimal Level +18.3% In July From Peak Of +38% In January
• M3 growth exceeded 30% for seven months from July 2013 to January 2014
• BSP drained excess liquidity through higher SDA rate (+50 bps to 2.5%) and bank reserve requirement (+2% to 20%)
• Loan growth improved to 20% from 16% at start of the year
Liquidity Growth To Stabilize Around 16% In The Second Half Of This Year
3

Philippine Banking System Adequately Capitalized And Compliant With Basel 3 Consolidated CAR Of 16.4%, Higher Than BSP Standard Of 12.5% And BIS Standard Of 8% In 2014 And 10.5% In 2019
Basel 3 Ratios BIS BSP
2014 Standard
2019 Standard
2014 Standard
Actual End-March
Minimum Common Equity Capital Ratio (CET 1)
4.0% 4.5% 6.0% 14.4%
Capital Conservation Buffer
- 2.5% 2.5% -
Minimum common equity plus capital conservation buffer
4.0% 7.0% 8.5% 14.4%
Minimum Tier 1 Capital 5.5% 6.0% 7.5% 14.6%
Minimum Total Capital (CAR) 8.0% 8.0% 10.0% 16.4%
Minimum Total Capital with Capital Conservation Buffer
8.0% 10.5% 12.5% 16.4%
NPL Levels Have Been Kept Low At 2.7% As Of June 2014 BSP Addressed Strong Real Estate Lending (+22% In 2013 and 30% In 2012): Monitoring System To Limit Real Estate Loans To 20% Of Loan Assets
4
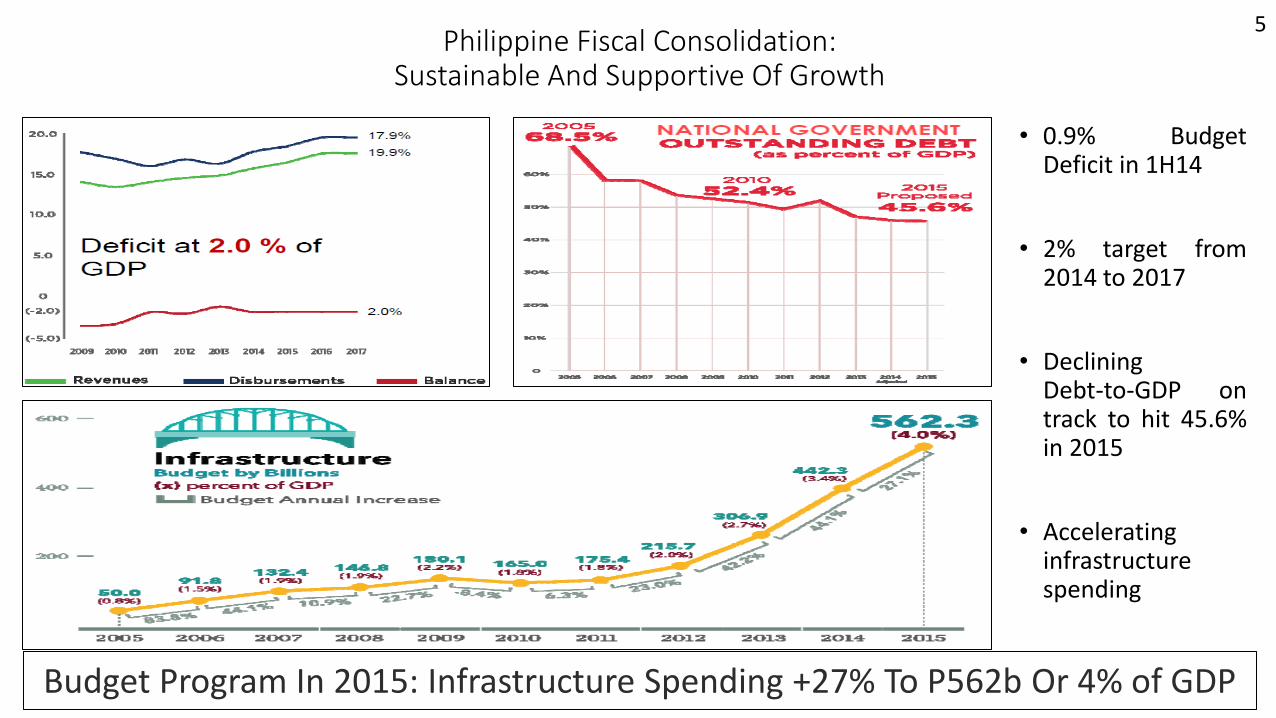
Philippine Fiscal Consolidation:
Sustainable And Supportive Of Growth
• 0.9% Budget Deficit in 1H14
• 2% target from 2014 to 2017
• Declining Debt-to-GDP on track to hit 45.6% in 2015
• Accelerating infrastructure spending
Budget Program In 2015: Infrastructure Spending +27% To P562b Or 4% of GDP
5

PPP: Centrepiece Policy For Infrastructure Of Aquino Regime 8 Public-Private Partnership (PPP) Projects Awarded, Totaling P127b
17 Projects Programmed For Roll-out In 2015, Worth P553b
6

Philippines’ Strong External Position CA Surplus $3.9b , GIR (11 months’ imports) And External Debt 21% of GDP
Current Account Balance (2012-2014)
Balance Of Payments Forecast In 2014: $1.1b Surplus
7

Philippine 2015 Economic Outlook Higher Growth Of 7% To 8% Driven By Post-typhoon Reconstruction, Government Spending and Exports
8
Lower Headline Inflation Of 2%-4% In 2015, Sustained BoP Surplus And Higher GIR

Relative Strength Of The Peso YTD USD Has Appreciated Against Its Trade-weighted Index By 5.4% While The Peso Has Lost 0.9% Against The USD
The Peso Has Also Gained By 4.5%
9

Philippine Sovereign Ratings Highest Rating S&P BBB/Stable, One-notch Above Investment Grade
10

Philippine Financial Markets

2010 2011 2012 2013 2014
PSEi Performance 37.6% 4.1% 32.3% 1.3% 18.3%
Ave. Daily Turnover P4.9b P5.7b P7.3b P10.5b P8.4b
Earnings Growth (%) 42.9% -11.0% 15.7% 6.4% 4.2%*
P/E Ratio (x) 13.5 15.8 18.1 17.2 19.6*
As of October 13, 2014
*2014 Forecast
Philippine Stock Market: PSEi Established New Record Of 7413 On Sept 25, +26% Performance
37.6% 4.1% 32.3% 1.3% 18.3%
7413 7403
11

Philippine Stock Market: Best-Performing From Start Of 2013, +20%
11.8%
-0.7%
15.0%
-4.2% -3.7%
18.3%
2.2%
18.8%
-6.8%
2.9%
-1.0%
0.7%
10.5%
1.3%
-0.4%
-6.7% -10.0%
-5.0%
0.0%
5.0%
10.0%
15.0%
20.0%
25.0%
China Hong Kong Indonesia Korea Malaysia Philippines Singapore Thailand
Asia Stock Market Performances
YTD Return 2013 Return
12

Philippine Stock Market: Highest Growth In Market Cap., Value T/O And Capital Raising (2010 to 2013)
Philippine Stock Market: Highest Growth In Market Capitalization, Value Turnover And Capital Raisings (2010-2013)
13

Philippine Stock Market: Market Capitalization +22% YTD To P12 Trillion Value T/O -23% Y-Y To P8.4b Per Day
14

Philippine Stock Market: Net Foreign Buying Of P56b YTD Foreign Transactions Accounted For 51% Of Total
15

Philippine Stock Market: Total Capital Raisings Up 142% to P120b
16

Philippine Yield Curve: Slight Upward Adjustment
17

Philippine Bonds: Best-Performing From Start Of 2013, +14% Performance
7.3%
2.7%
7.8% 6.6%
3.9% 3.8% 3.6%
5.9%
-2.8% -3.0%
-12.8%
1.4% 0.8%
8.8%
-3.8%
2.3%
-15.0%
-10.0%
-5.0%
0.0%
5.0%
10.0%
China Hong Kong Indonesia Korea Malaysia Philippines Singapore Thailand
Asia Bond Market Performances
YTD Return 2013 ReturniBoxx Asia Bond Fund Index Family Returns
18

Philippine Bond Market: PDEX Trading Volume Has Grown From P438b In 2005 To P5.7Trillion In 2013
PDEX Trading Volume -52% To P4 Trillion In 1H14
19

Corporate Bond Market: Record P115b New Listings In 1H14
20

Philippine Capital Markets Development Programme

Philippine Capital Markets Development Programme 21

Philippine Capital Markets Development Programme
22
Regulatory framework for REITs,
private pension (PERA) and index
futures