Embed Size (px)
Citation preview

PHILADELPHIA GAS WORKS (A Component Unit of the City of Philadelphia)
Basic Financial Statements and Supplementary Information
August 31, 2019 and 2018
(With Independent Auditors’ Reports Thereon)

PHILADELPHIA GAS WORKS (A Component Unit of the City of Philadelphia)
Table of Contents
Page
Independent Auditors’ Report 1
Management’s Discussion and Analysis, August 31, 2019 and 2018 (Unaudited) 3
Basic Financial Statements:
Balance Sheets, August 31, 2019 and 2018 17
Statements of Revenues and Expenses and Changes in Net Position, Years ended August 31, 2019 and 2018 19
Statements of Cash Flows, Years ended August 31, 2019 and 2018 20
Notes to Basic Financial Statements, August 31, 2019 and 2018 21
Required Supplementary Information:
Required Supplementary Information (Unaudited) – Schedule of Changes in Net Pension Liability and Related Ratios 86
Required Supplementary Information (Unaudited) – Schedule of Pension Contributions 87
Required Supplementary Information (Unaudited) – Schedule of Other Postemployment Benefits Funding Progress 88
Required Supplementary Information (Unaudited) – Schedule of OPEB Contributions 89
Independent Auditors’ Report
The Controller of the City of Philadelphia and Chairman and members of the Philadelphia Facilities Management Corporation Philadelphia, Pennsylvania:
We have audited the accompanying financial statements of Philadelphia Gas Works (the Company), a component unit of the City of Philadelphia, as of and for the years ended August 31, 2019 and 2018, and the related notes to the financial statements, which collectively comprise the Company’s basic financial statements as listed in the table of contents.
Management’s Responsibility for the Financial Statements
Management is responsible for the preparation and fair presentation of these financial statements in accordance with U.S. generally accepted accounting principles; this includes the design, implementation, and maintenance of internal control relevant to the preparation and fair presentation of financial statements that are free from material misstatement, whether due to fraud or error.
Auditors’ Responsibility
Our responsibility is to express an opinion on these financial statements based on our audits. We conducted our audits in accordance with auditing standards generally accepted in the United States of America. Those standards require that we plan and perform the audit to obtain reasonable assurance about whether the financial statements are free from material misstatement.
An audit involves performing procedures to obtain audit evidence about the amounts and disclosures in the financial statements. The procedures selected depend on the auditors’ judgment, including the assessment of the risks of material misstatement of the financial statements, whether due to fraud or error. In making those risk assessments, the auditor considers internal control relevant to the entity’s preparation and fair presentation of the financial statements in order to design audit procedures that are appropriate in the circumstances, but not for the purpose of expressing an opinion on the effectiveness of the entity’s internal control. Accordingly, we express no such opinion. An audit also includes evaluating the appropriateness of accounting policies used and the reasonableness of significant accounting estimates made by management, as well as evaluating the overall presentation of the financial statements.
We believe that the audit evidence we have obtained is sufficient and appropriate to provide a basis for our audit opinion.
Opinion
In our opinion, the financial statements referred to above present fairly, in all material respects, the financial position of Philadelphia Gas Works as of August 31, 2019 and 2018, and the changes in its financial position and its cash flows for the years then ended, in accordance with U.S. generally accepted accounting principles.
KPMG LLP is a Delaware limited liability partnership and the U.S. member firm of the KPMG network of independent member firms affiliated with KPMG International Cooperative (“KPMG International”), a Swiss entity.
KPMG LLP1601 Market StreetPhiladelphia, PA 19103-2499

2
Required Supplementary Information
U.S. generally accepted accounting principles require that the management’s discussion and analysis on pages 3-16 and the required supplementary information related to net pension and OPEB obligations as listed in thetable of contents on pages 86-89 to be presented to supplement the basic financial statements. Suchinformation, although not a part of the basic financial statements, is required by the Governmental AccountingStandards Board who considers it to be an essential part of financial reporting for placing the basic financialstatements in an appropriate operational, economic, or historical context. We have applied certain limitedprocedures to the required supplementary information in accordance with auditing standards generallyaccepted in the United States of America, which consisted of inquiries of management about the methods ofpreparing the information and comparing the information for consistency with management’s responses to ourinquiries, the basic financial statements, and other knowledge we obtained during our audits of the basicfinancial statements. We do not express an opinion or provide any assurance on the information because thelimited procedures do not provide us with sufficient evidence to express an opinion or provide any assurance.
Philadelphia, Pennsylvania December 20, 2019

PHILADELPHIA GAS WORKS (A Component Unit of the City of Philadelphia)
Management’s Discussion and Analysis August 31, 2019 and 2018
(Unaudited)
3 (Continued)
The narrative overview and analysis of the financial statements of Philadelphia Gas Works (the Company or PGW) for the years ended August 31, 2019 and 2018 have been prepared by PGW’s management. The information presented here is unaudited and should be read in conjunction with additional information contained in PGW’s financial statements.
Financial Highlights • The Fiscal Year (FY) 2019 weather reflected a 1.0% colder than normal winter. The FY 2019 period was
0.2% colder than the prior year but firm gas sales decreased by 1.3 Billion Cubic Feet (Bcf). The Weather Normalization Adjustment (WNA) Clause, which was in effect from October 2018 through May 2019, resulted in heating customers receiving charges totaling $1.6 million. The FY 2018 reflected a 0.6% warmer than normal winter. However, the FY 2018 period was 12.2% colder than the prior year and firm gas sales increased by 4.5 Bcf from the prior year. The WNA Clause, which was in effect from October 2017 through May 2018, resulted in heating customers receiving credits totaling $3.8 million.
• PGW achieved 24-month collection rates of 96.3% in FY 2019, 95.4% in FY 2018, and 96.5% in FY 2017. For FY 2019, the collection rate is calculated by dividing the total gas receipts collected from September 1, 2017 through August 31, 2019 by the total gas billings that were applied to PGW customers’ accounts from September 1, 2017 through August 31, 2019. The same methodology was utilized in FY 2018 and FY 2017.
• PGW continues to have various business initiatives that pertain to improving collections, productivity, and operational efficiencies throughout the Company. PGW, at the end of FY 2019, FY 2018, and FY 2017, had no Gas Works Revenue Capital Project Commercial Paper Notes (Capital Project Notes) or Gas Works Revenue Notes outstanding. The cash balances at the end of FY 2019 and FY 2018 were $124.1 million and $131.1 million, respectively. PGW had a cash balance of $88.5 million at the end of FY 2017.
• At December 05, 2019 and December 12, 2018, $120.0 million was available from the commercial paper program. The cash balance on December 05, 2019 and on December 12, 2018 was $80.3 million and $83.6 million, respectively.
• The Company’s FY 2020 Capital Budget was approved by the City Council of the City of Philadelphia in an amount not to exceed $127.7 million and funding was provided to continue the implementation of an 18-mile Cast Iron Main Replacement (CIMR) Program. The CIMR Program cost for FY 2020 is expected to be $29.0 million. The total six-year cost of the CIMR Program is forecasted to be $185.1 million.
• In FY 2018, the Company retrospectively adopted a new required Other Postemployment Benefit (OPEB) standard, Governmental Accounting Standards Board (GASB) Statement No. 75, Accounting and Financial Reporting for Postemployment Benefits Other Than Pensions (GASB 75), as of September 1, 2016. The adoption of this standard resulted in the following:
– Recognition of a net OPEB liability for the single-employer Philadelphia Gas Works OPEB Plan (OPEB Plan) of $350.4 million at August 31, 2017, which increased to $378.9 million at August 31, 2018, and increased to $336.1 million at August 31, 2019.
– Recognition of deferred inflows and outflows related to OPEB resulted in balances of $91.2 million and $81.0 million in deferred outflows and $69.9 million and $36.1 million of deferred inflows at August 31,

PHILADELPHIA GAS WORKS (A Component Unit of the City of Philadelphia)
Management’s Discussion and Analysis August 31, 2019 and 2018
(Unaudited)
4 (Continued)
2019 and 2018, respectively. These deferred inflows and outflows of resources are related to differences between actual and expected investment returns, assumption changes, demographic factors, differences between expected and actual experience, and contributions made after the measurement date. GASB 75 requires changes in expected versus actual investment returns to be amortized as OPEB expense over five years and actuarial assumption changes and experience differences to be amortized as OPEB expense over the average working lifetime of all OPEB Plan participants. The impact of this amortization over time will be increased volatility in annual amounts recognized as OPEB expense compared to amounts recognized under prior accounting standards.
– A decrease in OPEB expense previously reported for the year ended August 31, 2017 of $8.8 million was reflected in the Statements of Revenues and Expenses and Changes in Net Position as a decrease in administrative and general from $88.9 million and an increase in other postemployment benefits expense from $7.4 million to $28.1 million.
– OPEB expense was $28.4 million and $32.9 million for the year ended August 31, 2019 and August 31, 2018, respectively.
Overview of the Financial Statements The discussion and analysis are intended to serve as an introduction and overview of PGW’s basic financial statements. PGW’s financial statements comprise the following:
Financial statements provide both long-term and short-term information about PGW’s overall financial condition, results of operations, and cash flows.
The notes to basic financial statements provide additional information that is essential to a full understanding of the data presented in PGW’s financial statements. The notes can be found immediately following the basic financial statements.
The financial statements report information about PGW as a whole using accounting methods similar to those used by private sector business. The three statements presented are as follows:
The statements of revenues and expenses and changes in net position present revenues and expenses and their effects on the change in net position during the fiscal year. These changes in net position are recorded as soon as the underlying event giving rise to the change occurs, regardless of when cash is received or paid.
The balance sheets include all of PGW’s assets, liabilities, and deferred inflows and outflows of resources, with the difference between the assets and deferred outflows of resources and liabilities and deferred inflows of resources reported as net position. Over time, increases or decreases in net position are indicators of whether PGW’s financial position is improving or deteriorating.
The statements of cash flows provide relevant information about the cash receipts and cash payments of an enterprise during a period and the impact on PGW’s financial position.

PHILADELPHIA GAS WORKS (A Component Unit of the City of Philadelphia)
Management’s Discussion and Analysis August 31, 2019 and 2018
(Unaudited)
5 (Continued)
Condensed Statements of Revenues and Expenses and Changes in Net Position
(Thousands of U.S. dollars)
Years ended August 312019 2018 2017 (a)
Total gas revenues $ 664,084 628,254 588,414 Other revenues 20,644 19,245 17,797
Total operating revenues 684,728 647,499 606,211
Fuel expense 206,825 186,265 179,230 All other operating expenses 335,233 343,845 321,623
Total operating expenses 542,058 530,110 500,853
Operating income 142,670 117,389 105,358
Interest and other income 10,788 4,634 1,989 Total interest expense (39,596) (41,940) (41,008) Distribution to the City of Philadelphia (18,000) (18,000) (18,000)
Excess of revenues over expenses 95,862 62,083 48,339
Net position, beginning of year 111,700 49,617 1,278
Net position, end of year $ 207,562 111,700 49,617
(a) As restated as a result of the implementation of GASB 75
Operating Revenues
Operating revenues in FY 2019 were $684.7 million, an increase of $37.2 million, or 5.7%, from FY 2018. The increase resulted from higher natural gas sendout, which was approximately 1.1% higher in FY 2019 when compared to FY 2018 and from a higher Gas Cost Rate (GCR) driven by increased commodity prices. Operating revenues in FY 2018 were $647.5 million, an increase of $41.3 million, or 6.8%, from FY 2017. The increase resulted from higher natural gas sendout, which was approximately 9.7% higher in FY 2018 when compared to FY 2017, and a base rate increase approved by the Pennsylvania Public Utility Commission (PUC) in the Settlement Agreement which became effective December 1, 2017.
Total sales volumes, including gas transportation deliveries, in FY 2019 increased by 0.5 Bcf, or 0.7%, to 76.4 Bcf from the FY 2018 sales volumes of 75.9 Bcf. In FY 2019, firm gas sales of 43.2 Bcf were 1.3 Bcf or 2.9% lower than FY 2018 and interruptible gas sales approximated the FY 2018 level. The volume of natural gas transported for gas transportation customers increased by 2.3 Bcf to 33.0 Bcf from the 30.7 Bcf level experienced in FY 2018. Total sales volumes, including gas transportation deliveries, in FY 2018 increased by 7.2 Bcf, or 10.5%, to 75.9 Bcf from the FY 2017 sales volumes of 68.7 Bcf. In FY 2018, firm gas sales of

PHILADELPHIA GAS WORKS (A Component Unit of the City of Philadelphia)
Management’s Discussion and Analysis August 31, 2019 and 2018
(Unaudited)
6 (Continued)
44.5 Bcf were 4.5 Bcf or 11.4% higher than FY 2017 and interruptible gas sales approximated the FY 2017 level. The volume of natural gas transported for gas transportation customers increased by 2.0 Bcf to 30.7 Bcf from the 28.7 Bcf level experienced in FY 2017.
Total sales volumes, including gas transportation deliveries, in FY 2018 increased by 7.2 Bcf, or 10.5%, to 75.9 Bcf from the FY 2017 sales volumes of 68.7 Bcf. In FY 2018, firm gas sales of 44.5 Bcf were 4.5 Bcf or 11.4% higher than FY 2017 and interruptible gas sales approximated the FY 2017 level. The volume of natural gas transported for gas transportation customers increased by 2.0 Bcf to 30.7 Bcf from the 28.7 Bcf level experienced in FY 2017.
Provision for Uncollectible Accounts – The provision for uncollectible accounts in FY 2019 totaled $30.0 million, a decrease of $0.8 million or 2.6% from FY 2018. The provision for uncollectible accounts in FY 2018 totaled $30.8 million, an increase of $0.8 million or 2.7% from FY 2017. The decrease in the provision for uncollectible accounts in FY 2019 is mainly due to higher collection rates achieved in FY 2019. PGW is committed to continuing its collection efforts in an attempt to reduce outstanding delinquent account balances and to provide assistance to those customers who qualify for low-income grants and payment programs to help those customers maintain their gas service.
In FY 2019, the number of customers served by PGW increased from the previous year and was approximately 510,000 customers. The number of customers served by PGW at the end of FY 2018 and FY 2017 was approximately 508,000 and 505,000, respectively. There were approximately 25,000 Commercial accounts, reflecting no change from the previous two fiscal years. Industrial accounts were unchanged from the previous two fiscal years at approximately 700 customers. The number of residential accounts in FY 2019 increased to approximately 484,500 customers, an increase of 2,200 customers from the FY 2018 level, and 5,200 customers from the FY 2017 level.
Operating Expenses
Total operating expenses, including fuel costs, in FY 2019 were $542.1 million, an increase of $12.0 million or 2.3% from FY 2018. The increase for FY 2019 was mainly caused by increased natural gas utilization and increased depreciation expense. These increases were partially offset by decreased field operation expense, administrative and general, and amortization of the unfunded actuarially determined pension expense. Total operating expenses, including fuel costs, in FY 2018 were $530.1 million, an increase of $29.2 million or 5.8% from FY 2017. The increase for FY 2018 was mainly caused by increased natural gas utilization. These increases were partially offset by a decrease in the amortization of the unfunded actuarially determined pension expense.
Cost of Fuel – The cost of natural gas utilized increased by $20.5 million or 11.0% to $206.8 million in FY 2019 compared with $186.3 million in FY 2018. The average commodity price per Thousand Cubic Feet (Mcf) increased by $0.39 or $17.8 million, while the volume of gas utilized decreased by 1.1 Bcf, 2.3% or $3.0 million. The pipeline supplier refunds in FY 2019 and FY 2018 were less than $0.1 million but demand charges increased by $5.7 million compared to FY 2018.

PHILADELPHIA GAS WORKS (A Component Unit of the City of Philadelphia)
Management’s Discussion and Analysis August 31, 2019 and 2018
(Unaudited)
7 (Continued)
The cost of natural gas utilized increased by $7.1 million or 4.0% to $186.3 million in FY 2018 compared with $179.2 million in FY 2017. The average commodity price per Mcf approximated the FY 2017 average commodity price; however, the volume of natural gas utilized increased by 3.7 Bcf, 8.4% or $10.0 million. The pipeline supplier refunds in FY 2018 and FY 2017 were less than $0.1 million but demand charges increased by $2.9 million compared to FY 2017. The cost of fuel includes all commodity charges and demand charges net of pipeline refunds.
Variations in the cost of purchased gas are passed through to customers under the GCR provision of PGW’s rate schedules. Over recoveries or under recoveries of purchased gas costs are subtracted from or added to gas revenues and are included in other current assets or other current liabilities, thereby eliminating the effect that recovery of gas costs would otherwise have on net income.
The average natural gas commodity prices for utilized natural gas for FY 2019, FY 2018, and FY 2017 were $3.12, $2.73, and $2.73 per Mcf, respectively.
Other Operating Expenses – Expenditures for street operations, infrastructure improvements, and plant operations in FY 2019 were $99.9 million, an $8.8 million, or 8.1%, decrease from the FY 2018 total of $108.7 million. The decrease in FY 2019 was caused primarily by lower contract maintenance and material costs for distribution and field services. The FY 2018 total of $108.7 million was $12.9 million higher than the FY 2017 total of $95.8 million as a result of higher labor costs associated with the field operation departments.
Additionally, expenses of $99.9 million related to collection and account management, customer services, marketing, and the administrative area increased by $5.9 million or 6.3% in FY 2019 primarily due to higher administrative expenses. This category increased by $6.6 million in FY 2018 compared to FY 2017 primarily due to higher administrative expenses.
Pension expense decreased by $12.9 million or 29.9% to $30.3 million in FY 2019 as compared to FY 2018 due primarily to higher than anticipated earnings. Pension expense decreased by $11.6 million or 21.2% to $43.2 million in FY 2018 as compared to FY 2017 due to higher than anticipated earnings.
OPEB expense decreased by $4.5 million or 13.7% in FY 2019 as compared to FY 2018 primarily to higher than anticipated earnings. OPEB expense as determined in accordance with GASB 75 increased by $4.8 million, or 17.1%, in FY 2018 as compared to FY 2017. OPEB expense increased in FY 2018 primarily due to changes in the total OPEB liability related to assumption changes, actuarial experience recognized over the average working lifetime of the OPEB Plan’s participants, and the difference between projected and actual investment earnings recognized over a closed five-year period.
Net Depreciation Expense – Net depreciation expense increased by $11.7 million in FY 2019 compared with FY 2018. Net depreciation expense increased by $8.9 million in FY 2018 compared with FY 2017. The effective composite depreciation rates were 2.1% for FY 2019 and FY 2018 and 2.2% for FY 2017. Cost of removal is charged to expense as incurred.

PHILADELPHIA GAS WORKS (A Component Unit of the City of Philadelphia)
Management’s Discussion and Analysis August 31, 2019 and 2018
(Unaudited)
8 (Continued)
Interest and Other Income – Interest and other income in FY 2019 was $6.2 million higher than FY 2018, as a result of increased earnings on restricted and unrestricted fund balances. Interest and other income in FY 2018 was $2.6 million higher than FY 2017, as a result of increased earnings on higher restricted fund balances.
Interest Expense – Total interest expense was $39.6 million in FY 2019, a decrease of $2.3 million or 5.5% when compared with FY 2018. Interest on long-term debt was $2.3 million or 4.8% lower in FY 2019 when compared to 2018. Interest expense was lower in FY 2019 due to the normal amortization of long-term debt. Total interest expense was $41.9 million in FY 2018, an increase of $0.9 million or 2.2% when compared with FY 2017. Interest on long-term debt was $9.3 million or 23.8% higher in FY 2018 when compared to FY 2017 reflecting the full year effect of the issuance of the Fifteenth Series Bonds in August 2017. Offsetting this increase, other interest expense decreased by $4.7 million, primarily reflecting the amortization of the bond premium related to the Fifteenth Series Bonds. Also, a decrease in interest expense associated with PGW’s commercial paper program resulting from lower borrowing costs coupled with decreasing outstanding balances offset the increase. Other interest costs further decreased by $3.8 million due primarily to the reduction of expenses for losses on reacquired debt and other variable bond fees.
Excess of Revenues over Expenses – In FY 2019, the Company’s excess of revenues over expenses was $95.9 million, an increase of $33.8 million from FY 2018. This increase is primarily due to greater contribution margins of gas and lower pension and OPEB expenses. In FY 2018, the Company’s excess of revenues over expenses was $62.1 million, an increase of $13.8 million from FY 2017. This increase is primarily due to greater contribution margins resulting from a base rate increase approved by the PUC in the Settlement Agreement which became effective December 1, 2017.

PHILADELPHIA GAS WORKS (A Component Unit of the City of Philadelphia)
Management’s Discussion and Analysis August 31, 2019 and 2018
(Unaudited)
9 (Continued)
Condensed Balance Sheets
(Thousands of U.S. dollars)
Years ended August 31Assets 2019 2018 2017 (a)
Current assets:Accounts receivable (net of accumulated
provision for uncollectible accounts of$66,751, $66,327, and $65,124 for 2019,2018, and 2017, respectively) $ 85,989 82,611 82,028
Restricted investment funds 71,345 63,646 57,616 Cash and cash equivalents, cash designated
for capital expenditures, gas inventories,materials, and supplies and other currentassets 193,979 201,417 172,663
Total current assets 351,313 347,674 312,307
Noncurrent assets:Utility plant, net 1,451,470 1,403,956 1,338,115 Unamortized bond insurance costs 258 290 322 Capital improvement fund — 50,815 110,000 Sinking fund, revenue bonds 106,509 103,255 102,202 Other assets 43,156 40,650 41,311
Total noncurrent assets 1,601,393 1,598,966 1,591,950
Total assets 1,952,706 1,946,640 1,904,257
Deferred Outflows of Resources
Accumulated fair value of hedging derivatives 10,332 594 7,911 Unamortized losses on bond refunding 36,776 42,054 47,614 Deferred outflows related to pension 14,421 24,943 39,400 Deferred outflows related to OPEB 91,175 81,048 33,076
Total deferred outflows 152,704 148,639 128,001
Total assets and deferred outflowsof resources $ 2,105,410 2,095,279 2,032,258
(a) As restated as a result of the implementation of GASB 75.

PHILADELPHIA GAS WORKS (A Component Unit of the City of Philadelphia)
Management’s Discussion and Analysis August 31, 2019 and 2018
(Unaudited)
10 (Continued)
Condensed Balance Sheets
(Thousands of U.S. dollars)
Years ended August 31Net Position, Liabilities, and Deferred Inflows 2019 2018 2017 (a)
Net position:Net investment in capital assets $ 494,460 432,354 375,366 Restricted 109,220 105,901 104,818 Unrestricted (396,118) (426,555) (430,567)
Total net position 207,562 111,700 49,617
Noncurrent liabilities:
Long-term revenue bonds 999,474 1,062,763 1,125,473 Other noncurrent liabilities 65,482 55,889 65,686 Net pension liability 247,246 261,261 261,945 Net OPEB liability 336,079 378,888 350,356
Total noncurrent liabilities 1,648,281 1,758,801 1,803,460
Current liabilities:Current portion of revenue bonds 62,946 62,709 49,890 Other current liabilities 98,517 112,669 86,096
Total current liabilities 161,463 175,378 135,986
Deferred inflows:
Deferred inflows related to pension 18,230 13,266 12,275 Deferred inflows related to OPEB 69,874 36,134 30,920
Total deferred inflows 88,104 49,400 43,195
Total net position, liabilities, anddeferred inflows $ 2,105,410 2,095,279 2,032,258
(a) As restated as a result of the implementation of GASB 75.

PHILADELPHIA GAS WORKS (A Component Unit of the City of Philadelphia)
Management’s Discussion and Analysis August 31, 2019 and 2018
(Unaudited)
11 (Continued)
Assets
Accounts Receivable – In FY 2019, accounts receivable (net) of $86.0 million increased by $3.4 million or 4.1%, from FY 2018 due to higher gas revenue during FY 2019, which resulted from increased sales and a higher GCR driven by increased commodity prices. In FY 2018, accounts receivable (net) of $82.6 million increased by $0.6 million or 0.7%, from FY 2017 due to higher gas billings during FY 2018, which resulted from increased sales and higher commodity prices for natural gas. The accumulated provision for uncollectible accounts at August 31, 2019 reflects a balance of $66.8 million, an increase of $0.5 million, compared to the $66.3 million balance in FY 2018. The balance was $65.1 million in FY 2017. Net write-offs for FY 2019 were $28.6 million as compared to $29.6 million and $39.2 million in FY 2018 and FY 2017, respectively.
Cash and Cash Equivalents, Gas Inventories, Materials, and Supplies, and Other Current Assets – In FY 2019, cash and cash equivalents totaled $124.1 million, a decrease of $7.0 million from the FY 2018 total of $131.1 million. The balance was $88.5 million in FY 2017. In FY 2019, gas inventories, materials, and supplies totaled $51.7 million, a decrease of $0.7 million from the FY 2018 total of $52.4 million. In FY 2019, gas storage totaled $41.3 million, a decrease of $0.4 million or 0.9% when compared to FY 2018. The decrease in gas inventory reflects a decrease in the price per Mcf of gas stored in inventory. Actual volumes in storage as of August 31, 2019 were 14.5 Bcf, identical to the prior year. In FY 2018, gas inventories, materials, and supplies totaled $52.4 million, a decrease of $3.0 million from the FY 2017 total of $55.4 million. In FY 2018, gas storage totaled $41.7 million, a decrease of $4.3 million or 9.3% when compared to FY 2017. The decrease in gas inventory reflects a decrease in volume stored, offset by an increase in the price per Mcf. Actual volumes in storage as of August 31, 2018 were 14.5 Bcf, a decrease of 2.2 Bcf or 12.8% compared to the prior year. Other current assets totaled $18.1 million in FY 2019, an increase of $0.1 million from FY 2018. Other current assets totaled $18.0 million FY 2018, an increase of $10.7 million from FY 2017. The decrease in other current assets in FY 2018 is a result of a decrease in the deferred GCR.
Restricted Investment Funds – Restricted Investment Funds include the current portion of the Capital Improvement Fund and the Workers’ Compensation Escrow Fund. Restricted Investment Funds increased by $7.7 million in FY 2019 primarily due to the anticipated increase in the drawdown from the current portion of the Capital Improvement Fund in FY 2020. The balance of the current portion of the Capital Improvement Fund at August 31, 2019, 2018, and 2017 was $68.6 million, 61.0 million, and 55.0 million, respectively. On August 16, 2017, PGW deposited $190 million into the Capital Improvement Fund as proceeds from the sale of the City of Philadelphia Gas Works Revenue Bonds, Fifteenth Series. Subsequent to the deposit, PGW withdrew $45.0 million, $55.0 million, and $25.0 million to finance various capital initiatives in FY 2019, FY 2018, and FY 2017, respectively, and anticipates withdrawing $68.6 million in FY 2020. Pursuant to the Pennsylvania Department of Labor and Industry Bureau of Workers’ Compensation Self-Insurance policy, the Company has established and maintains a restricted trust account. As of August 31, 2019, 2018, and 2017, the trust account balances were $2.7 million, $2.6 million and $2.6 million, respectively.
Utility Plant and Other Noncurrent Assets – In FY 2019, noncurrent assets including utility plant, net, the long-term portion of the Capital Improvement Fund, the revenue bonds’ Sinking Fund, and unamortized bond insurance costs totaled $1,601.4 million, an increase of $2.4 million from FY 2018. In FY 2018, noncurrent assets including utility plant, net, the long-term portion of the Capital Improvement Fund, the revenue bonds’ Sinking Fund, and unamortized bond insurance costs totaled $1,599.0 million, an increase of $7.0 million from

PHILADELPHIA GAS WORKS (A Component Unit of the City of Philadelphia)
Management’s Discussion and Analysis August 31, 2019 and 2018
(Unaudited)
12 (Continued)
FY 2017. Utility plant, net, totaled $1,451.5 million in FY 2019, an increase of $47.5 million or 3.4% compared with the FY 2018 balance. Utility plant, net, totaled $1,404.0 million in FY 2018, an increase of $65.9 million or 4.9% compared with the FY 2017 balance. Capital expenditures for construction of distribution facilities, purchase of equipment, information technology enhancements, and other general improvements were $110.5 million in FY 2019 compared to $123.4 million in FY 2018 and $102.3 million in FY 2017. A portion of the proceeds from the sale of the Fifteenth Series Bonds was utilized to finance a portion of PGW’s ongoing Capital Improvement Fund. The major capital expenditures are associated with PGW’s gas supply infrastructure, namely, gas mains, and customer service lines, including capital expenditures for the Long-Term Infrastructure Improvement Plan. For additional information on the Company’s capital assets, see note 1(g) Utility Plant of the basic financial statements.
In early 2012, Act 11 was enacted by the Pennsylvania Legislature. Act 11 permitted public utilities to file a request with the PUC for the implementation of a Distribution System Improvement Charge (DSIC). A DSIC permits natural gas distribution companies to recover the costs related to main and service replacement not already recovered in base rates. This legislation provides utility companies with a supplemental recovery mechanism for costs related to incremental/accelerated distribution system repair, improvement, and replacement. Act 11 permits gas utilities to recover 5.0% of their nongas revenues via the recovery mechanism and permits greater percentage increases if approved by the PUC. The Company started billing customers a DSIC surcharge as of July 1, 2013. In FY 2019, the Company billed customers $35.6 million for the DSIC surcharge. In FY 2018, the Company billed customers $41.8 million for the DSIC surcharge. The DSIC surcharge is fully reconcilable on a calendar-year basis. For additional information, see note 1(h) Revenue Recognition of the basic financial statements.
Deferred Outflows of Resources Related to Hedging Derivatives and Bond Refunding – Deferred outflows of resources represent amounts that will result in a reduction of net position in a subsequent period. Deferred outflows of resources include the accumulated fair value of hedging derivatives that will be recognized in the statement of revenues and expenses, changes in net position upon termination of the hedging relationship, and unamortized losses on bond refunding. Deferred outflows of resources related to hedging derivatives and bond refunding increased $4.4 million in FY 2019 from the FY 2018 total of $42.7 million. Deferred outflows decreased $12.8 million in FY 2018 from the FY 2017 total of $55.5 million.
Deferred Outflows of Resources Related to Pension – Deferred outflows of resources represent amounts that will result in a reduction of net position in a subsequent period. Deferred outflows of resources include increases in the pension liability that will be amortized into pension expense in future periods. Deferred outflows of resources relating to pension decreased $10.5 million or 42.2% in FY 2019 from the FY 2018 total of $24.9 million. Deferred outflows of resources decreased $14.5 million or 36.8% in FY 2018 from the FY 2017 total of $39.4 million.
Deferred Outflows of Resources Related to OPEB – Deferred outflows of resources represent amounts that will result in a reduction of net position in a subsequent period. Deferred outflows of resources include increases in the OPEB liability that will be amortized into OPEB expense in future periods. Deferred outflows of resources relating to OPEB increased $10.2 million or 12.6% in FY 2019 from the FY 2018 total of $81.0 million. Deferred outflows increased $47.9 million in FY 2018 from the FY 2017 restated total of $33.1 million primarily due to the recognition of deferred outflows of resources related to OPEB due to the implementation of GASB 75.

PHILADELPHIA GAS WORKS (A Component Unit of the City of Philadelphia)
Management’s Discussion and Analysis August 31, 2019 and 2018
(Unaudited)
13 (Continued)
Liabilities
Long-Term Revenue Bonds – Long-term revenue bonds, including the current portion and unamortized discount and premium, totaled $1,062.4 million in FY 2019. This was $63.1 million less than the previous year primarily as a result of scheduled principal payments. This represents 83.7% of total capitalization in FY 2019. Long-term revenue bonds, including the current portion and unamortized discount and premium, totaled $1,125.5 million in FY 2018. This was $49.9 million less than the previous year primarily as a result of scheduled principal payments. Long-term revenue bonds, including the current portion and unamortized discount and premium, totaled $1,175.4 million in FY 2017. This was $249.0 million greater than the previous year primarily as a result of issuing the Fifteenth Series Bonds. Long-term debt represented 95.9% of total capitalization in FY 2017. For additional information, see note 8, Long-Term Debt and Other Liabilities of the basic financial statements.
Debt Service Coverage Ratio and Ratings – PGW has a mandatory debt service coverage ratio of 1.50 times debt service on both the 1975 and 1998 Ordinance Bonds. At August 31, 2019, only Senior 1998 Ordinance Bonds were outstanding. At August 31, 2019, debt service coverage on Senior 1998 Ordinance Bonds was 2.33 times, compared to 2.35 and 2.71 times at August 31, 2018 and 2017, respectively. PGW’s current bond ratings are “A3” from Moody’s Investors Service (Moody’s), “A” from Standard & Poor’s Rating Service (S&P), and “BBB+” from Fitch Ratings.
Current Portion of Revenue Bonds and Notes Payable – Pursuant to the provisions of the City of Philadelphia Note Ordinances, PGW may sell short-term notes to either support working capital requirements or pay the costs of certain capital projects and other project costs. PGW may issue short-term notes in a principal amount, which, together with interest, may not exceed $150.0 million outstanding to support working capital requirements. PGW may also sell additional short-term notes in an aggregate principal amount, which may not exceed $120.0 million outstanding at any time to pay the costs of certain capital projects and other project costs. As of December 1, 2017, all notes are supported by a Note Purchase and Credit Agreement and a security interest in PGW’s revenues. Prior to that, all notes were supported by two irrevocable letters of credit and a security interest in PGW’s revenues. The note purchase agreement supporting PGW’s combined commercial paper programs set the maximum level of outstanding notes plus interest at $120.0 million in FY 2019. The letters of credit supporting PGW’s combined commercial paper programs set the maximum level of outstanding notes plus interest at $120.0 million in FY 2018 and FY 2017. There were no Capital Project Notes or Gas Works Revenue Notes outstanding at August 31, 2019, FY 2018, or FY 2017.
Other Current Liabilities – In FY 2019, other current liabilities totaled $6.2 million, a decrease of $9.0 million from FY 2018, due to a change in the deferred GCR. In FY 2018, the total was $15.2 million and $6.0 million in FY 2017. In FY 2019, accounts payable totaled $67.5 million, a decrease of $5.1 million or 7.0% compared with FY 2018 primarily due to a decrease in unbilled natural gas costs. In FY 2018, accounts payable totaled $72.6 million, an increase of $17.7 million or 32.2% compared with FY 2017 primarily due to an increase in unbilled natural gas costs.
Other Noncurrent Liabilities – In FY 2019, other noncurrent liabilities totaled $65.5 million, an increase of $9.6 million compared to FY 2018. The increase in FY 2019 is primarily due to the change in the value of the interest rate swaps and pollution remediation liabilities. In FY 2018, other noncurrent liabilities totaled

PHILADELPHIA GAS WORKS (A Component Unit of the City of Philadelphia)
Management’s Discussion and Analysis August 31, 2019 and 2018
(Unaudited)
14 (Continued)
$55.9 million, a decrease of $9.8 million compared to FY 2017. The decrease in FY 2018 is primarily due to the change in the value of the interest rate swaps.
Net OPEB Liability – The net OPEB obligation was $336.1 million for the fiscal year ended August 31, 2019, a $42.8 million decrease from the $378.9 million obligation at August 31, 2018. The net OPEB obligation was $378.9 million for the fiscal year ended August 31, 2018, a $28.5 million increase from the $350.4 million obligation at August 31, 2017. The increase in FY 2018 and FY 2017 was caused by changes in assumptions.
Net Pension Liability – There was a decrease in the net pension liability of $14.1 million or 5.4% in FY 2019 as compared to FY 2018. The decrease in the net pension liability of $0.6 million or 0.2% in FY 2018 as compared to FY 2017 was primarily driven by higher than anticipated earnings in FY 2017.
Deferred Inflows of Resources Related to Pension – Deferred inflows of resources represent amounts that will result in an increase of net position in a subsequent period. Deferred inflows of resources represent the difference between actual and expected earnings on pension plan investments. The increase in deferred inflows of resources related to pension of $4.9 million in FY 2019 as compared to FY 2018 is primarily related to changes in investment performance in FY 2019. The increase in deferred inflows of resources related to pension of $1.0 million in FY 2018 as compared to FY 2017 is primarily related to changes in investment performance in FY 2018. There were $12.3 million in deferred inflows of resources related to pension at August 31, 2017.
Deferred Inflows of Resources Related to OPEB – Deferred inflows of resources represent amounts that will result in an increase of net position in a subsequent period. Deferred inflows of resources were recognized as a result of the implementation of GASB 75 and represent the difference between actual and expected earnings on OPEB plan investments. Deferred inflows of resources related to OPEB as of August 31, 2019 were $69.9 million as compared to $36.1 million as of August 31, 2018. The increase in deferred inflows of resources related to OPEB of $33.8 million or 93.6% between FY 2019 and FY 2018 is primarily driven by changes in investment performance. There were $30.9 million in deferred inflows of resources related to OPEB at August 31, 2017.
Net Position – In FY 2019, total net position totaled $207.6 million, an increase of $95.9 million compared to FY 2018. The increase in FY 2019 is due to an excess of revenues over expenses generated by PGW operations during FY 2019. In FY 2019, unrestricted net position totaled negative $396.1 million, an increase of $30.5 million compared to FY 2018. In FY 2018, total net position totaled $111.7 million, an increase of $62.1 million as compared to FY 2017. In FY 2018, unrestricted net position totaled negative $426.6 million, an increase of $4.0 million compared to FY 2017. This increase is primarily due to favorable changes in the Company’s net pension liability. Due to the long-term nature of the Company’s net pension and OPEB liability, the Company’s negative unrestricted net position is not indicative of its near-term liquidity.
Other Financial Factors Recent Rate Filings
On May 9, 2013, the PUC entered an order approving PGW’s DSIC. The DSIC permitted PGW to recover reasonable and prudent costs incurred to repair, improve, or replace certain eligible distribution property that is

PHILADELPHIA GAS WORKS (A Component Unit of the City of Philadelphia)
Management’s Discussion and Analysis August 31, 2019 and 2018
(Unaudited)
15 (Continued)
part of the utility’s distribution system, in an amount up to 5.0% of distribution revenues. On September 1, 2015, PGW proposed an increase in the DSIC from 5.0% to 7.5% of distribution revenues and to levelize and annualize the DSIC. The PUC issued an Order and Opinion granting PGW’s request to increase its DSIC to 7.5% on January 28, 2016 (January 28 Order). The increase, from $22.0 million to $33.0 million per year, will generate approximately $11.0 million in additional revenue to fund PGW’s accelerated pipeline replacement program. The January 28 Order also permits PGW to levelize and annualize DSIC recovery, which will provide PGW with more predictable cash flow and may help mitigate overcollections and undercollections. PGW’s increased DSIC charge of 7.5% became effective on February 1, 2016.
On July 6, 2016, the PUC issued an Order and Opinion that permitted PGW to recover an additional $11.4 million in DSIC undercollections for the year ended December 31, 2015, over the course of two years. This results in a temporary increase in the DSIC of an additional $5.7 million a year for two years, for a total DSIC rate of 8.84%. PGW implemented the temporary increase on October 1, 2016. This temporary increase terminated on September 30, 2018. PGW will consider the effectiveness of the accelerated CIMR Program funded by the DSIC surcharge, evaluate the effect of the DSIC on customers, and assess PGW’s ability to effectively implement the level of accelerated pipeline replacement associated with the 7.5% DSIC (or higher levels) prior to requesting an increase in the DSIC.
On February 27, 2017, PGW filed for an increase in its distribution base rates with the PUC. The filing sought a general rate increase calculated to produce $70.0 million, or 11.6%, in additional annual operating revenues based upon a ten-year normal weather assumption. The filing also requested to increase the fixed customer charge component, as well as the volumetric delivery charge component of base rates.
On July 21, 2017, PGW filed a Joint Petition for Partial Settlement (Settlement Agreement) of the matter for settlement of all but two issues in the case (neither of which directly concerned PGW’s revenue request). The Settlement Agreement provided PGW with a general rate increase of $42.0 million in annual operating revenues calculated using a twenty-year normal weather assumption. PGW has determined the estimated pro forma revenue impact from the change from ten-year normal weather (less Heating Degree Days (HDDs)) to twenty-year normal weather (more HDDs) is approximately an additional $17.0 million per year over the forecast period. Settlement agreements with reduced revenue requirements are typical in PUC base rate proceedings and are the product of compromise between the parties’ diverse interests. The PUC has indicated that settlement results are often preferable to those achieved at the conclusion of a fully litigated proceeding.
On November 8, 2017, the PUC entered its Order and Opinion in the case, which approved the Settlement Agreement without modification (and found in favor of PGW on the two nonsettled issues). Thereafter, PGW made its Compliance Tariff filing on November 14, 2017. The new rates approved by the PUC in the Settlement Agreement became effective on December 1, 2017.

PHILADELPHIA GAS WORKS (A Component Unit of the City of Philadelphia)
Management’s Discussion and Analysis August 31, 2019 and 2018
(Unaudited)
16
Refunding, Defeasance, and Redeeming of Debt On August 16, 2017, the City issued Gas Works Revenue Bonds, Fifteenth Series (1998 General Ordinance) in the par amount of $273.1 million. A portion of the proceeds from the sale of the Fifteenth Series Bonds were utilized to refund a portion of the Seventh Series Bonds and redeem the City’s outstanding Capital Project Notes. The Fifteenth Series Bonds also contained new money debt issued to finance a portion of PGW’s ongoing Capital Improvement Program, pay the costs of issuing the bonds, and provide a deposit to the Sinking Fund Reserve. The Fifteenth Series Bonds, with fixed interest rates that range from 2.0% to 5.0%, have maturity dates through 2047.
Upcoming Accounting Standards GASB Statement No. 84, Fiduciary Activities (GASB 84) establishes criteria for identifying fiduciary activities of all state and local governments. The focus of the criteria generally is on (1) whether a government is controlling the assets of the fiduciary activity and (2) the beneficiaries with whom a fiduciary relationship exists. Separate criteria are included to identify fiduciary component units and postemployment benefit arrangements that are fiduciary activities. An activity meeting the criteria should be reported in a fiduciary fund in the basic financial statements. Governments with activities meeting the criteria should present a statement of fiduciary net position and a statement of changes in fiduciary net position. This Statement describes four fiduciary funds that should be reported, if applicable: (1) pension (and other employee benefit) trust funds, (2) investment trust funds, (3) private-purpose trust funds, and (4) custodial funds. The requirements of this Statement will take effect for periods beginning after December 15, 2018 (the Company’s fiscal year ending August 31, 2020). The Company is currently evaluating the impact of GASB 84 on its financial statements, and anticipates that certain pension and other postemployment benefit arrangements will be reported under the standard as fiduciary funds.
GASB Statement No. 90, Majority Equity Interest – an amendment of GASB Statements No. 14 and No. 61, will take effect for periods beginning after December 15, 2018 (the Company’s fiscal year ended August 31, 2020). The primary objectives of GASB 90 are to provide a single method of reporting conduit debt obligations by issuers and eliminate diversity in practice associated with (1) commitments extended by issuers, (2) arrangements associated with conduit debt obligations, and (3) related note disclosures. GASB 90 defines a majority equity interest and specifies that a majority equity interest in a legally separate organization should be reported as an investment if a government’s holding of the equity interest meets the definition of an investment. The Company is currently evaluating the impact of GASB 90 on its financial statements, and anticipates that the adoption of this statement will not have a material impact on the financial statements.
Contacting the Company’s Financial Management This financial report is designed to provide the citizens of Philadelphia, customers, investors, and creditors with a general overview of PGW’s finances and to demonstrate PGW’s accountability for the money it receives. If you have questions pertaining to this report or need additional financial information, please contact Philadelphia Gas Works, 800 W. Montgomery Avenue, Philadelphia, PA 19122 or on the Web at www.pgworks.com.
17
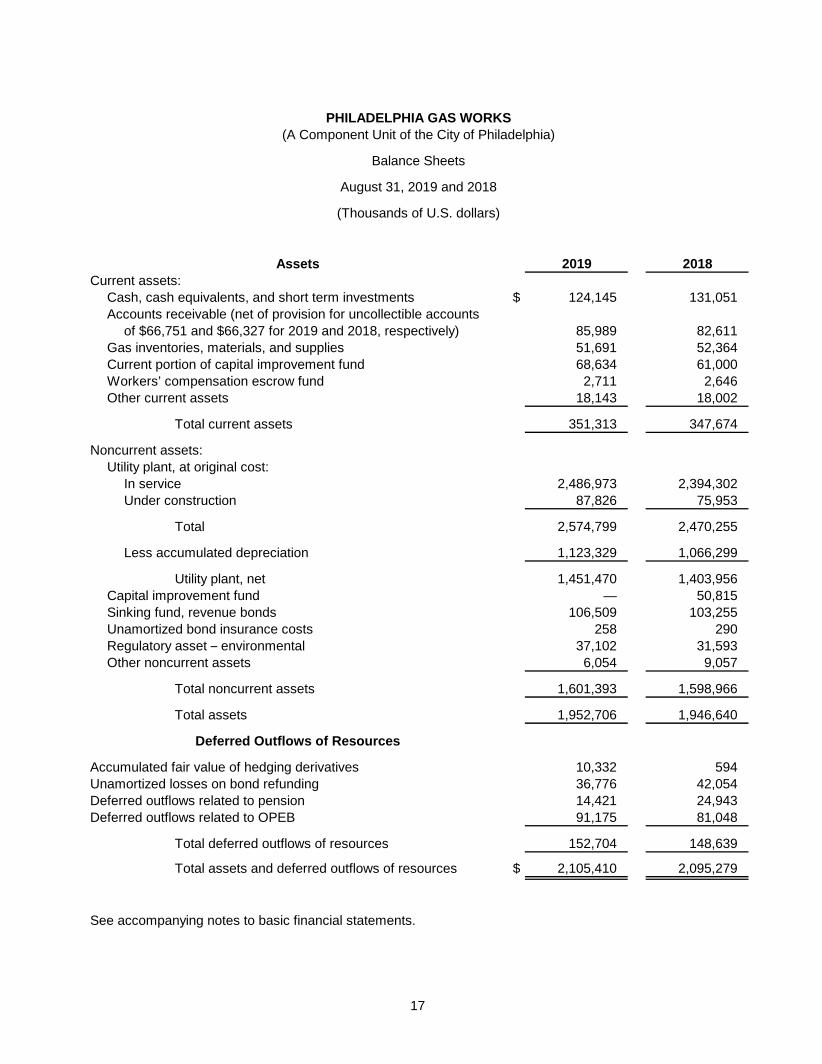
PHILADELPHIA GAS WORKS(A Component Unit of the City of Philadelphia)
Balance Sheets
August 31, 2019 and 2018
(Thousands of U.S. dollars)
Assets 2019 2018Current assets:
Cash, cash equivalents, and short term investments $ 124,145 131,051Accounts receivable (net of provision for uncollectible accounts
of $66,751 and $66,327 for 2019 and 2018, respectively) 85,989 82,611Gas inventories, materials, and supplies 51,691 52,364Current portion of capital improvement fund 68,634 61,000Workers’ compensation escrow fund 2,711 2,646Other current assets 18,143 18,002
Total current assets 351,313 347,674
Noncurrent assets:Utility plant, at original cost:
In service 2,486,973 2,394,302Under construction 87,826 75,953
Total 2,574,799 2,470,255
Less accumulated depreciation 1,123,329 1,066,299
Utility plant, net 1,451,470 1,403,956Capital improvement fund — 50,815Sinking fund, revenue bonds 106,509 103,255Unamortized bond insurance costs 258 290Regulatory asset – environmental 37,102 31,593Other noncurrent assets 6,054 9,057
Total noncurrent assets 1,601,393 1,598,966
Total assets 1,952,706 1,946,640
Deferred Outflows of Resources
Accumulated fair value of hedging derivatives 10,332 594Unamortized losses on bond refunding 36,776 42,054Deferred outflows related to pension 14,421 24,943Deferred outflows related to OPEB 91,175 81,048
Total deferred outflows of resources 152,704 148,639
Total assets and deferred outflows of resources $ 2,105,410 2,095,279
See accompanying notes to basic financial statements.
18
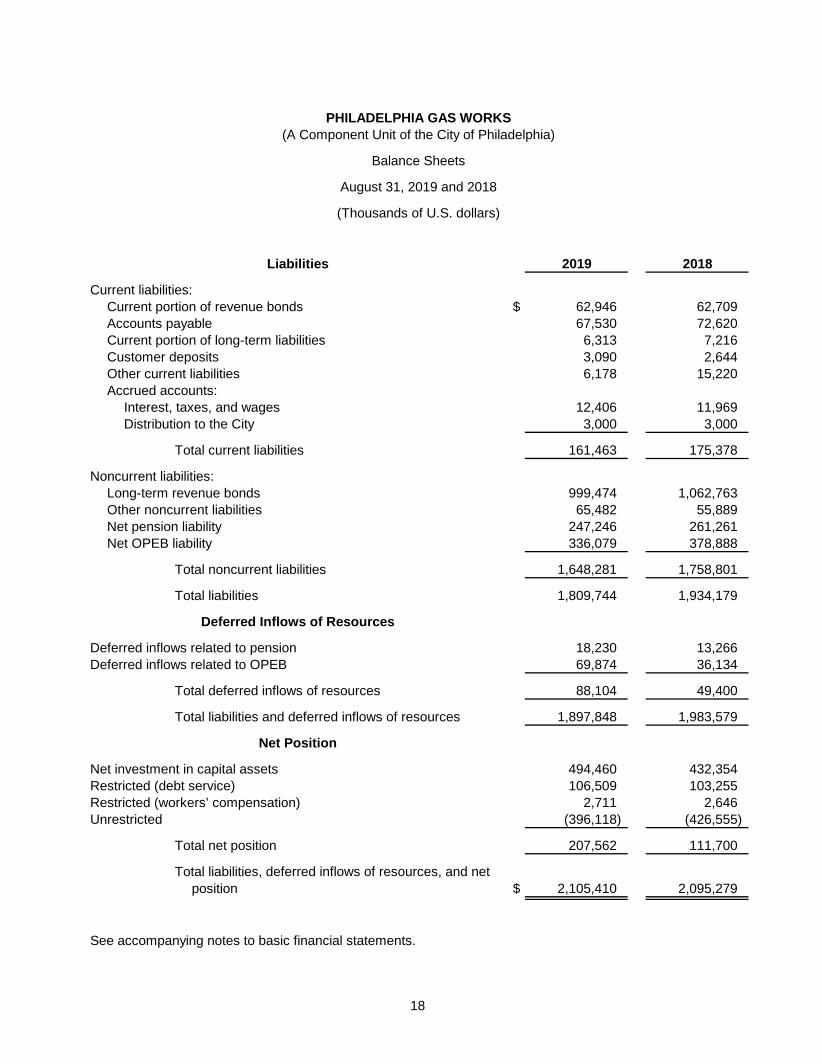
PHILADELPHIA GAS WORKS(A Component Unit of the City of Philadelphia)
Balance Sheets
August 31, 2019 and 2018
(Thousands of U.S. dollars)
Liabilities 2019 2018
Current liabilities:Current portion of revenue bonds $ 62,946 62,709Accounts payable 67,530 72,620Current portion of long-term liabilities 6,313 7,216Customer deposits 3,090 2,644Other current liabilities 6,178 15,220Accrued accounts:
Interest, taxes, and wages 12,406 11,969Distribution to the City 3,000 3,000
Total current liabilities 161,463 175,378
Noncurrent liabilities:Long-term revenue bonds 999,474 1,062,763Other noncurrent liabilities 65,482 55,889Net pension liability 247,246 261,261Net OPEB liability 336,079 378,888
Total noncurrent liabilities 1,648,281 1,758,801
Total liabilities 1,809,744 1,934,179
Deferred Inflows of Resources
Deferred inflows related to pension 18,230 13,266Deferred inflows related to OPEB 69,874 36,134
Total deferred inflows of resources 88,104 49,400
Total liabilities and deferred inflows of resources 1,897,848 1,983,579
Net Position
Net investment in capital assets 494,460 432,354Restricted (debt service) 106,509 103,255Restricted (workers’ compensation) 2,711 2,646Unrestricted (396,118) (426,555)
Total net position 207,562 111,700
Total liabilities, deferred inflows of resources, and netposition $ 2,105,410 2,095,279
See accompanying notes to basic financial statements.

19
PHILADELPHIA GAS WORKS(A Component Unit of the City of Philadelphia)
Statements of Revenues and Expenses and Changes in Net Position
Years ended August 31, 2019 and 2018
(Thousands of U.S. dollars)
2019 2018
Operating revenues:Gas revenues:
Nonheating $ 25,065 23,492Gas transport service 63,565 51,724Heating 605,437 583,864Provision for uncollectible accounts (29,983) (30,826)
Total gas revenues 664,084 628,254
Appliance and other revenues 7,908 8,121Other operating revenues 12,736 11,124
Total operating revenues 684,728 647,499
Operating expenses:Natural gas 206,825 186,265Gas processing 22,028 21,644Field operations 79,341 88,105Collection and account management 12,490 11,975Customer services 13,983 13,904Marketing 4,232 3,751Administrative and general 67,649 63,206Pensions 30,268 43,159Other postemployment benefits 28,351 32,889Taxes 8,705 8,758
Total operating expenses before depreciation 473,872 473,656
Depreciation 68,186 63,970Less depreciation expense included in operating expenses above — 7,516
Net depreciation 68,186 56,454
Total operating expenses 542,058 530,110
Operating income 142,670 117,389
Interest and other income 10,788 4,634
Income before interest expense 153,458 122,023
Interest expense:Long-term debt 46,136 48,351Other (5,245) (5,058) Allowance for funds used during construction (1,295) (1,353)
Total interest expense 39,596 41,940
Distribution to the City of Philadelphia (18,000) (18,000)
Excess of revenues over expenses 95,862 62,083
Net position, beginning of year 111,700 49,617
Net position, end of year $ 207,562 111,700
See accompanying notes to basic financial statements.

20
PHILADELPHIA GAS WORKS(A Component Unit of the City of Philadelphia)
Statements of Cash Flows
Years ended August 31, 2019 and 2018
(Thousands of U.S. dollars)
2019 2018
Cash flows from operating activities:Receipts from customers $ 686,300 686,200Payments to suppliers (397,440) (364,326) Payments to employees (127,621) (129,266) Claims paid (2,922) (3,223) Other receipts 15,100 22,900
Net cash provided by operating activities 173,417 212,285
Cash flows from noncapital financing activities:Income (loss) from nonutility operations 6,150 (602) Interest and fees (216) 98Distribution to the City of Philadelphia (18,000) (18,000)
Net cash used in noncapital financing activities (12,066) (18,504)
Cash flows from investment activitiesSinking fund reserve deposits (3,254) (1,053) Capital improvement fund deposits (1,819) (1,815) Capital improvement fund withdrawals 45,000 55,000Interest income / capital gain from short-term investments 1,964 1,410Interest income / capital gain on capital improvement fund 1,094 2,351Interest income / capital gain on sinking fund 1,579 1,476
Net cash provided by investment activities 44,564 57,369
Cash flows from capital and related financing activities:Purchases of capital assets (115,699) (122,297) Principal paid on long-term debt (51,820) (38,425) Interest paid on long-term debt (46,597) (49,265) Other 1,295 1,353
Net cash (used in) capital and related financing activities (212,821) (208,634)
Net (decrease) in cash and cash equivalents (6,906) 42,516
Cash and cash equivalents at beginning of year 131,051 88,535
Cash and cash equivalents at end of year $ 124,145 131,051
Reconciliation of operating income to net cash provided by operating activities:Operating income $ 142,670 117,389Adjustments to reconcile operating income to net cash provided by operating activities:
Depreciation and amortization expense 68,186 56,454Provision for uncollectible accounts 29,983 30,826Change in assets and liabilities:
Receivables, net (33,425) (31,439) Gas inventories, materials, and supplies 673 3,050Other current assets (141) 10,795Other assets and deferred outflows of resources (11,850) (25,618)Accounts payable (5,090) 17,699Customer deposits 446 (742) Other current liabilities (9,945) 10,603Accrued accounts 437 (987) Other liabilities, deferred inflows of resources, net OPEB and pension liabilities (8,527) 24,255
Net cash provided by operating activities $ 173,417 212,285
See accompanying notes to basic financial statements.

PHILADELPHIA GAS WORKS (A Component Unit of the City of Philadelphia)
Notes to Basic Financial Statements August 31, 2019 and 2018
21 (Continued)
(1) Summary of Significant Accounting Policies The accounting methods employed by the Philadelphia Gas Works (the Company or PGW) are in accordance with U.S. generally accepted accounting principles (U.S. GAAP) and are in conformity with City of Philadelphia (the City) reporting requirements.
As described in note 2, the Company is accounted for as a component unit of the City, and consequently follows accounting principles promulgated by the Governmental Accounting Standards Board (GASB) as they apply to business type activities. Under the Regulated Operations guidance within GASB Statement No. 62, Codification of Accounting and Financial Reporting Guidance Contained in Pre November 30, 1989 FASB and AICPA Pronouncements (GASB 62), assets or liabilities may be created by certain actions of regulatory bodies.
The principal accounting policies within this framework are described as follows:
(a) Regulation Prior to July 1, 2000, the Company was under the regulatory jurisdiction of the Philadelphia Gas Commission (PGC). The PGC had the authority to set the Company’s rates and tariffs. The PGC also approved the Company’s annual Operating Budget and reviewed the Company’s Capital Budget prior to approval by the City Council of the City (City Council).
Effective July 1, 2000, and pursuant to the passage of the Pennsylvania Natural Gas Choice and Competition Act (the Act), the Company came under the regulatory jurisdiction of the Pennsylvania Public Utility Commission (PUC). Under the PUC’s jurisdiction, the Company filed a restructuring plan on July 1, 2002, which among other things, provided for an unbundled tariff permitting customer choice of the commodity supplier by September 1, 2003. Under the Act, the PUC is required to follow the “same ratemaking methodology and requirements” that were previously applicable to the PGC when determining the Company’s revenue requirements and approving overall rates and charges. The PGC continues to approve the Company’s Operating Budget and review its Capital Budget. The Company’s Capital Budget must be approved by City Council.
The Company, as of September 1, 2003, is operating under its Restructuring Compliance Tariff. The Restructuring Compliance Tariff Rates are designed to maintain revenue neutrality and the Tariff Rules and Regulations are designed to comport with the Pennsylvania Public Utility Code. For additional information related to PGW’s tariff and base rates, see note 1(d) Base Rates.
(b) Operating Budget On February 15, 2019, PGW filed a proposed Fiscal Year (FY) 2020 Operating Budget with the PGC. The PGC Hearing Examiners conducted Informal Discovery (ID) sessions on May 9, 2019 and on May 15, 2019 and a public hearing was convened by the Hearing Examiners to address PGW’s Operating Budget on June 13, 2019. On July 11, 2019, a recommended decision was rendered by the Hearing Examiners, which proposed adjustments to the Operating Budget as filed. On August 13, 2019, the PGC approved, with adjustments, PGW’s FY 2020 Operating Budget. PGW filed a Compliance Budget with the PGC on August 26, 2019.

PHILADELPHIA GAS WORKS (A Component Unit of the City of Philadelphia)
Notes to Basic Financial Statements August 31, 2019 and 2018
22 (Continued)
On June 29, 2018, PGW filed a proposed FY 2019 Operating Budget with the PGC. The PGC Hearing Examiners conducted ID sessions in July and August 2018. On August 28, 2018, a public hearing was convened by the Hearing Examiners to address PGW’s Operating Budget. On September 28, 2018, a recommended decision was rendered by the Hearing Examiners, which proposed adjustments to the Operating Budget as filed. On November 14, 2018, the PGC approved, with adjustments, PGW’s FY 2019 Operating Budget. PGW filed a Compliance Budget with the PGC on October 26, 2018.
On July 14, 2017, PGW filed a modified FY 2018 Operating Budget with supporting documentation, reflecting updated estimated actual data for FY 2018. The original FY 2018 Operating Budget information was basically unchanged.
On May 26, 2017, PGW filed a proposed FY 2018 Operating Budget. After appropriate discovery and hearings, the PGC approved the FY 2018 Operating Budget on November 14, 2017.
(c) Capital Budget On January 2, 2019, PGW filed with the PGC its proposed FY 2020 Capital Budget in the amount of $149.7 million. After a due diligence review and related ID process in January 2019, a public hearing was held on February 20, 2019. The PGC’s review culminated in deliberations taken at a public meeting held on April 9, 2019 whereby the PGC endorsed an FY 2020 Capital Budget in an amount not to exceed $127.7 million. The endorsed budget was approved by City Council on June 20, 2019 and signed by the Mayor on June 24, 2019.
On May 8, 2019 and August 6, 2019, PGW submitted proposed reauthorization requests related to the Gas Processing Department to the PGC. The requests, upon approval, will increase the FY 2020 Capital Budget by $1.3 million or an amount not to exceed $129.0 million.
On November 1, 2018, PGW submitted proposed amendments that would increase the FY 2018 and FY 2019 Capital Budgets by $4.7 million and $4.7 million, respectively. The PGC’s review culminated in deliberations taken at a public meeting held on December 18, 2018 whereby the PGC endorsed an FY 2018 Capital Budget in an amount not to exceed $119.1 million and an FY 2019 Capital Budget in an amount not to exceed $139.2 million. The endorsed budgets were approved by City Council on June 20, 2019 and signed by the Mayor on July 24, 2019.
On January 2, 2018, PGW filed with the PGC its proposed FY 2019 Capital Budget in the amount of $155.9 million. After a due diligence review and related ID process in January and February 2018, a public hearing was held on February 27, 2018. The PGC’s review culminated in deliberations taken at a public meeting held on April 24, 2018 whereby the PGC endorsed an FY 2019 Capital Budget in an amount not to exceed $134.5 million. The endorsed budget was approved by City Council on June 14, 2018 and signed by the Mayor on June 21, 2018.
On January 3, 2017, PGW filed with the PGC its proposed FY 2018 Capital Budget in the amount of $115.1 million. After a due diligence review and related ID process in January and February 2017, a public hearing was held on February 21, 2017. The PGC’s review culminated in deliberations taken at a public meeting held on April 25, 2017 whereby the PGC endorsed an FY 2018 Capital Budget in an

PHILADELPHIA GAS WORKS (A Component Unit of the City of Philadelphia)
Notes to Basic Financial Statements August 31, 2019 and 2018
23 (Continued)
amount not to exceed $114.4 million. The endorsed budget was approved by City Council on June 15, 2017 and signed by the Mayor on June 21, 2017.
(d) Base Rates On February 27, 2017, PGW filed for an increase in its distribution base rates with the PUC. The filing sought a general rate increase calculated to produce $70.0 million, or 11.6%, in additional annual operating revenues based upon a ten year normal weather assumption. The filing also requested to increase the fixed monthly customer charge component, as well as the volumetric delivery charge component of base rates.
On July 21, 2017, PGW filed a Joint Petition for Partial Settlement (Settlement Agreement) of the matter for settlement of all but two issues in the case (neither of which directly concerned PGW’s revenue request). The Settlement Agreement provided PGW with a general rate increase of $42.0 million in annual operating revenues calculated using a twenty year normal weather assumption. PGW has determined the estimated pro forma revenue impact from the change from ten year normal weather (less Heating Degree Days (HDDs)) to twenty year normal weather (more HDDs) is approximately an additional $17.0 million per year over the forecast period. Settlement agreements with reduced revenue requirements are typical in PUC base rate proceedings and are the product of compromise between the parties’ diverse interests. The PUC has indicated that settlement results are often preferable to those achieved at the conclusion of a fully litigated proceeding.
On November 8, 2017, the PUC entered its Order and Opinion in the case, which approved the Settlement Agreement without modification and found in favor of PGW on the two nonsettled issues. Thereafter, PGW made its Compliance Tariff filing on November 14, 2017. The new rates approved by the Settlement Agreement became effective on December 1, 2017.
In FY 2015, the PUC approved the Company’s Gas Cost Rate (GCR) settlement petition, which included a provision allowing for the continued recovery of PGW’s Other Postemployment Benefits (OPEB) Rider. The OPEB recovery remains at $16.0 million annually. PGW continues to deposit this $16.0 million plus an additional $2.5 million annual contribution into the OPEB Trust for an annual total of $18.5 million. Additionally, PGW’s petition to continue the Demand Side Management Program was decided by the PUC in November 2016 and was revised and approved.
On December 18, 2009, PGW submitted a base rate filing with the PUC (1) to maintain the $60.0 million base rate increase that the PUC granted in 2008 and (2) to fund PGW’s OPEB liability in the amount of $42.5 million. PGW also moved to consolidate the Company’s Demand Side Management Program, an energy efficiency and conservation plan, into the base rate filing. On May 19, 2010, PGW, along with all active parties to the proceeding, submitted a Petition for Proposed Settlement of the proceeding (the Settlement) and the PUC approved the Settlement on July 29, 2010. Under the Settlement, PGW was permitted to maintain virtually all of the extraordinary base rate relief, received an incremental rate increase of $16.0 million annually related to OPEB, and was required to fund $18.5 million of the OPEB liability in each of the fiscal years 2011 through 2015. The new rates were effective September 1, 2010. The Settlement also permitted the implementation of the Demand Side Management Program.

PHILADELPHIA GAS WORKS (A Component Unit of the City of Philadelphia)
Notes to Basic Financial Statements August 31, 2019 and 2018
24 (Continued)
(e) Weather Normalization Adjustment Clause The Weather Normalization Adjustment (WNA) Clause was approved by PUC Order dated August 8, 2002. The purpose of the WNA Clause is to neutralize the impact of weather on the Company’s revenues. This allows the Company to achieve the recovery of appropriate costs as authorized by the PUC. The WNA Clause results in neither a rate increase nor a rate decrease, but acts as a billing adjustment. The main benefits of the WNA Clause are the stabilization of cash flow and the reduction of the need for short-term borrowing from year to year. The WNA Clause is applied to customer invoices rendered during the period of October 1 through May 31 of each year for each billing cycle. The adjustment for the year ended August 31, 2019 was an increase in billings of $1.6 million. The WNA Clause resulted in a decrease in billings of $3.8 million for the year ended August 31, 2018.
(f) Gas Cost Rate The Company’s single greatest operating expense is the cost of natural gas. The rate charged to the Company’s customers to recover these costs is called the GCR. The GCR reflects the increases or decreases in natural gas costs and other applicable GCR costs. This GCR mechanism provides the flexibility to rapidly reflect current conditions without the time delay inherent in full base rate alteration. The intent is to achieve an annual balance between the costs incurred for fuel and their pass through to customers.
At the end of the fiscal year, costs recovered through the GCR and surcharges are compared to the actual cost of fuel and other applicable costs. Customers are then credited or charged for the over recovery or under recovery of costs. The GCR and surcharges charge/credit may be updated quarterly or in the subsequent fiscal year to reflect the under recovery or over recovery. Changes in the GCR impact the reported amounts of gas revenues but do not affect operating income or net income because they are passed through to the customer without markup. At August 31, 2019, approximately $2.3 million was recorded in other current assets for the under recovery of the GCR and surcharges. At August 31, 2018, approximately $9.2 million was recorded in other current liabilities for the over recovery of the GCR and surcharges. The GCR comprises the purchased gas costs plus the gas adjustment charge minus the interruptible revenue credit.

PHILADELPHIA GAS WORKS (A Component Unit of the City of Philadelphia)
Notes to Basic Financial Statements August 31, 2019 and 2018
25 (Continued)
GCR Effective Dates and Rates
(Amounts in U.S. dollars)
GCR rateEffective date per Mcf* Change
December 1, 2019 $ 4.7175 0.1145September 1, 2019 4.6030 0.3306June 1, 2019 4.2724 (0.6055)March 1, 2019 4.8779 0.4056December 1, 2018 4.4723 0.6090September 1, 2018 3.8633 0.2423June 1, 2018 3.6210 (0.2647)March 1, 2018 3.8857 (0.8056)December 1, 2017 4.6913 0.5390September 1, 2017 4.1523 (0.4463)
* Mcf – thousand cubic feet
(g) Utility Plant Utility plant is stated at original cost. The cost of additions, replacements, and betterments of units of property is capitalized and included in the utility plant accounts. The cost of property sold or retired is removed from the utility plant accounts and charged to accumulated depreciation. Normal repairs, maintenance, the cost of minor property items, and expenses associated with retirements are charged to operating expenses as incurred.
In a previous rate order, the PGC disallowed the accrual of the net negative salvage component in depreciation. Cost of removal in the amounts of $5.7 million and $6.4 million was charged to expense as incurred in FY 2019 and FY 2018, respectively, and is included in depreciation expense in the statements of revenues and expenses and changes in net position. Depreciation is calculated on an asset-by-asset basis on the estimated useful lives of plant and equipment on a straight-line method. The composite rate for both FY 2019 and FY 2018 was 2.1%. The composite rates are supported by a depreciation study of utility plant as of August 2014. The effective composite depreciation rates, as a percentage of cost, for FY 2019 were as follows:
Production plant 1.65 %Transmission, distribution, and storage 2.00General plant 3.26
The most recent depreciation study was completed in FY 2015 for the plant activity subsequent to the last depreciation study and through FY 2014. It is anticipated that PGW will complete the next depreciation study in FY 2020 for the plant activity subsequent to the last depreciation study and through FY 2019.

PHILADELPHIA GAS WORKS (A Component Unit of the City of Philadelphia)
Notes to Basic Financial Statements August 31, 2019 and 2018
26 (Continued)
Allowance for Funds Used During Construction (AFUDC) is an estimate of the cost of funds used for construction purposes. The AFUDC, as calculated on borrowed funds, reduces interest expense. The AFUDC rate applied to construction work in progress was 4.80% and 4.59% in FY 2019 and FY 2018, respectively.
The following is a summary of utility plant activity for the fiscal years ended August 31, 2019 and 2018 (thousands of U.S. dollars):
August 31, 2019Beginning Additions Retirements Endingbalance and transfers and transfers balance
Capital assets not being depreciated:Land $ 5,595 — — 5,595 Under construction 75,953 110,543 (98,670) 87,826
Total capital assets notbeing depreciated 81,548 110,543 (98,670) 93,421
Other capital assets:Distribution and collection systems 1,846,188 84,660 (5,630) 1,925,218 Buildings and equipment 542,519 14,012 (371) 556,160
Total other capital assets 2,388,707 98,672 (6,001) 2,481,378
Less accumulate depreciation for:Distribution and collection systems (863,262) (38,438) (3,690) (905,390) Buildings and equipment (203,037) (14,034) (868) (217,939)
Total accumulateddepreciation (1,066,299) (52,472) (4,558) (1,123,329)
Utility plant, net $ 1,403,956 156,743 (109,229) 1,451,470
* Cost of removal of approximately $5.7 million was charged to expense as incurred in FY 2019 and is not included in accumulated depreciation.
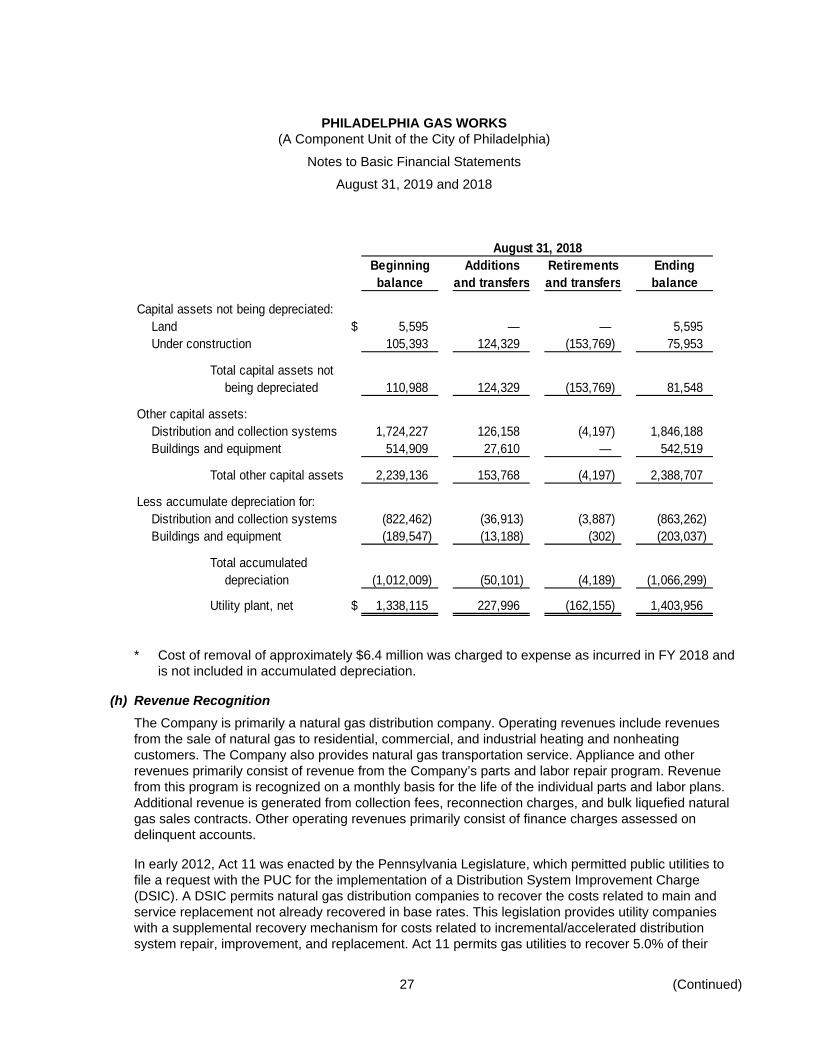
PHILADELPHIA GAS WORKS (A Component Unit of the City of Philadelphia)
Notes to Basic Financial Statements August 31, 2019 and 2018
27 (Continued)
August 31, 2018Beginning Additions Retirements Endingbalance and transfers and transfers balance
Capital assets not being depreciated:Land $ 5,595 — — 5,595 Under construction 105,393 124,329 (153,769) 75,953
Total capital assets notbeing depreciated 110,988 124,329 (153,769) 81,548
Other capital assets:Distribution and collection systems 1,724,227 126,158 (4,197) 1,846,188 Buildings and equipment 514,909 27,610 — 542,519
Total other capital assets 2,239,136 153,768 (4,197) 2,388,707
Less accumulate depreciation for:Distribution and collection systems (822,462) (36,913) (3,887) (863,262) Buildings and equipment (189,547) (13,188) (302) (203,037)
Total accumulateddepreciation (1,012,009) (50,101) (4,189) (1,066,299)
Utility plant, net $ 1,338,115 227,996 (162,155) 1,403,956
* Cost of removal of approximately $6.4 million was charged to expense as incurred in FY 2018 and is not included in accumulated depreciation.
(h) Revenue Recognition The Company is primarily a natural gas distribution company. Operating revenues include revenues from the sale of natural gas to residential, commercial, and industrial heating and nonheating customers. The Company also provides natural gas transportation service. Appliance and other revenues primarily consist of revenue from the Company’s parts and labor repair program. Revenue from this program is recognized on a monthly basis for the life of the individual parts and labor plans. Additional revenue is generated from collection fees, reconnection charges, and bulk liquefied natural gas sales contracts. Other operating revenues primarily consist of finance charges assessed on delinquent accounts.
In early 2012, Act 11 was enacted by the Pennsylvania Legislature, which permitted public utilities to file a request with the PUC for the implementation of a Distribution System Improvement Charge (DSIC). A DSIC permits natural gas distribution companies to recover the costs related to main and service replacement not already recovered in base rates. This legislation provides utility companies with a supplemental recovery mechanism for costs related to incremental/accelerated distribution system repair, improvement, and replacement. Act 11 permits gas utilities to recover 5.0% of their

PHILADELPHIA GAS WORKS (A Component Unit of the City of Philadelphia)
Notes to Basic Financial Statements August 31, 2019 and 2018
28 (Continued)
nongas revenues via the recovery mechanism and permits greater percentage increases if the PUC approves. The Company started billing customers a DSIC surcharge as of July 1, 2013. In FY 2019, the Company billed customers $35.6 million for the DSIC surcharge. In FY 2018, the Company billed customers $41.8 million for the DSIC surcharge. The DSIC surcharge is fully reconcilable on a calendar year basis and at the fiscal year end; the over billed or under billed amount is recorded as an adjustment to revenue.
The Company bills customers for the cost of natural gas and the related costs incurred through the processing, distribution, and delivery of natural gas to residential, commercial, and industrial heating and nonheating customers.
Revenues include amounts related to gas that has been used by customers but has not yet been billed. Revenues are recognized as gas is distributed. Estimated revenues from gas distributed and unbilled, less estimated uncollectible amounts are accrued and included in operating revenues and were $4.9 million and $4.6 million for the years ended August 31, 2019 and 2018, respectively.
(i) Operating Expenses The Company recognizes costs incurred as part of the Company’s regular business activities on the statements of revenues and expenses and changes in net position as operating expenses. These costs include distribution, marketing, gas processing, and other similar costs.
Costs incurred that do not involve normal business operations are recognized as nonoperating expenses.
(j) Provision for Uncollectible Accounts The Company estimates its accumulated provision for uncollectible accounts based on a financial analysis and a collectibility study performed as of the fiscal year end. The methodology used in performing the collectibility study has been reviewed by the PGC. For FY 2019 and FY 2018, management has provided an accumulated provision for uncollectible accounts in excess of the collectibility study results based on its analysis of historical aging data. The actual results of the Company’s collection efforts could differ significantly from the Company’s estimate.
Due to the seasonal nature of the business, the Company carries credit balances in accounts receivable primarily as a result of prepayment by budget customers. Credit balances of $15.9 million and $16.8 million in FY 2019 and FY 2018, respectively, have been reclassified to accounts payable.

PHILADELPHIA GAS WORKS (A Component Unit of the City of Philadelphia)
Notes to Basic Financial Statements August 31, 2019 and 2018
29 (Continued)
(k) Gas Inventories, Materials, and Supplies Gas inventories, materials, and supplies, consisting primarily of fuel stock, gas stored to meet peak demand requirements, and spare parts, are stated at average cost at August 31, 2019 and 2018, as follows (thousands of U.S. dollars):
2019 2018
Gas inventory $ 41,263 41,652 Material and supplies 10,428 10,712
Total $ 51,691 52,364
(l) Unamortized Bond Insurance Costs, Debt Discount, and Premium Discounts or premiums and bond insurance costs arising from the sale of revenue bonds are amortized using the interest method over the term of the related bond issue. Other costs of bond issuance are expensed as incurred.
(m) Unamortized Losses on Bond Refunding Losses on bond refunding are recorded as deferred outflows of resources and amortized, using the interest method, to interest expense over the shorter of the life of the refunding bond issue or the remaining original amortization period.
(n) Pensions and Postemployment Benefits As described in note 10, the City sponsors a single employer defined benefit pension plan, the Philadelphia Gas Works Pension Plan (the Pension Plan), to provide pension benefits for certain current and former PGW employees. As described in note 11, PGW sponsors a single employer defined benefit healthcare plan, the Philadelphia Gas Works OPEB Plan (the OPEB Plan), to provide postemployment healthcare and life insurance benefits to substantially all current and former PGW employees.
In accordance with GASB Statement No. 68, Accounting and Financial Reporting for Pensions – an amendment of GASB 27 (GASB 68), and GASB Statement No. 75, Accounting and Financial Reporting for Postemployment Benefits Other Than Pensions (GASB 75), for purposes of measuring the net pension and OPEB liabilities, deferred outflows of resources and deferred inflows of resources related to the Pension and OPEB Plans, and the Pension and OPEB Plans expense, information about the fiduciary net position of the Pension Plan and OPEB Plan, and additions to/deductions from the Pension and OPEB Plans’ fiduciary net position are determined on the same basis as they are reported by the Pension and OPEB Plans. For this purpose, benefit payments (including refunds of employee contributions) are recognized when due and payable in accordance with benefit terms. Investments are reported at fair value. With the exception of deferred outflows of resources related to employer contributions made after the measurement date, deferred inflows and outflows of resources related to the Pension and OPEB Plans are amortized over a closed five-year period or the average remaining service life of employees in the plan. Deferred outflows of resources related to employer contributions
PHILADELPHIA GAS WORKS (A Component Unit of the City of Philadelphia)
Notes to Basic Financial Statements August 31, 2019 and 2018
30 (Continued)
made after the measurement date will be recognized as a reduction of the net liability in the next fiscal year.
(o) Fair Value Measurements Fair value is defined as the price that would be received to sell an asset or paid to transfer a liability in an orderly transaction between market participants at the financial statement measurement date. The fair value hierarchy categorizes the inputs to valuation techniques used to measure fair value into three levels as follows:
• Level 1 – quoted prices for identical assets or liabilities in active markets that a government can access at the measurement date.
• Level 2 – quoted prices other than those included within Level 1 and other inputs that are observable for an asset or liability, either directly or indirectly.
• Level 3 – pricing inputs are unobservable for the asset or liability and include situations where there is little, if any, market activity or involvement.
The fair value hierarchy gives the highest priority to Level 1 inputs and the lowest priority to Level 3. When the fair value of an asset or a liability is measured using inputs from more than one level of the fair value hierarchy, the measurement is considered to be based on the lowest priority level that is significant to the entire measurement.
The categorization of a financial instrument within the hierarchy is based upon pricing transparency and is not necessarily an indication of the Company’s perceived risk of that instrument.
The following is a description of the valuation methodologies used for investments measured at fair value:
• U.S. government obligations – The fair value of government obligations are based on institutional bond quotes and evaluations based on various market and industry inputs and are primarily considered Level 1 inputs.
• U.S. government agencies and instrumentalities – The fair value of debt instruments of U.S. government agencies and instrumentalities is based on prices or yields of similar bonds, which is a Level 2 input.
• Corporate obligations – The fair value of corporate bonds are based on institutional bond quotes and evaluations based on various market and industry inputs and are primarily considered Level 2 inputs.
• Foreign issues – The fair value of foreign bonds are based on institutional bond quotes and evaluations based on various market and industry inputs and are primarily considered Level 2 inputs.
(p) Cash and Cash Equivalents For the purpose of reporting cash and cash equivalents, all highly liquid investments with original maturities of three months or less are considered cash equivalents, except those held for long-term

PHILADELPHIA GAS WORKS (A Component Unit of the City of Philadelphia)
Notes to Basic Financial Statements August 31, 2019 and 2018
31 (Continued)
purposes in the Sinking Fund Reserve, Workers’ Compensation Escrow Fund, and Capital Improvement Fund as described in note 3.
(q) Reserve for Injuries and Damages The Company is principally insured through insurance carriers. However, the Company is required to cover settlement of claims, which are excluded under the provisions of such insurance policies. An estimated liability has been established, in accordance with PGC regulations, for settlements to be paid by the Company in the next fiscal year as described in note 14.
Estimated losses from claims for occurrences not covered by insurance, which will not be paid in the next fiscal year, have been accrued. Such liabilities have been established based upon Company history and consultation with counsel. Such expenses are expected to be recovered through future rates. Reductions to the reserve are made as claims are settled.
(r) Segment Information All of the Company’s assets and operations are employed in only one segment, local transportation, and distribution of natural gas in the City.
(s) Estimates The preparation of financial statements in conformity with U.S. GAAP requires management to make estimates and assumptions that affect the reported amounts of assets and liabilities and disclosure of contingent assets and liabilities at the date of the financial statements and the reported amounts of revenues and expenses during the reporting period. Actual results could differ from those estimates. Significant estimates in the Company’s financial statements include the accumulated provision for uncollectible accounts, the fair value of interest rate swap agreements, the self-insurance liability, and the valuation of net pension and OPEB liabilities.
(t) Pollution Remediation The Company estimates its pollution remediation obligations using the effective cash flow method, in which measurement is based on the outlays expected to be incurred as a sum of probability weighted amounts in a range of possible estimated amounts. The Company’s liability is based on a combination of internal and external cost estimates for the specific remediation activities agreed to as part of Pennsylvania Act 2, Land Recycling and Environmental Remediation Standards Act of 1995 and Pennsylvania Act 32, Storage Tank and Spill Prevention Act of 1989.
Estimated site liabilities are determined based upon existing remediation laws and technologies, specific site consultants’ engineering studies, or by extrapolating experience with environmental issues at comparable sites. Estimates may change substantially as additional information becomes available regarding the level of contamination at specific sites, available remediation methods, and changes in price, technology, proposed land use, or applicable regulations.
(u) Pronouncements Effective in the Current Year GASB Statement No. 83, Certain Asset Retirement Obligations (GASB 83) addresses accounting and financial reporting for certain asset retirement obligations (ARO). An ARO is a legally enforceable

PHILADELPHIA GAS WORKS (A Component Unit of the City of Philadelphia)
Notes to Basic Financial Statements August 31, 2019 and 2018
32 (Continued)
liability associated with the retirement of a tangible capital asset. A government that has legal obligations to perform future asset retirement activities related to its tangible capital assets should recognize a liability based on the guidance in this statement. The requirements of this Statement were effective for periods beginning after June 15, 2018 (the Company’s fiscal year ended August 31, 2019). The adoption of GASB 83 did not have a material impact on the financial statements.
GASB Statement No. 88, Certain Disclosures Related to Debt, including Direct Borrowings and Direct Placements (GASB 88) improves consistency in accounting and financial reporting related to debt, including direct borrowings and direct placements, and to provide financial statement users with additional essential information about debt. This Statement defines debt for purposes of disclosure in notes to financial statements and establishes additional financial statement note disclosure requirements related to debt obligations of governments, including direct borrowings and direct placements. The requirements of this Statement were effective for periods beginning after June 15, 2018 (the Company’s fiscal year ended August 31, 2019). The adoption of GASB 88 did not have a material impact on the financial statements.
(v) Pronouncements Effective in Future Years (i) Effective for the Year Ending August 31, 2020
GASB Statement No. 84, Fiduciary Activities (GASB 84) establishes criteria for identifying fiduciary activities of all state and local governments. The focus of the criteria generally is on (1) whether a government is controlling the assets of the fiduciary activity and (2) the beneficiaries with whom a fiduciary relationship exists. Separate criteria are included to identify fiduciary component units and postemployment benefit arrangements that are fiduciary activities. An activity meeting the criteria should be reported in a fiduciary fund in the basic financial statements. Governments with activities meeting the criteria should present a statement of fiduciary net position and a statement of changes in fiduciary net position. This Statement describes four fiduciary funds that should be reported, if applicable: (1) pension (and other employee benefit) trust funds, (2) investment trust funds, (3) private-purpose trust funds, and (4) custodial funds. The requirements of this Statement will take effect for periods beginning after December 15, 2018 (the Company’s fiscal year ending August 31, 2020). The Company is currently evaluating the impact of GASB 84 on its financial statements, and anticipates that certain pension and other postemployment benefit arrangements will be reported under the standard as fiduciary funds.
GASB Statement No. 90, Majority Equity Interest – an amendment of GASB Statements No. 14 and No. 61, will take effect for periods beginning after December 15, 2018 (the Company’s fiscal year ended August 31, 2020). The primary objectives of GASB 90 are to provide a single method of reporting conduit debt obligations by issuers and eliminate diversity in practice associated with (1) commitments extended by issuers, (2) arrangements associated with conduit debt obligations, and (3) related note disclosures. GASB 90 defines a majority equity interest and specifies that a majority equity interest in a legally separate organization should be reported as an investment if a government’s holding of the equity interest meets the definition of an investment. The Company is currently evaluating the impact of GASB 90 on its financial statements, and anticipates that the adoption of this statement will not have a material impact on the financial statements.

PHILADELPHIA GAS WORKS (A Component Unit of the City of Philadelphia)
Notes to Basic Financial Statements August 31, 2019 and 2018
33 (Continued)
(ii) Effective for the Year Ending August 31, 2021
GASB Statement No. 87, Leases (GASB 87) requires recognition of certain lease assets and liabilities for leases that previously were classified as operating leases and recognized as inflows of resources or outflows of resources based on the payment provisions of the contract. It establishes a single model for lease accounting based on the foundational principle that leases are financings of the right to use an underlying asset. Under this statement, a lessee is required to recognize a lease liability and an intangible right-to-use lease asset, and a lessor is required to recognize a lease receivable and a deferred inflow of resources. The requirements of this Statement will take effect for periods beginning after December 15, 2019 (the Company’s fiscal year ending August 31, 2021). The Company is currently evaluating the impact of GASB 87 on its financial statements.
GASB Statement No. 89, Accounting for Interest Cost Incurred before the End of a Construction Period (GASB 89) establishes accounting requirements for interest cost incurred before the end of a construction period. This Statement requires that interest cost incurred before the end of a construction period be recognized as an expense in the period in which the cost is incurred for financial statements prepared using the economic resources measurement focus. As a result, interest cost incurred before the end of a construction period will not be included in the historical cost of a capital asset reported in a business-type activity or enterprise fund. The requirements of this Statement will take effect for periods beginning after December 15, 2019 (the Company’s fiscal year ending August 31, 2021). The Company is currently evaluating the impact of GASB 89 on its financial statements.
(iii) Effective for the Year Ending August 31, 2022
GASB Statement No. 91, Conduit Debt Obligations (GASB 91) will take effect for financial statements starting with periods beginning after December 15, 2020 (the Company’s fiscal year ending August 31, 2022). The primary objectives of GASB 91 are to provide a single method of reporting conduit debt obligations by issuers and eliminate diversity in practice associated with commitments extended by issuers, arrangements associated with conduit debt obligations, and related note disclosures. Under this statement, a conduit obligation is defined as a debt instrument where (1) at least three parties involved, (2) the issuer and the third party obligor are not within the same financial reporting entity, (3) the debt obligation is a not parity bond of the issuer, nor is it cross-collateralized with other debt of the issuer, (4) the third party obligor or its agent, not the issuer, ultimately receives the proceeds from the debt issuance, (5) the third party obligor, not the issuer, is primary obligated for the payment of all amounts associated with the debt obligation (debt service payments). GASB 91 requires issuers to disclose general information about their conduit debt obligations, organized by type of commitment, including the aggregate outstanding principal amount of the issuers’ conduit debt obligations and a description of each type of commitment. The Company is currently evaluating the impact of GASB 91 on its financial statements.
(2) Ownership and Management and Related-Party Transactions and Balances The Company is accounted for as a component unit of the City. As of January 1, 1973, under the terms of a two year agreement automatically extended for successive two year periods unless canceled upon 90 days’ notice by the City, the Company is being managed by the Philadelphia Facilities Management Corporation (PFMC). The agreement, as amended, provides for reimbursement to PFMC of actual costs

PHILADELPHIA GAS WORKS (A Component Unit of the City of Philadelphia)
Notes to Basic Financial Statements August 31, 2019 and 2018
34 (Continued)
incurred in managing the Company, not to exceed a total of the prior fiscal year’s maximum amount adjusted to reflect the percentage change in the Consumer Price Index for All Urban Consumers (CPI-U) All Items Index, Philadelphia, Pennsylvania, United States Department of Labor, Bureau of Labor Statistics, as most recently published and available to the Director of Finance of the City on March 1 of each such fiscal year. In FY 2019 and FY 2018, the applicable maximum amount was calculated to be $1.3 million and $1.2 million, respectively. The agreement requires the Company to make annual payments of $18.0 million to the City. In FY 2019 and FY 2018, the Company made the annual payment of $18.0 million to the City.
The Company engages in various other transactions with the City. The Company provides gas service to the City. Operating revenues include $7.4 million and $7.6 million in FY 2019 and FY 2018, respectively, relating to sales to the City. Net amounts receivable from the City were $0.6 million and $0.5 million at August 31, 2019 and 2018, respectively. Water and sewer services and licenses are purchased from the City. Such purchases totaled $1.7 million and $1.6 million in FY 2019 and FY 2018, respectively. Water and sewer services and licenses are purchased from the City. Such purchases totaled $1.7 million and $1.6 million in FY 2019 and FY 2018, respectively.
Certain activities of the PGC are paid for by the Company. Such payments totaled $0.8 million and $0.7 million in FY 2019 and FY 2018, respectively.
(3) Cash and Cash Equivalents, and Investments (a) Cash and Cash Equivalents, and Short-Term Investments
Cash and cash equivalents consist primarily of bank deposits, money market accounts, and investments purchased through various brokerage relationships. Bank balances of such deposits, accounts, and investments at August 31, 2019 and August 31, 2018 were $123.8 million and $131.0 million, respectively. Book balances of such deposits and accounts at August 31, 2019 and August 31, 2018 were $124.1 million and $131.1 million, respectively. Short-term investments with a carrying amount (at fair value) of $107.3 million and $121.5 million at August 30, 2019 and August 31, 2018, respectively, are included in the balances presented above. Federal depository insurance on these balances at August 31, 2019 and August 31, 2018 was $0.5 million and $0.8 million, respectively. The remaining balances are not insured. Investments are primarily in money market accounts, U.S. Treasury bills, U.S. government agencies and instrumentalities, and corporate obligations (short-term investments).
The highest balance of short-term investments during FY 2019 and FY 2018 was $194.2 million and $154.1 million, respectively.

PHILADELPHIA GAS WORKS (A Component Unit of the City of Philadelphia)
Notes to Basic Financial Statements August 31, 2019 and 2018
35 (Continued)
The following is a schedule that details the Company’s short-term investments (thousands of U.S. dollars):
August 31, 2019Weightedaveragematurity Credit Rating
Investment type Fair value (years) rating agency
U.S. government obligations:U.S. Treasury bills $ 30,983 0.0377 * *U.S. Treasury notes 11,007 0.1857 * *
Total U.S. governmentobligations 41,990
U.S. government agencies andinstrumentalities:
Federal Home Loan MortgageCorporation medium term notes 14,958 0.1842 * *
Federal Home Loan Bank bonds 19,970 0.0825 Aaa/AA+ Moody’s/S&P
Total U.S. government agenciesand instrumentalities 34,928
Total fair value ofU.S. government securities 76,918
Cash and cash equivalents:Agricultural Bank CP 2,999 — * *Agricultural Bank CP 2,676 — * *China Construction CP 4,992 — * *First Adu Dhabi Bank CP 4,999 — * *Korea Development Bank CP 4,492 — * *Industrial Com Bank CP 4,993 — * *
Total cash and cash equivalents 25,151
Other:Federal Fund 30 – Mutual Fund 5,256 — * *
Total fair value of investments,including cash deposits $ 107,325
Portfolio weighted modified duration
* The credit of this investment is unrated.
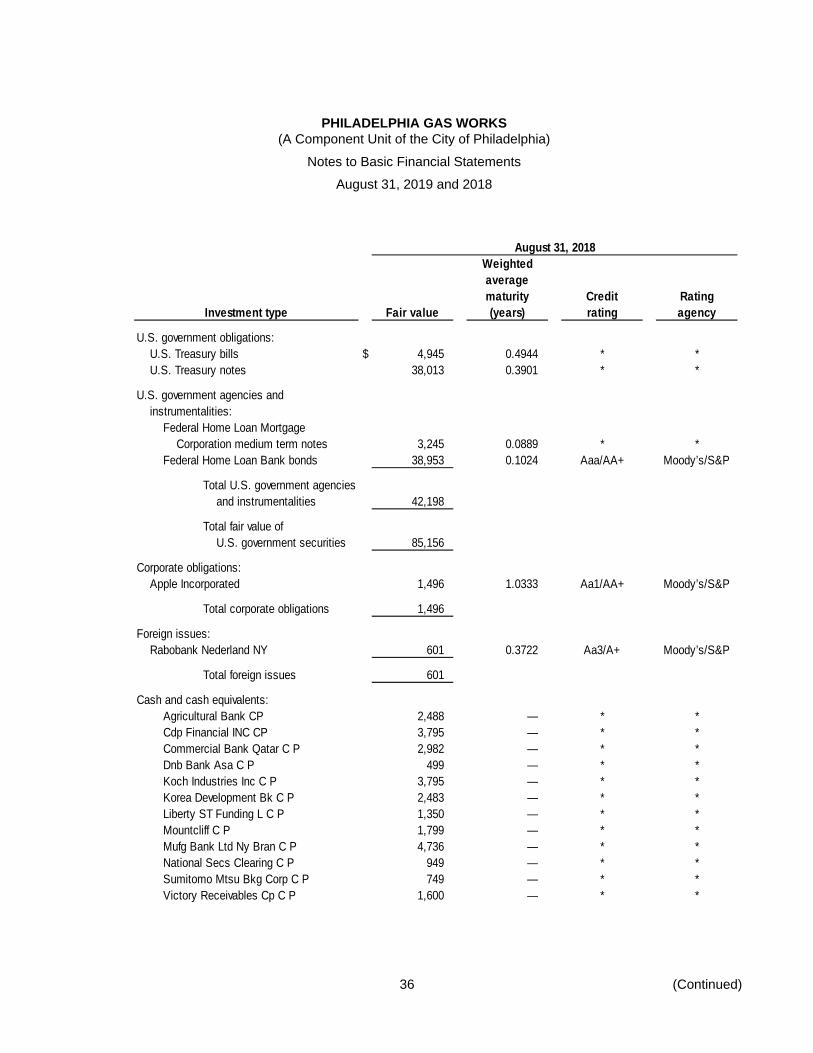
PHILADELPHIA GAS WORKS (A Component Unit of the City of Philadelphia)
Notes to Basic Financial Statements August 31, 2019 and 2018
36 (Continued)
August 31, 2018Weightedaveragematurity Credit Rating
Investment type Fair value (years) rating agency
U.S. government obligations:U.S. Treasury bills $ 4,945 0.4944 * *U.S. Treasury notes 38,013 0.3901 * *
U.S. government agencies andinstrumentalities:
Federal Home Loan MortgageCorporation medium term notes 3,245 0.0889 * *
Federal Home Loan Bank bonds 38,953 0.1024 Aaa/AA+ Moody’s/S&P
Total U.S. government agenciesand instrumentalities 42,198
Total fair value ofU.S. government securities 85,156
Corporate obligations:Apple Incorporated 1,496 1.0333 Aa1/AA+ Moody’s/S&P
Total corporate obligations 1,496
Foreign issues:Rabobank Nederland NY 601 0.3722 Aa3/A+ Moody’s/S&P
Total foreign issues 601
Cash and cash equivalents:Agricultural Bank CP 2,488 — * *Cdp Financial INC CP 3,795 — * *Commercial Bank Qatar C P 2,982 — * *Dnb Bank Asa C P 499 — * *Koch Industries Inc C P 3,795 — * *Korea Development Bk C P 2,483 — * *Liberty ST Funding L C P 1,350 — * *Mountcliff C P 1,799 — * *Mufg Bank Ltd Ny Bran C P 4,736 — * *National Secs Clearing C P 949 — * *Sumitomo Mtsu Bkg Corp C P 749 — * *Victory Receivables Cp C P 1,600 — * *

PHILADELPHIA GAS WORKS (A Component Unit of the City of Philadelphia)
Notes to Basic Financial Statements August 31, 2019 and 2018
37 (Continued)
August 31, 2018Weightedaveragematurity Credit Rating
Investment type Fair value (years) rating agencyMoney market:
First American Government ObligationsFund Class Z $ 1,723 — * *
Total cash and cash equivalents 28,948
Other:Federal Fund 30 Mutual Fund 5,256 — * *
Total fair value of investments,including cash deposits $ 121,457
Portfolio weighted modified duration
* The credit of this investment is unrated.
The following table is a schedule that details the fair value hierarchy of the Company’s short-term investments (thousands of U.S. dollars):
August 31, 2019Total
Investment type fair value Level 1 Level 2 Level 3
U.S. government obligations:U.S. Treasury bills $ 30,983 30,983 — — U.S. Treasury notes 11,007 11,007 — —
Total U.S. government obligations 41,990 41,990 — —
U.S. government agencies andinstrumentalities:
Federal Home Loan MortgageCorporation medium term notes 14,958 — 14,958 —
Federal Home Loan Bank Bonds 19,970 — 19,970 —
Total U.S. government agenciesand instrumentalities 34,928 — 34,928 —
Total fair value of U.S. governmentsecurities 76,918 41,990 34,928 —
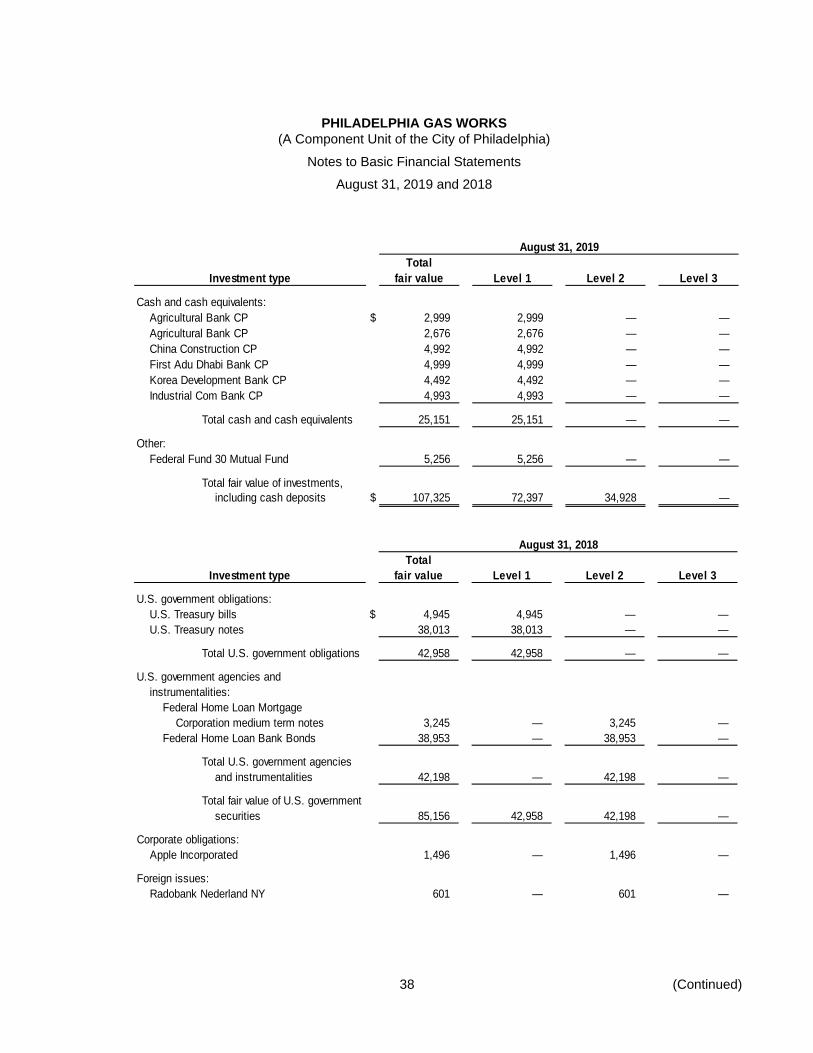
PHILADELPHIA GAS WORKS (A Component Unit of the City of Philadelphia)
Notes to Basic Financial Statements August 31, 2019 and 2018
38 (Continued)
August 31, 2019Total
Investment type fair value Level 1 Level 2 Level 3
Cash and cash equivalents:Agricultural Bank CP $ 2,999 2,999 — — Agricultural Bank CP 2,676 2,676 — — China Construction CP 4,992 4,992 — — First Adu Dhabi Bank CP 4,999 4,999 — — Korea Development Bank CP 4,492 4,492 — — Industrial Com Bank CP 4,993 4,993 — —
Total cash and cash equivalents 25,151 25,151 — —
Other:Federal Fund 30 Mutual Fund 5,256 5,256 — —
Total fair value of investments,including cash deposits $ 107,325 72,397 34,928 —
August 31, 2018Total
Investment type fair value Level 1 Level 2 Level 3
U.S. government obligations:U.S. Treasury bills $ 4,945 4,945 — — U.S. Treasury notes 38,013 38,013 — —
Total U.S. government obligations 42,958 42,958 — —
U.S. government agencies andinstrumentalities:
Federal Home Loan MortgageCorporation medium term notes 3,245 — 3,245 —
Federal Home Loan Bank Bonds 38,953 — 38,953 —
Total U.S. government agenciesand instrumentalities 42,198 — 42,198 —
Total fair value of U.S. governmentsecurities 85,156 42,958 42,198 —
Corporate obligations:Apple Incorporated 1,496 — 1,496 —
Foreign issues:Radobank Nederland NY 601 — 601 —

PHILADELPHIA GAS WORKS (A Component Unit of the City of Philadelphia)
Notes to Basic Financial Statements August 31, 2019 and 2018
39 (Continued)
August 31, 2018Total
Investment type fair value Level 1 Level 2 Level 3
Cash and cash equivalents:Agricultural Bank CP $ 2,488 2,488 — — Cdp Financial INC CP 3,795 3,795 — — Commercial Bank Qatar C P 2,982 2,982 — — Dnb Bank Asa C P 499 499 — — Koch Industries Inc C P 3,795 3,795 — — Korea Development Bk C P 2,483 2,483 — — Liberty ST Funding L C P 1,350 1,350 — — Mountcliff C P 1,799 1,799 — — Mufg Bank Ltd Ny Bran C P 4,736 4,736 — — National Secs Clearing C P 949 949 — — Sumitomo Mtsu Bkg Corp C P 749 749 — — Victory Receivables Cp C P 1,600 1,600 — —
Money market:First American Government Obligations
Fund Class Z 1,723 1,723 — —
Total cash and cash equivalents 28,948 28,948 — —
Other:Federal Fund 30 Mutual Fund 5,256 5,256 — —
Total fair value of investments,including cash deposits $ 121,457 77,162 44,295 —
(b) Sinking Fund Reserve, Workers’ Compensation Escrow Fund, and Capital Improvement Fund The investments in the Company’s Sinking Fund Reserve, Capital Improvement Fund and Workers’ Compensation Escrow Fund consist primarily of U.S. Treasury and government agency obligations, corporate obligations, and money market accounts. These investments are maintained by the City or in the Company’s name by its agent.
The Sinking Fund Reserve is required by bond ordinance to hold an amount equal to the greatest amount of debt service required by bonds secured by the Sinking Fund Reserve in any fiscal year. The balance of the Company’s Sinking Fund Reserve at August 31, 2019 and 2018 was $106.5 million and $103.3 million, respectively. Interest income on these funds, to the extent not drawn, is reflected as an increase and approximated $2.0 million in FY 2019 and $1.0 million in FY 2018.
The balance in the Capital Improvement Fund at August 31, 2019 and 2018 was $68.6 million and $111.8 million, respectively. PGW withdrew $45.0 million during FY 2019 and $55.0 million FY 2018 to finance various capital projects. Interest income on these funds, to the extent not drawn, is reflected as an increase and approximated $1.6 million in FY 2019 and $1.8 million in FY 2018.

PHILADELPHIA GAS WORKS (A Component Unit of the City of Philadelphia)
Notes to Basic Financial Statements August 31, 2019 and 2018
40 (Continued)
Investments are recorded at fair value except for certain money market funds recorded at amortized cost. The adjustment to the market value for the Sinking Fund Reserve and the Capital Improvement Fund resulted in a gain of $1.2 million and $0.2 million in FY 2019 and FY 2018, respectively.
Pursuant to the Pennsylvania Department of Labor and Industry Bureau of Workers’ Compensation Self-Insurance policy, the Company has established and maintained a restricted trust account. As of August 31, 2019 and 2018, the trust account balances were $2.7 million and $2.6 million, respectively.
The following tables are schedules that detail the Company’s investments in the Sinking Fund Reserve (thousands of U.S. dollars):
August 31, 2019Weightedaveragematurity Credit Rating
Investment type Fair value (years) rating agency
U.S. government obligations:U.S. Treasury notes $ 39,940 1.0367 Aaa/N/A Moody’s/S&P
U.S. government agencies andinstrumentalities:
Federal Home Loan MortgageCorporation medium term notes 4,032 0.6222 Aaa/AA+ Moody’s/S&P
Federal National Mortgage Association 5,097 0.3960 Aaa/AA+ Moody’s/S&PFederal Home Loan Bank bonds 13,920 1.5922 Aaa/AA+ Moody’s/S&PFederal Farm Credit Banks 5,234 1.0932 Aaa/AA+ Moody’s/S&P
Total U.S. government agenciesand instrumentalities 28,283
Total fair value of U.S. governmentsecurities 68,223
Corporate obligations:Apple Incorporated 1,992 0.5371 Aa1/AA+ Moody’s/S&PChevron Corporation 2,022 0.4836 Aa2/AA Moody’s/S&PExxon Mobil Corporation 2,018 0.1458 Aaa/AA+ Moody’s/S&PExxon Mobil Corporation 1,119 0.2351 Aaa/AA+ Moody’s/S&P
Total corporate obligations 7,151
Foreign issues:Bank of Montreal MTN 1,288 0.1811 Aa2/A+ Moody’s/S&PBank of Nova Scotia 1,011 0.1191 Aa2/A+ Moody’s/S&PCanadian Imperial Bank 1,417 0.1751 Aa2/A+ Moody’s/S&PRoyal Bank of Canada MTN 2,022 0.0888 Aa2/AA- Moody’s/S&PShell International 2,838 0.1403 Aa2/AA- Moody’s/S&PToronto Dominion MTN 1,927 0.2157 Aa1/AA- Moody’s/S&PToronto Dominion MTN 1,012 0.0686 Aa1/AA- Moody’s/S&P
Total foreign issues 11,515

PHILADELPHIA GAS WORKS (A Component Unit of the City of Philadelphia)
Notes to Basic Financial Statements August 31, 2019 and 2018
41 (Continued)
August 31, 2019Weightedaveragematurity Credit Rating
Investment type Fair value (years) rating agency
Cash and cash equivalents:BNP Paribas Finance Inc. CP $ 2,467 0.0850 * *Cooperatieve Central CP 1,993 0.0183 * *Credit Agricole Crpin CP 2,975 0.0640 * *JP Morgan Securities CP 1,996 0.0117 * *MUFG Bank LTD NY Bran CP 2,984 0.0411 * *Natixis NY CP 2,491 0.0229 * *Swedbank AB CP 1,978 0.0557Toyota Motor Credit Company CP 2,467 0.0853 * *
Money market:First American Government Obligations
Fund Class Z 269 — * *
Total cash and cash equivalents 19,620
Other — — * *
Total fair value of investments,including cash deposits $ 106,509
Portfolio weighted modified duration
* The credit of this investment is unrated.
August 31, 2018Weightedaveragematurity Credit Rating
Investment type Fair value (years) rating agency
U.S. government obligations:U.S. Treasury notes $ 44,999 1.0652
U.S. government agencies andinstrumentalities:
Federal Home Loan MortgageCorporation medium term notes 8,739 0.9583 Aaa/AA+ Moody’s/S&P
Federal National Mortgage Association 2,210 1.2083 Aaa/AA+ Moody’s/S&PFederal Home Loan Bank bonds 17,132 0.8738 Aaa/AA+ Moody’s/S&P
Total U.S. government agenciesand instrumentalities 28,081
Total fair value of U.S. governmentsecurities 73,080

PHILADELPHIA GAS WORKS (A Component Unit of the City of Philadelphia)
Notes to Basic Financial Statements August 31, 2019 and 2018
42 (Continued)
August 31, 2018Weightedaveragematurity Credit Rating
Investment type Fair value (years) rating agency
Corporate obligations:Chevron Corporation $ 1,999 0.1243 Aa2/AA- Moody’s/S&PApple Incorporated 1,998 0.2596 Aa1/AA+ Moody’s/S&PMicrosoft Corporation 1,983 0.2340 Aaa/AAA Moody’s/S&PExxon Mobil Corporation 1,975 0.3765 Aaa/AA+ Moody’s/S&P
Total corporate obligations 7,955
Cash and cash equivalents:American Honda Finance Corporation CP 1,985 — * *Bank of Montreal CP 1,985 — * *Bank of Tokyo Mitsubishi CP 1,970 — * *BNP Paribas Finance Inc. CP 1,970 — * *Cooperative Centrale CP 1,984 — * *Credit Agricole Crpin CP 1,988 — * *Dexia Credit Local CP 1,978 ING US Funding LLC CP 1,984 — * *JP Morgan Securities CP 1,965 — * *Natixis NY CP 1,979 — * *Toyota Motor Credit Company CP 1,985 — * *
Money market:First American Government Obligations
Fund Class Z 447 — * *
Total cash and cash equivalents 22,220
Other — — * *
Total fair value of investments,including cash deposits $ 103,255
Portfolio weighted modified duration
* The credit of this investment is unrated.

PHILADELPHIA GAS WORKS (A Component Unit of the City of Philadelphia)
Notes to Basic Financial Statements August 31, 2019 and 2018
43 (Continued)
The following is a schedule that details the Company’s investments in the Workers’ Compensation Escrow Fund (thousands of U.S. dollars):
August 31, 2019Weightedaveragematurity Credit Rating
Investment type Fair value (years) rating agency
Money market:Fidelity Government Portfolio – Class I $ 2,711 — Aaa/AAA Moody’s/S&P
Total fair value ofinvestments includingcash deposits $ 2,711
Portfolio weighted modified duration
* The credit of this investment is unrated.
August 31, 2018Weightedaveragematurity Credit Rating
Investment type Fair value (years) rating agency
U.S. government obligations:U.S. Treasury notes $ 2,589 0.3750
Money market:Fidelity Government Portfolio – Class I 57 — Aaa/AAA Moody’s/S&P
Total fair value ofinvestments includingcash deposits $ 2,646
Portfolio weighted modified duration
* The credit of this investment is unrated.

PHILADELPHIA GAS WORKS (A Component Unit of the City of Philadelphia)
Notes to Basic Financial Statements August 31, 2019 and 2018
44 (Continued)
The following tables are schedules that detail the Company’s investments in the Capital Improvement Fund (thousands of U.S. dollars):
August 31, 2019Weightedaveragematurity Credit Rating
Investment type Fair value (years) rating agency
U.S. government obligations:U.S. Treasury bills $ 11,923 0.3501U.S. Treasury notes 47,497 0.2627 Aaa/N/A Moody’s/S&P
Total U.S. government obligations 59,420
U.S. government agencies andinstrumentalities:
Federal Home Loan MortgageCorporation medium term notes 100 0.0889 Aaa/AA+ Moody’s/S&P
Total fair value of U.S. governmentsecurities 59,520
Corporate obligations:Apple Incorporated 1,599 0.0801 Aa1/AA+ Moody’s/S&PChevron Corporation 150 0.0188 Aa2/AA Moody’s/S&PInstitute for Advanced Study 300 0.0125 Aaa/AAA Moody’s/S&PWalmart Stores, Inc. 1,999 0.0535 Aa2/AA Moody’s/S&P
Total corporate obligations 4,048
Foreign issues:Toronto MTN 500 0.0780 Aa1/AA- Moody’s/S&PToronto Dominion MTN 461 0.5025 Aa1/AA- Moody’s/S&P
Total foreign issues 961
Municipal issues:Pennsylvania ST Hsg Fin Agy Sf Mtge 145 0.0095 Aa2/AA+ Moody’s/S&PPennsylvania ST Hsg Fin Agy Sf Mtge 125 0.0557 Aa2/AA+ Moody’s/S&PPennsylvania ST Turnpike Commission 750 0.1436 Aaa/N/A Moody’s/S&PUniversity of Pittsburg PA Commonwealth 300 0.0095 Aa1/AA+ Moody’s/S&P
Total municipal issues 1,320
Cash and cash equivalents:Export Development Corporation CP 998 — * *Salt River Project CP 200 — * *Sentara VA CP 1,500 — * *
Money market:First American Government Obligations Fund
Class Z 87 — * *
Total cash and cash equivalents 2,785
Total fair value of investmentsincluding cash deposits $ 68,634
Portfolio weighted modified duration
* The credit of this investment is unrated.

PHILADELPHIA GAS WORKS (A Component Unit of the City of Philadelphia)
Notes to Basic Financial Statements August 31, 2019 and 2018
45 (Continued)
August 31, 2018Weightedaveragematurity Credit Rating
Investment type Fair value (years) rating agency
U.S. government obligations:U.S. Treasury notes $ 46,308 0.8537
U.S. government agencies andinstrumentalities:
Federal Home Loan MortgageCorporation medium term notes 6,060 0.8512 Aaa/AA+ Moody’s/S&P
Federal National Mortgage Association 5,489 0.5713 Aaa/AA+ Moody’s/S&PFederal Home Loan Bank bonds 2,987 0.4352 Aaa/AA+ Moody’s/S&P
Total U.S. government agenciesand instrumentalities 14,536
Total fair value ofU.S. government securities 60,844
Corporate obligations:Apple Incorporated 2,893 0.0203 Aa1/AA+ Moody’s/S&PBerkshire Hathaway Financial 2,783 0.0311 Aa2/AA Moody’s/S&PChevron Corporation 2,800 0.0532 Aa2/AA- Moody’s/S&PEmory University 1,500 0.0307 Aa2/AA Moody’s/S&PExxon Mobil Corporation 1,995 0.0408 Aaa/AA+ Moody’s/S&PInstitute for Advanced Study 805 0.0170 Aaa/AAA Moody’s/S&PJohns Hopkins University 591 0.0150 Aa2/AA Moody’s/S&PJohnson & Johnson 1,275 0.0347 Aaa/AAA Moody’s/S&PMicrosoft Corporation 2,974 0.0960 Aaa/AAA Moody’s/S&PNew York University 292 0.0099 Aa2/AA- Moody’s/S&PNorthwestern University 50 0.0019 Aaa/AAA Moody’s/S&PPrinceton University 1,597 0.0622 Aaa/AAA Moody’s/S&PStanford University 840 0.0342 Aaa/AAA Moody’s/S&PWalmart Stores, Inc. 2,749 0.1289 Aa2/AA Moody’s/S&PYale University 1,449 0.0709 Aaa/AAA Moody’s/S&P
Total corporate obligations 24,593
Municipal issues:Chester County PA Ref 1,916 0.3718 Aaa/AAA Moody’s/S&PMontgomery County PA Ser B 116 0.0303 Aaa/N/A Moody’s/S&PPennsylvania ST Turnpike Commission 744 0.2553 Aaa/N/A Moody’s/S&PUniversity of Pittsburgh PA Of The Cmwlth 297 0.0847 Aa1/AA+ Moody’s/S&PWestmoreland County PA Txbl Ser B 578 0.0400 Aa2/N/A Moody’s/S&P
Total municipal issues 3,651

PHILADELPHIA GAS WORKS (A Component Unit of the City of Philadelphia)
Notes to Basic Financial Statements August 31, 2019 and 2018
46 (Continued)
August 31, 2018Weightedaveragematurity Credit Rating
Investment type Fair value (years) rating agency
Cash and cash equivalents:American Honda Financial CP $ 2,287 — * *Credit Agricole Corporation CP 1,995 — * *Export Development Corporation CP 2,997 — * *Nestle Finance Intl LTD CP 1,258 — * *Paccar Financial Corporation CP 995 — * *Prudential Funding LLC CP 995 — * *Salt River Project CP 995 — * *State of Ohio Hospital CP 1,991 — * *Swedbank AB CP 2,979 — * *Toyota Motor Credit Company CP 1,983 — * *
Money market:First American Government Obligations
Fund Class Z 2,252 — * *
Total cash and cash equivalents 20,727
Other:University of Pittsburgh PA CP 2,000 0.0076 * *
Total fair value of investmentsincluding cash deposits $ 111,815
Portfolio weighted modified duration
* The credit of this investment is unrated.

PHILADELPHIA GAS WORKS (A Component Unit of the City of Philadelphia)
Notes to Basic Financial Statements August 31, 2019 and 2018
47 (Continued)
The following tables are schedules that detail the fair value hierarchy of the Company’s investments in the Sinking Fund Reserve (thousands of U.S. dollars):
August 31, 2019Total
Investment type fair value Level 1 Level 2 Level 3
U.S. government obligations:U.S. Treasury notes $ 39,940 39,940 — —
U.S. government agencies andinstrumentalities:
Federal Home Loan MortgageCorporation medium term notes 4,032 — 4,032 —
Federal National Mortgage Association 5,097 — 5,097 — Federal Home Loan Bank bonds 13,920 — 13,920 — Federal Farm Credit banks 5,234 — 5,234 —
Total U.S. government agenciesand instrumentalities 28,283 — 28,283 —
Total fair value ofU.S. government securities 68,223 39,940 28,283 —
Corporate obligations:Apple Incorporated 1,992 — 1,992 — Chevron Corporation 2,022 — 2,022 — Exxon Mobil Corporation 2,018 — 2,018 — Exxon Mobil Corporation 1,119 — 1,119 —
Total corporate obligations 7,151 — 7,151 —
Foreign issues:Bank of Montreal MTN 1,288 — 1,288 — Bank of Nova Scotia 1,011 — 1,011 — Canadian Imperial Bank 1,417 — 1,417 — Royal Bank of Canada MTN 2,022 — 2,022 — Shell International 2,838 — 2,838 — Toronto Domion MTN 1,927 — 1,927 — Toronto Domion MTN 1,012 — 1,012 —
Total foreign issues 11,515 — 11,515 —

PHILADELPHIA GAS WORKS (A Component Unit of the City of Philadelphia)
Notes to Basic Financial Statements August 31, 2019 and 2018
48 (Continued)
August 31, 2019Total
Investment type fair value Level 1 Level 2 Level 3
Cash and cash equivalents:BNP Paribas Finance Inc. CP $ 2,467 2,467 — — Cooperative Centrale CP 1,993 1,993 — — Credit Agricole Crpin CP 2,975 2,975 — — JP Morgan Securities CP 1,996 1,996 — — MUFG Bank LTD NY Bran CP 2,984 2,984 — — Natixis NY CP 2,491 2,491 — — Swedbank AB CP 1,978 1,978 — — Toyota Motor Credit Company CP 2,467 2,467 — —
Money market:First American Government Obligations
Fund Class Z 269 269 — —
Total cash and cash equivalents 19,620 19,620 — —
Total fair value of investments,including cash deposits $ 106,509 59,560 46,949 —
August 31, 2018Total
Investment type fair value Level 1 Level 2 Level 3
U.S. government obligations:U.S. Treasury notes $ 44,999 44,999 — —
U.S. government agencies andinstrumentalities:
Federal Home Loan MortgageCorporation medium term notes 8,739 — 8,739 —
Federal National Mortgage Association 2,210 — 2,210 — Federal Home Loan Bank bonds 17,132 — 17,132 —
Total U.S. government agenciesand instrumentalities 28,081 — 28,081 —
Total fair value ofU.S. government securities 73,080 44,999 28,081 —

PHILADELPHIA GAS WORKS (A Component Unit of the City of Philadelphia)
Notes to Basic Financial Statements August 31, 2019 and 2018
49 (Continued)
August 31, 2018Total
Investment type fair value Level 1 Level 2 Level 3
Corporate obligations:Chevron Corporation $ 1,999 — 1,999 — Apple Incorporated 1,998 — 1,998 — Microsoft Corporation 1,983 — 1,983 — Exxon Mobil Corporation 1,975 — 1,975 —
Total corporate obligations 7,955 — 7,955 —
Cash and cash equivalents:American Honda Finance Corporation CP 1,985 1,985 — — Bank of Montreal CP 1,985 1,985 — — Bank of Tokyo Mitsubishi CP 1,970 1,970 — — BNP Paribas Finance Inc. CP 1,970 1,970 — — Cooperative Centrale CP 1,984 1,984 — — Credit Agricole Crpin CP 1,988 1,988 — — Dexia Credit Local CP 1,978 1,978 — — ING US Funding LLC CP 1,984 1,984 — — JP Morgan Securities CP 1,965 1,965 — — Natixis NY CP 1,979 1,979 — — Toyota Motor Credit Company CP 1,985 1,985 — —
Money market:First American Government Obligations
Fund Class Z 447 447 — —
Total cash and cash equivalents 22,220 22,220 — —
Total fair value of investments,including cash deposits $ 103,255 67,219 36,036 —

PHILADELPHIA GAS WORKS (A Component Unit of the City of Philadelphia)
Notes to Basic Financial Statements August 31, 2019 and 2018
50 (Continued)
The following tables are schedules that detail the fair value hierarchy of the Company’s investments in the Workers’ Compensation Escrow Fund (thousands of U.S. dollars):
August 31, 2019Total
Investment type fair value Level 1 Level 2 Level 3
Money market:Fidelity Government
Portfolio – Class I 2,711 2,711 — —
Total fair value ofinvestments,includingcash deposits $ 2,711 2,711 — —
August 31, 2018Total
Investment type fair value Level 1 Level 2 Level 3
U.S. government obligations:U.S. Treasury notes $ 2,589 2,589 — —
Money market:Fidelity Government
Portfolio – Class I 57 57 — —
Total fair value ofinvestments,includingcash deposits $ 2,646 2,646 — —

PHILADELPHIA GAS WORKS (A Component Unit of the City of Philadelphia)
Notes to Basic Financial Statements August 31, 2019 and 2018
51 (Continued)
The following table is a schedule that details the fair value hierarchy of the Company’s investments in the Capital Improvement Fund (thousands of U.S. dollars):
TotalInvestment type fair value Level 1 Level 2 Level 3
U.S. government obligations:U.S. Treasury bills $ 11,923 11,923 — — U.S. Treasury notes 47,497 47,497 — —
Total U.S. governmentobligations 59,420 59,420 — —
U.S. government agencies andinstrumentalities:
Federal Home Loan MortgageCorporation medium term notes 100 — 100 —
Total fair value ofU.S. government securities 59,520 59,420 100 —
Corporate obligations:Apple Incorporated 1,599 — 1,599 — Chevron Corporation 150 — 150 — Institute Advance Study 300 — 300 — Walmart Stores Incorporated 1,999 — 1,999 —
Total corporate obligations 4,048 — 4,048 —
Foreign issues:Toronto MTN 500 — 500 — Toronto Dominion MTN 461 — 461 —
Total foreign issues 961 — 961 —
Municipal Issues:Pennsylvania ST Hsg Fin Agy Sf Mtge 145 — 145 — Pennsylvania ST Hsg Fin Agy Sf Mtge 125 — 125 — Pennsylvania ST Turnpike Commission 750 — 750 — University of Pittsburg PA 300 — 300 —
Total foreign obligations 1,320 — 1,320 —
August 31, 2019

PHILADELPHIA GAS WORKS (A Component Unit of the City of Philadelphia)
Notes to Basic Financial Statements August 31, 2019 and 2018
52 (Continued)
TotalInvestment type fair value Level 1 Level 2 Level 3
Cash and cash equivalents:Export Development Corporation CP $ 998 998 — — Salt River Project CP 200 200 — — Sentara VA CP 1,500 1,500 — —
Money market:First American Government Obligations
Fund Class Z 87 87 — —
Total cash and cash equivalents 2,785 2,785 — —
Total fair value of investments,including cash deposits $ 68,634 62,205 6,429 —
August 31, 2019
August 31, 2018Total
Investment type fair value Level 1 Level 2 Level 3
U.S. government obligations:U.S. Treasury notes $ 46,308 46,308 — —
U.S. government agencies andinstrumentalities:
Federal Home Loan MortgageCorporation medium term notes 6,060 — 6,060 —
Federal National Mortgage Association 5,489 — 5,489 — Federal Home Loan Bank bonds 2,987 — 2,987 —
Total U.S. government agenciesand instrumentalities 14,536 — 14,536 —
Total fair value ofU.S. government securities 60,844 46,308 14,536 —
Corporate obligations:Apple Incorporated 2,893 — 2,893 — Berkshire Hathaway Financial 2,783 — 2,783 — Chevron Corporation 2,800 — 2,800 — Emory University 1,500 — 1,500 — Exxon Mobil Corporation 1,995 — 1,995 — Institute for Advanced Study 805 — 805 — Johns Hopkins University 591 — 591 — Johnson & Johnson 1,275 — 1,275 —

PHILADELPHIA GAS WORKS (A Component Unit of the City of Philadelphia)
Notes to Basic Financial Statements August 31, 2019 and 2018
53 (Continued)
August 31, 2018Total
Investment type fair value Level 1 Level 2 Level 3
Microsoft Corporation $ 2,974 — 2,974 — New York University 292 — 292 — Northwestern University 50 — 50 — Princeton University 1,597 — 1,597 — Stanford University 840 — 840 — Walmart Stores, Inc. 2,749 — 2,749 — Yale University 1,449 — 1,449 —
Total corporate obligations 24,593 — 24,593 —
Municipal issues:Chester County PA Ref 1,916 — 1,916 — Montgomery County PA Ser B 116 — 116 — Pennsylvania ST Turnpike Commission 744 — 744 — University of Pittsburgh PA Of The Cmwlth 297 — 297 — Westmoreland County PA Txbl Ser B 578 — 578 —
Total municipal issues 3,651 — 3,651 —
Cash and cash equivalents:American Honda Financial CP 2,287 2,287 — — Credit Agricole Corporation CP 1,995 1,995 — — Export Development Corporation CP 2,997 2,997 — — Nestle Finance Intl LTD CP 1,258 1,258 — — Paccar Financial Corporation CP 995 995 — — Prudential Funding LLC CP 995 995 — — Salt River Project CP 995 995 — — State of Ohio Hospital CP 1,991 1,991 — — Swedbank AB CP 2,979 2,979 — — Toyota Motor Credit Company CP 1,983 1,983 — —
Money market:First American Government Obligations Fund
Class Z 2,252 2,252 — —
Total cash and cash equivalents 20,727 20,727 — —
Miscellaneous:University of Pittsburgh PA CP 2,000 — 2,000 —
Total fair value of investments,including cash deposits $ 111,815 67,035 44,780 —

PHILADELPHIA GAS WORKS (A Component Unit of the City of Philadelphia)
Notes to Basic Financial Statements August 31, 2019 and 2018
54 (Continued)
(c) Interest Rate Risk It is the policy of the City to diversify its investment portfolios. Portfolio diversification is employed as a way to control risk. Investments shall be diversified as to maturities, and as to kind of investments to minimize the risk of loss, which might result from over concentration of assets in a specific maturity, in a specific kind of a security, or from a specific issuer or industry.
(d) Credit Risk The City has adopted an investment policy relating to the investments of the Company. Per the investment policy, the Company’s allowable investments are as follows:
(1) Bonds or notes of the U.S. government.
(2) U.S. Treasury obligations, including separate trading of registered interest and principal securities; receipts indicating an undivided interest in such U.S. Treasury obligations; and stripped coupons held under book entry with the New York Federal Reserve Bank.
(3) Obligations of the following U.S. government sponsored agencies: Government National Mortgage Association, Federal National Mortgage Association, Federal Home Loan Mortgage Corporation, Federal Farm Credit System, Federal Home Loan Bank, Resolution Funding Corporation, and Tennessee Valley Authority.
(4) Collateralized banker’s acceptances and certificate of deposit denominated in U.S. dollars and issued by a city code authorized depository certificate of deposit that must be secured by acceptable collateral with a total market value equal to 102.0% of the deposit.
(5) Commercial paper with a stated maturity of 270 days or less, which is rated P1 by Moody’s or A1+ by Standard & Poor’s (S&P). The senior long-term debt of the commercial paper issuer, or the entity providing an explicit guarantee, must be rated not lower than A2 by Moody’s or A by S&P.
(6) Asset backed commercial paper (ABCP), which does not have a long-term rating, is an allowable investment if it meets the short-term rating requirements but is only allowed up to the ABCP sublimit.
(7) General obligation bonds of corporations rated Aa2 or better by Moody’s or AA or better by S&P with a final maturity of two years or less.
(8) Collateralized mortgage obligations and pass through securities directly issued by a federal agency or instrumentality of the United States, the underlying security for which is guaranteed by an agency or instrumentality of the United States and with a final maturity of two years or less, the rating must be no lower than Aa2 by Moody’s or AA by S&P.
(9) Money market mutual funds, as defined by the Securities and Exchange Commission, such money market funds must have assets over $15.0 billion, have the highest rating from Moody’s, S&P, and Fitch, and contain only government securities.

PHILADELPHIA GAS WORKS (A Component Unit of the City of Philadelphia)
Notes to Basic Financial Statements August 31, 2019 and 2018
55 (Continued)
(10) Repurchase agreements that are fully collateralized in bonds or notes of the U.S. government pledged to the City and held in the City’s name and deposited at the time the investment is made with an entity or a third party selected and approved by the City the market value of the collateral shall be at least 102.0% of the funds being disbursed.
(11) Obligations of the Commonwealth of Pennsylvania (the Commonwealth) or any municipality or other political subdivision of the Commonwealth with a final maturity of two years or less and a rating of at least AA by Moody’s or S&P.
Authorized investments for Sinking Fund Portfolios are dictated by the First Class City Revenue Bond Act of the General Assembly of the Commonwealth of Pennsylvania, approved October 18, 1972. This also includes any investment vehicle permitted for any Commonwealth state agency.
The Company’s investment policy provides for the following percentage limitations of authorized investments, valued at market:
Percent ofPercent of Percent of outstandingportfolio portfolio securitiesallowed per issuer per issuer
U.S. government 100 100 N/AU.S. Treasury 100 100 N/AU.S. agencies and instrumentalities 100 33 N/ABanker’s acceptances and certificates
of deposit 15 3 3 Commercial paper 25 3 3 Corporate bonds 25 3 3 Collateralized mortgage obligations and
pass-through securities 5 3 3 Commonwealth of PA and subdivisions
of Commonwealth of PA 15 3 3 Money market mutual funds 25 10 3 Repurchase agreements 25 10 N/A
More than 84.8% of the Company’s short-term investments as of August 31, 2019 are in the following: U.S. Treasury bills (28.9%), Commercial Paper (23.4%), Federal Home Loan Bank Bonds (18.6%), and Federal Home Loan Mortgage Corporation medium term notes (13.9%). These investments are in accordance with the investment policy.
(e) Custodial Credit Risk The Company has selected, as custodial bank, a member of the Federal Reserve System, to hold its investments. Delivery of the applicable investment documents to the Company’s custodian is required for all investments. For secured transactions, such as repurchase agreements, either the title to or a
PHILADELPHIA GAS WORKS (A Component Unit of the City of Philadelphia)
Notes to Basic Financial Statements August 31, 2019 and 2018
56 (Continued)
perfected security interest in the securities, along with any necessary transfer documents, must be transferred to the custodian. Such transactions will always use delivery versus payment procedures.
(4) Recoverable Costs In compliance with orders issued by the PGC, the cost of projects that produce benefits over an extended period is recorded on the balance sheets as a recoverable cost in other assets. There is no return on the asset being charged to the customers. The unamortized costs included in other noncurrent assets were $0.4 million and $0.8 million as of August 31, 2019 and 2018, respectively. The unamortized costs included in other current assets were $0.4 million and $0.4 million as of August 31, 2019 and 2018, respectively.
In accordance with U.S. GAAP for regulated entities, the Company has recognized the long-term portion of its environmental remediation liability as a regulatory asset because based on available evidence it is probable that the previously incurred costs will be recovered through rates. In FY 2019, settlements by the Company’s insurance carriers provided less than $0.1 million associated with environmental remediation costs. Environmental remediation costs of approximately $0.6 million in FY 2019 were offset by insurance settlements received in prior fiscal years, and the remainder was recorded on the Balance Sheets as a recoverable cost in other noncurrent assets. The Company estimates additional expenditures to be approximately $39.1 million.
(5) Deferred Compensation Plan The Company offers its employees a deferred compensation plan created in accordance with Internal Revenue Code Section 457. The plan, available to all Company employees with at least 30 days of service, permits them to defer a portion of their salary until future years. The Company provides an annual 10.0% matching contribution of applicable wages that immediately vests to the employee. The Company contributed $0.4 million in FY 2019 and $0.4 million in FY 2018. PGW’s contributions are accounted for as part of administrative and general expenses.
(6) Notes Payable Pursuant to the provisions of the City of Philadelphia Note Ordinances, PGW may issue short-term notes to either support working capital requirements or pay the costs of certain capital projects and other project costs. PGW may issue short-term notes in a principal amount, which, together with interest, may not exceed $150.0 million outstanding to support working capital requirements. PGW may also issue additional short-term notes in an aggregate principal amount, which may not exceed $120.0 million outstanding at any time to pay the costs of certain capital projects and other project costs. As of December 1, 2017, all notes are supported by a Note Purchase and Credit Agreement and a security interest in PGW’s revenues. Prior to that, all notes were supported by two irrevocable letters of credit and a security interest in PGW’s revenues. The Note Purchase and Credit Agreement supporting PGW’s combined commercial paper programs set the maximum level of outstanding notes plus interest at $120.0 million in FY 2019 and FY 2018, respectively. The commitment amount is $120.0 million under the current credit agreement. The expiration date of the credit agreement is December 31, 2021.
There were no Gas Works Revenue Capital Project Commercial Paper Notes (Capital Project Notes) or Gas Works Revenue Notes outstanding at August 31, 2019 and 2018, respectively.

PHILADELPHIA GAS WORKS (A Component Unit of the City of Philadelphia)
Notes to Basic Financial Statements August 31, 2019 and 2018
57 (Continued)
(7) GCR Tariff Reconciliation During the fiscal year ended August 31, 2019, the Company’s actual gas costs were higher than its billed gas costs by approximately $1.2 million. This amount was netted with other applicable costs and recorded in other current assets for FY 2019. Actual gas costs were $10.9 million lower than billed gas costs in FY 2018. This amount was netted with other applicable costs and recorded in other current assets for FY 2018.
Natural Gas Pipeline Supplier Refund
The Company received less than $0.1 million in refunds in FY 2019 and FY 2018, related to Federal Energy Regulatory Commission/Pipeline Rate Cases. This amount was utilized as a reduction in the cost of gas for reconciliation purposes in the calculation of the applicable GCR.
(8) Long-Term Debt and Other Liabilities The following summary of long-term debt consists primarily of bonds issued by the City under agreements whereby the Company must reimburse the City for the principal and interest payments required by the bond ordinances for the fiscal years ended August 31, 2019 and 2018 (thousands of U.S. dollars):
August 31, 2019 August 31, 2018Current Currentportion Long-term Total portion Long-term Total
Revenue bonds $ 52,870 911,610 964,480 51,820 964,480 1,016,300 Unamortized discount (4) (56) (60) (4) (60) (64) Unamortized premium 10,080 87,920 98,000 10,893 98,343 109,236
Total revenuebonds $ 62,946 999,474 1,062,420 62,709 1,062,763 1,125,472
The following is a summary of activity related to revenue bonds and other liabilities and the respective balances for the fiscal years ended August 31, 2019 and 2018 (thousands of U.S. dollars):
Year ended August 31, 2019Beginning Ending Due withinbalance Additions Reductions balance one year
Revenue bonds $ 1,016,300 — (51,820) 964,480 52,870
Other liabilities:Claims and judgments $ 14,064 — (4,504) 9,560 3,925 Environmental cleanup 34,244 4,877 — 39,121 2,388 Interest rate swap liability 14,796 8,318 — 23,114 —
Total other liabilities $ 63,104 13,195 (4,504) 71,795 6,313

PHILADELPHIA GAS WORKS (A Component Unit of the City of Philadelphia)
Notes to Basic Financial Statements August 31, 2019 and 2018
58 (Continued)
Year ended August 31, 2018Beginning Ending Due withinbalance Additions Reductions balance one year
Revenue bonds $ 1,054,725 — (38,425) 1,016,300 51,820
Other liabilities:Claims and judgments $ 14,377 — (313) 14,064 6,100 Environmental cleanup 33,605 639 — 34,244 1,116 Interest rate swap liability 23,533 — (8,737) 14,796 —
Total other liabilities $ 71,515 639 (9,050) 63,104 7,216
(a) Principal Maturities and Scheduled Interest and Swap Payments Principal maturities and scheduled interest payments for revenue bonds and estimated payments on the interest rate swaps are as follows (thousands of U.S. dollars):
Revenue bondsNet swap
Principal Interest amount Total
Fiscal year endingAugust 31:
2020 $ 52,870 41,921 2,717 97,508 2021 53,765 39,393 2,717 95,875 2022 54,820 36,750 2,717 94,287 2023 56,690 33,963 2,717 93,370 2024 58,195 31,571 2,717 92,483 2025–2029 255,435 127,540 5,824 388,799 2030–2034 158,495 83,867 — 242,362 2035–2039 153,210 47,934 — 201,144 2040–2044 73,995 22,244 — 96,239 2045–2048 47,005 4,777 — 51,782
Total $ 964,480 469,960 19,409 1,453,849
This table assumes that there are no draws on letters of credit supporting variable rate debt issuances resulting in bank bonds. Bank bonds are subject to accelerated payment terms and increased interest rates. Variable rate debt issuances represent $152.8 million of the outstanding principal at August 31, 2019.
Future debt service is calculated using rates in effect at August 31, 2019 for variable rate bonds, which ranged from 1.30% to 1.40%. The variable rate received under the swaps is 70.0% of one-month London Interbank Offered Rate (LIBOR) until maturity, which was 1.59% at August 31, 2019.

PHILADELPHIA GAS WORKS (A Component Unit of the City of Philadelphia)
Notes to Basic Financial Statements August 31, 2019 and 2018
59 (Continued)
(b) Bond Issuances – Refunding of Bonds and Defeasance of Bonds 1998 Ordinance Fifteenth Series Bonds
On August 16, 2017, the City issued Gas Works Revenue Bonds, Fifteenth Series (1998 General Ordinance) in the par amount of $273.1 million. A portion of the proceeds from the sale of the Fifteenth Series Bonds were utilized to refund a portion of the Seventh Series Bonds and redeem the City’s outstanding Capital Project Notes. The Fifteenth Series Bonds also contained new money debt issued to finance a portion of PGW’s ongoing Capital Improvement Program, pay the costs of issuing the bonds, and provide a deposit to the Sinking Fund Reserve. The Fifteenth Series Bonds, with fixed interest rates that range from 2.0% to 5.0%, have maturity dates through 2047. The loss on the refunding component was $0.3 million, which will be amortized over the life of the Fifteenth Series Bonds. This refunding transaction provided net present value debt service savings of $0.7 million utilizing an arbitrage yield of 2.98%. The savings as a percentage of refunded bonds was 10.11%.
As of August 31, 2019, the Company’s Eighth Series variable rate debt was backed by letter of credit agreements, which expire on September 1, 2020 (Eighth Series C and D) or August 1, 2024 (Eighth Series B and E), respectively.
The Company’s Fifth Series A-2 variable rate bonds are backed by an irrevocable letter of credit, which had an original stated expiration date of December 21, 2019. On April 22, 2019, this letter of credit was extended for a five-year term from the original stated expiration date resulting in a new stated expiration date of December 21, 2024.
In the event that the letter of credit agreements supporting the Eighth and Fifth Series bonds are not extended or replaced prior to their expiration dates, a mandatory tender of the then outstanding bonds will occur. If such mandatory tender results in draws on the letters of credit, the bonds will become bank bonds subject to accelerated payment terms and increased interest rates.

PHILADELPHIA GAS WORKS (A Component Unit of the City of Philadelphia)
Notes to Basic Financial Statements August 31, 2019 and 2018
60 (Continued)
Interest rates and maturities of the outstanding revenue bonds are detailed as follows (thousands of U.S. dollars):
Balance outstandingMaturity date August 31
Interest rates (fiscal year) 2019 2018
5th Series A-2 Variable * 2035 $ 30,000 30,000 8th Series B Variable ** 2028 27,370 27,370 8th Series C Variable ** 2028 27,225 27,225 8th Series D Variable ** 2028 40,845 40,845 8th Series E Variable ** 2028 27,370 27,370 9th Series 2.00%–5.25% 2040 60,835 64,415 10th Series 3.00%–5.00% 2026 19,160 24,075 13th Series 3.00%–5.00% 2034 193,690 210,125 14th Series 2.00%–5.00% 2038 278,105 296,500 15th Series 2.00%–5.00% 2047 259,880 268,375
$ 964,480 1,016,300
* As of August 31, 2019, the LIBOR based rate was 1.34%.
** As of August 31, 2019, the LIBOR based rate ranged from 1.34% to 1.35%.
(c) Debt Coverage and Sinking Fund Requirements Under the terms of both general ordinances, the City is required to maintain rates to allow the Company to satisfy 1975 and 1998 revenue bond debt coverage ratio requirements. Upon issuance of the Thirteenth Series Bonds, no debt under the 1975 General Ordinance remains outstanding.
Also provided by both general ordinances is the establishment of a Sinking Fund Reserve into which deposits are made in an amount equal to the maximum annual debt service requirement on the bonds of each respective general ordinance in any fiscal year.
Funds in the Sinking Fund Reserve are to be applied to the payment of debt service if, for any reason, other funds in the Sinking Fund, which operates as a debt service payment fund into which debt service payments are deposited as they come due, should be insufficient.
The revenue bonds are, and will be, equally and ratably collateralized by a security interest in all of the Company’s project revenues, as defined in the general ordinances, and moneys in the Sinking Fund, including the Sinking Fund Reserve.
Portions of certain revenue bonds were issued as zero-coupon securities. Interest on these securities is accrued and compounded on the payment dates of the current interest bonds within the issue. The accrued interest in the amount of $8.1 million and $7.9 million in FY 2019 and FY 2018, respectively, is reported as a component of accrued accounts.

PHILADELPHIA GAS WORKS (A Component Unit of the City of Philadelphia)
Notes to Basic Financial Statements August 31, 2019 and 2018
61 (Continued)
(d) Interest Rate Swap Agreements Objective – In January 2006, the City entered into a fixed rate payor, floating rate receiver interest rate swap to create a synthetic fixed rate for the Sixth Series Bonds. The interest rate swap was used to hedge interest rate risk.
Terms – The swaps had an original termination date of August 1, 2031, which was subsequently amended to August 1, 2028. The swaps require the City to pay a fixed rate of 3.6745% and receive a variable rate equal to 70.0% of one-month LIBOR until maturity.
In August 2016, the underlying variable rate bonds maturing in FY 2017 through FY 2023 were refunded with fixed rate bonds and the related portions of the swaps, totaling $102.7 million in notional amount, were terminated. PGW made a termination payment of $13.9 million to fund this partial termination of the swaps which is included in unamortized loss on bond refunding on the Company’s balance sheet.
As of August 31, 2019, the swaps had a notional amount of $122.8 million and the associated variable rate debt had a $122.8 million principal amount, broken down by series as follows:
• The Series B swap had a notional amount of $27.4 million and the associated variable rate bonds had a $27.4 million principal amount.
• The Series C swap had a notional amount of $27.2 million and the associated variable rate bonds had a $27.2 million principal amount.
• The Series D swap had a notional amount of $40.8 million and the associated variable rate bonds had a $40.8 million principal amount.
• The Series E swap had a notional amount of $27.4 million and the associated variable rate bonds had a $27.4 million principal amount.
The final maturity date for all swaps is on August 1, 2028.
Fair Value – As of August 31, 2019, the swaps had a combined negative fair value of approximately $23.1 million. The fair values of the interest rate swaps were estimated using the zero-coupon method and are classified as Level 2 within the fair value hierarchy as described in note 1. That method calculates the future net settlement payments required by the swap, assuming current forward rates are implied by the current yield curve for hypothetical zero-coupon bonds due on the date of each future net settlement on the swaps.

PHILADELPHIA GAS WORKS (A Component Unit of the City of Philadelphia)
Notes to Basic Financial Statements August 31, 2019 and 2018
62 (Continued)
Risks – As of August 31, 2019, the City is not exposed to credit risk because the swaps had a negative fair value. Should interest rates change and the fair value of the swaps become positive, the City would be exposed to credit risk in the amount of the swaps’ fair value. The swaps include a termination event additional to those in the standard ISDA master agreement based on credit ratings. The swaps may be terminated by the City if the rating of the counterparty falls below A3 or A – (Moody’s/S&P), unless the counterparty has (i) assigned or transferred the swap to a party acceptable to the City; (ii) provided a credit support provider acceptable to the City whose obligations are pursuant to a credit support document acceptable to the City; or (iii) executed a credit support annex, in form and substance acceptable to the City, providing for the collateralization by the counterparty of its obligations under the swaps. The swaps may be terminated by the counterparty if the rating on the City of Philadelphia Gas Works Revenue Bonds falls below Baa2 or BBB (Moody’s/S&P). However, because the City’s swap payments are insured by Assured Guaranty Municipal Corporation, as long as Assured Guaranty Municipal Corporation is rated at or above A2 or A (Moody’s/S&P), the termination event based on the City’s ratings is stayed. At the present time, the rating for Assured Guaranty Municipal Corporation is at A2/AA (Moody’s/S&P). The City is exposed to (i) basis risk, as reflected by the relationship between the rate payable on the bonds and 70.0% of one-month LIBOR received on the swap, and (ii) tax risk, a form of basis risk, where the City is exposed to a potential additional interest cost in the event that changes in the federal tax system or if marginal tax rates cause the rate paid on the outstanding bonds to be greater than the 70.0% of one-month LIBOR received on the swap. The impact of the interest rate swaps on the financial statements for the years ended August 31, 2019 and 2018 is as follows (thousands of U.S. dollars):
DeferredInterest rate outflows
swap liability of resources
Balance, August 31, 2018 $ 14,796 594 Change in fair value through August 31, 2019 8,318 8,318 Amortization of terminated hedge — 1,420
Balance, August 31, 2019 $ 23,114 10,332
DeferredInterest rate outflows
swap liability of resources
Balance, August 31, 2017 $ 23,533 7,911 Change in fair value through August 31, 2018 (8,737) (8,737) Amortization of terminated hedge — 1,420
Balance, August 31, 2018 $ 14,796 594

PHILADELPHIA GAS WORKS (A Component Unit of the City of Philadelphia)
Notes to Basic Financial Statements August 31, 2019 and 2018
63 (Continued)
Because the original hedging relationship was terminated when the Sixth Series Bonds were refunded by the Eighth Series Bonds in 2009, there is a difference between the interest rate swap liability and the related deferred outflows of resources. The difference is being amortized on a straight-line basis to expense over the life of the hedge.
The interest rate swap liability is included in other noncurrent liabilities on the balance sheets.
There are no collateral posting requirements associated with the swap agreements.
(9) Defeased Debt Defeased debt of the Company (bonds issued by the Company payable from the proceeds of irrevocably pledged assets) at August 31, 2019 was as follows (thousands of U.S. dollars):
Latest date Bondsmaturing to Interest rate outstanding
9th Series 08/01/40 5.25 % $ 61,455 12th Series B 05/15/20 7.00 5,595
Total $ 67,050
The assets pledged, primarily noncallable U.S. government securities, had a market value of $69.2 million at August 31, 2019, bearing interest on face value from 1.25% to 5.88%. In FY 2019, the Fiscal Agent with respect to the Gas Works Revenue Bonds (Escrow Agent with respect to the Escrow Deposit Agreement), paid the maturing principal of the Defeased Bonds in the amount of $5.4 million in a manner consistent with the Notices of Defeasance for the 12th Series B Gas Works Revenue Bonds.
Defeased debt of the Company (bonds issued by the Company payable from the proceeds of irrevocably pledged assets) at August 31, 2018 was as follows (thousands of U.S. dollars):
Latest date Bondsmaturing to Interest rate outstanding
9th Series 08/01/40 5.25 % $ 61,455 12th Series B 05/15/20 7.00 10,910
Total $ 72,365
The assets pledged, primarily noncallable U.S. government securities, had a market value of $75.7 million at August 31, 2018, bearing interest on face value from 1.27% to 5.89%. In FY 2018, the Fiscal Agent with respect to the Gas Works Revenue Bonds (Escrow Agent with respect to the Escrow Deposit Agreement), paid the maturing principal of the Defeased Bonds in the amount of $224.1 million in a manner consistent with the Notices of Defeasance for the 7th Series, 10th Series, 12th Series B, 17th Series, and 19th Series Gas Works Revenue Bonds, respectively.

PHILADELPHIA GAS WORKS (A Component Unit of the City of Philadelphia)
Notes to Basic Financial Statements August 31, 2019 and 2018
64 (Continued)
The investments held by the trustee and the defeased bonds are not recognized on the Company’s balance sheets in accordance with the terms of the Indentures of Defeasance. The investments pledged for the redemption of the defeased debt have maturities and interest payments scheduled to coincide with the trustee cash requirements for debt service.
(10) Defined Benefit Pension Plan (a) Plan Description
The Pension Plan provides pension benefits for all eligible employees of PGW and other eligible class employees of PFMC and PGC.
The Pension Plan provides for retirement payments for vested employees at age 65 or earlier under various options, which includes a disability pension provision, a preretirement spouse or domestic partner’s death benefit, a reduced pension for early retirement, various reduced pension payments for the election of a survivor option, and a provision for retirement after 30 years of service without penalty for reduced age. In accordance with Resolutions of the PGC, Ordinances of City Council, and as prescribed by the City’s Director of Finance, the Pension Plan is being funded with contributions by PGW to the Sinking Fund Commission of the City, which serves as the Trustee. Management believes that the Pension Plan is in compliance with all applicable laws.
(b) Benefits Provided Normal Retirement Benefits: The Pension Plan provides retirement benefits as well as death and disability benefits. Retirement benefits vest after five years of credited service. Employees who retire at or after age 65 are entitled to receive an annual retirement benefit, payable monthly, in an amount equal to the greater of:
• 1.25% of the first $6,600 of Final Average Earnings plus 1.75% of the excess of Final Average Earnings over $6,600, times years of credited service, with a maximum of 60.0% of the highest annual earnings during the last 10 years of credited service or
• 2.0% of total earnings received during the period of credited service plus 22.5% of the first $1,200 annual amount, applicable only to participants who were employees on or prior to March 24, 1967.
Death Benefits: Before retirement, the death beneficiary of deceased active participants or of deferred vested participants are entitled to vested benefits provided such participants died after having attained age 45 and completed at least 15 years of Credited Service and whose age plus years of credited service equals at least 65 or whom have completed at least 15 years (effective May 15, 2015 – formerly 20 years) of Credited Service regardless of age. The benefit is payable for the death beneficiary’s remaining lifetime equal to the amount the participant would have received had the participant retired due to a disability on the day preceding his/her death and elected the 100% contingent annuitant option.
Disability Benefits: Disability benefits are the same as the Normal Retirement Benefits and are based on Final Average Compensation and Credited Service as of the date of disability.

PHILADELPHIA GAS WORKS (A Component Unit of the City of Philadelphia)
Notes to Basic Financial Statements August 31, 2019 and 2018
65 (Continued)
Final Average Earnings are the employee’s average pay, over the highest five years of the last 10 years of credited service. Employees with 15 years of credited service may retire at or after age 55 and receive a reduced retirement benefit. Employees with 30 years of service may retire without penalty for reduced age.
Except as noted in the following paragraph, covered employees are not required to contribute to the Pension Plan.
In December 2011, the Pension Plan was amended by Ordinance and a new deferred compensation plan was authorized by Ordinance as well. Newly hired employees have an irrevocable option to join either a new deferred compensation plan created in accordance with Internal Revenue Code Section 401 or the existing defined-benefit plan. The defined-contribution plan provides for an employer contribution equal to 5.5% of applicable wages. The defined-benefit plan provides for a newly hired employee contribution equal to 6.0% of applicable wages. The Ordinance did not affect the retirement benefits of active employees, current retirees and beneficiaries, or terminated employees entitled to benefits but not yet receiving them.
(c) Employees Covered by Benefit Terms At June 30, 2019, the date of the most recent actuarial valuation, the Pension Plan membership consisted of the following:
Retirees and beneficiaries currentlyreceiving benefits and terminatedemployees entitled to benefits, butnot yet receiving them 2,495
Participants:Vested 909 Nonvested 286
Total participants 1,195
Total membership 3,690
(d) Contributions The Pension Plan funding policy provides for periodic employer contributions at actuarially determined amounts that are sufficient to accumulate assets to pay benefits when due considering employee contributions required for new hires after December 2011 who elect to participate in the Pension Plan. The employer contribution is determined using the Projected Unit Credit actuarial funding method. For the fiscal years ended August 31, 2019 and 2018, the actuarially determined employer contribution was $28.8 million and $28.4 million, respectively. PGW contributed the actuarially determined contribution in both fiscal years. Employee contributions were approximately $1.2 million in the plan year ended June 30, 2019 and approximately $1.1 million in the plan year ended June 30, 2018.

PHILADELPHIA GAS WORKS (A Component Unit of the City of Philadelphia)
Notes to Basic Financial Statements August 31, 2019 and 2018
66 (Continued)
(e) Net Pension Liability The Company’s net pension liability as of August 31, 2019 and 2018 was measured as of June 30, 2019 and 2018, and the total pension liability used to calculate the net pension liability was determined by an actuarial valuation as of June 30, 2019 and June 30, 2018, respectively.
The total pension liability was determined using the entry age normal actuarial method and the following actuarial assumptions:
2019 2018
Inflation 2.00 % 2.00 %Salary increases 4.50 4.50Investment rate of return 7.30 7.30
Mortality rates: Mortality rates for FY 2018 were based on the RP-2014 mortality tables for males and females generationally projected with scale MP-2017. Mortality rates for FY 2019 were based on the RP-2014 mortality tables for males and females generationally projected with scale MP-2018.
Long-term rate of return: The long-term expected rate of return on Pension Plan investments was determined using a building-block method in which best-estimate ranges of expected future real rates of return (expected returns, net of Pension Plan investment expense and inflation) are developed for each major asset class. These ranges are combined to produce the long-term expected rate of return by weighting the expected future real rates of return by the target asset allocation percentage and by expected inflation. The target allocation and best estimates of arithmetic real rates of return for each major asset class for FY 2019 are summarized in the following table:
ExpectedAsset class Minimum Maximum Target annual return
Domestic equity 35.0 % 55.0 % 45.0 % 8.8 %International equity 10.0 30.0 20.0 8.8Fixed income 25.0 45.0 35.0 5.2Cash equivalents — 10.0 — —
100.0 %
Discount rate: The discount rate used to measure the total pension liability at June 30, 2019 and 2018 was 7.3%. The projection of cash flows used to determine the discount rate assumed that employee contributions will be made at the current contribution rate and that Company contributions will be made at rates equal to the difference between actuarially determined contribution rates and the employee contributions. Based on those assumptions, the Pension Plan’s fiduciary net position was projected to be available to make all projected future benefit payments of current active and inactive employees. Therefore, the long-term expected rate of return on Pension Plan investments was applied to all periods of projected benefit payments to determine the total pension liability.

PHILADELPHIA GAS WORKS (A Component Unit of the City of Philadelphia)
Notes to Basic Financial Statements August 31, 2019 and 2018
67 (Continued)
Changes in Net Pension Liability
(Thousands of U.S. dollars)
Increase (decrease)Total pension Plan fiduciary Net pension
liability net position liability(a) (b) (a)-(b)
Balances at September 1, 2017 $ 783,471 521,526 261,945
Changes for the year:Service cost 6,103 — 6,103 Interest 55,718 — 55,718 Differences between expected and
actual experience 15,706 — 15,706 Contributions – employer — 29,143 (29,143) Contributions – employee — 1,078 (1,078) Net investment income — 44,310 (44,310) Benefit payments, including refunds of
employee contributions (52,627) (52,627) — Administrative expenses — (184) 184 Change in assumptions (3,864) — (3,864)
Net changes 21,036 21,720 (684)
Balances at August 31, 2018 $ 804,507 543,246 261,261

PHILADELPHIA GAS WORKS (A Component Unit of the City of Philadelphia)
Notes to Basic Financial Statements August 31, 2019 and 2018
68 (Continued)
Changes in Net Pension Liability
(Thousands of U.S. dollars)
Increase (decrease)Total pension Plan fiduciary Net pension
liability net position liability(a) (b) (a)-(b)
Balances at September 1, 2018 $ 804,507 543,246 261,261
Changes for the year:Service cost 6,554 — 6,554 Interest 57,241 — 57,241 Differences between expected and
actual experience (12,089) — (12,089) Contributions – employer — 28,570 (28,570) Contributions – employee — 1,249 (1,249) Net investment income — 34,260 (34,260) Benefit payments, including refunds of
employee contributions (53,893) (53,893) — Administrative expenses — (192) 192 Change in assumptions (1,834) — (1,834)
Net changes (4,021) 9,994 (14,015)
Balances at August 31, 2019 $ 800,486 553,240 247,246
Sensitivity of the net pension liability to changes in the discount rate: The following table presents the net pension liability of the Company at June 30, 2019, calculated using the discount rate of 7.30%, as well as what the Company’s net pension liability would be if it were calculated using a discount rate that is one-percentage-point lower (6.30%) or one-percentage-point higher (8.30%) than the current rate:
Current1% Decrease discount rate 1% Increase
6.30% 7.30% 8.30%(Thousands of U.S. dollars)
Net pension liability $ 338,357 247,246 171,192
The following table presents the net pension liability of the Company at June 30, 2018, calculated using the discount rate of 7.30%, as well as what the Company’s net pension liability would be if it were

PHILADELPHIA GAS WORKS (A Component Unit of the City of Philadelphia)
Notes to Basic Financial Statements August 31, 2019 and 2018
69 (Continued)
calculated using a discount rate that is one-percentage-point lower (6.30%) or one-percentage-point higher (8.30%) than the current rate:
Current1% Decrease discount rate 1% Increase
6.30% 7.30% 8.30%(Thousands of U.S. dollars)
Net pension liability $ 354,026 261,261 183,912
Pension Plan’s fiduciary net position: Detailed information about the Pension Plan’s fiduciary net position is available in the separately issued Pension Plan financial report. Requests for additional information should be addressed to Chief Investment Officer, Philadelphia Board of Pensions and Retirements, 1500 John F. Kennedy Boulevard, Two Penn Center Plaza, 17th Floor, Philadelphia, PA 19102.
(f) Pension Expense and Deferred Outflows of Resources and Deferred Inflows of Resources Related to Pensions For the years ended August 31, 2019 and 2018, the Company recognized pension expense of $30.3 million and $43.2 million, respectively. At August 31, 2019 and 2018, the Company reported deferred outflows of resources and deferred inflows of resources related to the pension from the following sources (thousands of U.S. dollars):
August 31, 2019 August 31, 2018Deferred Deferred Deferred Deferred
outflows of inflows of outflows of inflows ofresources resources resources resources
Differences between expectedand actual experience $ 8,067 8,949 12,697 2,023
Changes of assumptions — 5,039 6,119 6,726 Net difference between
projected and actualearnings on pension planinvestments — 4,242 — 4,517
Contributions made aftermeasurement date 6,354 — 6,127 —
Total $ 14,421 18,230 24,943 13,266
The $6.4 million reported as deferred outflows of resources related to employer contributions made after the measurement date as of June 30, 2019 will be recognized as a reduction of the net pension liability in the Company’s FY 2020. Other amounts reported as deferred outflows of resources and
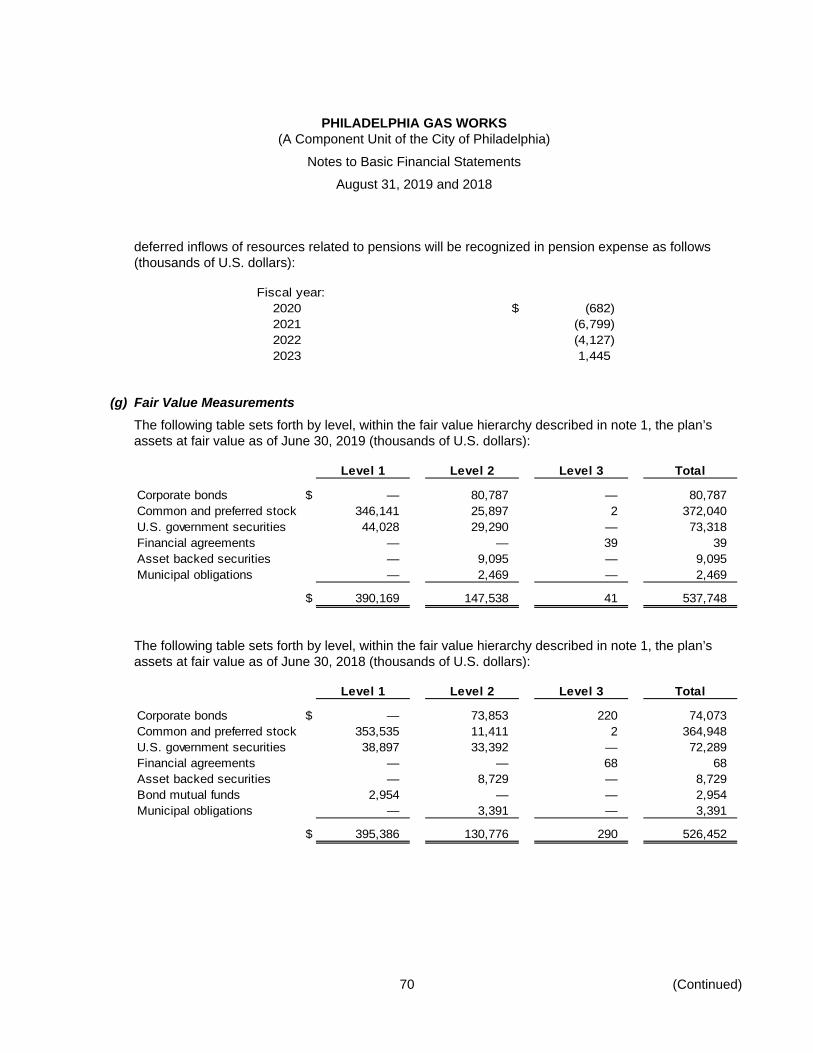
PHILADELPHIA GAS WORKS (A Component Unit of the City of Philadelphia)
Notes to Basic Financial Statements August 31, 2019 and 2018
70 (Continued)
deferred inflows of resources related to pensions will be recognized in pension expense as follows (thousands of U.S. dollars):
Fiscal year:2020 $ (682) 2021 (6,799) 2022 (4,127) 2023 1,445
(g) Fair Value Measurements The following table sets forth by level, within the fair value hierarchy described in note 1, the plan’s assets at fair value as of June 30, 2019 (thousands of U.S. dollars):
Level 1 Level 2 Level 3 Total
Corporate bonds $ — 80,787 — 80,787 Common and preferred stock 346,141 25,897 2 372,040 U.S. government securities 44,028 29,290 — 73,318 Financial agreements — — 39 39 Asset backed securities — 9,095 — 9,095 Municipal obligations — 2,469 — 2,469
$ 390,169 147,538 41 537,748
The following table sets forth by level, within the fair value hierarchy described in note 1, the plan’s assets at fair value as of June 30, 2018 (thousands of U.S. dollars):
Level 1 Level 2 Level 3 Total
Corporate bonds $ — 73,853 220 74,073 Common and preferred stock 353,535 11,411 2 364,948 U.S. government securities 38,897 33,392 — 72,289 Financial agreements — — 68 68 Asset backed securities — 8,729 — 8,729 Bond mutual funds 2,954 — — 2,954 Municipal obligations — 3,391 — 3,391
$ 395,386 130,776 290 526,452

PHILADELPHIA GAS WORKS (A Component Unit of the City of Philadelphia)
Notes to Basic Financial Statements August 31, 2019 and 2018
71 (Continued)
(11) Other Postemployment Benefits (a) Plan Description
The Company sponsors a single-employer defined-benefit healthcare plan and provided postemployment healthcare and life insurance benefits to retirees and their beneficiaries and dependents in FY 2019 and FY 2018, respectively, in accordance with their retiree medical program.
The OPEB Plan comprises (1) the PGW OPEB Trust (the Trust), which is used to receive, hold, and disburse assets accumulated to pay for some of the postemployment benefits other than pensions provided by PGW to its eligible retired employees and other eligible beneficiaries and (2) OPEB expenses paid for directly by PGW out of its general resources rather than through the Trust. The Trust was established for the exclusive benefit of PGW’s retired employees and other eligible beneficiaries designated under the plan. Management believes that the OPEB Plan is in compliance with all applicable laws.
(b) Benefits Provided Medical Benefits: For pre-65 retirees, a choice of medical plans is offered through Independence Blue Cross including Personal Choice, Blue Cross Blue Shield with Major Medical, or Keystone HMO’s. Employees who retire after December 1, 2001 are provided the Keystone 5 Plan at PGW’s expense and they can buy up to a more expensive plan. Employees who retire on or after September 1, 2007 are provided the Keystone 10 Plan at PGW’s expense, and they can buy up to a more expensive plan. Union employees who retire after August 31, 2011 are provided the Keystone 15 Plan at PGW’s expense and can buy up to a more expensive plan. Management employees who retire after August 31, 2011 continue to receive the Keystone 10 as the base plan and can buy up to a more expensive plan.
Reinsurance provides specific stop-loss coverage of $0.3 million on pre-65 Medical and Prescription Drug claims.
Eligible pre-65 retirees who relocate outside of the Keystone coverage area may elect to participate in the PGW Retiree Health Reimbursement Arrangement (HRA). Under the HRA, the Keystone base plan premium-equivalent will be credited to a participant’s HRA account and will be available to reimburse the participant for eligible medical insurance premiums.
Medicare eligible retirees are provided a fully insured Medicare Supplement Plan through Independence Blue Cross.
Opt-out benefits of $1,500 per year for single coverage and $3,000 per year for married coverage are available to eligible retirees. This benefit is not available to a married couple who both retired from PGW and who are eligible for Medicare benefits. Retirees can maintain prescription drug and dental coverage even if they opt out of medical coverage.
Prescription Drug Benefits: Employees who retired on or after April 15, 1976 and prior to December 1, 2001, are offered a Prescription Drug Plan that has been established specifically for retirees and is separate from the plan that is offered to active employees. The retiree Prescription plan consists of a

PHILADELPHIA GAS WORKS (A Component Unit of the City of Philadelphia)
Notes to Basic Financial Statements August 31, 2019 and 2018
72 (Continued)
$2 copay for generic drugs, a $2 copay for brand name drugs when no generic drugs are available, and a $15 copay for brand name drugs when generic drugs are available. There are no deductibles and no lifetime maximums. Employees who retired prior to April 15, 1976 or on or after December 1, 2001 but before September 1, 2007 have a $5 copay for generics and a $10 copay for brand drugs. Employees who retire on or after September 1, 2007 have a $5 copay for generics and a $15 copay for brand drugs.
Effective, January 1, 2012, PGW moved Medicare eligible retirees into an Employee Group Waiver Plan arrangement. Covered drugs and copays remain the same. Prescription drug benefits are self-funded for all retirees.
Dental Benefits: For employees who retired after April 15, 1978, a basic dental plan is offered at no cost to the retiree. For employees who retired after June 1, 1984, an enhanced dental plan is offered. For eligible retirees who enroll in the enhanced dental plan, the retiree must pay the difference between the basic and enhanced plans. The dental plans were fully insured through August 31, 2016. Effective September 1, 2016, the dental benefits are self-funded.
Death Benefits: Nonunion employees are offered voluntary life insurance equal to two times their salary at retirement. At age 65, the life insurance benefit decreases by 5.0% per year for 15 years until the benefit equals 25.0% of the original life insurance benefit at age 65. PGW pays the cost of the first $75,000 of coverage. Retirees in this category pay $0.35 per $1,000 per month for coverage in excess of $75,000.
Union employees are offered voluntary life insurance equal to one times their salary at retirement. At retirement, the life insurance benefit decreases by 10.0% per year for 5 years until the benefit equals 50.0% of the original life insurance benefit at retirement. Retirees in this category pay $0.35 per $1,000 of coverage per month, PGW pays the balance.
Upon the death of an active employee prior to satisfying the requirements for Preretirement Spouse’s Death Benefits, surviving spouses and dependents are entitled to receive 2 years of health coverage paid by PGW. Upon the death of an active employee on or after satisfying the requirements for Preretirement Spouse’s Death Benefits, surviving spouses and dependents are entitled to receive health coverage for life (or for 5 years if hired on or after May 21, 2011 if Union or hired on or after December 21, 2011 if Nonunion) paid by PGW.
Contributions: The OPEB Plan pays the full cost of medical, basic dental, and prescription coverage for employees who retired prior to December 1, 2001. Employees who retire after December 1, 2001 are provided the Keystone 5/Keystone 10/Keystone 15 plan at PGW’s expense and can buy up to a more expensive plan. Retirees also contribute toward enhanced dental plan and life insurance coverage as described above. PGW pays 100.0% of the cost for the prescription drug plan after drug copays.
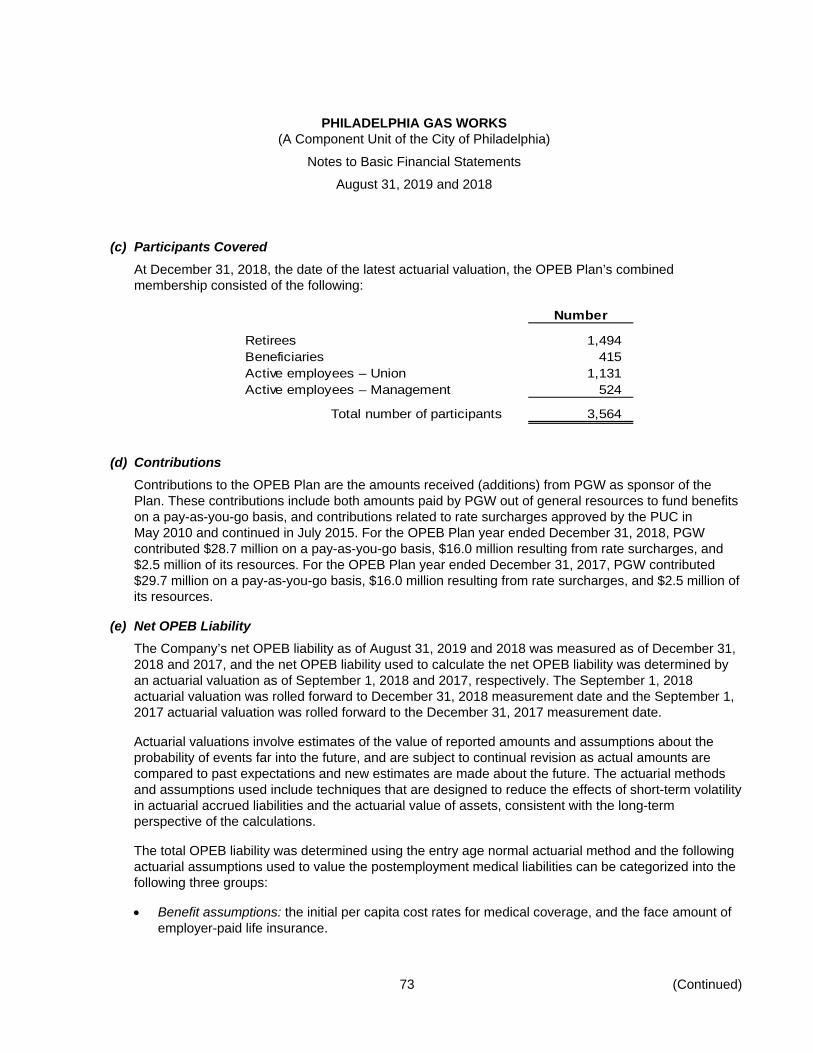
PHILADELPHIA GAS WORKS (A Component Unit of the City of Philadelphia)
Notes to Basic Financial Statements August 31, 2019 and 2018
73 (Continued)
(c) Participants Covered At December 31, 2018, the date of the latest actuarial valuation, the OPEB Plan’s combined membership consisted of the following:
Number
Retirees 1,494 Beneficiaries 415 Active employees – Union 1,131 Active employees – Management 524
Total number of participants 3,564
(d) Contributions Contributions to the OPEB Plan are the amounts received (additions) from PGW as sponsor of the Plan. These contributions include both amounts paid by PGW out of general resources to fund benefits on a pay-as-you-go basis, and contributions related to rate surcharges approved by the PUC in May 2010 and continued in July 2015. For the OPEB Plan year ended December 31, 2018, PGW contributed $28.7 million on a pay-as-you-go basis, $16.0 million resulting from rate surcharges, and $2.5 million of its resources. For the OPEB Plan year ended December 31, 2017, PGW contributed $29.7 million on a pay-as-you-go basis, $16.0 million resulting from rate surcharges, and $2.5 million of its resources.
(e) Net OPEB Liability The Company’s net OPEB liability as of August 31, 2019 and 2018 was measured as of December 31, 2018 and 2017, and the net OPEB liability used to calculate the net OPEB liability was determined by an actuarial valuation as of September 1, 2018 and 2017, respectively. The September 1, 2018 actuarial valuation was rolled forward to December 31, 2018 measurement date and the September 1, 2017 actuarial valuation was rolled forward to the December 31, 2017 measurement date.
Actuarial valuations involve estimates of the value of reported amounts and assumptions about the probability of events far into the future, and are subject to continual revision as actual amounts are compared to past expectations and new estimates are made about the future. The actuarial methods and assumptions used include techniques that are designed to reduce the effects of short-term volatility in actuarial accrued liabilities and the actuarial value of assets, consistent with the long-term perspective of the calculations.
The total OPEB liability was determined using the entry age normal actuarial method and the following actuarial assumptions used to value the postemployment medical liabilities can be categorized into the following three groups:
• Benefit assumptions: the initial per capita cost rates for medical coverage, and the face amount of employer-paid life insurance.

PHILADELPHIA GAS WORKS (A Component Unit of the City of Philadelphia)
Notes to Basic Financial Statements August 31, 2019 and 2018
74 (Continued)
• Demographic assumptions: including the probabilities of retiring, dying, terminating (without a benefit), becoming disabled, recovery from disability, election (participation rates) and coverage levels.
• Economic assumptions: the discount rate and health care cost trend rates. Benefit assumptions:
• Per capita claims: Using actuarial standards, specifically ASOP6, the annual age specific per capital claims cost rate were projected at the following assumed trend rates for future years (whole U.S. dollars):
MedicalExisting retirees Future retirees Prescription
Age and dependents and dependents drug
<50 $ 6,622 6,602 2,804 50–54 8,050 8,025 3,099 55–59 10,070 10,040 3,877 60–64 12,130 12,094 4,670 65–69 2,219 2,108 3,446 70–74 2,535 2,408 3,936 75–79 2,826 2,684 4,387 80–84 3,058 2,905 4,748 85–90 3,182 3,022 4,941 90+ 3,230 3,068 5,015
• Life insurance: The claims cost for life insurance is based on the actuarial present value of projected life insurance claims increased by 15.0% to reflect the cost of the insurance funding vehicle.
• Morbidity: The below healthcare cost for prescription drug coverage and pre-65 medical coverage reflects the following changes due to increased usage as a result of aging:
AnnualAge increase
55–59 4.00 %60–64 3.50 %65–69 3.00 %70–74 2.50 %75–79 2.00 %80–84 1.00 %85+ 0.50 %

PHILADELPHIA GAS WORKS (A Component Unit of the City of Philadelphia)
Notes to Basic Financial Statements August 31, 2019 and 2018
75 (Continued)
Demographic assumptions:
• Mortality rates: Mortality is assumed to follow the sex-distinct RP-2014 Employee, Healthy Annuitant and Disabled Retiree Mortality Tables (head-count weighted) projected with scale MP-2018.
• Retirement rates: Retirement rates applicable once an employee is eligible for retirement benefits vary by age and service with rates as follows:
Service Serviceless than at least
Age 30–years 30–years
55–60 10.0 % 15.0 %61 10.0 % 30.0 %
62–64 25.0 % 50.0 %65–69 50.0 % 50.0 %70+ 100.0 % 100.0 %
• Withdrawal rates: Turnover rates applicable before an employee is eligible for retirement benefits vary by age and service with illustrative rates as follows:
Years of serviceAge 0 1 2 3 4 5
20 23.2 % 17.4 % 14.4 % 11.6 % 8.8 % 5.8 %25 18.8 % 14.0 % 11.8 % 9.4 % 7.0 % 4.6 %30 14.8 % 11.0 % 9.2 % 7.4 % 5.6 % 3.6 %35 11.2 % 8.4 % 7.0 % 5.6 % 4.2 % 2.8 %40 8.8 % 6.6 % 5.6 % 4.4 % 3.4 % 2.2 %45 7.2 % 5.4 % 4.6 % 3.6 % 2.8 % 1.8 %50 5.2 % 3.8 % 3.2 % 2.6 % 2.0 % 1.2 %55 — % — % — % — % — % — %

PHILADELPHIA GAS WORKS (A Component Unit of the City of Philadelphia)
Notes to Basic Financial Statements August 31, 2019 and 2018
76 (Continued)
• Disability rates: Disability rates vary by age with illustrative rates as follows:
Percent expectedto become
disabled in theAge next year
30 0.16 %35 0.07 %40 0.11 %45 0.22 %50 0.46 %55 1.02 %60 1.62 %
Economic assumptions:
• Long-term rate of return: The long-term expected rate of return on OPEB Plan investments was determined using a building block method in which best estimate ranges of expected future real rates of return (expected returns, net of OPEB Plan investment expense and inflation) are developed for each major asset class. These ranges are combined to produce the long-term expected rate of return by weighting the expected future real rates of return by the target asset allocation percentage and by expected inflation. The target allocation for each major asset class as of December 31, 2018 is summarized in the following table:
ExpectedAsset class Minimum Maximum Target annual return
Domestic equity large cap 27.5 % 37.5 % 32.5 % 7.0 %Domestic equity small cap 10.0 15.0 12.5 6.8Emerging market equity 5.0 10.0 7.5 10.4International equity 15.0 20.0 17.5 7.9Fixed income 20.0 40.0 30.0 4.1Commodities/Real Assets — 10.0 — —Cash equivalents — 5.0 — —
100.0 %

PHILADELPHIA GAS WORKS (A Component Unit of the City of Philadelphia)
Notes to Basic Financial Statements August 31, 2019 and 2018
77 (Continued)
• Healthcare cost trend:
Fiscal yearbeginning Medical Medical
(September 1) (pre-65) (post-65) Prescription Dental
2018 6.0 % 4.5 % 8.5 % 4.0 %2019 5.5 4.5 8.0 4.02020 5.0 4.5 7.5 4.02021 4.5 4.5 7.0 4.02022 4.5 4.5 6.5 4.02023 4.5 4.5 6.0 4.02024 4.5 4.5 5.5 4.02025 4.5 4.5 5.0 4.02026 4.5 4.5 4.5 4.0
Healthcare cost trend rates

PHILADELPHIA GAS WORKS (A Component Unit of the City of Philadelphia)
Notes to Basic Financial Statements August 31, 2019 and 2018
78 (Continued)
• Discount rate: The discount rate used for determining the total OPEB liability is the long-term expected rate of return on plan investments of 7.30% as of December 31, 2018 and December 31, 2017 and 7.95% as of December 31, 2016 and 2015, which represents the long-term expected rate of return on Plan investments at the applicable measurement date.
Changes in Net OPEB Liability
(Thousands of U.S. dollars)
Increase (decrease)Total OPEB Plan fiduciary Net OPEB
liability net position liability(a) (b) (a)-(b)
Balances at September 1, 2017 $ 489,979 139,623 350,356
Changes for the year:Service cost 5,180 — 5,180 Interest 38,182 — 38,182 Differences between expected and
actual experience (5,345) — (5,345) Assumption changes 61,382 — 61,382 Benefit payments (29,747) — (29,747) Contributions-employer — 48,247 (48,247) Project investment return on year — 11,834 (11,834) Plan asset gain/(loss) — 10,835 (10,835) Benefit payments — (29,747) 29,747 Administrative expenses and bank fees — (49) 49
Net changes 69,652 41,120 28,532
Balances at August 31, 2018 $ 559,631 180,743 378,888

PHILADELPHIA GAS WORKS (A Component Unit of the City of Philadelphia)
Notes to Basic Financial Statements August 31, 2019 and 2018
79 (Continued)
Changes in Net OPEB Liability
(Thousands of U.S. dollars)
Increase (decrease)Total OPEB Plan fiduciary Net OPEB
liability net position liability(a) (b) (a)-(b)
Balances at September 1, 2018 $ 559,631 180,743 378,888
Changes for the year:Service cost 6,268 — 6,268Interest 40,262 — 40,262Differences between expected — —
and actual experience (64,606) — (64,606)Assumption changes 7,707 — 7,707Benefit Payments (28,729) — (28,729)Contributions-employer — 47,229 (47,229)Project investment return on year — 13,868 (13,868)Plan asset gain/(loss) — (28,622) 28,622Benefit payments — (28,729) 28,729Administrative expenses and bank fees — (35) 35
Net changes (39,098) 3,711 (42,809)
Balances at August 31, 2019 $ 520,533 184,454 336,079
Sensitivity of the Net OPEB Liability to Changes in the Discount Rate: The following presents the Net OPEB liability of the Company, as well as what the Net OPEB liability would be if it were calculated using a discount rate that is one-percentage-point lower or one-percentage-point higher than the current discount rate:
Current1% Decrease discount rate 1% Increase
6.30% 7.30% 8.30%(Thousands of U.S. dollars)
Net OPEB liability $ 281,338 336,078 402,473
Sensitivity of the Net OPEB Liability to Changes in the Healthcare Cost Trend Rates: The following presents the Net OPEB liability of the Company, as well as what the Net OPEB liability would be if it

PHILADELPHIA GAS WORKS (A Component Unit of the City of Philadelphia)
Notes to Basic Financial Statements August 31, 2019 and 2018
80 (Continued)
were calculated using healthcare cost trend rates are one-percentage-point lower or one-percentage-point higher than the current healthcare cost trend rates:
Currenthealthcare cost
1% Decrease trend rates 1% Increase6.30% 7.30% 8.30%
(Thousands of U.S. dollars)
Net OPEB liability $ 280,394 336,078 404,279
OPEB Plan’s fiduciary net position: Detailed information about the OPEB Plan’s fiduciary net position is available in the separately issued OPEB Plan financial report. Requests for additional information should be addressed to Administrator – PGW OPEB Trust, 800 W. Montgomery Avenue, Philadelphia, Pennsylvania 19122.
(f) OPEB Expense and Deferred Outflow of Resources and Deferred Inflows of Resources Related to Other Postemployment Benefits For the years ended August 31, 2019 and 2018, the Company recognized OPEB expense of $28.4 million and $32.9 million, respectively. At August 31, 2019 and 2018, the Company reported deferred outflows of resources and deferred inflow of resources related to other postemployment benefits from the following sources (thousands of U.S. dollars):
August 31, 2019 August 31, 2018Deferred Deferred Deferred Deferred
outflows of inflows of outflows of inflows ofresources resources resources resources
Differences between expectedand actual experience $ — 67,281 — 22,860
Changes of assumptions 42,995 2,593 49,106 3,889 Net difference between
projected and actualearnings on OPEB planinvestments 15,919 — — 9,385
Contributions made aftermeasurement date 32,262 — 31,942 —
Total $ 91,176 69,874 81,048 36,134
The $32.3 million and $31.9 reported as deferred outflows of resources related to employer contributions made after the measurement date as of December 31, 2018 and 2017, respectively, will be recognized as a reduction of the net OPEB liability in FY 2019 and FY 2018, respectively. Other

PHILADELPHIA GAS WORKS (A Component Unit of the City of Philadelphia)
Notes to Basic Financial Statements August 31, 2019 and 2018
81 (Continued)
amounts reported as deferred outflows of resources and deferred inflows of resources related to OPEB will be recognized in OPEB expense as follows (thousands of U.S. dollars):
Fiscal year:2020 $ (4,345) 2021 (4,345) 2022 3,385 2023 (5,655)
(g) Fair Value Measurements All investments of the OPEB Plan at both December 31, 2019 and 2018 are publicly traded mutual funds categorized in Level 1 of the fair value hierarchy.
(12) Defined Contribution Pension Plan PGW contributes to a defined-contribution pension plan, for all employees hired after May 21, 2011 (Union) or December 8, 2011 (Nonunion) who elect not to contribute to the defined-benefit plan. The Defined Contribution Plan is administered by the PGW Investment Committee. Benefit terms, including contribution requirements, for the Defined Contribution Plan are established and may be amended by Ordinance of the City. For each employee in the Defined Contribution Plan, the Company is required to contribute annually 5.5% of applicable wages to an individual employee account. Employees are not required to make contributions to the plan. For the years ended August 31, 2019 and 2018, the Company recognized pension expense of $1.6 million and $1.5 million, respectively, for the Defined Contribution Plan.
Participants are immediately vested in Company contributions and earnings on Company contributions.
The Company had no accrued liabilities for contributions payable to the Defined Contribution Plan at August 31, 2019 and 2018.
The Defined Contribution Plan (DC) is a “tax-qualified” 401 (a) plan that is designed to comply with appropriate federal tax laws under the Internal Revenue Code (Tax Code). The DC Plan is a “defined contribution” plan as defined by the Tax Code. It is considered a “defined contribution” plan because the benefit consists of a defined contribution made by PGW for the benefit of the employee. The defined contribution is calculated as an amount equal to five and one half percent (5.5%) of the employee’s applicable wages. These amounts are deposited into an account for the benefit of the employee under the guidelines of the plan. The funds contributed by PGW to the plan immediately vest to the benefit of the employee. The Company contributed $1.6 million in FY 2019 and $1.5 million in FY 2018. PGW’s contributions are accounted for as part of administrative and general expenses.
(13) Pollution Remediation Obligation The Company recorded an additional liability for pollution remediation obligations of $3.6 million and $0.7 million for FY 2019 and FY 2018, respectively. The pollution remediation liability is reflected in other noncurrent and current liabilities. In accordance with U.S. GAAP for regulated entities, the Company has also recognized the long-term portion of its environmental remediation liability as a regulatory asset

PHILADELPHIA GAS WORKS (A Component Unit of the City of Philadelphia)
Notes to Basic Financial Statements August 31, 2019 and 2018
82 (Continued)
because based on available evidence it is probable that the previously incurred costs will be recovered through rates.
The pollution remediation obligations at August 31, 2019 and 2018 were $39.1 million and $34.2 million, respectively, which reflect the provisions of GASB Statement No. 49, Accounting and Financial Reporting for Pollution Remediation Obligations.
(14) Risk Management The Company is exposed to various risks of loss related to torts, theft of, damage to, and destruction of assets, errors and omissions, injuries to employees, and natural disasters. While self-insured for many risks, the Company purchases insurance coverage where appropriate. The Company’s real and personal property is insured against the risk of loss or damage in the amount of $250.0 million, subject to a $0.3 million per accident deductible at the Richmond and Passyunk Plants and a $0.1 million per accident deductible at all other locations. There are separate sublimits for flood and earth movement at select locations. The Company’s Property Insurance includes coverage for damage incurred from a terrorist attack. In addition, the Company maintains Blanket Crime, which is a form of Property Insurance.
The Company maintains $210.0 million in liability (including terrorism) coverage, insuring against the risk of damage to property, or injury to the public with a $1.0 million per occurrence self-insured retention.
The Company maintains statutory limits for Workers’ Compensation (including terrorism) with a $0.5 million per occurrence self-insured retention.
The Company maintains a $30.0 million Public Officials Liability (Directors and Officers Liability) policy with a $0.5 million retention as well as a $60.0 million Fiduciary Liability policy with a $0.2 million self-insured retention.
The Company maintains $5.0 million in Environmental Liability coverage for liability arising from nonowned Disposal Sites subject to an each incident deductible of $0.1 million, as well as a $5.0 million Cyber (Privacy) Liability policy with a $0.3 million retention covering costs arising from a data or security breach. The Cyber policy limits were increased to $10.0 million with the policy renewal effective September 1, 2019.
The Company maintains a medical stop-loss insurance program for its self-insured healthcare plans. The coverage provides for a $0.3 million deductible per covered participant.
The Company has evaluated all open claims as of August 31, 2019 and has appropriately accrued for these claims on the balance sheets.

PHILADELPHIA GAS WORKS (A Component Unit of the City of Philadelphia)
Notes to Basic Financial Statements August 31, 2019 and 2018
83 (Continued)
Claims and settlement activity for occurrences excluded under the provisions of insurance policies for injuries and damages are as follows (thousands of U.S. dollars):
Current year CurrentBeginning of claims and Claims End of year liabilityyear reserve adjustments settled reserve amount
Fiscal year ended August 31:2019 $ 14,064 (1,582) (2,922) 9,560 3,925 2018 14,377 2,910 (3,223) 14,064 6,100 2017 10,493 6,681 (2,797) 14,377 4,627
(15) Commitments and Contingencies Commitments
Commitments for major construction and maintenance contracts were approximately $36.9 million and $41.2 million, as of August 31, 2019 and 2018, respectively.
The Company is committed under various noncancelable operating lease agreements to pay minimum annual rentals as follows (thousands of U.S. dollars):
2020 $ 817 2021 460 2022 418
Rent expense for the fiscal years ended August 31, 2019 and 2018 amounted to $2.0 million and $1.9 million, respectively.
The Company, in the normal course of conducting business, has entered into long-term contracts for the supply of natural gas, firm transportation, and long-term firm gas storage service. The Company’s cumulative obligations for demand charges for all of these services are approximately $7.0 million per month.
The Company has entered into seasonal contracts with suppliers providing the Company the ability to fix the price of the purchase of natural gas during the operating season of November through March. The Company also has seasonal contracts with suppliers providing the Company with the ability to fix the price of natural gas during the refill season of April through October.
The Company’s amended FY 2020 Capital Budget was approved by City Council in the amount of $127.7 million. Within this approval, funding was provided to continue the implementation of an 18-mile CIMR Program. The cost for this program in FY 2020 is expected to be $29.0 million. The total six-year cost of the CIMR Program is forecasted to be $185.1 million. In addition to the 18-mile CIMR Program, the FY 2020 Capital Budget includes funding for an accelerated CIMR Program which PGW will include in its DSIC surcharge. This incremental program in FY 2020 is expected to cost $33.0 million. The total six-year cost of this incremental program is forecasted to be $198.0 million. The FY 2020 Capital Budget also

PHILADELPHIA GAS WORKS (A Component Unit of the City of Philadelphia)
Notes to Basic Financial Statements August 31, 2019 and 2018
84 (Continued)
includes $3.8 million for the purchase of smartpoint devices for the Automatic Meter Infrastructure (AMI) units, which will replace the Automatic Meter Reading (AMR) devices. The total six-year cost of this program to replace AMR units is approximately $23.2 million.
Contingencies
The Company’s material legal proceedings are as described below. The Company believes that it has valid defenses to these legal proceedings and intends to defend them vigorously. PGW records reserves for estimated losses from contingencies when information available indicates that a loss is probable and the amount of the loss, or range of loss, can be reasonably estimated. Management has assessed the following matters based on current information and made a judgment concerning their potential outcomes, considering the nature of the claim, the amount and nature of damages sought, and the probability of success. The Company is unable to predict the outcome of these legal proceedings or reasonably estimate the scope or amount of any associated costs and potential liabilities.
Philadelphia Gas Works, Petitioner v. Pennsylvania Public Utility Commission and SBG Management Services, et. al., Respondents, Pennsylvania Commonwealth Court Docket Nos. 1291 CD 2018, 1405 CD 2018 and 1404 CD 2018. These are an appeal by PGW dated October 19, 2018 from the Orders of the Pennsylvania Public Utility Commission issued (a) December 8, 2016, and the related Opinions and Orders denying reconsideration that were issued on May 18, 2018 and on August 23, 2018; (b) September 20, 2018; and (c) October 4, 2018.
Eight complaints were filed by landlords and by SBG Management Services, Inc. (collectively, SBG), the property management company that manages the day-to-day operations of certain residential properties owned by the landlords. The complaints which challenged amounts owned by SBG to PGW that, inter alia, were subject to late payment charges by PGW were divided into three groups by the Commission. The Commission’s Regulations and PGW’s Commission approved tariff authorizes PGW to charge interest (in the form of a late payment charge) at the rate of 1.5% per month on the overdue balance of a utility bill. In addition, if a customer does not pay for natural gas services provided by PGW, a municipal lien (which is created by operation of the Pennsylvania Municipal Claim and Tax Lien Law, 53 P.S. §§ 7101, et. seq. (MCTLL)) may be docketed with the appropriate local court. The Commission held that it lacks jurisdiction over unpaid amounts for natural gas service provided by PGW when a municipal lien is docketed under the MCTLL. Based upon that conclusion, the Commission determined that once a lien is docketed, PGW may not apply rules set forth in its Commission-approved tariff to the arrearage amount giving rise to the lien and may not show that arrearage amount on its monthly bills to nonpaying customers. The PUC assessed civil penalties in the total amount of approximately $0.1 million against PGW, ordered PGW to refund sums totaling approximately $1.0 million to the complainants, correct its practices in the assessment of late payment charges on unpaid balances, and modify the payment application sequence associated with partial payments. This would require PGW to make changes to PGW’s billing system.

PHILADELPHIA GAS WORKS (A Component Unit of the City of Philadelphia)
Schedule of Findings and Responses August 31, 2019 and 2018
85
In response, PGW filed the present appeals with the Pennsylvania Commonwealth Court (at Docket Nos. 1291 CD 2018, 1404 CD 2018 and 1405 CD 2018) from the Commission’s decision in each group of complaints. Oral argument before the Court took place on November 12, 2019. On December 9, 2019, the Court reversed the orders of the PUC, finding that: (i) the PUC committed an error of law in holding that it lacked jurisdiction over gas charges subject to docketed liens, (ii) the PUC committed an error of law in holding that PGW could not continue to impose late fees of 1.5% per month on delinquent accounts once the City dockets a lien, and (iii) the PUC erred in imposing penalties, ordering refunds of previously imposed late fees, and directing billing changes relating to charges subject to docketed liens. At this time, no appeal of the Court’s decision has been taken by the other participants in the cases. PGW cannot predict, with any degree of certainty, the outcome of any potential appeal or the potential range of loss, however, the Company believes that there is a sound basis for the positions advanced by PGW and adopted by the Commonwealth Court.

PHILADELPHIA GAS WORKS(A Component Unit of the City of Philadelphia)
Required Supplementary Information (Unaudited)
Schedule of Changes in Net Pension Liability and Related Ratios
(Thousands of U.S. dollars)
Fiscal year ending2019 2018 2017 2016 2015 2014
Total pension liability:Service cost $ 6,554 6,103 5,823 5,399 4,890 8,924 Interest cost 57,241 55,718 55,443 55,903 52,377 47,098 Changes in benefit terms — — — — — —Differences between expected and actual experience (12,089) 15,706 2,182 (8,840) 17,961 59,326 Changes in assumptions (1,834) (3,864) (7,952) 26,748 44,876 —Benefit payments (53,893) (52,627) (51,376) (50,447) (46,917) (42,913)
Net change in total pension liability (4,021) 21,036 4,120 28,763 73,187 72,435
Total pension liability (beginning) 804,507 783,471 779,351 750,588 677,401 604,966
Total pension liability (ending) 800,486 804,507 783,471 779,351 750,588 677,401
Plan fiduciary net position:Contributions – employer 28,570 29,143 27,918 21,123 21,106 24,934 Contributions – employee 1,249 1,078 852 602 393 239Net investment income 34,260 44,310 61,003 2,872 24,472 75,303 Benefit payments (53,893) (52,627) (51,376) (50,447) (46,917) (42,913) Administrative expense (192) (184) (129) (1,611) (1,480) (732)
Net change in fiduciary net position 9,994 21,720 38,268 (27,461) (2,426) 56,831
Plan fiduciary net position (beginning) 543,246 521,526 483,258 510,719 513,145 456,314
Plan fiduciary net position (ending) 553,240 543,246 521,526 483,258 510,719 513,145
Net pension liability (ending) $ 247,246 261,261 261,945 296,093 239,869 164,256
Net position as a percentage of pension liability 69.11 % 67.53 % 66.57 % 62.01 % 68.04 % 75.75 %
Covered payroll for the year ended June 30, $ 98,454 101,271 94,767 90,860 95,187 103,530
Net pension liability as a percentage of covered payroll 251.13 % 257.98 % 276.41 % 325.88 % 252.00 % 158.66 %
Notes to schedule:
The amounts presented in each fiscal year were determined as of the June 30 that occurred within the fiscal yearHistorical information:
The Company has presented the information noted above for those years for which information is available.Ten-year trend information will be presented prospectively
Changes in assumptions:Investment Rate of Return: 7.30% in 2016-2019, 7.65% in 2015, 7.95% in 2014Mortality Rates: Adopted RP-2014 static mortality table in FY 2016 generationally projected with scale MP-2015 in FY 2016,MP-2016 in FY 2017, MP-2017 in FY 2018, and MP-2018 in FY 2019; RP-2000 static mortality projected to the year of valuation prior to FY 2016
Unaudited – see accompanying independent auditors’ report.
86

PHILADELPHIA GAS WORKS(A Component Unit of the City of Philadelphia)
Required Supplementary Information (Unaudited)
Schedule of Pension Contributions
(Thousands of U.S. dollars)
Fiscal year ending 2019 2018 2017 2016 2015 2014 2013 2012 2011 2010
Actuarially determined contribution $ 28,797 28,395 29,260 26,476 21,526 24,385 23,673 23,802 22,936 23,099Contributions made 28,797 28,395 29,260 26,476 21,526 24,385 23,673 23,802 22,936 23,099
Contribution deficiency/(excess) $ — — — — — — — — — —
Covered payroll for the year ended August 31, $ 99,494 97,431 91,176 87,416 91,579 99,606 101,968 102,279 102,279 102,103
Contributions as a percent of covered payroll 28.94 % 29.14 % 32.09 % 30.29 % 23.51 % 24.48 % 23.22 % 23.27 % 22.42 % 22.62 %
Notes to schedule:
Actuarial Valuation Date: July 1 for FY 2015-2018 and September 1 for prior periodsMethods and assumptions used to determine contributions:
Actuarial Cost Method: Projected Unit CreditAsset Valuation Method: Assets smoothed over a five-year period beginning in FY 2016 and Market Value in FY 2015 and prior periodsAmortization Method: Contributions based on greater of 20-year level dollar open amortization method or 30-year level dollar closed amortization methodSalary Increases: 4.50%General Inflation: 2.00%Investment Rate of Return: 7.30% in FY 2019, 7.30% in FY 2016-2018, 7.65% in FY 2015Mortality Rates: RP-2014 static mortality generationally projected with scale MP-2014 in FY 2015, MP-2015 in FY 2016, MP-2016 in FY 2017, MP-2017 in FY 2018 and MP-2018 in FY 2019
RP-2000 static mortality projected to the year of valuation for all periods prior to 2015
Unaudited – see accompanying independent auditors’ report.
87

PHILADELPHIA GAS WORKS(A Component Unit of the City of Philadelphia)
Required Supplementary Information (Unaudited)
Schedule of Changes in the Net OPEB Liability and Related Ratios
(Thousands of U.S. dollars)
Fiscal year ending2019 2018 2017
Total OPEB liability:Service cost $ 6,267 5,180 5,315Interest cost 40,262 38,182 39,961Differences between expected and actual experience (64,606) (5,345) (30,973) Changes in assumptions 7,708 61,382 (6,481) Benefit payments (28,729) (29,747) (30,370)
Net change in total OPEB liability (39,098) 69,652 (22,548)
Total OPEB liability (beginning) 559,631 489,979 512,527
Total OPEB liability (ending) 520,533 559,631 489,979
Plan fiduciary net position:Contributions – employer 47,229 48,247 48,870Investment income (14,755) 22,669 10,710Benefit payments (28,729) (29,747) (30,370) Administrative, investment management expenses and bank fees (34) (49) (30)
Net change in plan fiduciary net position 3,711 41,120 29,180
Plan fiduciary net position (beginning) 180,743 139,623 110,443
Plan fiduciary net position (ending) 184,454 180,743 139,623
Net OPEB liability (ending) $ 336,079 378,888 350,356
Plan fiduciary net position as a percentage of the total OPEB liability 35.4 % 32.3 % 28.5 %
Covered employee payroll for the year ended December 31, 120,132 118,636 109,440
Net OPEB liability as a percentage of covered employee payroll 279.76 % 319.37 % 320.14 %
Notes to Schedule:
The amounts presented for each fiscal year were determined as of the calendar-year end that occurred withinthe fiscal yearHistorical information:
The Company has presented the information noted above for those years for which information is availableTen-year trend information will be presented prospectively.
Changes in assumptions:Discount rate: 7.30% in 2018 and in 2017, 7.95% in 2016Mortality Rates: Adopted the sex-distinct RP-2014 Employee, Healthy Annuitant and Disabled RetireeMortality Tables (head-count weighted) projection with scale MP-2018, MP-2017, MP-2015 in 2016
Unaudited – see accompanying independent auditors’ report.
88

PHILADELPHIA GAS WORKS(A Component Unit of the City of Philadelphia)
Required Supplementary Information (Unaudited)
Schedule of OPEB Contributions
(Thousands of U.S. dollars)
Fiscal year ending 2019 2018 2017 2016 2015 2014 2013 2012 2011 2010
Actuarially determined contribution $ 33,405 37,638 37,639 41,782 37,980 38,062 41,216 47,071 46,622 50,152 Contributions made 47,548 47,114 48,065 49,551 48,847 44,362 42,242 44,486 41,719 21,706
Contribution deficiency/(excess) $ (14,143) (9,476) (10,426) (7,769) (10,867) (6,300) (1,026) 2,585 4,903 28,446
Covered employee payroll for the year ended August 31, 128,642 130,171 119,667 112,956 114,074 115,174 110,120 106,308 106,943 106,637
Contributions as a percent of covered employee payroll 36.96 % 36.19 % 40.17 % 43.87 % 42.82 % 38.52 % 38.36 % 41.85 % 39.01 % 20.36 %
Notes to schedule:Actuarial Valuation Date: September 1 (beginning of each fiscal year)Methods ad assumptions used to determine contributions:
Actuarial Cost Method: Entry Age Cost MethodAsset Valuation Method: Market ValuePer Capita Claims: ASOP Actuarial StandardsSalary Increases: 4.5% in FY 2015 through 2019, and 3.0% in prior periodsGeneral Inflation: 3.0%Participation Rates: Assumed 100.0% of future retirees who meet the eligibility requirements will participate in the OPEB plan. Current retirees who have opted out of coverage are assumed to continue to receive opt out payments in the futureLife Insurance: The claims cost for life insurance is based on the actuarial present value of projected life insurance claims increased by 15.0% to reflect the cost of the insurance funding vehicle.Discount rate: 7.30% in FY 2019 through 2017, 7.95% in FY 2013 through FY 2016, 8.00% in FY 2011 and 2012, and 5.00% in prior periodsMortality Rates: Adopted the sex-distinct RP-2014 Employee, Healthy Annuitant and Disabled Retiree Mortality tables (head-count weighted) projection with scale MP-2018 in FY 2019, MP-2017 in FY 2018, MP-2016 in FY 2017, MP-2015 in 2016,
MP-2014 in FY 2015, and the 2014 Static Annuitant and Non-Annuitant Mortality table as set forth in Treasury Regulation Section 1.430(h)(3)-1(e) in FY 2014, the 2013 Static Annuitant and Non-Annuitant Mortality table as set forth in TreasuryRegulation Section 1.430(h)(3)-1(e) in FY 2013, the 2012 Static Annuitant and Non-Annuitant Mortality table as set forth in Treasury Regulation Section 1.430(h)(3)-1(e) in FY 2012, and the RP2000 Combined Health Mortality Table in FY 2011and prior years
Unaudited – see accompanying independent auditors’ report.
89