Embed Size (px)
Citation preview
City of Philadelphia
Child Death Review Report 2009-2010 A report that describes and discusses child deaths, 2009-2010, that were reviewed by the Philadelphia Child Death Review Teams April 2013
Dedication and Acknowledgments This report is but a small representation of the hard work of numerous individuals across the Philadelphia region –the former and the current members of the Philadelphia Child Death Review teams, the Fatality Review Program staff members, and countless others who play a role in the lives of the children of Philadelphia. It is through quality data gathering and analysis that we can hope to frame the public health problem at hand. And it is only from there that we can make informed recommendations for public health interventions ‐ actions that may ultimately prevent future child deaths. The Philadelphia Child Death Review team members, despite dealing with copious amounts of data at their meetings, always keep in mind that every child’s death is not just a number, but a tragic loss for the family and the greater community. We dedicate this report to the memory of the many infants, children, and youth we have reviewed.
Philadelphia Department of Public Health
Medical Examiner’s Office
Donald F. Schwarz, MD, MPH – Commissioner
Sam P. Gulino, MD – Chief Medical Examiner
Roy Hoffman, MD, MPH – Medical Director, Fatality Review Program David Bissell, MPH – Program Coordinator, Fatality Review Program
Rebecca Drake, MPH – Epidemiologist/Data Manager
With Assistance From: Ugo Chizea‐Abuah, MSPH – Former Program Coordinator, Fatality Review Program
Alessandra Elkovitch – Research Assistant, University of Pennsylvania
Philadelphia Child Death Review Team Members (2009‐2011)
Adult Parole and Probation Department Charles Hoyt, Kate Somerville, Aneesha Shabazz
Anti‐Violence Partnership of Philadelphia Julie Rausch, Myra Maxwell Asia Adams SAVE Our Children Foundation Shelah Harper Community Behavioral Health Mary Ellen Robinson Children’s Hospital of Philadelphia Dr. Sarah Frioux, Dr. Heather McKeag, Dr. Laura Brennan, Dr. Hiu‐Fai Fong
Department of Behavioral Health Dr. Gail Edelsohn, Patty Stewart‐Taylor, Joanne Butler Department of Human Services Vanessa Williams‐Cain, Jeanette Pringle, Jacqueline Cunningham, Belinda Moody, Steven Oakman, Thomas Cieslinski, Theresa Childers, Timene Farlow District Attorney’s Office Jack O’Neill, Sian Fernas, Namratha Ravikant, Rochelle Keyhan, George Mosee, Jr Every Murder Is Real Victoria Greene Federal Bureau of Investigation Elisa Lehman Germantown/Albert Einstein Crisis Response Center Dr. Guillermo Otero Perez, Angela Cantwell Office of Supportive Housing Valerie Carter, Lauren Tucker Mantua Against Drugs C.B. Kimmins Mothers In Charge Phyliss Gibson, Dorothy Johnson‐Speight
Philadelphia Alliance Alyssa Goodin Philadelphia Courts Kenneth Freeman, Bernie Price, Lynn Roman Philadelphia Department of Public Health Erica Brown‐Brandon, Dr. Susan Robbins, Amber Brubaker, Sylvia Urrata, Laura Hinds, Dr. Sam Gulino Philadelphia Health Management Corporation Steven Rodgers (ChildLink) Philadelphia Fire Department Ryan Morrison, Lt. Brian Ackerman, Lt. Crystal Yates, Mark Stewart, Michele French Pickens Philadelphia Legal Assistance Belinda Holguin, Ileana Garcia, Susan Pearlstein Philadelphia Police Department Det. Jim Griffin, Sgt. John Spence, Ofc. Kathy Battle, Ofc. Janet Jones Philadelphia School District Tamika Purvines, Michael Andrews, Paul Callahan St. Christopher’s Hospital for Children Dr. Edgar Collazo, Dr. Maria McColgan, Dr. Daniel Taylor, Dr. Raquel Mora Temple University Dr. Jonathan Singer Thomas Jefferson University/Jefferson Medical College Dr. Matthew Wintersteen University of Pennsylvania Dr. Susan Sorenson, Erin Quinn, Alessandra Elkovitch Additional Persons Michael DeStefano Dr. Paul Fink Pat West Dr. Samuel Wyche

Table of Contents
Executive Summary . . . . . . . . . . . . . . . . . . . . . . . . . . . . . . . . . . . . . . . . . . . . . . . . . . . . . . . . . . . . . 4
Section I: Background . . . . . . . . . . . . . . . . . . . . . . . . . . . . . . . . . . . . . . . . . . . . . . . . . . . . . . . . . . . .6 History of Child Death Review in Philadelphia Purpose of Child Death Review The Philadelphia Child Death Review Process
Section II: Overview of Child Deaths Reviewed, 2009 ‐ 2010 . . . . . . . . . . . . . . . . . . . . . . . . . . . . . . . . . . . . . 8 Basic Demographics
o Map of All Child Deaths Reviewed
Section III: Focus on Infant Deaths . . . . . . . . . . . . . . . . . . . . . . . . . . . . . . . . . . . . . . . . . . . . . . . . . . . .11 Infant Death Demographics Sleep‐Related Infant Deaths Prematurity‐Related Infant Deaths
Section IV: Natural Deaths . . . . . . . . . . . . . . . . . . . . . . . . . . . . . . . . . . . . . . . . . . . . . . . . . . . . . . . . 18 Natural Death Demographics Infectious Disease Deaths Asthma Deaths Cancer Deaths
Section V: Unintentional Injury Deaths . . . . . . . . . . . . . . . . . . . . . . . . . . . . . . . . . . . . . . . . . . . . . . . . .20 Unintentional Injury Death Demographics Transportation‐Related Unintentional Deaths Non‐Transportation‐Related Unintentional Deaths
o Drowning Deaths o Fire Deaths o Poisoning Deaths o Other Deaths
Section VI: Intentional Injury Deaths . . . . . . . . . . . . . . . . . . . . . . . . . . . . . . . . . . . . . . . . . . . . . . . . . . 30 Child Abuse & Neglect Deaths Homicides (other than Child Abuse & Neglect)
o Map of Child Homicides Reviewed Suicides
Appendix . . . . . . . . . . . . . . . . . . . . . . . . . . . . . . . . . . . . . . . . . . . . . . . . . . . . . . . . . . . . . . . . . . 40 Resources and Links References
Philadelphia Child Death Review Report ‐ 2009‐2010 4
Executive Summary The death of a child, particularly an infant, is a sentinel event and an indicator of the health of a community as a whole. While most child deaths are unexpected, every child death is a tragic event that leaves a wake of pain and suffering for the many people who had been involved in that child’s life. Philadelphia suffers from very high rates of both infant mortality and violent deaths among our older youth. Many of these deaths are avoidable. The Philadelphia Child Death Review (PCDR) teams have been addressing this issue since 1993 by reviewing deaths of Philadelphia’s children aged 19 years and under. This age limit was expanded to 21 years and under in 2008 by Pennsylvania’s Public Health Child Death Review Act. Part of the purpose of child death review teams is to help decrease the number of preventable child deaths for the future. This task requires coordination among the different systems, forcing us to break out of our self‐made silos. An interim but positive by‐product of our work is an increased level of cooperation among systems and an improvement in the welfare of the city’s children.
Daunting Numbers
With a population of just over 1.5 million people, approximately 455,000 of whom are aged 21 years and under, Philadelphia experiences an average of nearly 450 child deaths per year
Philadelphia contains roughly 13% of Pennsylvania’s child population, yet it accounts for over 20% of all Pennsylvania child deaths
The Philadelphia CDR teams reviewed over 40% of the child deaths in Pennsylvania in 2009 and 2010 Infant Deaths High infant mortality rates continue to be a vexing and persistent problem for the residents of Philadelphia. Of the 2009‐2010 child deaths that were reviewed:
Infant deaths accounted for 55% of these 880 Philadelphia child deaths, and more than half of the infant deaths were due to prematurity
An average of approximately 50 infants per year (nearly one infant every week) died suddenly and unexpectedly in Philadelphia
34 infants died of accidental suffocation, 10 of which were due to another person laying on top of them o Every one of these 34 suffocation deaths (approximately one infant death every three weeks) could
have been prevented had the infant been placed in a safe sleep environment Unintentional Injury Deaths
Of the 2009‐2010 deaths that were reviewed, 35 children died from transportation‐related injuries o Alcohol or drug use was a contributing factor in 11% of these 35 deaths o Speeding was a contributing factor in 51% of these 35 deaths o A large majority (86%) of the 22 non‐pedestrian fatalities were not using proper safety equipment at
the time of injury (helmets with motorcycles, ATV or bicycles; seatbelts with other motorized vehicles) Of the 2009‐2010 deaths that were reviewed, 11 children died in 9 fires
o Of these nine fire events, 78% of the households did not have a working smoke detector Of the 2009‐2010 deaths that were reviewed, 17 children died from accidental drug intoxications
o Three‐quarters of these 17 deaths occurred in White, Non‐Hispanic children, and 88% were males o Opiates (including methadone and heroin) were implicated in 100% of these deaths o Benzodiazepines (Valium‐type drugs) were implicated in 59% of these 17 deaths, and cocaine in 47%
Philadelphia Child Death Review Report ‐ 2009‐2010 5
Intentional Injury Deaths Of the 2009‐2010 deaths reviewed, 13 children were from abuse or neglect at the hand of a caregiver
o Nine of these 13 victims (69%) were under age 2 years at the time they were killed Of the 2009‐2010 deaths that were reviewed, 156 youths were killed by gunfire
o When averaged over the past ten years, Philadelphia has experienced one child homicide almost every four days. That is nearly eight child homicides per month, every month, for the past decade.
The typical child homicide victim was male, Black, aged 17‐21 years, and killed by a firearm The typical child homicide perpetrator was male and aged 15‐24 years
o Nearly three‐quarters (71%) of these 156 homicide victims had a juvenile detention history Of the 2009‐2010 deaths that were reviewed, 41 children died as a result of suicide
o A little under one quarter (22%) of the 41 suicide victims were aged 14 years and younger, with three of the decedents being aged 10 years and younger
100% of these younger children committed suicide by hanging 25% of the older youths (ages 15‐21 years) committed suicide with a firearm
o Over half (56%) of the suicide victims were Black, Non‐Hispanic o One third of the decedents had previously threatened or attempted suicide
Key Recommendations 1. Support and expand locally‐run, evidence‐based violence intervention programs
The number of children and youth dying from gun violence are at disproportionately high levels in Philadelphia as compared to other large cities. In the year 2010, there were more homicides in Philadelphians aged 17‐21 years than there were of U.S. soldiers of all ages in Iraq. Violence interrupter programs, such as CeaseFire, have been proven to decrease instances of gun violence in urban areas. Local programs such as Philadelphia CeaseFire and Healing Hurt People are two examples of community‐level action that are addressing the issue of youth violence. With an average of over 80 deaths per year, youth homicide is an obvious and important target for the prevention of child deaths in Philadelphia.
2. Create a better system for sharing information between city agencies
A disproportionate number of Philadelphia child deaths occur within the lower socioeconomic strata and are known to more than one system – systems that struggle to communicate and share information with each other. Too many children are dying with their confidentiality intact. Better communication between systems will not only improve services to children, but it will also save lives.
3. Support efforts to provide an appropriate sleep location for impoverished families
When it comes to obvious targets in child death prevention, sudden infant death is a low‐hanging fruit. There are multiple efforts underway to ensure that our infants sleep in a safe environment every night, including local organizations that provide a free pack‐n‐play to needy families.
4. Enact legislation that mandates helmet use for all motorcycle riders in Philadelphia, regardless of age
In 2009‐2010 alone, there were five Philadelphia children who died while riding a motorcycle without a helmet. While there already is a Pennsylvania‐wide law mandating helmets for children ages 20 years and under, this is a law that is difficult to enforce, as police may be reluctant to stop every youth who may or may not be under the age of 21. Passing legislation for a Philadelphia‐area mandatory helmet law for all motorcycle riders will remove the judgment aspect of deciding when to stop a rider. In addition, such a law will invariably save not just the lives of Philadelphia children and youth, but Philadelphia adults as well.
Philadelphia Child Death Review Report ‐ 2009‐2010 6
Section I: Background
History of Child Death Review in Philadelphia The concept of conducting reviews of individual deaths dates back over 80 years, when the Medical Society of New Jersey initiated a maternal mortality review in 1931. However, it wasn’t until 1978 that the first child death review process was started in Los Angeles, where a local team convened in order to identify deaths caused by child abuse and neglect. Over the ensuing 30+ years, child death review teams have been established throughout the country at both the local and state levels. The Philadelphia Department of Public Health established its own child death review process in June 1993, and it has been running uninterrupted ever since.
The Purpose of Child Death Review According to the National Center for Child Death Review Policy and Practice, the purpose of child death review is to “…conduct a comprehensive, multidisciplinary review of child deaths, to better understand how and why children die, and use the findings to take action that can prevent other deaths and improve the health and safety of children.” The purpose of the Philadelphia Child Death Review (PCDR) process is no different. Ours is a data‐driven process, meaning that data are used to guide and focus the recommendations that are presented in this report. This report differs from a vital statistics report in that it gathers more detailed information on many data points on a specific population of interest (in this case, children ages 21 years and under). In addition to the end‐goal of preventing future child deaths, the child death review process is able to accomplish many short‐term or immediate goals, such as improved collaboration across city and non‐city agencies, improved coordination of public health and law enforcement efforts, improved vital statistics accuracy, improved surveillance of child death data, and decreased misclassification of deaths.
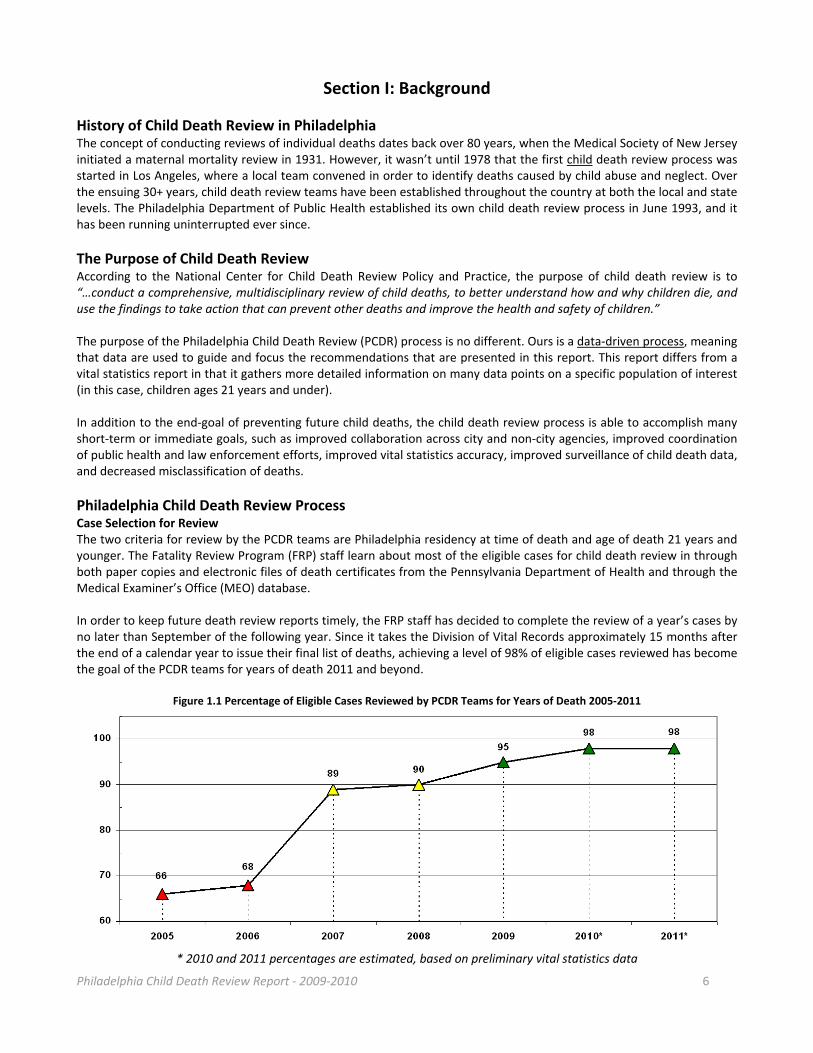
Philadelphia Child Death Review Process Case Selection for Review The two criteria for review by the PCDR teams are Philadelphia residency at time of death and age of death 21 years and younger. The Fatality Review Program (FRP) staff learn about most of the eligible cases for child death review in through both paper copies and electronic files of death certificates from the Pennsylvania Department of Health and through the Medical Examiner’s Office (MEO) database. In order to keep future death review reports timely, the FRP staff has decided to complete the review of a year’s cases by no later than September of the following year. Since it takes the Division of Vital Records approximately 15 months after the end of a calendar year to issue their final list of deaths, achieving a level of 98% of eligible cases reviewed has become the goal of the PCDR teams for years of death 2011 and beyond.
Figure 1.1 Percentage of Eligible Cases Reviewed by PCDR Teams for Years of Death 2005‐2011
* 2010 and 2011 percentages are estimated, based on preliminary vital statistics data

Philadelphia Child Death Review Report ‐ 2009‐2010 7
Ultimately, the number of child deaths reviewed and reported by the PCDR teams will vary slightly from Philadelphia Vital Statistics numbers. The main reasons for this discrepancy are:
(1) desire of PCDR teams to wrap up the review of previous year’s deaths by September of the following year; (2) ability of PCDR teams to track down a small number of out‐of‐state child deaths each year; and (3) differing residency selection criteria and verification procedures used by PCDR and vital statistics. Those wanting to see a description of all deaths that occurred in Philadelphia should refer to the Philadelphia Vital Statistics reports, whose website is listed in the resources section of the appendix.
Lag Time from Date of Death to Date of Review Ever since the Fatality Review Program (FRP) was moved under the auspices of the MEO in 2009, there has been a concerted effort not only to increase the percentage of eligible cases reviewed, but to also reduce the lag time from date of child death to date of review. In January 2009, Philadelphia child deaths were being reviewed an average of 16‐17 months after the child had died, whereas the average lag time in other Pennsylvania counties was closer to 6 months. To address this excessive delay, the total number of cases reviewed annually was increased from 283 in 2008, to 488 in 2009, to 588 in 2010, and to 576 in 2011. As a result of this effort, the PCDR teams now review cases an average of four months after the date of death.
Improved Processes Since 2008
Over the last four years (2008‐2011), the total number of child deaths reviewed has increased from 283 cases in 2008 to 576 cases in 2011
For children who died in 2010, the percentage of eligible cases that were ultimately reviewed by the PCDR teams improved to an estimated 98% (from 68% for child deaths in 2006)
Over the last four years of review (2008‐2011), the average lag time between the date of a child’s death to date of child death review has decreased from 16‐17 months to 4 months
Next Steps for 2012‐13 The FRP will continue to refine and improve the process of child death review in Philadelphia over the coming year and expand its outreach by:
Further improving data quality (data collection, data coding, data entering, data storing, data tracking) o Only through high‐quality data gathering can quality data analysis be performed, which can then help
guide informed prevention recommendations and initiatives o Create more user‐friendly data collection sheets for team members
Maintaining quantity and efficiency of reviews o Continue to review about 450 cases per year; continue to review approximately 98% of eligible cases;
maintain average lag time from date of death to date of review to four months Seeking out increased collaborations with academic partners for potential research projects
o Seek research partners who would not just be users of the data, but also resource donors as well as contributors to the upkeep of the data systems
Improved process to generate recommendations o Planned formation of four separate advisory teams (infant deaths, behavioral health‐related deaths,
accidental deaths, and homicides) that will each meet approximately four times per year o Identify and collect additional data elements to improve the understanding of circumstances
surrounding a child’s death that will help improve/create policy recommendations for the future Maintaining the frequency of reporting
o The next child death review report will cover 2011‐2012 deaths o Consider issuing a special, separate report in addition to the biennial child death review report
(e.g. 5‐year retrospective on sleep‐related infant deaths or older youth homicides) Better dissemination of report findings
o Seek out better ways to disseminate annual report to key members of the community

Philadelphia Child Death Review Report ‐ 2009‐2010 8
Section II: Overview of Child Deaths Reviewed (2009‐2010) Note: Except where noted, this report only describes those child deaths, ages birth through 21 years, that occurred in the years 2009 to 2010 and were reviewed by the Philadelphia Child Death Review Teams.
For information specific to Philadelphia vital statistics, please refer to the Philadelphia Department of Public Health’s website (listed in the appendix). Philadelphia Vital Statistics reports are available online for years 2003 through 2009.
The City of Philadelphia is a large, heterogeneous, multi‐racial city of approximately 1.5 million people and is located in the northeastern United States. The city lies within one single, fully urbanized county, which is also called Philadelphia. According to the 2007 Philadelphia Vital Statistics Report, the racial breakdown of the overall population is approximately 43% Black Non‐Hispanic, 40% White Non‐Hispanic, 6% Asian Non‐Hispanic, and 11% Hispanic (of any race). There were 880 Philadelphia children who died in 2009 and 2010 and were reviewed by the Philadelphia Child Death Review (PCDR) teams. Based on Philadelphia vital statistics records, it is estimated that the PCDR teams reviewed approximately 98% of the 2009‐2010 cases eligible for review.
Figure 2.1a Child Deaths Reviewed by Gender and Race/Ethnicity, for Years of Death 2009‐2010 (n=880)
GENDER RACE/ETHNICITY
YEAR M F Unknown White
Non‐Hispanic Black
Non‐Hispanic Asian
Non‐Hispanic Hispanic Any Race
Unknown
2009‐2010
# 586 290 4 131 587 26 121 16
% 67% 33% 1% 15% 67% 3% 14% 2%
The gender of the majority of child deaths reviewed is consistently male – about two‐thirds of the overall cases reviewed. This disproportionate number of males can be partially explained by the typical profile of a youth homicide victim in Philadelphia, who is almost always male. The racial/ethnic breakdown of child deaths reviewed shows that the majority (almost two‐thirds) of cases were of Black, Non‐Hispanic children. However, the overall Philadelphia population of Black, Non‐Hispanics for the age groups of birth through 21 year olds is closer to 50%. This disproportionate number of cases reviewed for Black, Non‐Hispanic child deaths in Philadelphia can be partially explained by the fact that nearly 85% of the youth homicide victims in Philadelphia are Black, Non‐Hispanic.
Figure 2.1b Child Deaths Reviewed by Age, for Years of Death 2009‐2010 (n=880)
AGE CATEGORIES
YEAR <1 YEAR 1‐4
YEARS 5‐9
YEARS 10‐14 YEARS
15‐19 YEARS
20‐21 YEARS <1 Day 1‐27 Days 28‐364 Days
2009‐2010 # 229 105 153 43 26 36 152 136
% 26% 12% 17% 5% 3% 4% 17% 16%
The age groups depicted in Figure 2.1b show that just over half of all cases occurred in infants (defined throughout this report as less than one year of age). Children ages 1 through 14 years make up a small number and percentage of total child deaths, while children ages 15 to 21 year olds accounted for nearly one‐third of all child deaths. Most older youth deaths in Philadelphia were due to injuries, either unintentional (e.g., motor vehicle crashes) or intentional (homicides and suicides).
Philadelphia Child Death Review Report ‐ 2009‐2010 9
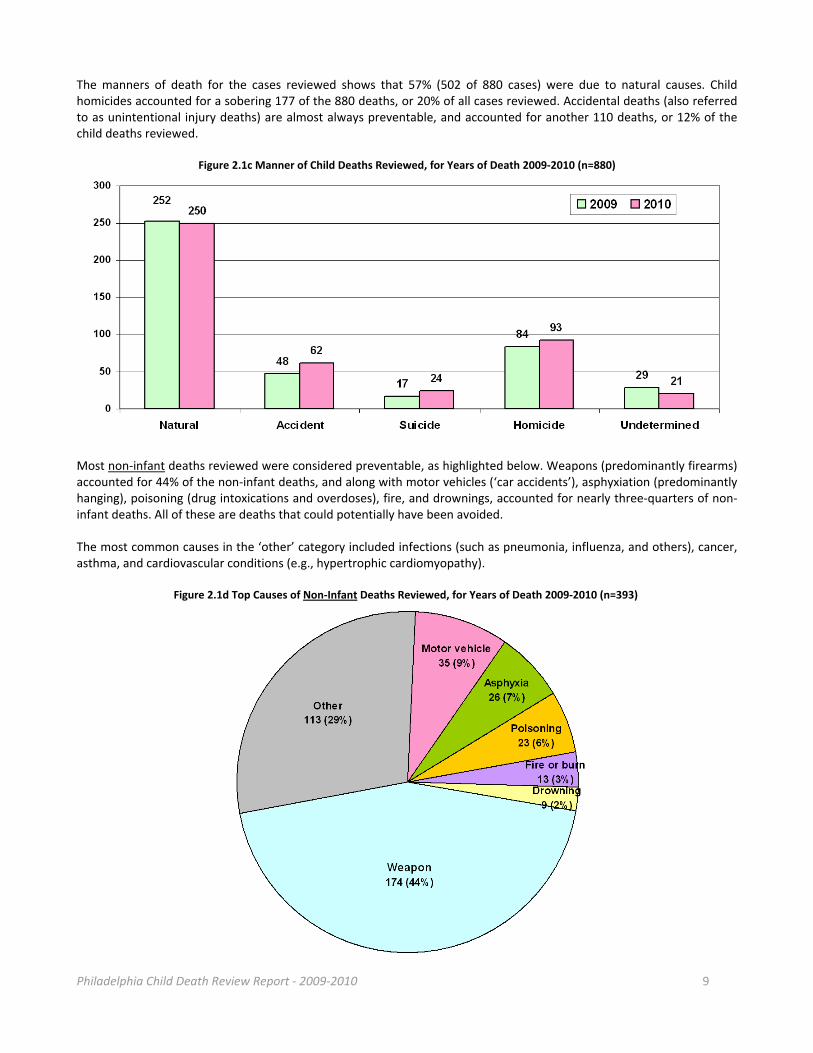
The manners of death for the cases reviewed shows that 57% (502 of 880 cases) were due to natural causes. Child homicides accounted for a sobering 177 of the 880 deaths, or 20% of all cases reviewed. Accidental deaths (also referred to as unintentional injury deaths) are almost always preventable, and accounted for another 110 deaths, or 12% of the child deaths reviewed.
Figure 2.1c Manner of Child Deaths Reviewed, for Years of Death 2009‐2010 (n=880)
Most non‐infant deaths reviewed were considered preventable, as highlighted below. Weapons (predominantly firearms) accounted for 44% of the non‐infant deaths, and along with motor vehicles (‘car accidents’), asphyxiation (predominantly hanging), poisoning (drug intoxications and overdoses), fire, and drownings, accounted for nearly three‐quarters of non‐infant deaths. All of these are deaths that could potentially have been avoided. The most common causes in the ‘other’ category included infections (such as pneumonia, influenza, and others), cancer, asthma, and cardiovascular conditions (e.g., hypertrophic cardiomyopathy).
Figure 2.1d Top Causes of Non‐Infant Deaths Reviewed, for Years of Death 2009‐2010 (n=393)
Philadelphia Child Death Review Report ‐ 2009‐2010 10
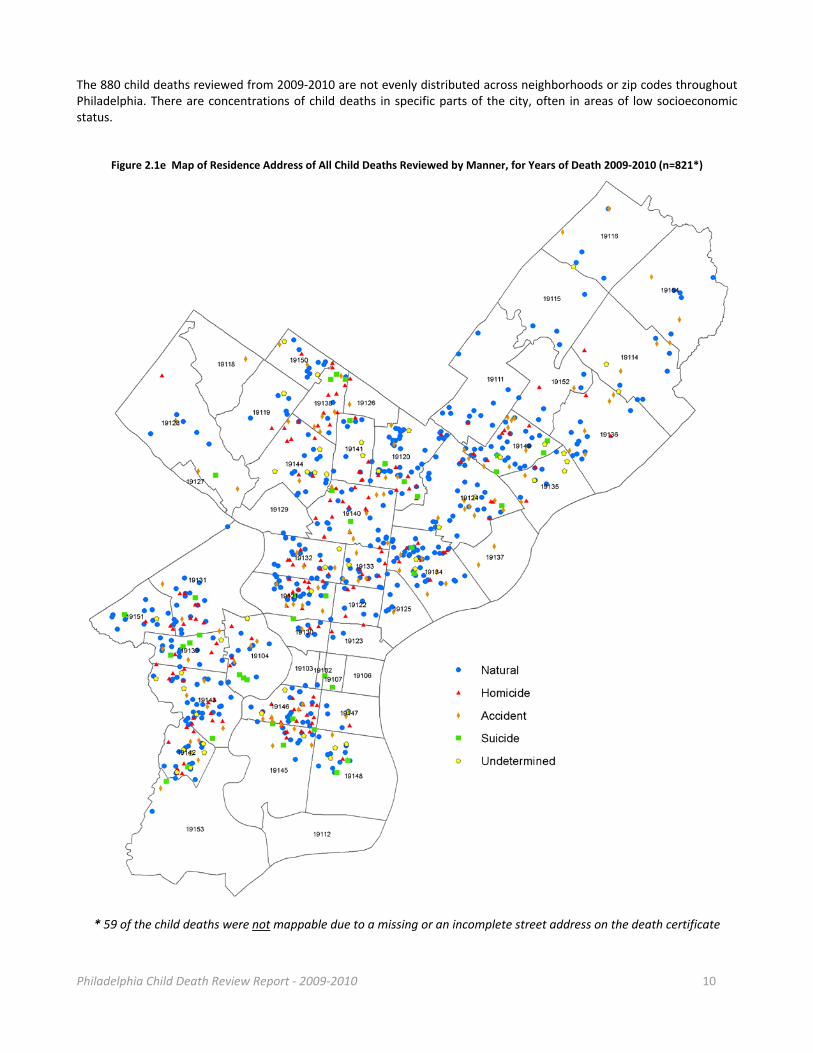
The 880 child deaths reviewed from 2009‐2010 are not evenly distributed across neighborhoods or zip codes throughout Philadelphia. There are concentrations of child deaths in specific parts of the city, often in areas of low socioeconomic status.
Figure 2.1e Map of Residence Address of All Child Deaths Reviewed by Manner, for Years of Death 2009‐2010 (n=821*)
* 59 of the child deaths were not mappable due to a missing or an incomplete street address on the death certificate
Philadelphia Child Death Review Report ‐ 2009‐2010 11
Section III: Focus on Infant Deaths
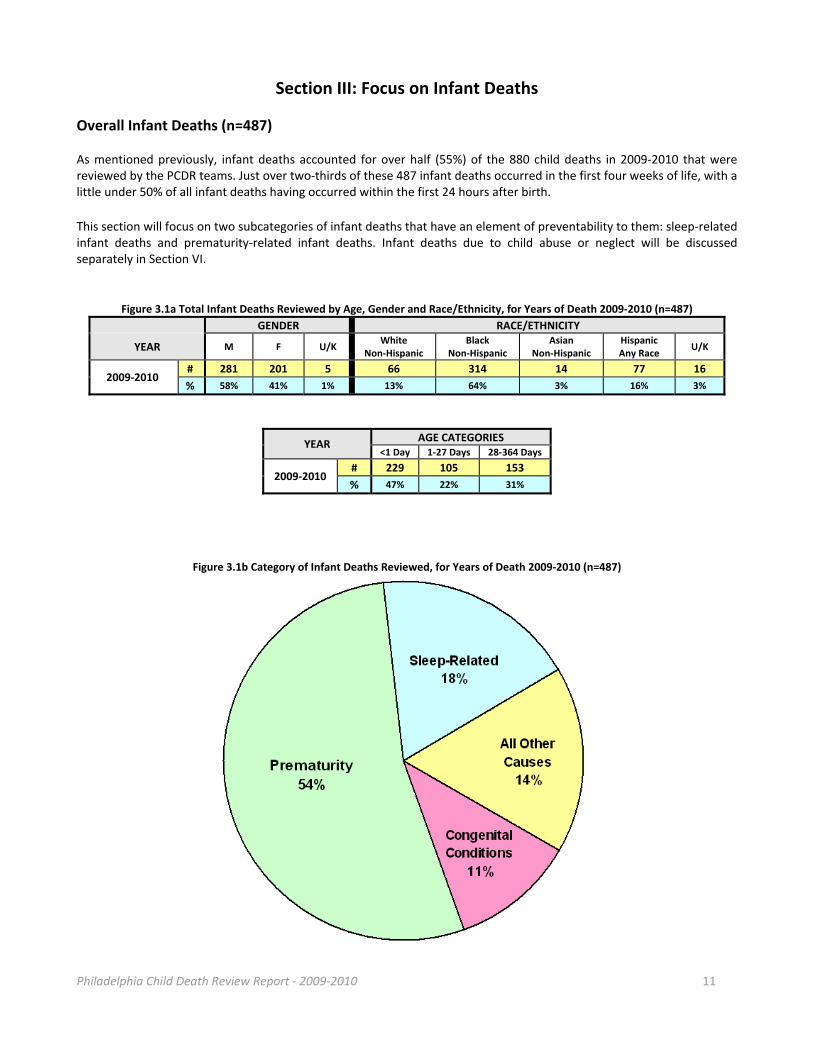
Overall Infant Deaths (n=487) As mentioned previously, infant deaths accounted for over half (55%) of the 880 child deaths in 2009‐2010 that were reviewed by the PCDR teams. Just over two‐thirds of these 487 infant deaths occurred in the first four weeks of life, with a little under 50% of all infant deaths having occurred within the first 24 hours after birth.
This section will focus on two subcategories of infant deaths that have an element of preventability to them: sleep‐related infant deaths and prematurity‐related infant deaths. Infant deaths due to child abuse or neglect will be discussed separately in Section VI.
Figure 3.1a Total Infant Deaths Reviewed by Age, Gender and Race/Ethnicity, for Years of Death 2009‐2010 (n=487)
GENDER RACE/ETHNICITY
YEAR M F U/K White
Non‐Hispanic Black
Non‐Hispanic Asian
Non‐Hispanic Hispanic Any Race
U/K
2009‐2010 # 281 201 5 66 314 14 77 16
% 58% 41% 1% 13% 64% 3% 16% 3%
YEAR AGE CATEGORIES
<1 Day 1‐27 Days 28‐364 Days
2009‐2010 # 229 105 153
% 47% 22% 31%
Figure 3.1b Category of Infant Deaths Reviewed, for Years of Death 2009‐2010 (n=487)
Philadelphia Child Death Review Report ‐ 2009‐2010 12
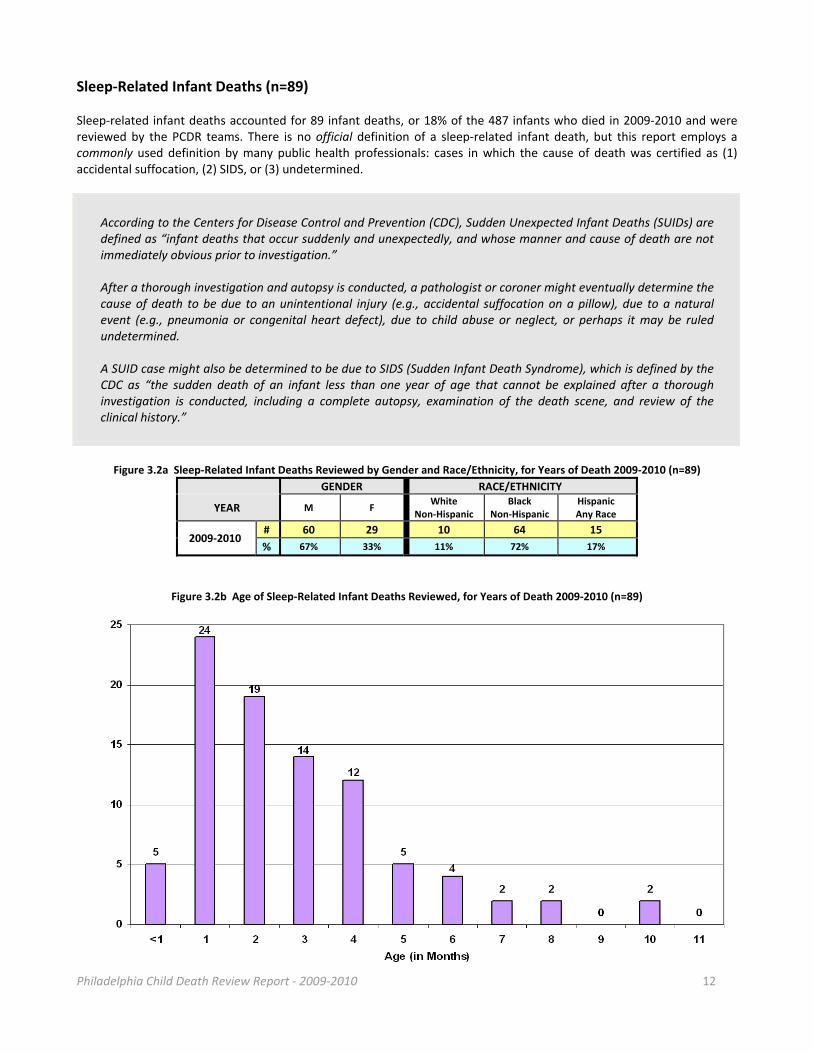
Sleep‐Related Infant Deaths (n=89) Sleep‐related infant deaths accounted for 89 infant deaths, or 18% of the 487 infants who died in 2009‐2010 and were reviewed by the PCDR teams. There is no official definition of a sleep‐related infant death, but this report employs a commonly used definition by many public health professionals: cases in which the cause of death was certified as (1) accidental suffocation, (2) SIDS, or (3) undetermined.
According to the Centers for Disease Control and Prevention (CDC), Sudden Unexpected Infant Deaths (SUIDs) are defined as “infant deaths that occur suddenly and unexpectedly, and whose manner and cause of death are not immediately obvious prior to investigation.” After a thorough investigation and autopsy is conducted, a pathologist or coroner might eventually determine the cause of death to be due to an unintentional injury (e.g., accidental suffocation on a pillow), due to a natural event (e.g., pneumonia or congenital heart defect), due to child abuse or neglect, or perhaps it may be ruled undetermined. A SUID case might also be determined to be due to SIDS (Sudden Infant Death Syndrome), which is defined by the CDC as “the sudden death of an infant less than one year of age that cannot be explained after a thorough investigation is conducted, including a complete autopsy, examination of the death scene, and review of the clinical history.”
Figure 3.2a Sleep‐Related Infant Deaths Reviewed by Gender and Race/Ethnicity, for Years of Death 2009‐2010 (n=89)
GENDER RACE/ETHNICITY
YEAR M F White
Non‐Hispanic Black
Non‐Hispanic Hispanic Any Race
2009‐2010 # 60 29 10 64 15
% 67% 33% 11% 72% 17%
Figure 3.2b Age of Sleep‐Related Infant Deaths Reviewed, for Years of Death 2009‐2010 (n=89)
Philadelphia Child Death Review Report ‐ 2009‐2010 13
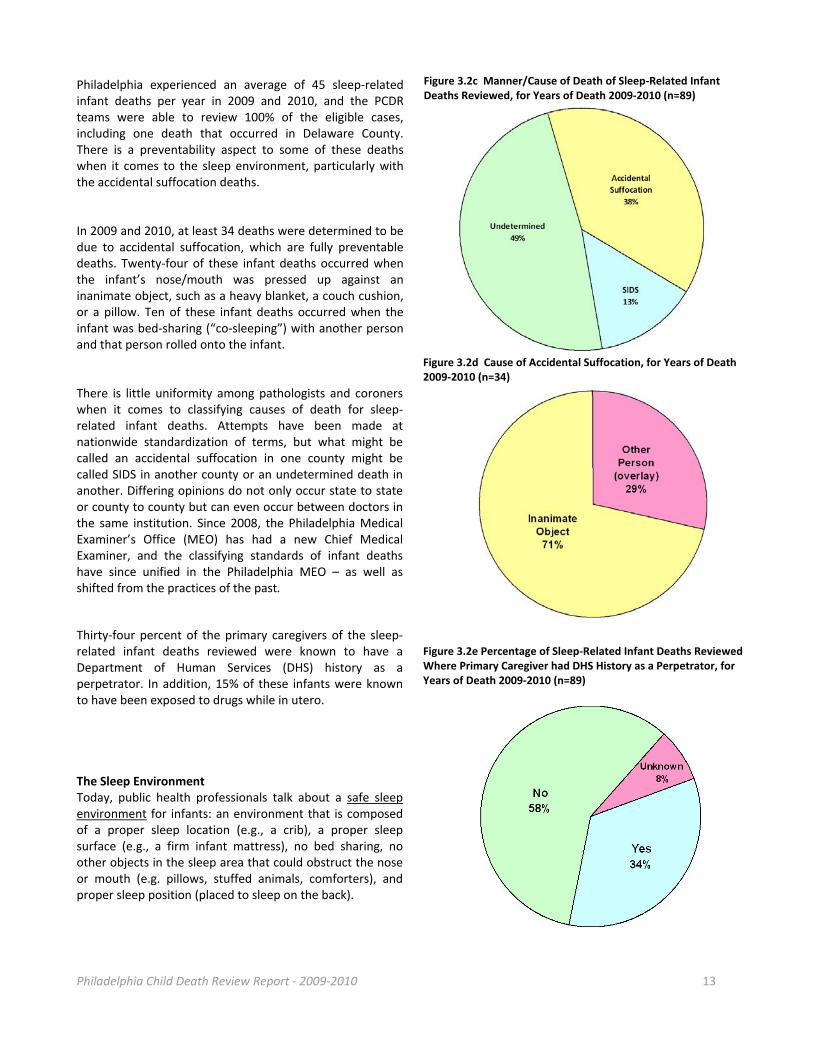
Philadelphia experienced an average of 45 sleep‐related infant deaths per year in 2009 and 2010, and the PCDR teams were able to review 100% of the eligible cases, including one death that occurred in Delaware County. There is a preventability aspect to some of these deaths when it comes to the sleep environment, particularly with the accidental suffocation deaths. In 2009 and 2010, at least 34 deaths were determined to be due to accidental suffocation, which are fully preventable deaths. Twenty‐four of these infant deaths occurred when the infant’s nose/mouth was pressed up against an inanimate object, such as a heavy blanket, a couch cushion, or a pillow. Ten of these infant deaths occurred when the infant was bed‐sharing (“co‐sleeping”) with another person and that person rolled onto the infant. There is little uniformity among pathologists and coroners when it comes to classifying causes of death for sleep‐related infant deaths. Attempts have been made at nationwide standardization of terms, but what might be called an accidental suffocation in one county might be called SIDS in another county or an undetermined death in another. Differing opinions do not only occur state to state or county to county but can even occur between doctors in the same institution. Since 2008, the Philadelphia Medical Examiner’s Office (MEO) has had a new Chief Medical Examiner, and the classifying standards of infant deaths have since unified in the Philadelphia MEO – as well as shifted from the practices of the past.
Thirty‐four percent of the primary caregivers of the sleep‐related infant deaths reviewed were known to have a Department of Human Services (DHS) history as a perpetrator. In addition, 15% of these infants were known to have been exposed to drugs while in utero. The Sleep Environment Today, public health professionals talk about a safe sleep environment for infants: an environment that is composed of a proper sleep location (e.g., a crib), a proper sleep surface (e.g., a firm infant mattress), no bed sharing, no other objects in the sleep area that could obstruct the nose or mouth (e.g. pillows, stuffed animals, comforters), and proper sleep position (placed to sleep on the back).
Figure 3.2c Manner/Cause of Death of Sleep‐Related Infant Deaths Reviewed, for Years of Death 2009‐2010 (n=89)
Figure 3.2d Cause of Accidental Suffocation, for Years of Death 2009‐2010 (n=34)
Figure 3.2e Percentage of Sleep‐Related Infant Deaths Reviewed Where Primary Caregiver had DHS History as a Perpetrator, for Years of Death 2009‐2010 (n=89)
Philadelphia Child Death Review Report ‐ 2009‐2010 14
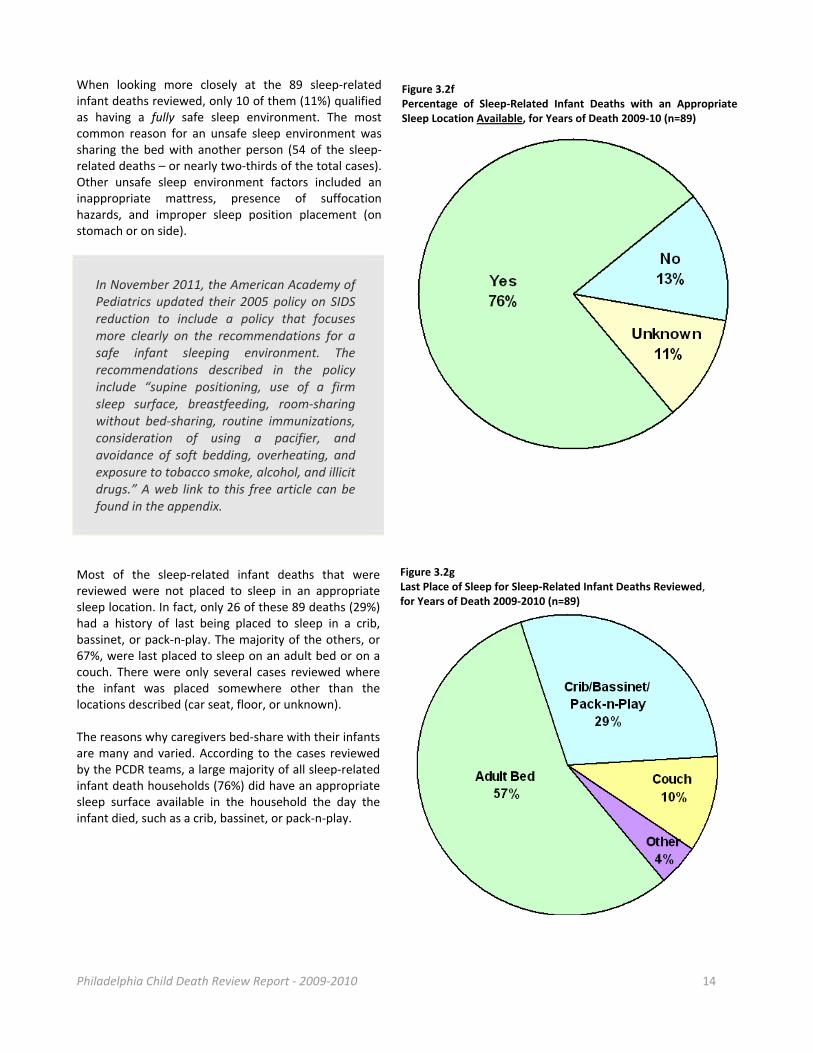
When looking more closely at the 89 sleep‐related infant deaths reviewed, only 10 of them (11%) qualified as having a fully safe sleep environment. The most common reason for an unsafe sleep environment was sharing the bed with another person (54 of the sleep‐related deaths – or nearly two‐thirds of the total cases). Other unsafe sleep environment factors included an inappropriate mattress, presence of suffocation hazards, and improper sleep position placement (on stomach or on side).
In November 2011, the American Academy of Pediatrics updated their 2005 policy on SIDS reduction to include a policy that focuses more clearly on the recommendations for a safe infant sleeping environment. The recommendations described in the policy include “supine positioning, use of a firm sleep surface, breastfeeding, room‐sharing without bed‐sharing, routine immunizations, consideration of using a pacifier, and avoidance of soft bedding, overheating, and exposure to tobacco smoke, alcohol, and illicit drugs.” A web link to this free article can be found in the appendix.
Most of the sleep‐related infant deaths that were reviewed were not placed to sleep in an appropriate sleep location. In fact, only 26 of these 89 deaths (29%) had a history of last being placed to sleep in a crib, bassinet, or pack‐n‐play. The majority of the others, or 67%, were last placed to sleep on an adult bed or on a couch. There were only several cases reviewed where the infant was placed somewhere other than the locations described (car seat, floor, or unknown). The reasons why caregivers bed‐share with their infants are many and varied. According to the cases reviewed by the PCDR teams, a large majority of all sleep‐related infant death households (76%) did have an appropriate sleep surface available in the household the day the infant died, such as a crib, bassinet, or pack‐n‐play.
Figure 3.2f Percentage of Sleep‐Related Infant Deaths with an Appropriate Sleep Location Available, for Years of Death 2009‐10 (n=89)
Figure 3.2g Last Place of Sleep for Sleep‐Related Infant Deaths Reviewed, for Years of Death 2009‐2010 (n=89)
Philadelphia Child Death Review Report ‐ 2009‐2010 15
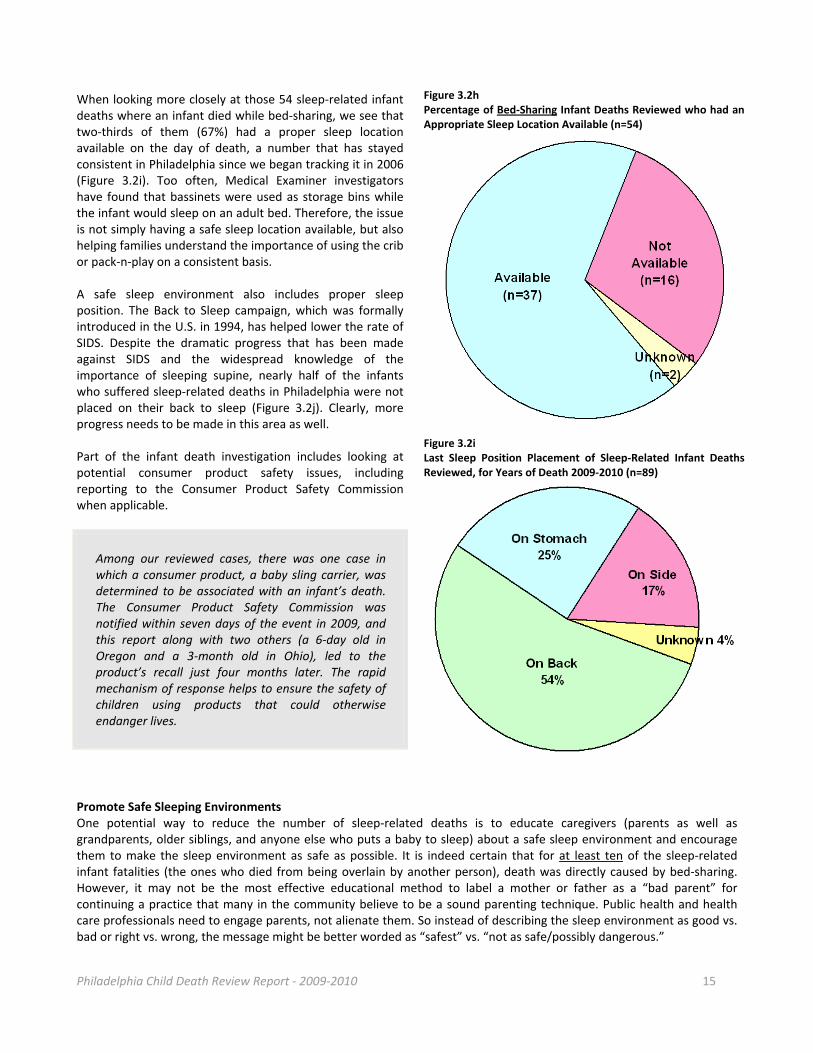
When looking more closely at those 54 sleep‐related infant deaths where an infant died while bed‐sharing, we see that two‐thirds of them (67%) had a proper sleep location available on the day of death, a number that has stayed consistent in Philadelphia since we began tracking it in 2006 (Figure 3.2i). Too often, Medical Examiner investigators have found that bassinets were used as storage bins while the infant would sleep on an adult bed. Therefore, the issue is not simply having a safe sleep location available, but also helping families understand the importance of using the crib or pack‐n‐play on a consistent basis. A safe sleep environment also includes proper sleep position. The Back to Sleep campaign, which was formally introduced in the U.S. in 1994, has helped lower the rate of SIDS. Despite the dramatic progress that has been made against SIDS and the widespread knowledge of the importance of sleeping supine, nearly half of the infants who suffered sleep‐related deaths in Philadelphia were not placed on their back to sleep (Figure 3.2j). Clearly, more progress needs to be made in this area as well. Part of the infant death investigation includes looking at potential consumer product safety issues, including reporting to the Consumer Product Safety Commission when applicable.
Among our reviewed cases, there was one case in which a consumer product, a baby sling carrier, was determined to be associated with an infant’s death. The Consumer Product Safety Commission was notified within seven days of the event in 2009, and this report along with two others (a 6‐day old in Oregon and a 3‐month old in Ohio), led to the product’s recall just four months later. The rapid mechanism of response helps to ensure the safety of children using products that could otherwise endanger lives.
Promote Safe Sleeping Environments One potential way to reduce the number of sleep‐related deaths is to educate caregivers (parents as well as grandparents, older siblings, and anyone else who puts a baby to sleep) about a safe sleep environment and encourage them to make the sleep environment as safe as possible. It is indeed certain that for at least ten of the sleep‐related infant fatalities (the ones who died from being overlain by another person), death was directly caused by bed‐sharing. However, it may not be the most effective educational method to label a mother or father as a “bad parent” for continuing a practice that many in the community believe to be a sound parenting technique. Public health and health care professionals need to engage parents, not alienate them. So instead of describing the sleep environment as good vs. bad or right vs. wrong, the message might be better worded as “safest” vs. “not as safe/possibly dangerous.”
Figure 3.2h Percentage of Bed‐Sharing Infant Deaths Reviewed who had an Appropriate Sleep Location Available (n=54)
Figure 3.2i Last Sleep Position Placement of Sleep‐Related Infant Deaths Reviewed, for Years of Death 2009‐2010 (n=89)
Philadelphia Child Death Review Report ‐ 2009‐2010 16
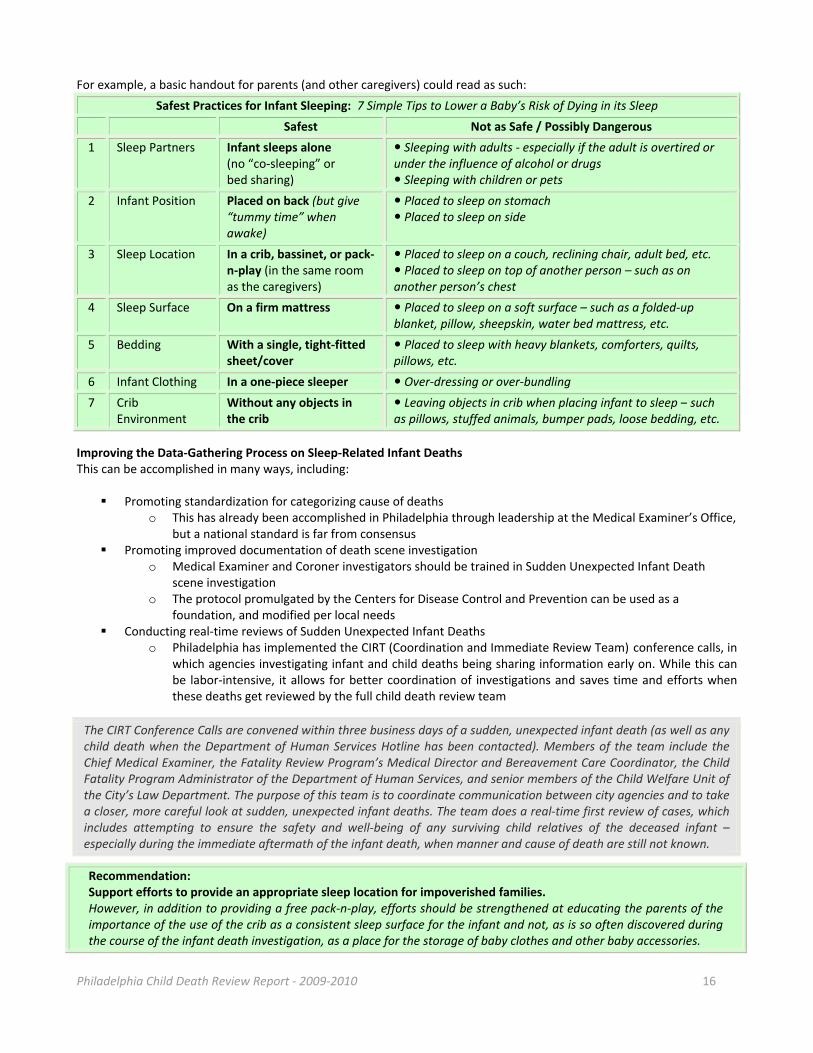
For example, a basic handout for parents (and other caregivers) could read as such:
Safest Practices for Infant Sleeping: 7 Simple Tips to Lower a Baby’s Risk of Dying in its Sleep
Safest Not as Safe / Possibly Dangerous
1 Sleep Partners Infant sleeps alone (no “co‐sleeping” or bed sharing)
Sleeping with adults ‐ especially if the adult is overtired or under the influence of alcohol or drugs Sleeping with children or pets
2 Infant Position Placed on back (but give “tummy time” when awake)
Placed to sleep on stomach Placed to sleep on side
3 Sleep Location In a crib, bassinet, or pack‐n‐play (in the same room as the caregivers)
Placed to sleep on a couch, reclining chair, adult bed, etc. Placed to sleep on top of another person – such as on another person’s chest
4 Sleep Surface On a firm mattress Placed to sleep on a soft surface – such as a folded‐up blanket, pillow, sheepskin, water bed mattress, etc.
5 Bedding With a single, tight‐fitted sheet/cover
Placed to sleep with heavy blankets, comforters, quilts, pillows, etc.
6 Infant Clothing In a one‐piece sleeper Over‐dressing or over‐bundling
7 Crib Environment
Without any objects in the crib
Leaving objects in crib when placing infant to sleep – such as pillows, stuffed animals, bumper pads, loose bedding, etc.
Improving the Data‐Gathering Process on Sleep‐Related Infant Deaths This can be accomplished in many ways, including:
Promoting standardization for categorizing cause of deaths
o This has already been accomplished in Philadelphia through leadership at the Medical Examiner’s Office, but a national standard is far from consensus
Promoting improved documentation of death scene investigation o Medical Examiner and Coroner investigators should be trained in Sudden Unexpected Infant Death
scene investigation o The protocol promulgated by the Centers for Disease Control and Prevention can be used as a
foundation, and modified per local needs Conducting real‐time reviews of Sudden Unexpected Infant Deaths
o Philadelphia has implemented the CIRT (Coordination and Immediate Review Team) conference calls, in which agencies investigating infant and child deaths being sharing information early on. While this can be labor‐intensive, it allows for better coordination of investigations and saves time and efforts when these deaths get reviewed by the full child death review team
The CIRT Conference Calls are convened within three business days of a sudden, unexpected infant death (as well as any child death when the Department of Human Services Hotline has been contacted). Members of the team include the Chief Medical Examiner, the Fatality Review Program’s Medical Director and Bereavement Care Coordinator, the Child Fatality Program Administrator of the Department of Human Services, and senior members of the Child Welfare Unit of the City’s Law Department. The purpose of this team is to coordinate communication between city agencies and to take a closer, more careful look at sudden, unexpected infant deaths. The team does a real‐time first review of cases, which includes attempting to ensure the safety and well‐being of any surviving child relatives of the deceased infant – especially during the immediate aftermath of the infant death, when manner and cause of death are still not known.
Recommendation: Support efforts to provide an appropriate sleep location for impoverished families. However, in addition to providing a free pack‐n‐play, efforts should be strengthened at educating the parents of the importance of the use of the crib as a consistent sleep surface for the infant and not, as is so often discovered during the course of the infant death investigation, as a place for the storage of baby clothes and other baby accessories.

Philadelphia Child Death Review Report ‐ 2009‐2010 17
Prematurity‐Related Infant Deaths (n=263) Prematurity was the cause of death for at least 263 infants who died in 2009‐2010 and were reviewed by the PCDR teams. In fact, prematurity accounted for the cause of death in over half (54%) of all infant deaths and close to one third (30%) of all the child deaths reviewed.
In Pennsylvania, the vast majority of infants who die within 24 hours of birth do not fall under the jurisdiction of the Medical Examiner or Coroner, and so it is the hospital physician who certifies the cause of death. Few physicians receive training in filling out death certificates during medical school and residency. It can sometimes be difficult to discern what the true underlying cause of death is for an infant if the death certificate is incorrectly filled out.
Figure 3.3a Prematurity Deaths Reviewed by Age, Gender and Race/Ethnicity, for Years of Death 2009‐2010 (n=263)
AGE CATEGORIES GENDER RACE/ETHNICITY
YEAR 0‐27 Days
28‐364 Days
M F U/K White
Non‐Hispanic Black
Non‐Hispanic Asian
Non‐Hispanic Hispanic Any Race
U/K
2009‐2010
# 241 22 151 108 4 32 171 7 39 14
% 92% 8% 57% 41% 2% 12% 65% 3% 15% 5%
Many causes of prematurity are considered preventable, but just how to prevent prematurity is still not fully understood. One of the goals to improve the PCDR process for future years is to better track prenatal care of infants who died. This can be more effectively achieved through the acquisition of birth certificate data – which is now a regular process of the PCDR teams for children who died in 2009 and beyond. In fact, the percentage of birth certificate data obtained has increased steadily over the years, from about 40‐50% of infants who died in 2008 to over 90% of infants who died in 2011.
To reduce child fatalities from prematurity, the following is recommended:
Support the Centering model for pregnancy, an evidence‐based redesign of health care delivery
One recommendation by the Fetal & Infant Mortality Review’s Community Action Team (a team that is associated with the PCDR teams) has been to foster the adoption of CenteringPregnancy in and around the Philadelphia region. Centering “is a model of group healthcare, which incorporates three major components: assessment, education, and support. Group participants meet with their care provider and other group participants according to a regular schedule… Centering promotes individual health empowerment and community‐building.” With a new model of prenatal care, we anticipate that prenatal care levels will rise, quality of care will increase, and hopefully this will lead to decreased rates of premature births and deaths from prematurity. Anything that can impact this largest cause of child death will have profound effects on our overall child death numbers.
Philadelphia Child Death Review Report ‐ 2009‐2010 18
Section IV: Natural Deaths
Natural Deaths (n=502) There were 502 natural deaths of children that were reviewed by the PCDR teams. This section of the report will focus on non‐infant natural deaths, of which there were 105 cases. Natural deaths of infants, mostly due to prematurity or congenital conditions, are discussed in Section III.
Figure 4.1a Category of Non‐Infant Natural Deaths Reviewed, for Years of Death 2009‐2010 (n=105)
CATEGORY # %
Infectious Disease 21 20%
Cancer 17 16%
Cardiovascular 16 15%
Neurological/Seizure Disorder 16 15%
Sequelae of Prematurity 12 11%
Asthma 8 8%
Other 15 14%
Figure 4.1b Non‐Infant Natural Deaths by Age, Gender, and Race/Ethnicity, for Years of Death 2009‐2010 (n=105)
AGE CATEGORIES GENDER RACE/ETHNICITY
YEAR 1‐4 YRS.
5‐9 YRS.
10‐14 YRS.
15‐19 YRS.
20‐21 YRS.
M F White
Non‐Hisp. Black
Non‐Hisp. Asian
Non‐Hisp. HispanicAny Race
2009‐2010 # 25 15 16 32 17 61 44 20 63 6 16
% 24% 14% 15% 31% 16% 58% 42% 19% 60% 6% 15%
In general, many natural deaths are not considered preventable. This report will briefly focus on three causes of natural death that are either more common or that are potentially preventable: infectious disease, cancer, and asthma deaths.
Infectious Disease Deaths (n=21) Infectious disease deaths accounted for at least 21 of the 105 non‐infant natural deaths reviewed. Figure 4.1c Non‐Infant Infectious Disease Deaths Reviewed by Age, Gender, and Race/Ethnicity, for Years of Death 2009‐2010 (n=21)
AGE CATEGORIES GENDER RACE/ETHNICITY
YEAR 1‐4 YRS.
5‐9 YRS.
10‐14 YRS.
15‐19 YRS.
20‐21 YRS.
M F White
Non‐Hisp. Black
Non‐Hisp. Asian
Non‐Hisp. Hispanic Any Race
2009‐2010 # 6 3 5 0 7 13 8 8 11 0 2
% 29% 14% 24% 0% 33% 62% 38% 38% 52% 0% 10%
Most infectious diseases are not necessarily preventable, but some are. For sexually transmitted disease (such as syphilis and HIV), employing safe sex techniques can help protect a sexually active person from getting infected. Vaccines are available for a select handful of some other infectious diseases, many of which can be potentially deadly (such as influenza, measles, pneumococcal disease, and pertussis). Most deaths due to vaccine‐preventable illnesses that occur in Philadelphia residents are typically considered to be preventable.
There were four young child deaths due to pertussis and influenza in 2009‐2010. All four of these deaths were potentially preventable had the children and/or their caregivers been properly immunized.
There were two toddlers who died from Streptococcus pneumoniae infection in 2009‐2010. There is currently a vaccine that covers 13 of the most common and deadly serotypes of this bacteria, but the serotype that killed these toddlers was a strain not covered by the vaccine.
This report includes three Philadelphia youths who died from sequelae of HIV infection. The PCDR teams continue to work with partners from AACO (AIDS Activities Coordinating Office) in reviewing deaths from HIV/AIDS. Important strategies for the reduction of HIV mortality includes safe sex education for teenagers, universal HIV screening of teenagers ages 13 and older, and access to treatment for those infected with HIV.
Philadelphia Child Death Review Report ‐ 2009‐2010 19
There are multiple strategies that can be implemented in order to decrease the incidence of vaccine‐preventable illnesses and deaths among children (and adults). The Philadelphia Department of Public Health (PDPH) is already engaged in several important activities:
Reportable Conditions: PDPH conducts surveillance of 65 diseases and conditions, including most vaccine‐preventable illnesses. Surveillance, which includes tracking down laboratory results from patients, is an important contributor to the quality and completeness of child death reviews.
Vaccine Registries: PDPH also maintains an online vaccine registry for all city residents. Providers are mandated by health code to report the immunizations of all children and adults. Registries, such as this, help children remain up‐to‐date on their immunizations.
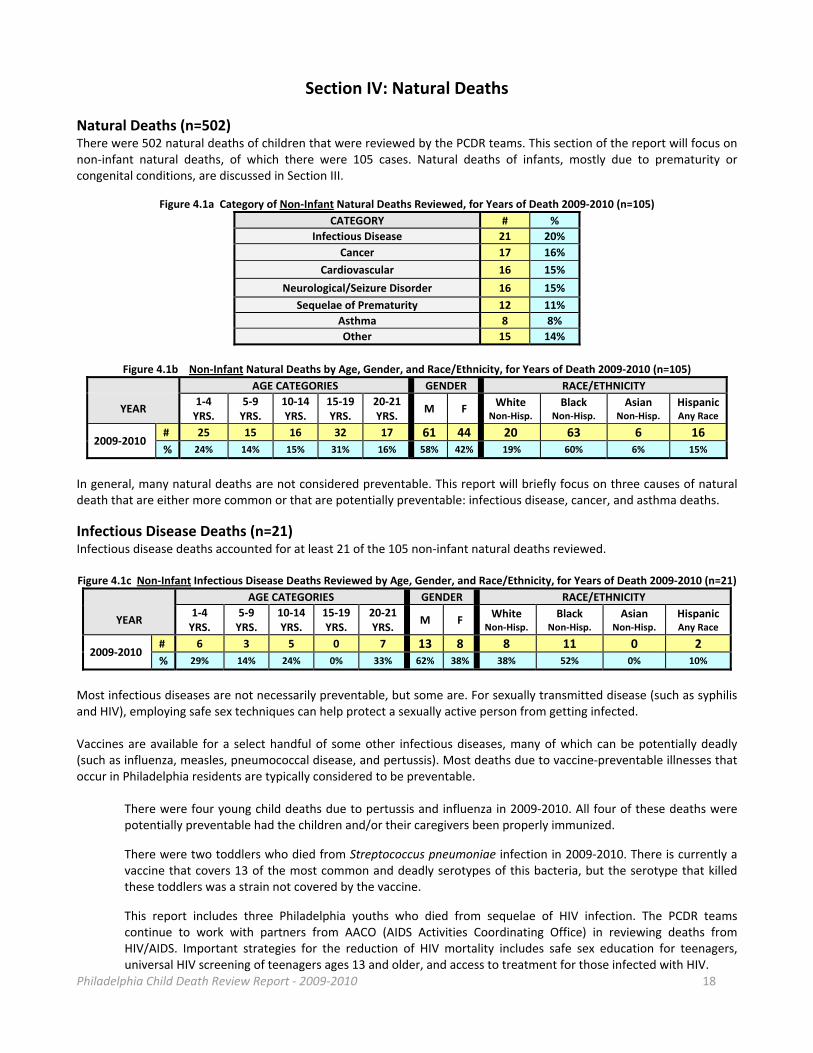
Asthma Deaths (n=8) Asthma accounted for 8 child deaths that occurred in 2009‐2010 and were reviewed by the PCDR teams. Asthma is a medically‐treatable condition that has variable levels of severity in the people it affects. Except for the worst sufferers, adherence to a properly‐prescribed asthma medication regimen can help prevent most asthmatics from dying and even prevent most hospital admissions. Unfortunately, the PCDR teams were unable to uncover the full circumstances surrounding the asthma deaths reviewed. What was learned is that most child asthma decedents were in their late teen years, and all of them were from racial or ethnic minority groups. Future reviews will attempt to look more in‐depth at the circumstances surrounding asthma deaths, so that possible areas of preventability might be uncovered.
Figure 4.1d Asthma Deaths Reviewed by Age, Gender, and Race/Ethnicity, for Years of Death 2009‐2010 (n=8)
AGE CATEGORIES GENDER RACE/ETHNICITY
YEAR 1‐4 YRS.
5‐9 YRS.
10‐14 YRS.
15‐19 YRS.
20‐21 YRS.
M F White
Non‐Hisp. Black
Non‐Hisp. Asian
Non‐Hisp. HispanicAny Race
2009‐2010
# 0 2 0 6 0 4 4 0 7 0 1
% 0% 25% 0% 75% 0% 50% 50% 0% 87% 0% 13%
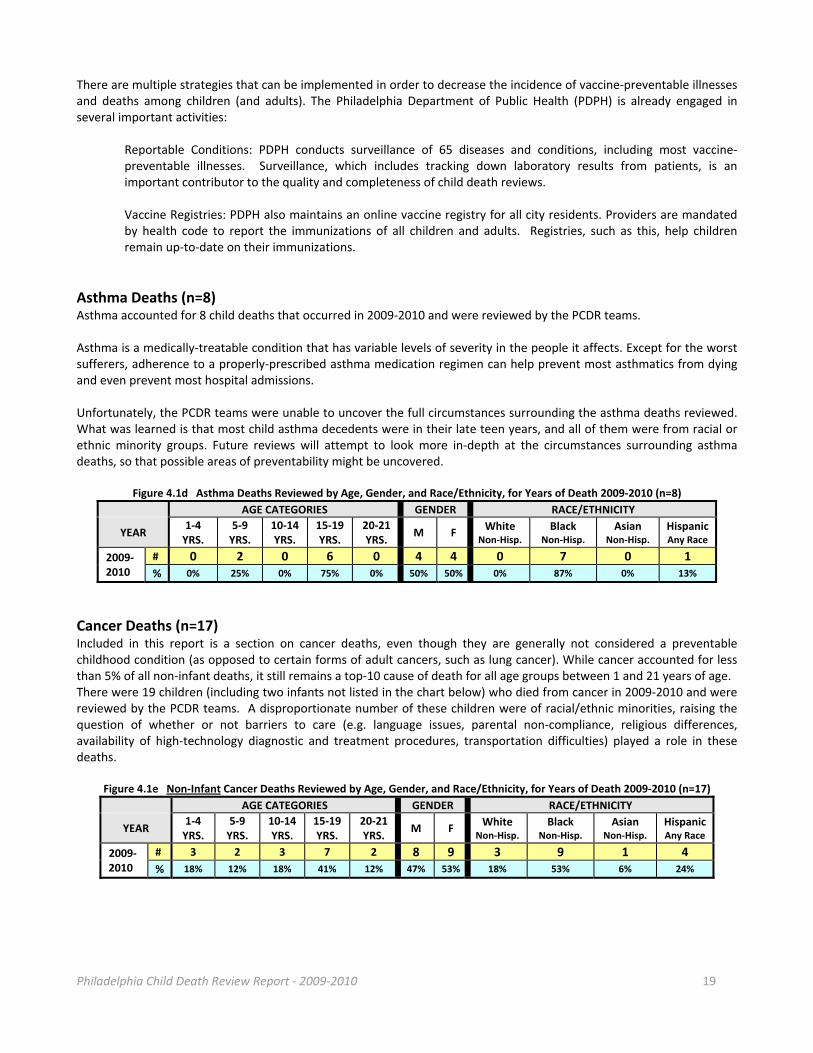
Cancer Deaths (n=17) Included in this report is a section on cancer deaths, even though they are generally not considered a preventable childhood condition (as opposed to certain forms of adult cancers, such as lung cancer). While cancer accounted for less than 5% of all non‐infant deaths, it still remains a top‐10 cause of death for all age groups between 1 and 21 years of age. There were 19 children (including two infants not listed in the chart below) who died from cancer in 2009‐2010 and were reviewed by the PCDR teams. A disproportionate number of these children were of racial/ethnic minorities, raising the question of whether or not barriers to care (e.g. language issues, parental non‐compliance, religious differences, availability of high‐technology diagnostic and treatment procedures, transportation difficulties) played a role in these deaths.
Figure 4.1e Non‐Infant Cancer Deaths Reviewed by Age, Gender, and Race/Ethnicity, for Years of Death 2009‐2010 (n=17)
AGE CATEGORIES GENDER RACE/ETHNICITY
YEAR 1‐4 YRS.
5‐9 YRS.
10‐14 YRS.
15‐19 YRS.
20‐21 YRS.
M F White
Non‐Hisp. Black
Non‐Hisp. Asian
Non‐Hisp. HispanicAny Race
2009‐2010
# 3 2 3 7 2 8 9 3 9 1 4
% 18% 12% 18% 41% 12% 47% 53% 18% 53% 6% 24%
Philadelphia Child Death Review Report ‐ 2009‐2010 20
Section V: Deaths due to Unintentional Injuries
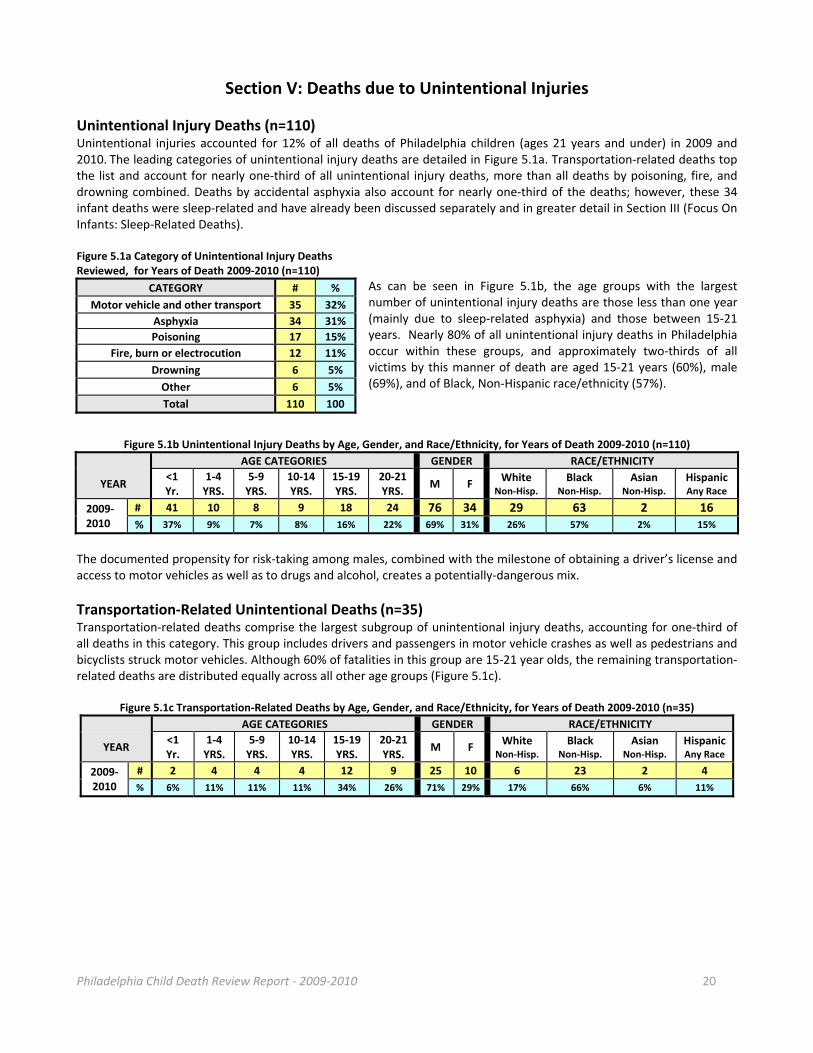
Unintentional Injury Deaths (n=110) Unintentional injuries accounted for 12% of all deaths of Philadelphia children (ages 21 years and under) in 2009 and 2010. The leading categories of unintentional injury deaths are detailed in Figure 5.1a. Transportation‐related deaths top the list and account for nearly one‐third of all unintentional injury deaths, more than all deaths by poisoning, fire, and drowning combined. Deaths by accidental asphyxia also account for nearly one‐third of the deaths; however, these 34 infant deaths were sleep‐related and have already been discussed separately and in greater detail in Section III (Focus On Infants: Sleep‐Related Deaths). Figure 5.1a Category of Unintentional Injury Deaths Reviewed, for Years of Death 2009‐2010 (n=110)
As can be seen in Figure 5.1b, the age groups with the largest number of unintentional injury deaths are those less than one year (mainly due to sleep‐related asphyxia) and those between 15‐21 years. Nearly 80% of all unintentional injury deaths in Philadelphia occur within these groups, and approximately two‐thirds of all victims by this manner of death are aged 15‐21 years (60%), male (69%), and of Black, Non‐Hispanic race/ethnicity (57%).
Figure 5.1b Unintentional Injury Deaths by Age, Gender, and Race/Ethnicity, for Years of Death 2009‐2010 (n=110)
AGE CATEGORIES GENDER RACE/ETHNICITY
YEAR <1 Yr.
1‐4 YRS.
5‐9 YRS.
10‐14 YRS.
15‐19 YRS.
20‐21 YRS.
M F White
Non‐Hisp.
Black Non‐Hisp.
Asian Non‐Hisp.
Hispanic Any Race
2009‐2010
# 41 10 8 9 18 24 76 34 29 63 2 16
% 37% 9% 7% 8% 16% 22% 69% 31% 26% 57% 2% 15%
The documented propensity for risk‐taking among males, combined with the milestone of obtaining a driver’s license and access to motor vehicles as well as to drugs and alcohol, creates a potentially‐dangerous mix.
Transportation‐Related Unintentional Deaths (n=35) Transportation‐related deaths comprise the largest subgroup of unintentional injury deaths, accounting for one‐third of all deaths in this category. This group includes drivers and passengers in motor vehicle crashes as well as pedestrians and bicyclists struck motor vehicles. Although 60% of fatalities in this group are 15‐21 year olds, the remaining transportation‐related deaths are distributed equally across all other age groups (Figure 5.1c).
Figure 5.1c Transportation‐Related Deaths by Age, Gender, and Race/Ethnicity, for Years of Death 2009‐2010 (n=35)
AGE CATEGORIES GENDER RACE/ETHNICITY
YEAR <1 Yr.
1‐4 YRS.
5‐9 YRS.
10‐14 YRS.
15‐19 YRS.
20‐21 YRS.
M F White
Non‐Hisp. Black
Non‐Hisp. Asian
Non‐Hisp. HispanicAny Race
2009‐2010
# 2 4 4 4 12 9 25 10 6 23 2 4
% 6% 11% 11% 11% 34% 26% 71% 29% 17% 66% 6% 11%
CATEGORY # %
Motor vehicle and other transport 35 32%
Asphyxia 34 31%
Poisoning 17 15%
Fire, burn or electrocution 12 11%
Drowning 6 5%
Other 6 5%
Total 110 100

Philadelphia Child Death Review Report ‐ 2009‐2010 21
Figure 5.1d Decedent’s Role in Transportation‐related Deaths, for Years of Death 2009‐2010 (n=35)
Figure 5.1e Vehicle Type Involved in Non‐Pedestrian Deaths Reviewed for Years of Death, 2009‐2010 (n=22)
Figure 5.2f Belt Usage in Transportation‐Related Deaths Reviewed, for Years of Death, 2009‐2010 (n=14)
Pedestrian deaths make up over one‐third of the transportation‐related child deaths in Philadelphia. Over half of the pedestrian deaths occurred in children less than 10 years of age, and more than half of them were struck by a vehicle when they darted out into the street from between two parked cars. In two of these instances, the victims were toddlers playing with other young children and were not being supervised by an adult. Driver fatalities also accounted for over one‐third of transportation‐related deaths (13 total cases). Six of them occurred when driving a car or van and another six occurred when operating a motorcycle or ATV. Eight fatalities, or nearly one‐quarter, occurred in motor vehicle passengers, one of whom was a passenger on a motorcycle.
Figure 5.2f illustrates the extent of seat belt usage in transportation‐related deaths. It includes the 14 children who were in a car, SUV, or truck, but not those who were using forms of transportation not requiring a seat belt (bicycle, ATV, motorcycle, or pedestrian fatalities). Incorrect or lack of use of available safety features was a prevalent factor in fatal crashes. Only 2 of the 13 children (or 15%) who died in automobile accidents were known to be properly using a safety belt at the time of their death. Nearly two‐thirds (8 children) were not using safety belts or child or booster seats. None of the decedents who were riding on motorcycles, ATVs, or bicycles were wearing required or recommended head protection.
Philadelphia Child Death Review Report ‐ 2009‐2010 22
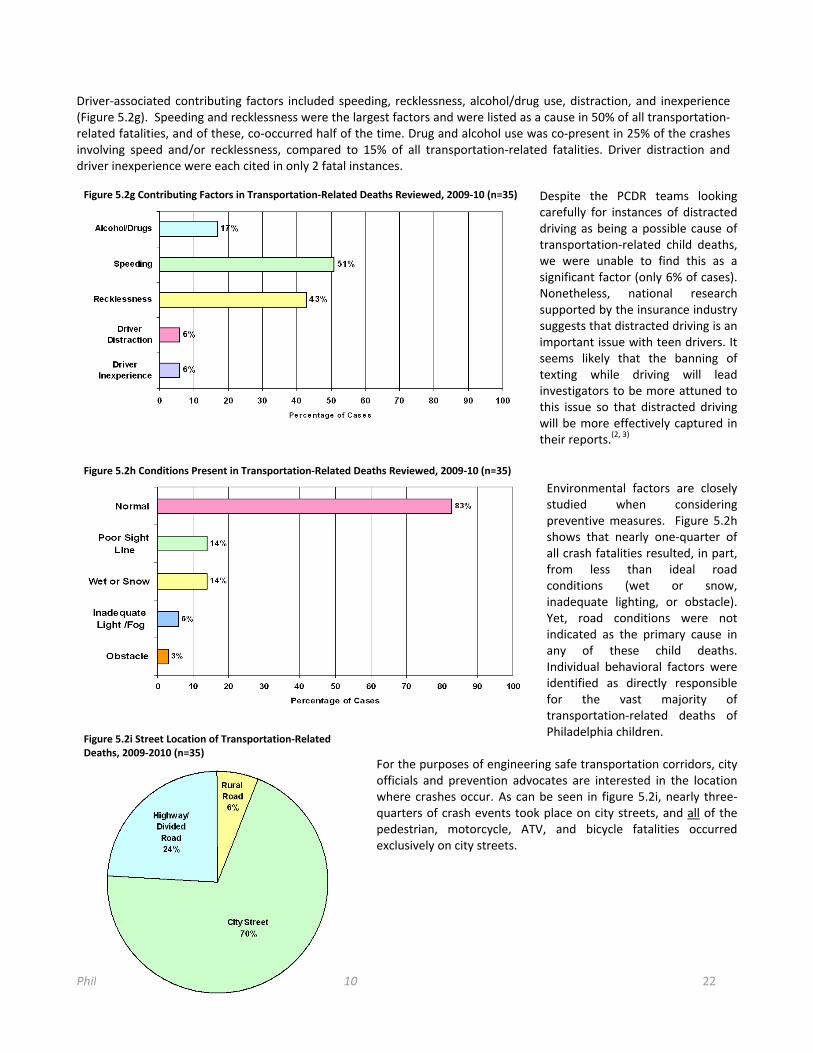
Driver‐associated contributing factors included speeding, recklessness, alcohol/drug use, distraction, and inexperience (Figure 5.2g). Speeding and recklessness were the largest factors and were listed as a cause in 50% of all transportation‐related fatalities, and of these, co‐occurred half of the time. Drug and alcohol use was co‐present in 25% of the crashes involving speed and/or recklessness, compared to 15% of all transportation‐related fatalities. Driver distraction and driver inexperience were each cited in only 2 fatal instances.
Despite the PCDR teams looking carefully for instances of distracted driving as being a possible cause of transportation‐related child deaths, we were unable to find this as a significant factor (only 6% of cases). Nonetheless, national research supported by the insurance industry suggests that distracted driving is an important issue with teen drivers. It seems likely that the banning of texting while driving will lead investigators to be more attuned to this issue so that distracted driving will be more effectively captured in their reports.(2, 3)
Environmental factors are closely studied when considering preventive measures. Figure 5.2h shows that nearly one‐quarter of all crash fatalities resulted, in part, from less than ideal road conditions (wet or snow, inadequate lighting, or obstacle). Yet, road conditions were not indicated as the primary cause in any of these child deaths. Individual behavioral factors were identified as directly responsible for the vast majority of transportation‐related deaths of Philadelphia children.
For the purposes of engineering safe transportation corridors, city officials and prevention advocates are interested in the location where crashes occur. As can be seen in figure 5.2i, nearly three‐quarters of crash events took place on city streets, and all of the pedestrian, motorcycle, ATV, and bicycle fatalities occurred exclusively on city streets.
Figure 5.2g Contributing Factors in Transportation‐Related Deaths Reviewed, 2009‐10 (n=35)
Figure 5.2h Conditions Present in Transportation‐Related Deaths Reviewed, 2009‐10 (n=35)
Figure 5.2i Street Location of Transportation‐RelatedDeaths, 2009‐2010 (n=35)

Philadelphia Child Death Review Report ‐ 2009‐2010 23
Recommendations: Motorcycles and ATVs Helmets: The National Highway Traffic Safety Administration estimated in 2006 that helmet use reduces the likelihood of death in motorcycle crashes by 37%, and reduces the risk of debilitating head trauma by 69%.(4, 5) It is also estimated that the United States saved $3 billion through helmet use in 2008, and could have saved an additional $1.3 billion in that year if all motorcycle and ATV riders had worn helmets.(6) These numbers underscore the importance of helmet laws and enforcing rider compliance with the laws. As seen in Figure 5.2j below, the states shaded in blue have enacted a “universal” helmet law (helmet required for all riders). Roughly the same number of states shaded in brown have a “partial” helmet law in effect (required for 21 years of age and under) and only a handful of states shaded in white have no helmet law.(4) In 2003, the Pennsylvania helmet laws were downgraded from a “universal helmet law” to a “partial helmet law”. The change in the law resulted in a drop in helmet use from 82% to 58% of riders.(4)
The lack of a universal law makes it especially difficult to enforce the age requirement. For example, when all riders are required to wear a helmet, it is much easier to determine who is out of compliance. In most partial law cases, helmet compliance is checked only when the driver is pulled over for some other infraction.(6)
To reduce fatalities to motorcycle and ATV riders, the following are recommended: Reinstate a universal helmet law for all riders Healthcare providers should educate riders about helmet use Consider making safety course completion a requirement before issuing a learner’s permit
Automobiles (Cars, Trucks, Vans) Restraints: Seat belt use has the greatest impact on reducing injuries and fatalities in crashes.(7) The fact that teens have the lowest rate of seat belt use compounds the problem.(8) As with motorcycles and ATVs, having universal and clearly enforceable laws is of utmost importance. Pennsylvania does not currently have a strict primary seatbelt law that allows an officer to both pull over and fine a motorist for failing to restrain all drivers and passengers in a vehicle.(7,9) The state implements a mixture of primary and secondary laws. These laws allow an officer to stop a motorist for visibly violating seat belt or restraint laws, but can only fine them if they also have another infraction. The fine for all seatbelt‐related offenses is only $10.(10) Further, although it is required that all children through age 8 years are restrained in a child seat or booster, the law has inconsistencies (such as allowing children to be unrestrained if a child seat or booster seat proof‐of‐purchase can be produced).(10) The overall ambiguity in the child restraint laws creates a challenge for officers to enforce the laws and also creates confusion for the public.
Figure 5.2j Helmet Laws by State, 2010 (CDC) (4)
Figure 5.2k Seatbelt Laws by State, 2009 (CDC) (7)
Philadelphia Child Death Review Report ‐ 2009‐2010 24
To reduce child driver and passenger fatalities in motor vehicle crashes, the following are recommended:
Police should continue to enforce safety seat and booster laws - Reduces chance of death to infants by 71% and 54% for children 1‐4 (9) - Laws such as this generally reduce fatalities to children under 4 by 15% (10)
Lawmakers should upgrade to strict primary seatbelt laws - California witnessed a 12% increase in usage when they upgraded to strict primary laws - Fatality rates in primary states dropped 21%, compared to 7% drop associated with secondary laws (9)
Increase fines for restraint infractions to increase effectiveness - Increases of fines have been shown to increase compliance 3‐4% (10) - The benefits of increasing fines is additive to the benefits from primary and secondary laws.
Introduce safety campaigns to educate the public
Impairment: Nationally, 30 people die every day as a result of alcohol‐ or drug‐impaired drivers, or roughly one fatality every 48 minutes at an estimated cost of $51 billion annually.(3) Crash risk for drivers is highest during the first few years of eligible driving and compounds the effects of driving under the influence. The minimum legal drinking age in Pennsylvania is 21, as in most states. This means that any positive blood‐alcohol test in a person under 21 makes it illegal to drive under the Zero Tolerance Law.(11) For those who are 21 or older, Pennsylvania currently enforces a BAC legal limit of .08%, which was changed from .10% in 2003. Unlike in most states, Pennsylvania does not suspend a license for a first offense. Offenders are placed on 6 month probation, fined $300, and required to attend an alcohol safety school. Suspensions are not levied until the second offense, when fines can reach $2500 and include up to 6 months of jail time and enrollment in one year of ignition interlock programs. Certainly, much progress has been made legislatively, but our youngest drivers are the ones who are the most at risk, and the legislation should reflect this priority. (11) A young driver in Pennsylvania can potentially drive impaired for a considerable period of time before being cited or having an accident. If the driver is fortunate enough to be stopped before an accident, he will face no practical restrictions on his driving privileges until the second offense. The probationary period is an administrative period during which certain conditions must be met (such as completing a safety school program), but the driver may continue to operate a vehicle until the next offense (or worse). This could be the critical window of time that could lead to loss of life.(3, 11)
Therefore, to reduce impairment‐related motor vehicle injury deaths, the following are recommended:
Enforce Zero Tolerance Laws - These have been shown nationally to reduced impaired fatalities by 4% (3)
Enforce DUI penalties
- Enforcement of laws and the .08 BAC is thought to reduce fatalities by up to 7% (9) Enforce and educate about Pennsylvania’s graduated drivers licensing program
- With midnight curfew, estimated to reduced alcohol‐related youth fatalities by 5% (12) Modify current first‐offense DUI penalties to include license suspensions
- Shown nationally to decrease alcohol‐related fatalities on average by 6.5% (13) Increase the use of Intensive Sobriety Checkpoint Programs
- These have been shown in Pennsylvania to reduce alcohol‐related fatalities by 15% (13) Expand ignition interlock programs to DUI first‐offenders
- Shown nationally to reduce recidivism by 75% and alcohol‐related fatalities by 7% (3)
Philadelphia Child Death Review Report ‐ 2009‐2010 25
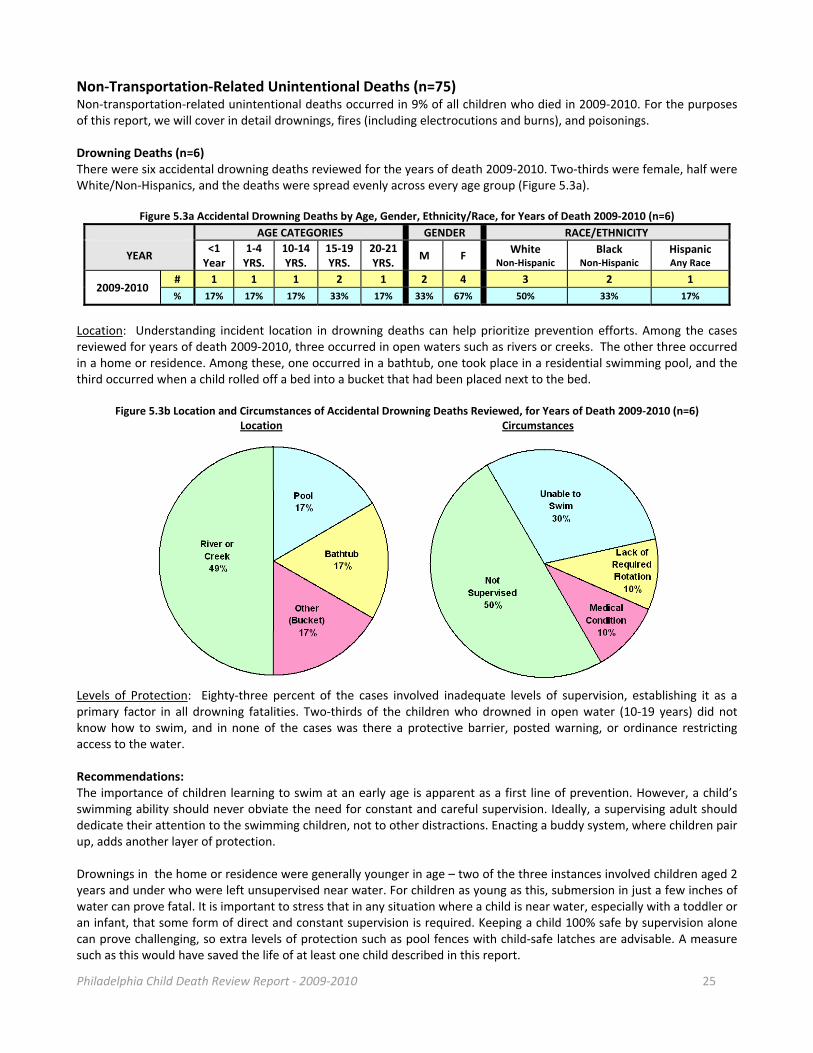
Non‐Transportation‐Related Unintentional Deaths (n=75) Non‐transportation‐related unintentional deaths occurred in 9% of all children who died in 2009‐2010. For the purposes of this report, we will cover in detail drownings, fires (including electrocutions and burns), and poisonings. Drowning Deaths (n=6) There were six accidental drowning deaths reviewed for the years of death 2009‐2010. Two‐thirds were female, half were White/Non‐Hispanics, and the deaths were spread evenly across every age group (Figure 5.3a).
Figure 5.3a Accidental Drowning Deaths by Age, Gender, Ethnicity/Race, for Years of Death 2009‐2010 (n=6)
AGE CATEGORIES GENDER RACE/ETHNICITY
YEAR <1 Year
1‐4 YRS.
10‐14 YRS.
15‐19 YRS.
20‐21 YRS.
M F White
Non‐Hispanic Black
Non‐Hispanic Hispanic Any Race
2009‐2010 # 1 1 1 2 1 2 4 3 2 1
% 17% 17% 17% 33% 17% 33% 67% 50% 33% 17%
Location: Understanding incident location in drowning deaths can help prioritize prevention efforts. Among the cases reviewed for years of death 2009‐2010, three occurred in open waters such as rivers or creeks. The other three occurred in a home or residence. Among these, one occurred in a bathtub, one took place in a residential swimming pool, and the third occurred when a child rolled off a bed into a bucket that had been placed next to the bed.
Figure 5.3b Location and Circumstances of Accidental Drowning Deaths Reviewed, for Years of Death 2009‐2010 (n=6) Location Circumstances
Levels of Protection: Eighty‐three percent of the cases involved inadequate levels of supervision, establishing it as a primary factor in all drowning fatalities. Two‐thirds of the children who drowned in open water (10‐19 years) did not know how to swim, and in none of the cases was there a protective barrier, posted warning, or ordinance restricting access to the water. Recommendations: The importance of children learning to swim at an early age is apparent as a first line of prevention. However, a child’s swimming ability should never obviate the need for constant and careful supervision. Ideally, a supervising adult should dedicate their attention to the swimming children, not to other distractions. Enacting a buddy system, where children pair up, adds another layer of protection. Drownings in the home or residence were generally younger in age – two of the three instances involved children aged 2 years and under who were left unsupervised near water. For children as young as this, submersion in just a few inches of water can prove fatal. It is important to stress that in any situation where a child is near water, especially with a toddler or an infant, that some form of direct and constant supervision is required. Keeping a child 100% safe by supervision alone can prove challenging, so extra levels of protection such as pool fences with child‐safe latches are advisable. A measure such as this would have saved the life of at least one child described in this report.
Philadelphia Child Death Review Report ‐ 2009‐2010 26
Therefore, to reduce open water drowning fatalities, the following are recommended:
Life Vests - Parents should ensure that all children (and themselves) are wearing US Coast Guard‐approved life
vests while boating (no air or foam filled floaties) - Officials should enforce all violations of the regulations
Supervision - Children should be educated to utilize a buddy system and to seek adult supervision - Parents should be educated about supervision and to provide it without distraction - Parents should choose sites with lifeguards when possible
Swimming Lessons - Educate the community about the importance of learning to swim at an early age - Explore community programs to teach those in low‐income families how to swim
Barriers - Involve policy‐makers to create legislation that restricts access to potentially dangerous bodies of
water
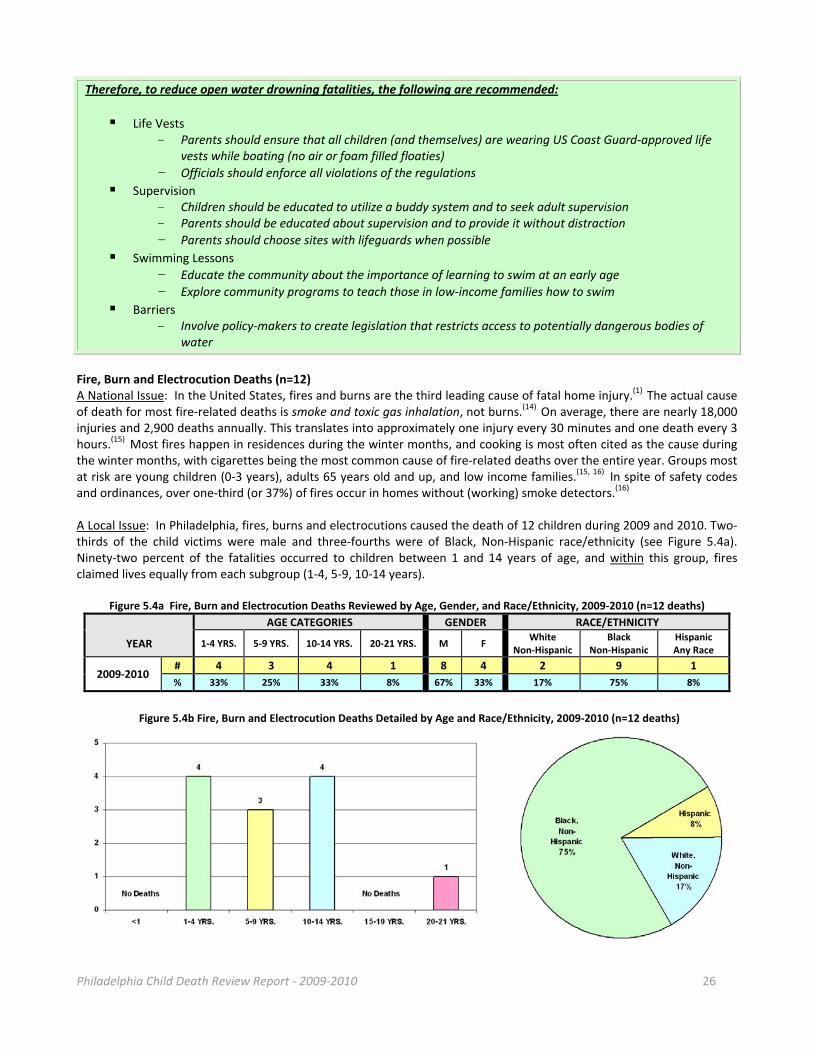
Fire, Burn and Electrocution Deaths (n=12) A National Issue: In the United States, fires and burns are the third leading cause of fatal home injury.(1) The actual cause of death for most fire‐related deaths is smoke and toxic gas inhalation, not burns.(14) On average, there are nearly 18,000 injuries and 2,900 deaths annually. This translates into approximately one injury every 30 minutes and one death every 3 hours.(15) Most fires happen in residences during the winter months, and cooking is most often cited as the cause during the winter months, with cigarettes being the most common cause of fire‐related deaths over the entire year. Groups most at risk are young children (0‐3 years), adults 65 years old and up, and low income families.(15, 16) In spite of safety codes and ordinances, over one‐third (or 37%) of fires occur in homes without (working) smoke detectors.(16) A Local Issue: In Philadelphia, fires, burns and electrocutions caused the death of 12 children during 2009 and 2010. Two‐thirds of the child victims were male and three‐fourths were of Black, Non‐Hispanic race/ethnicity (see Figure 5.4a). Ninety‐two percent of the fatalities occurred to children between 1 and 14 years of age, and within this group, fires claimed lives equally from each subgroup (1‐4, 5‐9, 10‐14 years).
Figure 5.4a Fire, Burn and Electrocution Deaths Reviewed by Age, Gender, and Race/Ethnicity, 2009‐2010 (n=12 deaths)
AGE CATEGORIES GENDER RACE/ETHNICITY
YEAR 1‐4 YRS. 5‐9 YRS. 10‐14 YRS. 20‐21 YRS. M F White
Non‐Hispanic Black
Non‐Hispanic HispanicAny Race
2009‐2010 # 4 3 4 1 8 4 2 9 1
% 33% 25% 33% 8% 67% 33% 17% 75% 8%
Figure 5.4b Fire, Burn and Electrocution Deaths Detailed by Age and Race/Ethnicity, 2009‐2010 (n=12 deaths)
Philadelphia Child Death Review Report ‐ 2009‐2010 27
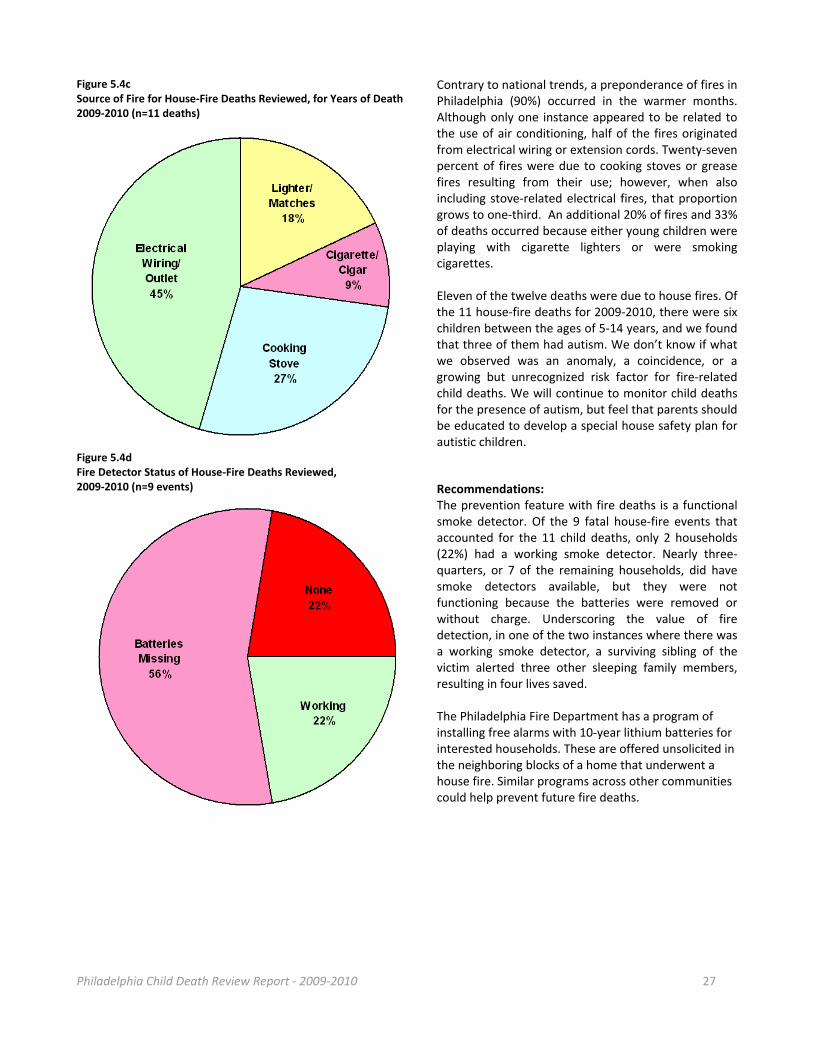
Contrary to national trends, a preponderance of fires in Philadelphia (90%) occurred in the warmer months. Although only one instance appeared to be related to the use of air conditioning, half of the fires originated from electrical wiring or extension cords. Twenty‐seven percent of fires were due to cooking stoves or grease fires resulting from their use; however, when also including stove‐related electrical fires, that proportion grows to one‐third. An additional 20% of fires and 33% of deaths occurred because either young children were playing with cigarette lighters or were smoking cigarettes. Eleven of the twelve deaths were due to house fires. Of the 11 house‐fire deaths for 2009‐2010, there were six children between the ages of 5‐14 years, and we found that three of them had autism. We don’t know if what we observed was an anomaly, a coincidence, or a growing but unrecognized risk factor for fire‐related child deaths. We will continue to monitor child deaths for the presence of autism, but feel that parents should be educated to develop a special house safety plan for autistic children.
Recommendations: The prevention feature with fire deaths is a functional smoke detector. Of the 9 fatal house‐fire events that accounted for the 11 child deaths, only 2 households (22%) had a working smoke detector. Nearly three‐quarters, or 7 of the remaining households, did have smoke detectors available, but they were not functioning because the batteries were removed or without charge. Underscoring the value of fire detection, in one of the two instances where there was a working smoke detector, a surviving sibling of the victim alerted three other sleeping family members, resulting in four lives saved. The Philadelphia Fire Department has a program of installing free alarms with 10‐year lithium batteries for interested households. These are offered unsolicited in the neighboring blocks of a home that underwent a house fire. Similar programs across other communities could help prevent future fire deaths.
Figure 5.4c Source of Fire for House‐Fire Deaths Reviewed, for Years of Death 2009‐2010 (n=11 deaths)
Figure 5.4d Fire Detector Status of House‐Fire Deaths Reviewed, 2009‐2010 (n=9 events)

Philadelphia Child Death Review Report ‐ 2009‐2010 28
Therefore, to reduce child fatalities by fire, the following are recommended:
Smoke Detectors The key word in fire safety and prevention is functional smoke detectors. If there’s a smoke detector in the household but the battery is in the TV remote control, then that’s as good as no smoke detector. Battery operated alarms also require frequent maintenance to ensure proper functioning. Batteries that are powered with 10‐year lithium batteries do not reduce the need for regular testing, but do reduce the likelihood that the alarm will fail due to a power loss. Alarms that are hard‐wired into the house electricity will ensure power as long as the electricity is working, but this sort of alarm still requires checking and replacing of the backup battery.
Philadelphia should enact and enforce smoke detector laws for all rental units. (16)
- The CDC reports that having a working fire alarm reduces the risk of fire in residential homes by 50% (17)
Communities need to invest in their local Juvenile Fire Setter or Fire Stopper programs. Children are a major source of the start of fires, whether from unintentional mishaps with candles, from playing with matches or lighters, or from deliberate acts of arson.
Electrical and Cooking Safety Nearly three‐fourths of all fires reviewed were caused by electrical or cooking sources, identifying these causes as a priority for preventive measures. Electrical fires can start from “fixed wiring,” such as outlets and old wiring. Extension cords and cords for appliances can also be the culprit. Nationally, it is reported that most fires that can be prevented can be traced to using extension cords incorrectly or overloading circuits.(18)
Routine checks of the condition of all extension cords and appliance cords (18) - Look for fraying of cords, overloading of circuits, and placement of cords - Replace anything that is worn, becomes warm, sparks or smokes - Consider other danger factors, such as cords that are near water sources
Routinely check for overloading of circuits - Never force 3‐prong cords into 2‐prong outlets - Do not daisy‐chain extension cords that each supply multiple appliances
sourced from one outlet - If the cord becomes hot to the touch, this is a warning sign that the
circuit is overloaded - If your house has old and cracked wiring, consider replacing it - Replace outlets in high‐use areas (kitchen, bathroom, and living area)
with ground fault interrupt (GFI) outlets that comply with the national fire code for new buildings.

Philadelphia Child Death Review Report ‐ 2009‐2010 29
Poisoning Deaths (n=17) Poisoning deaths accounted for a total of 17 child deaths reviewed, for years of death 2009‐2010. The poisoning deaths discussed in this section only include unintentional (accidental) poisoning deaths. Intentional poisonings (suicidal and homicidal) are discussed in Section VI.
All of the 17 unintentional poisoning deaths reviewed were drug‐related deaths (what in lay terms may be called an ”accidental overdose”). The vast majority of these deaths occurred in White, Non‐Hispanics (76%) and in males (88%). All but one of the deaths occurred in children aged 18 years or older. The most common drugs found were opiates and opioids (methadone, heroin, oxycodone and others), benzodiazepines, and cocaine. These are further described in Figure 5.5b below.
Figure 5.5a Drug‐Related Deaths by Age, Gender, and Ethnicity/Race, for Years of Death 2009‐2010 (n=17)
AGE CATEGORIES GENDER RACE/ETHNICITY
YEAR 5‐9 YRS. 15‐19 YRS. 20‐21 YRS. M F White
Non‐Hispanic Black
Non‐Hispanic HispanicAny Race
2009‐2010 # 1 3 13 15 2 13 2 2
% 6% 18% 76% 88% 12% 76% 12% 12%
Figure 5.5b Substances Detected in Toxicology Reports of Drug‐Related Deaths Reviewed, 2009‐2010 (n=17)
Therefore, to reduce child fatalities by poisoning, the following are recommended:
Maintain adequate drug and alcohol treatment facilities, and ensure that wait time for entry is not unduly long
Ensure adequate access to mental health professionals for all children, regardless of insurance status.
Other Non‐Transportation Deaths (n=6) Of the 2009‐2010 unintentional injury deaths reviewed, there were six additional cases not discussed above, including:
One death due to a complication of medical therapy
One death of a young child due to the ingestion of a battery that ultimately led to an esophageal perforation Of note, of the 2009‐2010 unintentional injury deaths reviewed, there were:
No accidental firearm deaths
No deaths from exposure to environmental heat or cold
No accidental fall or crush deaths Recommendations:
Physicians who perform well‐child care exams should provide parents/caretakers with non‐judgmental education about safe gun storage and safety devices

Philadelphia Child Death Review Report ‐ 2009‐2010 30
Section VI: Deaths due to Intentional Injuries
Intentional Injury Deaths (n=218) Intentional injury deaths result from the willful act of an individual to cause harm. For the purposes of this report, this section includes suicides and homicides, including deaths due to child abuse and neglect. Youth deaths due to intentional injury are of great importance in the United States, where violent injury deaths disproportionately affect adolescents compared to other age groups. For children who died in 2009‐2010 and were reviewed by the PCDR teams, intentional injury deaths accounted for nearly one‐quarter of all child deaths. Teenagers and youths ages 15‐21 years make up 90% of deaths by this manner, or 22% of all child deaths reviewed in 2009‐2010. Figure 6.1a Intentional Injury Deaths by Age, Gender and Ethnicity, for Years of Death 2009‐2010 (n=218)
AGE CATEGORIES GENDER RACE/ETHNICITY
YEAR <1 Yr.
1‐4 YRS.
5‐9 YRS.
10‐14 YRS.
15‐19 YRS.
20‐21 YRS.
M F White
Non‐Hisp. Black
Non‐Hisp. Asian
Non‐Hisp. HispanicAny Race
2009‐2010 # 4 6 2 11 102 93 191 27 19 173 3 23
% 2% 3% 1% 5% 47% 43% 88% 12% 9% 80% 1% 11%
Figure 6.1a illustrates the characteristics of those children most vulnerable to death by intentional injury. The typical victim of an intentional injury death for years of death 2009‐2010 overwhelmingly tended to be male (88%), aged 17‐21 years (80%), and of Black and/or Hispanic race and ethnicity (91%). These trends vary significantly when comparing child abuse and neglect, other homicides, and suicides. These differences will be described in detail in the sections to follow.
In spite of the trends, children of all ages, genders, and racial/ethnic backgrounds can be the victims of violence. With homicides, the offender can be a stranger or acquaintance, but often the offender is someone the child trusts, such as a family member, caregiver, sibling, or extended relative. Thorough reviews of each fatality by the PCDR teams advance an understanding of the scope of fatal victimization, abuse, and self‐injury, and also uncover the antecedents to these tragic events. During the reviews, every aspect of the child’s life bearing on the outcome is considered when answering the following questions: Why did this happen?, What could have been done to prevent this?, and, moving forward, How can this knowledge be implemented to prevent the deaths of other children in Philadelphia? In order to answer these questions, all major systems touching a child’s life are involved in the process. This includes institutions, such as schools, hospitals, child protective services, behavioral health representatives, police departments, delinquency courts, and general supportive service providers. Review discussions generally are guided by the risk factors for violence that include: prior history of violence (court history, delinquency, detention), drug/alcohol use, poor family functioning, school performance (grades, truancy, suspensions), and poverty‐related issues in the community.
Child Abuse & Neglect Deaths (n=13) Child abuse and neglect is defined by the Federal Child Abuse Prevention and Treatment Act (CAPTA) as any recent act or failure to act on the part of a parent or caretaker that results in death. In 2006, nearly 1 million children in the United States were victims of some form of maltreatment and 1,500 of these events were fatal.(20) Figure 6.1b Child Abuse & Neglect Deaths by Age, Gender and Ethnicity, for Years of Death 2009‐2010 (n=13)
AGE CATEGORIES GENDER RACE/ETHNICITY
YEAR <1 YRS. 1‐4 YRS. 10‐14 YRS. 15‐19 YRS. M F White
Non‐Hispanic Black
Non‐Hispanic HispanicAny Race
2009‐2010 # 4 6 1 2 7 6 2 7 4
% 31% 46% 8% 15% 54% 46% 15% 54% 31%
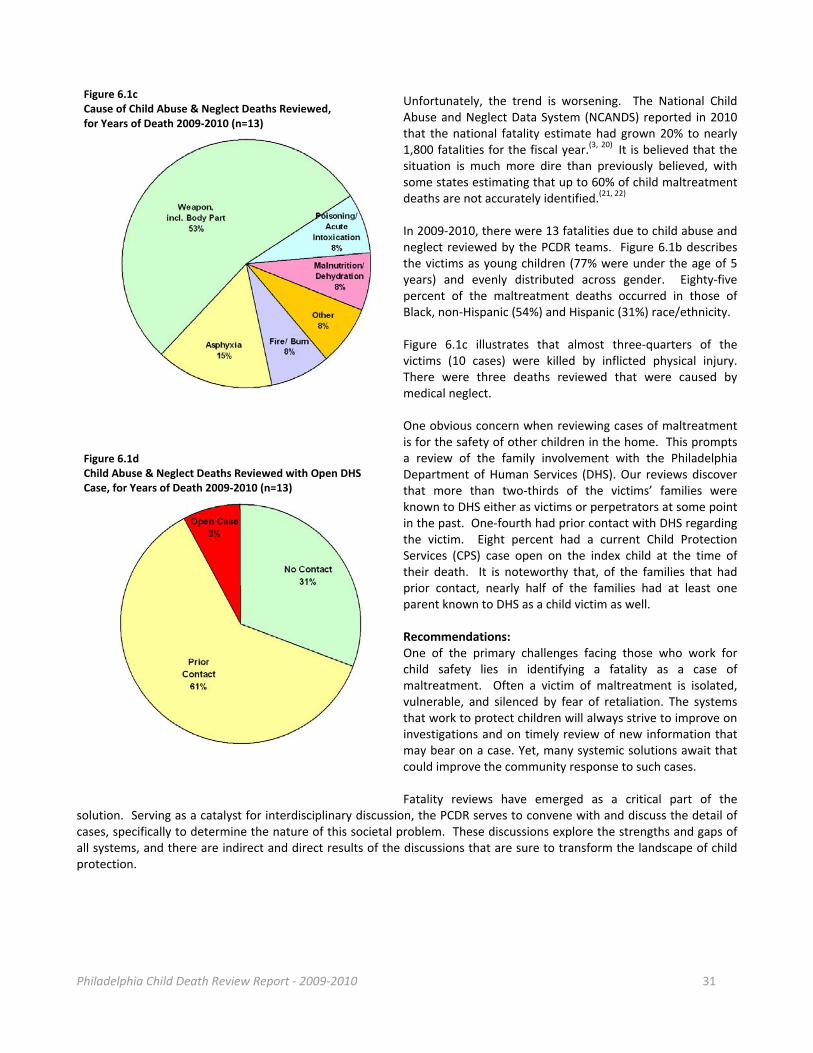
Philadelphia Child Death Review Report ‐ 2009‐2010 31
Unfortunately, the trend is worsening. The National Child Abuse and Neglect Data System (NCANDS) reported in 2010 that the national fatality estimate had grown 20% to nearly 1,800 fatalities for the fiscal year.(3, 20) It is believed that the situation is much more dire than previously believed, with some states estimating that up to 60% of child maltreatment deaths are not accurately identified.(21, 22) In 2009‐2010, there were 13 fatalities due to child abuse and neglect reviewed by the PCDR teams. Figure 6.1b describes the victims as young children (77% were under the age of 5 years) and evenly distributed across gender. Eighty‐five percent of the maltreatment deaths occurred in those of Black, non‐Hispanic (54%) and Hispanic (31%) race/ethnicity. Figure 6.1c illustrates that almost three‐quarters of the victims (10 cases) were killed by inflicted physical injury. There were three deaths reviewed that were caused by medical neglect. One obvious concern when reviewing cases of maltreatment is for the safety of other children in the home. This prompts a review of the family involvement with the Philadelphia Department of Human Services (DHS). Our reviews discover that more than two‐thirds of the victims’ families were known to DHS either as victims or perpetrators at some point in the past. One‐fourth had prior contact with DHS regarding the victim. Eight percent had a current Child Protection Services (CPS) case open on the index child at the time of their death. It is noteworthy that, of the families that had prior contact, nearly half of the families had at least one parent known to DHS as a child victim as well. Recommendations: One of the primary challenges facing those who work for child safety lies in identifying a fatality as a case of maltreatment. Often a victim of maltreatment is isolated, vulnerable, and silenced by fear of retaliation. The systems that work to protect children will always strive to improve on investigations and on timely review of new information that may bear on a case. Yet, many systemic solutions await that could improve the community response to such cases. Fatality reviews have emerged as a critical part of the
solution. Serving as a catalyst for interdisciplinary discussion, the PCDR serves to convene with and discuss the detail of cases, specifically to determine the nature of this societal problem. These discussions explore the strengths and gaps of all systems, and there are indirect and direct results of the discussions that are sure to transform the landscape of child protection.
Figure 6.1c Cause of Child Abuse & Neglect Deaths Reviewed, for Years of Death 2009‐2010 (n=13)
Figure 6.1d Child Abuse & Neglect Deaths Reviewed with Open DHS Case, for Years of Death 2009‐2010 (n=13)

Philadelphia Child Death Review Report ‐ 2009‐2010 32
Therefore to reduce the child fatalities due to maltreatment, the following are recommended: Teams, Teams, Teams
Counties or cities must continue to conduct full investigations/reviews for any suspicious child deaths within their jurisdiction
- Review of cases involving families with a history of child protective services offers opportunities for prevention
- Counties or cities need to help protect vulnerable siblings while investigating a potentially suspicious child death; this can be accomplished by ensuring cooperation with the county child protection services agency and others, such as the Medical Examiner’s Office
- In Philadelphia, children who die from child abuse and neglect ultimately get reviewed by two separate child death review teams: by the PCDR teams and by DHS.
The PCDR team will forge new relationships with local agencies to strengthen the prevention network
- Combining two or more data sources on a child has been shown to dramatically increase the accuracy of identifying a maltreatment fatality
The PCDR Team will continue to seek out recommendations from our established partnerships with child welfare, child health and safety groups
- In many states, including Pennsylvania, recommendations derived from annual reports can lead to legislation, policy and meaningful prevention initiatives
Convene policy meetings specific to manner of death to address issues around maltreatment fatalities
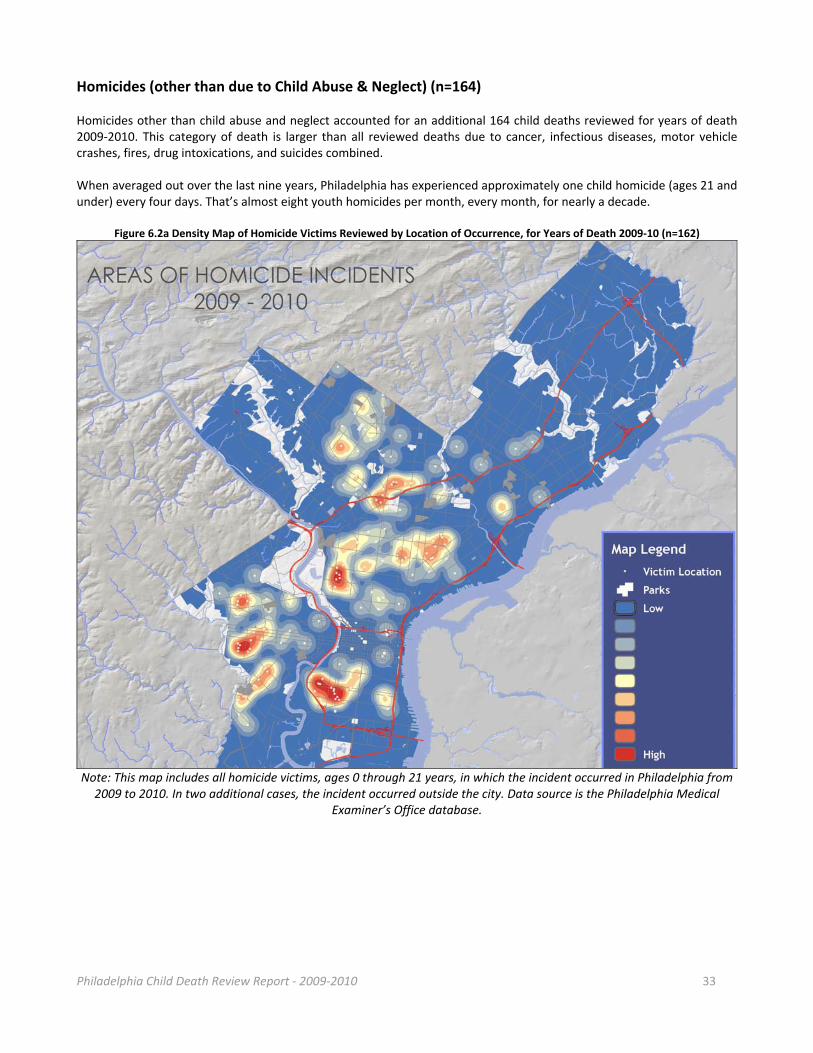
Philadelphia Child Death Review Report ‐ 2009‐2010 33
Homicides (other than due to Child Abuse & Neglect) (n=164) Homicides other than child abuse and neglect accounted for an additional 164 child deaths reviewed for years of death 2009‐2010. This category of death is larger than all reviewed deaths due to cancer, infectious diseases, motor vehicle crashes, fires, drug intoxications, and suicides combined. When averaged out over the last nine years, Philadelphia has experienced approximately one child homicide (ages 21 and under) every four days. That’s almost eight youth homicides per month, every month, for nearly a decade.
Figure 6.2a Density Map of Homicide Victims Reviewed by Location of Occurrence, for Years of Death 2009‐10 (n=162)
Note: This map includes all homicide victims, ages 0 through 21 years, in which the incident occurred in Philadelphia from 2009 to 2010. In two additional cases, the incident occurred outside the city. Data source is the Philadelphia Medical
Examiner’s Office database.
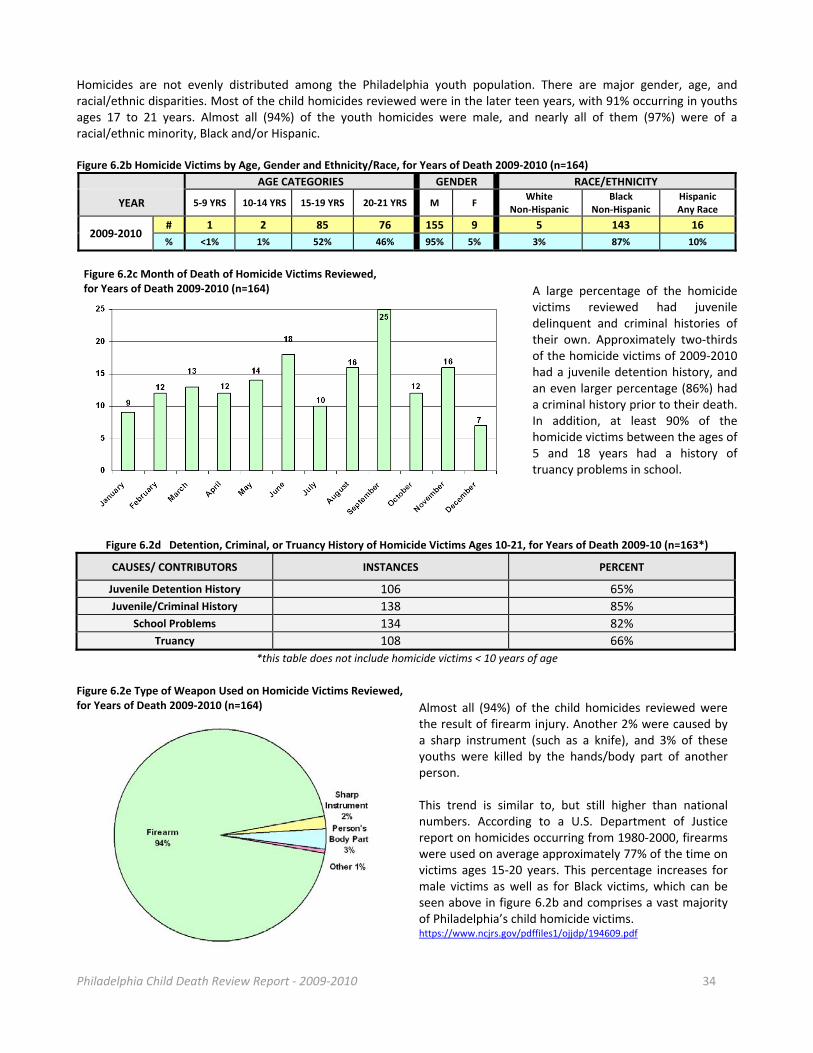
Philadelphia Child Death Review Report ‐ 2009‐2010 34
Homicides are not evenly distributed among the Philadelphia youth population. There are major gender, age, and racial/ethnic disparities. Most of the child homicides reviewed were in the later teen years, with 91% occurring in youths ages 17 to 21 years. Almost all (94%) of the youth homicides were male, and nearly all of them (97%) were of a racial/ethnic minority, Black and/or Hispanic. Figure 6.2b Homicide Victims by Age, Gender and Ethnicity/Race, for Years of Death 2009‐2010 (n=164)
AGE CATEGORIES GENDER RACE/ETHNICITY
YEAR 5‐9 YRS 10‐14 YRS 15‐19 YRS 20‐21 YRS M F White
Non‐Hispanic Black
Non‐Hispanic HispanicAny Race
2009‐2010 # 1 2 85 76 155 9 5 143 16
% <1% 1% 52% 46% 95% 5% 3% 87% 10%
A large percentage of the homicide victims reviewed had juvenile delinquent and criminal histories of their own. Approximately two‐thirds of the homicide victims of 2009‐2010 had a juvenile detention history, and an even larger percentage (86%) had a criminal history prior to their death. In addition, at least 90% of the homicide victims between the ages of 5 and 18 years had a history of truancy problems in school.
Figure 6.2d Detention, Criminal, or Truancy History of Homicide Victims Ages 10‐21, for Years of Death 2009‐10 (n=163*)
CAUSES/ CONTRIBUTORS INSTANCES PERCENT
Juvenile Detention History 106 65%
Juvenile/Criminal History 138 85%
School Problems 134 82%
Truancy 108 66%
*this table does not include homicide victims < 10 years of age
Figure 6.2e Type of Weapon Used on Homicide Victims Reviewed, for Years of Death 2009‐2010 (n=164) Almost all (94%) of the child homicides reviewed were
the result of firearm injury. Another 2% were caused by a sharp instrument (such as a knife), and 3% of these youths were killed by the hands/body part of another person. This trend is similar to, but still higher than national numbers. According to a U.S. Department of Justice report on homicides occurring from 1980‐2000, firearms were used on average approximately 77% of the time on victims ages 15‐20 years. This percentage increases for male victims as well as for Black victims, which can be seen above in figure 6.2b and comprises a vast majority of Philadelphia’s child homicide victims. https://www.ncjrs.gov/pdffiles1/ojjdp/194609.pdf
Figure 6.2c Month of Death of Homicide Victims Reviewed, for Years of Death 2009‐2010 (n=164)
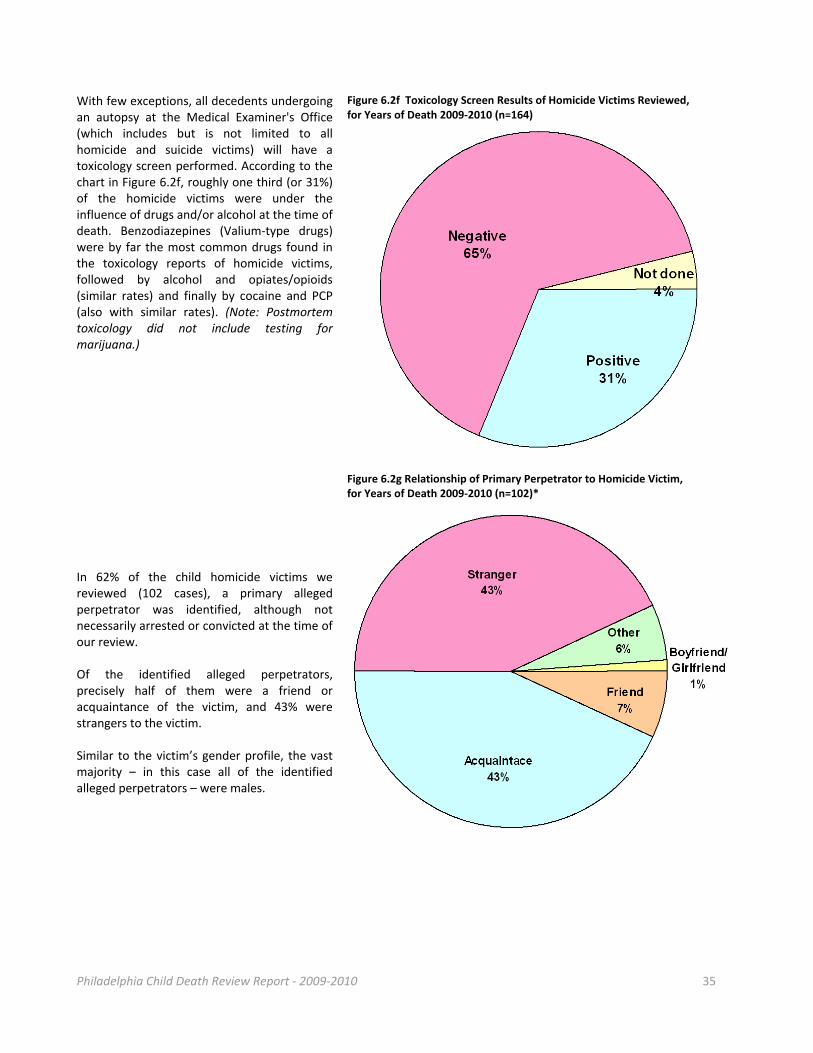
Philadelphia Child Death Review Report ‐ 2009‐2010 35
With few exceptions, all decedents undergoing an autopsy at the Medical Examiner's Office (which includes but is not limited to all homicide and suicide victims) will have a toxicology screen performed. According to the chart in Figure 6.2f, roughly one third (or 31%) of the homicide victims were under the influence of drugs and/or alcohol at the time of death. Benzodiazepines (Valium‐type drugs) were by far the most common drugs found in the toxicology reports of homicide victims, followed by alcohol and opiates/opioids (similar rates) and finally by cocaine and PCP (also with similar rates). (Note: Postmortem toxicology did not include testing for marijuana.)
Figure 6.2f Toxicology Screen Results of Homicide Victims Reviewed, for Years of Death 2009‐2010 (n=164)
In 62% of the child homicide victims we reviewed (102 cases), a primary alleged perpetrator was identified, although not necessarily arrested or convicted at the time of our review. Of the identified alleged perpetrators, precisely half of them were a friend or acquaintance of the victim, and 43% were strangers to the victim. Similar to the victim’s gender profile, the vast majority – in this case all of the identified alleged perpetrators – were males.
Figure 6.2g Relationship of Primary Perpetrator to Homicide Victim, for Years of Death 2009‐2010 (n=102)*
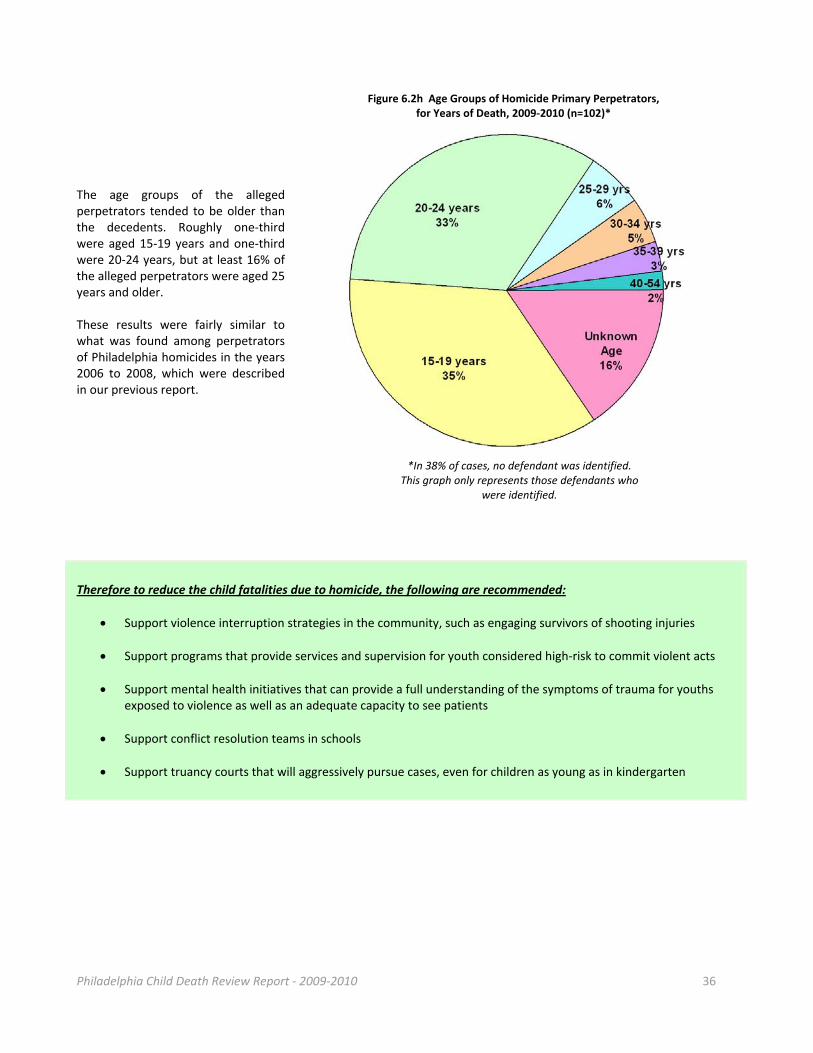
Philadelphia Child Death Review Report ‐ 2009‐2010 36
Figure 6.2h Age Groups of Homicide Primary Perpetrators, for Years of Death, 2009‐2010 (n=102)*
The age groups of the alleged perpetrators tended to be older than the decedents. Roughly one‐third were aged 15‐19 years and one‐third were 20‐24 years, but at least 16% of the alleged perpetrators were aged 25 years and older. These results were fairly similar to what was found among perpetrators of Philadelphia homicides in the years 2006 to 2008, which were described in our previous report.
*In 38% of cases, no defendant was identified. This graph only represents those defendants who
were identified.
Therefore to reduce the child fatalities due to homicide, the following are recommended:
Support violence interruption strategies in the community, such as engaging survivors of shooting injuries
Support programs that provide services and supervision for youth considered high‐risk to commit violent acts
Support mental health initiatives that can provide a full understanding of the symptoms of trauma for youths exposed to violence as well as an adequate capacity to see patients
Support conflict resolution teams in schools
Support truancy courts that will aggressively pursue cases, even for children as young as in kindergarten
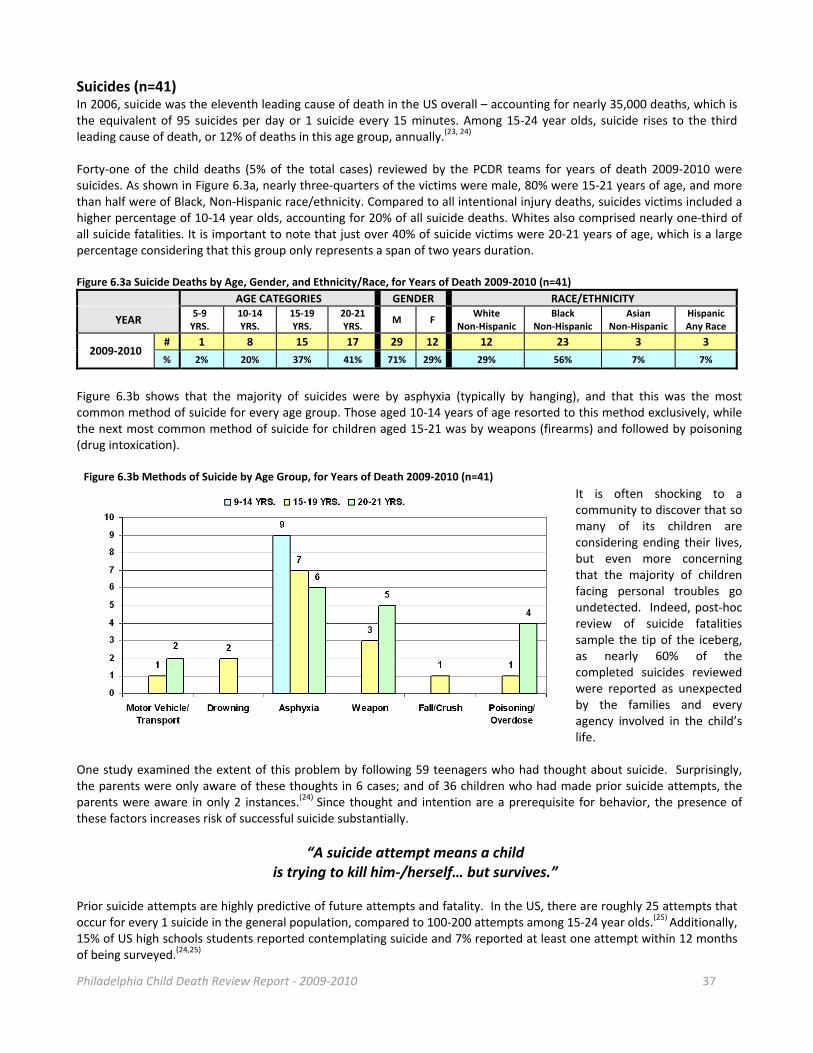
Philadelphia Child Death Review Report ‐ 2009‐2010 37
Suicides (n=41) In 2006, suicide was the eleventh leading cause of death in the US overall – accounting for nearly 35,000 deaths, which is the equivalent of 95 suicides per day or 1 suicide every 15 minutes. Among 15‐24 year olds, suicide rises to the third leading cause of death, or 12% of deaths in this age group, annually.(23, 24) Forty‐one of the child deaths (5% of the total cases) reviewed by the PCDR teams for years of death 2009‐2010 were suicides. As shown in Figure 6.3a, nearly three‐quarters of the victims were male, 80% were 15‐21 years of age, and more than half were of Black, Non‐Hispanic race/ethnicity. Compared to all intentional injury deaths, suicides victims included a higher percentage of 10‐14 year olds, accounting for 20% of all suicide deaths. Whites also comprised nearly one‐third of all suicide fatalities. It is important to note that just over 40% of suicide victims were 20‐21 years of age, which is a large percentage considering that this group only represents a span of two years duration. Figure 6.3a Suicide Deaths by Age, Gender, and Ethnicity/Race, for Years of Death 2009‐2010 (n=41)
AGE CATEGORIES GENDER RACE/ETHNICITY
YEAR 5‐9 YRS.
10‐14 YRS.
15‐19 YRS.
20‐21YRS.
M F White
Non‐Hispanic Black
Non‐Hispanic Asian
Non‐Hispanic HispanicAny Race
2009‐2010 # 1 8 15 17 29 12 12 23 3 3
% 2% 20% 37% 41% 71% 29% 29% 56% 7% 7%
Figure 6.3b shows that the majority of suicides were by asphyxia (typically by hanging), and that this was the most common method of suicide for every age group. Those aged 10‐14 years of age resorted to this method exclusively, while the next most common method of suicide for children aged 15‐21 was by weapons (firearms) and followed by poisoning (drug intoxication).
It is often shocking to a community to discover that so many of its children are considering ending their lives, but even more concerning that the majority of children facing personal troubles go undetected. Indeed, post‐hoc review of suicide fatalities sample the tip of the iceberg, as nearly 60% of the completed suicides reviewed were reported as unexpected by the families and every agency involved in the child’s life.
One study examined the extent of this problem by following 59 teenagers who had thought about suicide. Surprisingly, the parents were only aware of these thoughts in 6 cases; and of 36 children who had made prior suicide attempts, the parents were aware in only 2 instances.(24) Since thought and intention are a prerequisite for behavior, the presence of these factors increases risk of successful suicide substantially.
“A suicide attempt means a child is trying to kill him‐/herself… but survives.”
Prior suicide attempts are highly predictive of future attempts and fatality. In the US, there are roughly 25 attempts that occur for every 1 suicide in the general population, compared to 100‐200 attempts among 15‐24 year olds.(25) Additionally, 15% of US high schools students reported contemplating suicide and 7% reported at least one attempt within 12 months of being surveyed.(24,25)
Figure 6.3b Methods of Suicide by Age Group, for Years of Death 2009‐2010 (n=41)
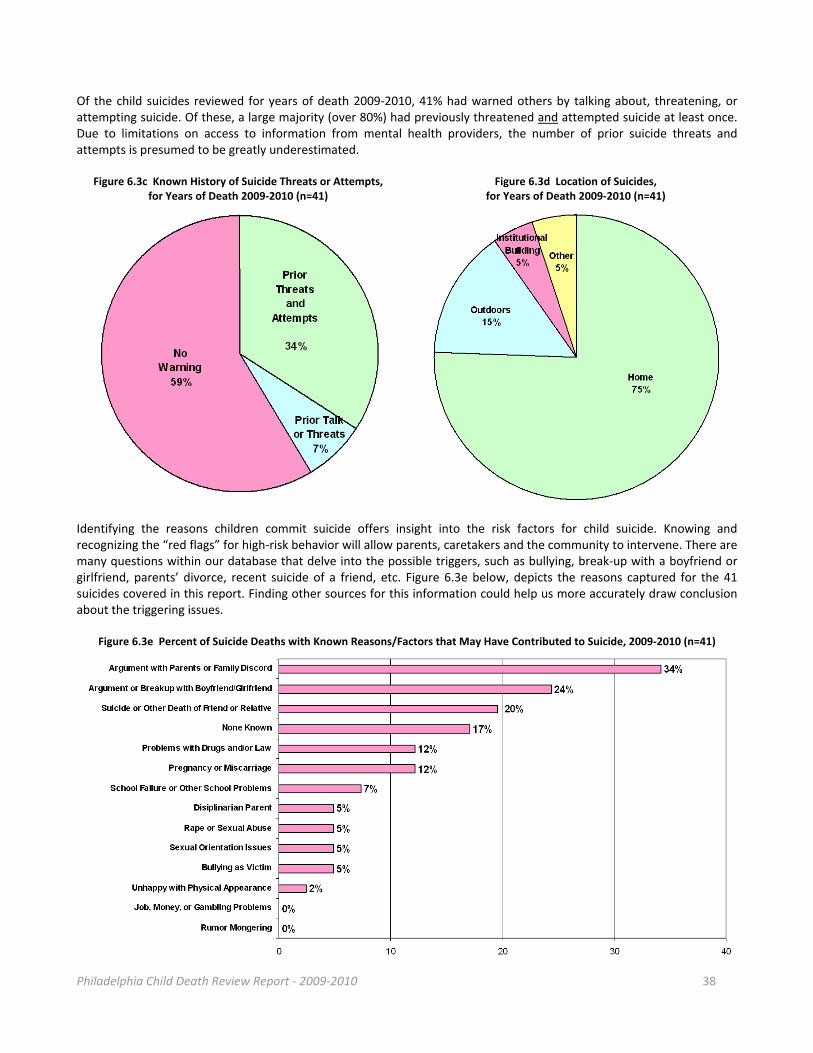
Philadelphia Child Death Review Report ‐ 2009‐2010 38
Of the child suicides reviewed for years of death 2009‐2010, 41% had warned others by talking about, threatening, or attempting suicide. Of these, a large majority (over 80%) had previously threatened and attempted suicide at least once. Due to limitations on access to information from mental health providers, the number of prior suicide threats and attempts is presumed to be greatly underestimated.
Figure 6.3c Known History of Suicide Threats or Attempts, for Years of Death 2009‐2010 (n=41)
Figure 6.3d Location of Suicides, for Years of Death 2009‐2010 (n=41)
Identifying the reasons children commit suicide offers insight into the risk factors for child suicide. Knowing and recognizing the “red flags” for high‐risk behavior will allow parents, caretakers and the community to intervene. There are many questions within our database that delve into the possible triggers, such as bullying, break‐up with a boyfriend or girlfriend, parents’ divorce, recent suicide of a friend, etc. Figure 6.3e below, depicts the reasons captured for the 41 suicides covered in this report. Finding other sources for this information could help us more accurately draw conclusion about the triggering issues.
Figure 6.3e Percent of Suicide Deaths with Known Reasons/Factors that May Have Contributed to Suicide, 2009‐2010 (n=41)

Philadelphia Child Death Review Report ‐ 2009‐2010 39
Therefore to reduce the child fatalities due to suicide, the following are recommended: Managing Suicidal Thinking, Plans and Failed Attempts Parents and Caregivers:
Know the warning signs that may put a child at risk for suicide (26) - Children with depressive disorders are reported to be seven times more likely to attempt suicide - Children who have been abused are reported to be up to four times more likely to attempt suicide - A history of suicide in a close family member can increase chances of suicide for the surviving child by up
to 10 times - Previous suicide attempts - Relationship problems
Take every expressed thought, plan or attempt seriously - It is reported that only 10 percent of threats are to get attention, so resist the temptation to see talk,
threats or attempts as manipulation (25)
Talk about it with the child
- Talking is the best medicine as it will increase understanding and de‐stigmatize the issue(25)
Connect the child with professional help - Professional help is not the only support a child needs, but it is a critical part of adequately supporting a
struggling child to cope and manage powerful thoughts and emotions
Employ some supervision in all cases where a threat, plan or prior attempt is involved - When you know the warning signs, you can engineer precautions into family life
Restrict access to potentially lethal items in the home (guns, pills, knives, etc.) - Removing as many lethal objects from the child’s access is a practical deterrent from the threat of an
impulsive act (25)
Community Systems: Forge relationships with behavioral health agencies to increase data sources
- Triangulating data sources has been shown to clarify causative factors with accuracy
Augment PCDR data collection methods for suicide victims - Implement a social interview with the family or a special medical chart review of cases
Streamline systems through targeted support - Support standardization of police investigation of youth suicides (e.g. using computer forensics)
Support anti‐bullying efforts at schools - Target issues related to sexual orientation issues
Support youth suicide prevention initiatives in the community - Community education and awareness campaigns on at risk‐youth and approaches
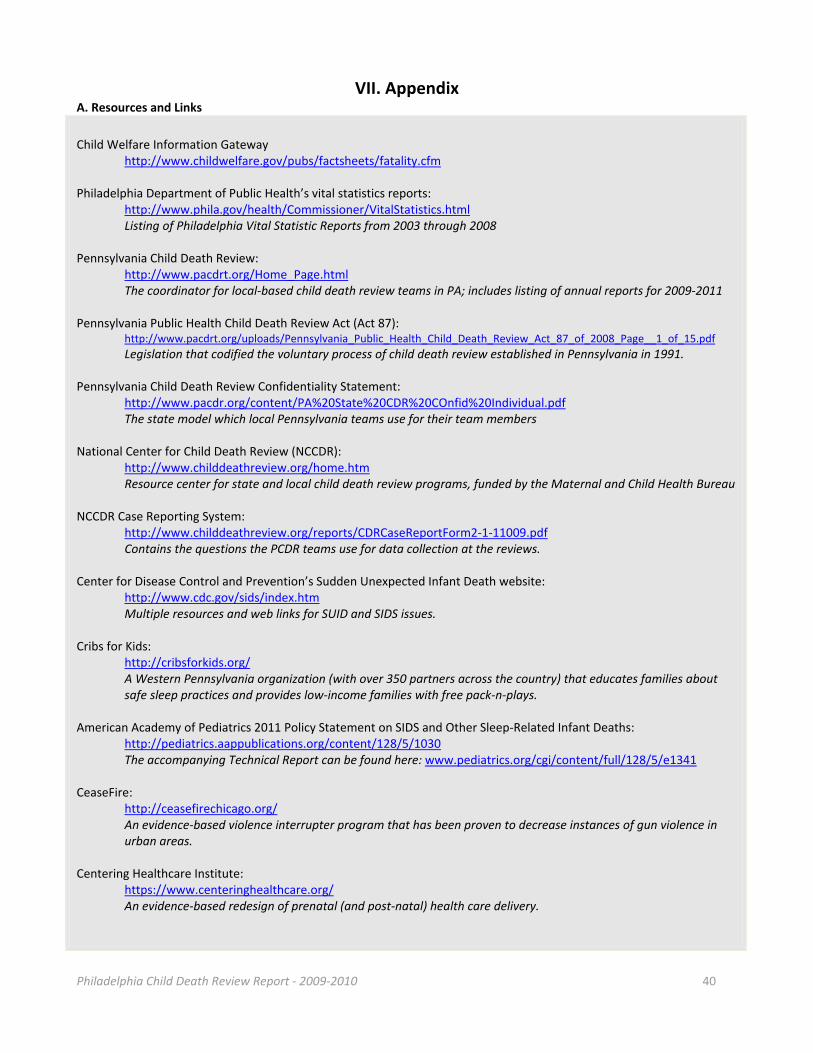
Philadelphia Child Death Review Report ‐ 2009‐2010 40
VII. Appendix A. Resources and Links
Child Welfare Information Gateway
http://www.childwelfare.gov/pubs/factsheets/fatality.cfm
Philadelphia Department of Public Health’s vital statistics reports: http://www.phila.gov/health/Commissioner/VitalStatistics.html
Listing of Philadelphia Vital Statistic Reports from 2003 through 2008 Pennsylvania Child Death Review: http://www.pacdrt.org/Home_Page.html The coordinator for local‐based child death review teams in PA; includes listing of annual reports for 2009‐2011 Pennsylvania Public Health Child Death Review Act (Act 87):
http://www.pacdrt.org/uploads/Pennsylvania_Public_Health_Child_Death_Review_Act_87_of_2008_Page__1_of_15.pdf
Legislation that codified the voluntary process of child death review established in Pennsylvania in 1991. Pennsylvania Child Death Review Confidentiality Statement:
http://www.pacdr.org/content/PA%20State%20CDR%20COnfid%20Individual.pdf The state model which local Pennsylvania teams use for their team members
National Center for Child Death Review (NCCDR): http://www.childdeathreview.org/home.htm Resource center for state and local child death review programs, funded by the Maternal and Child Health Bureau NCCDR Case Reporting System:
http://www.childdeathreview.org/reports/CDRCaseReportForm2‐1‐11009.pdf Contains the questions the PCDR teams use for data collection at the reviews. Center for Disease Control and Prevention’s Sudden Unexpected Infant Death website: http://www.cdc.gov/sids/index.htm Multiple resources and web links for SUID and SIDS issues. Cribs for Kids: http://cribsforkids.org/
A Western Pennsylvania organization (with over 350 partners across the country) that educates families about safe sleep practices and provides low‐income families with free pack‐n‐plays.
American Academy of Pediatrics 2011 Policy Statement on SIDS and Other Sleep‐Related Infant Deaths: http://pediatrics.aappublications.org/content/128/5/1030 The accompanying Technical Report can be found here: www.pediatrics.org/cgi/content/full/128/5/e1341 CeaseFire: http://ceasefirechicago.org/
An evidence‐based violence interrupter program that has been proven to decrease instances of gun violence in urban areas.
Centering Healthcare Institute: https://www.centeringhealthcare.org/ An evidence‐based redesign of prenatal (and post‐natal) health care delivery.

Philadelphia Child Death Review Report ‐ 2009‐2010 41
B. References
1. Runyan SW, Castell C (Eds.). The state of home safety in America: Facts about unintentional injuries in the home, 2
nd edition. Washington,
D.C.: Home Safety Council, 2004. 2. Distracted Driving. (n.d.). Retrieved March 12, 2012, from http://www.cdc.gov/Motorvehiclesafety/Distracted_Driving/index.html 3. Impaired Driving: Research & Activities. (updated February 17
th, 2011). Retrieved March 12, 2012, from
http://www.cdc.gov/motorvehiclesafety/impaired 4. Pennsylvania’s Motorcycle Helmet Law: Fact Sheet. (2006). Retrieved March 14, 2012, from
http://www.dmv.state.pa.us/pdotforms/fact_sheets/fs‐pub7206.pdf 5. Motorcycle Safety Guide. (n.d.). Retrieved on March 23, 2012, from http://cdc.gov/Motorvehiclesafety/mc/guide.html 6. Costs & Prevention Policies. (2009). Retrieved March 12, 2012, from http://www.cdc.gov/motorvehiclesafety/costs/index.html 7. CDC Vital Signs: Adult Seat Belt Use in the US – What Can Be Done. (updated January 4
th, 2011). Retrieved March 12
th, 2012, from
http://www.cdc.gov/vitalsigns/SeatBeltUse/WhatCanBeDone.html 8. CDC: Teen Driving Data & Statistics. (updated December 29
th, 2010). Retrieved March 12
, 2012, from
http://www.cdc.gov/MotorVehicleSafety/Teen_Drivers/data.html 9. CDC, Vital Signs: Adult Seat Belt Use in the US – US State Information. (2002). Retrieved March 12
th, 2012, from
http://www.cdc.gov/vitalsigns/SeatBeltUse/StateInfo.html 10. Child Passenger Safety: Fact Sheet. (n.d.). Retrieved March 12, 2012, from
http://www.cdc.gov/MotorVehicleSafety/Child_Passenger_Safety/CPS‐Factsheet.html 11. .08 DUI Legislation. (n.d.). Retrieved March 14, 2012, from http://www.dmv.state.pa.us/legislation/dui.shtml 12. CDC, MMWR – Drivers Aged 16 or 17 Years Involved in Fatal Crashes – United States, 2004‐2008. (October 22, 2010). Retrieved March 19,
2012, from www.cdc.gov.html 13. NHTSA: Impaired Driving in Pennsylvania. (n.d.). Retrieved March 14, 2012, from
http://www.nhtsa.gov/people/injury/alcohol/impaired_driving_pg2/PA.html 14. Hall, J.R. Burns, toxic gases, and other hazards associated with fires: Deaths and injuries in fire and non‐fire situations. Quincy (MA): National
Fire Protection Association, Fire Analysis and Research Division; 2001. 15. Fire Deaths and Injuries: Fact Sheet. (October 11, 2011). Retrieved March 12, 2012, from http://www.cdc.gov/Home
andRecreationalSafety/Fire‐Prevention/fires‐factsheet.html 16. Ahrens, M. Home structure fires. Quincy (MA): National Fire Protection Association; 2011. 17. Research Update: Lessons from CDC’s Smoke Alarm Installation and Fire Safety Education Program. (2011). Retrieved March 21, 2012, from
http://www.cdc.gov/HomeandRecreationalSafety/Fire‐Prevention/smoke_alarms.html 18. Electrical Fire Safety – A Factsheet on Home Electrical Fire Prevention. (2012). Retrieved on March 12, 2012, from
http://www.usfa.fema.gov/citizens/home_fire_prev/electrical.shtm 19. Learn About Fire Escape Plans. (2012). Retrieved on March 12, 2012, from
http://www.usfa.fema.gov/campaigns/smokealarms/escapeplans/index.shtm 20. Suicide. (n.d.). Retrieved March 17, 2012, from http://www.klis.com/chandler/pamphlet/dep/Suicide.htm 21. Suicide – Facts at a Glance. (2009). Retrieved on March 12, 2012, from http://www.cdc.gov/violenceprevention.html 22. Summary‐ Child Maltreatment. (2006). Retrieved March 23, 2012, from http://www.acf.hhs.gov/programs/cb/pubs/cm06/summary.html 23. Understanding Youth Violence – Fact Sheet. (2010). Retrieved March 15, 2012 from http://www.cdc.gov/violenceprevention 24. Violence/Intentional Injury. (n.d.). Retrieved March 15, 2012, from http://www.sophe.org/ui/injury‐violence.shtml 25. Stein D, Apter A et al (1998). Association between Multiple Suicide Attempts and Negative Affects in Adolescents J Am Acad Child Adolesc
Psychiatry 37(5):488‐494.