Embed Size (px)
Citation preview
Molecular and Cellular Pathobiology
PHGDH Expression Is Required for MitochondrialRedox Homeostasis, Breast Cancer Stem CellMaintenance, and Lung MetastasisDebangshu Samanta1,2, Youngrok Park1, Shaida A. Andrabi1,3, Laura M. Shelton4,Daniele M. Gilkes1,2,5, and Gregg L. Semenza1,2,5,6
Abstract
Intratumoral hypoxia stimulates enrichment of breast cancerstem cells (BCSC), which are critical for metastasis and patientmortality. Here we report a metabolic adaptation that is requiredfor hypoxia-induced BCSC enrichment and metastasis. Hypoxia-inducible factors coordinately regulate expression of genes encod-ing phosphoglycerate dehydrogenase (PHGDH) and five down-streamenzymes in theserine synthesispathwayandmitochondrialone-carbon (folate) cycle. RNAi-mediated silencing of PHGDHexpression in both estrogen receptor–positive and negative breastcancer cells led to decreased NADPH levels, disturbed mitochon-
drial redox homeostasis, and increased apoptosis, which abrogat-edBCSCenrichment under hypoxic conditions. PHGDH-deficientcells exhibited increased oxidant levels and apoptosis, as well asloss of BCSC enrichment, in response to treatment with carbopla-tin or doxorubicin. PHGDH-deficient cells were relatively weaklytumorigenic and tumors that did form were deficient in BCSCs,abolishing metastatic capacity. Our findings highlight a role forPHGDH in the formation of secondary (recurrent or metastatic)tumors, with potential implications for therapeutic targeting ofadvanced cancers. Cancer Res; 76(15); 4430–42. �2016 AACR.
IntroductionBreast cancer mortality occurs in patients whose cancer cells
metastasize to distant sites, such as the lungs, bones, and brain.Only a small percentage of the breast cancer cells in a primarytumor have self-renewal capacity, which is necessary to form ametastatic tumor, and are designated as breast cancer stem cells(BCSC) or tumor-initiating cells (1, 2). Compared with bulkbreast cancer cells, BCSCs exhibit increased survival when treatedwith cytotoxic chemotherapy (3, 4), which actively induces theBCSC phenotype (5–7). Intratumoral hypoxia is common inadvanced breast cancers (8) and induces the metastatic (9) andBCSC (10) phenotypes through transcriptional activation oftarget genes by hypoxia-inducible factor 1 (HIF-1) and HIF-2(11–15). Adaptation of mammalian cells to chronic hypoxiainvolves a HIF-1–dependent switch from oxidative to glycolyticmetabolism, which is an adaptive response to, and ameliorates,
increased mitochondrial reactive oxygen species (ROS) produc-tion that occurs due to decreased electron transport chain effi-ciency under hypoxic conditions (16–23).
Oncogenic transformation also activates pathways that generateROS and place cancer cells at risk for apoptosis (24). Redoxhomeostasis is dependent on a balance between levels of oxidantsand antioxidants. The latter are dependent upon the generation ofNADPH, which is used to maintain glutathione, the principalcellular antioxidant, in a reduced form. Two glycolytic shunt path-ways utilize glucose metabolites for NADPH generation: the pen-tose phosphate pathway (PPP) diverts glucose-6-phosphate,whereas the serine synthesis pathway (SSP) converts 3-phospho-glycerate into serine via three reactions that are catalyzed byphosphoglycerate dehydrogenase (PHGDH), phosphoserine ami-notransferase 1 (PSAT1), and phosphoserine phosphatase (PSPH).Serine is utilized as a substrate for one-carbon (folate cycle)metabolism (1CM), either in the cytosol or mitochondria. In themitochondria (mito1CM), serine hydroxymethyl transferase 2(SHMT2) catalyzes the reaction of serine and tetrahydrofolate(THF) to glycine and 5,10-methylene-THF (MTHF). MTHF dehy-drogenase 2 (MTHFD2) catalyzes the reaction of MTHF andNADPþ to generate formyl-MTHF andNADPH. Finally,MTHFD1Lsplits formyl-THF into THF and formate (Fig. 1A). The cytosolic(cyto1CM)reactionsare catalyzedbySHMT1andMTHFD1(whichperforms reactions catalyzed by both MTHFD2 and MTHFD1L).
PHGDH catalyzes the reaction that diverts 3-phosphoglyceratefrom the Embden–Meyerhof pathway (EMP) to the SSP. A shorthairpin RNA (shRNA) screen revealed that transformed breastcells required PHGDH expression for tumor xenograft formation(25). PHGDH gene amplification was found in 6% of breastcancers and shRNA-mediated knockdown of PHGDH expressioninhibited proliferation of breast cancer cells with PHGDH ampli-fication (25, 26). PHGDHoverexpressionwas observed in 70%ofestrogen receptor negative (ER�) breast cancers (25), indicating
1Institute for Cell Engineering, Johns Hopkins University School ofMedicine, Baltimore,Maryland. 2McKusick-Nathans Institute ofGenet-ic Medicine, Johns Hopkins University School of Medicine, Baltimore,Maryland. 3Department of Neurology, Johns Hopkins UniversitySchool of Medicine, Baltimore, Maryland. 4Human Metabolome Tech-nologies America, Inc., Boston, Massachusetts. 5Sidney Kimmel Com-prehensive Cancer Center, Johns Hopkins University School of Med-icine, Baltimore, Maryland. 6Departments of Pediatrics, Medicine,Radiation Oncology, and Biological Chemistry, Johns Hopkins Univer-sity School of Medicine, Baltimore, Maryland.
Note: Supplementary data for this article are available at Cancer ResearchOnline (http://cancerres.aacrjournals.org/).
Corresponding Author: Gregg L. Semenza, Johns Hopkins University School ofMedicine, 733 N. Broadway, Suite 671, Baltimore, MD 21205. Fax: 443-287-5618;E-mail: [email protected]
doi: 10.1158/0008-5472.CAN-16-0530
�2016 American Association for Cancer Research.
CancerResearch
Cancer Res; 76(15) August 1, 20164430
on April 1, 2019. © 2016 American Association for Cancer Research. cancerres.aacrjournals.org Downloaded from
Published OnlineFirst June 8, 2016; DOI: 10.1158/0008-5472.CAN-16-0530
that a mechanism other than gene amplification must underliePHGDH overexpression in most breast cancers. We hypothesizedthat increased expression of PHGDH, as well as other SSP and
1CM enzymes, is required to maintain redox homeostasis inhypoxic breast cancer cells, especially in BCSCs, which are par-ticularly sensitive to ROS (27).
Phosphoserine
Glutamateα-Ketoglutarate
3-Phosphohydroxypyruvate
3-PhosphoglycerateGlucoseNAD+
NADH
Lactate
PSPH
PSAT1
PHGDH
CA
Cytosol Mitochondrion
GSSG
GSHNADPH
THF MTHF
Serine Glycine
Formate+THF
MTHFD2
SHMT2
MTHFD1L
Formyl-THF
NADP+
MDA-231
SUM-149
HCC-1954
MCF-7
ZR-75.1
BT-474
PHG
DH
PSAT
1PS
PHSH
MT2
MTH
FD2
MTH
FD1L
SHM
T1M
THFD
1
Hypoxic induction
No hypoxic induction
0
10
20
30
050
100150200250300
0
0.5
1
1.5
2
00.5
11.5
22.5
33.5
B
PHGDH PSAT1
1% O2 Induction (P < 0.001) 1% O2 No induction20% O2
0.5
1.5
2.5
3.5
0
0.2
0.4
0.6
0.8
1
3
5
7
02468
1012
PSPH SHMT2
Rel
ativ
e m
RN
A ex
pres
sion
02
468
1012
0
10
20
30
40
50
60
0
0.5
1
1.5
2
0
0.2
0.4
0.6
0.8
1MTHFD2 MTHFD1L
Figure 1.
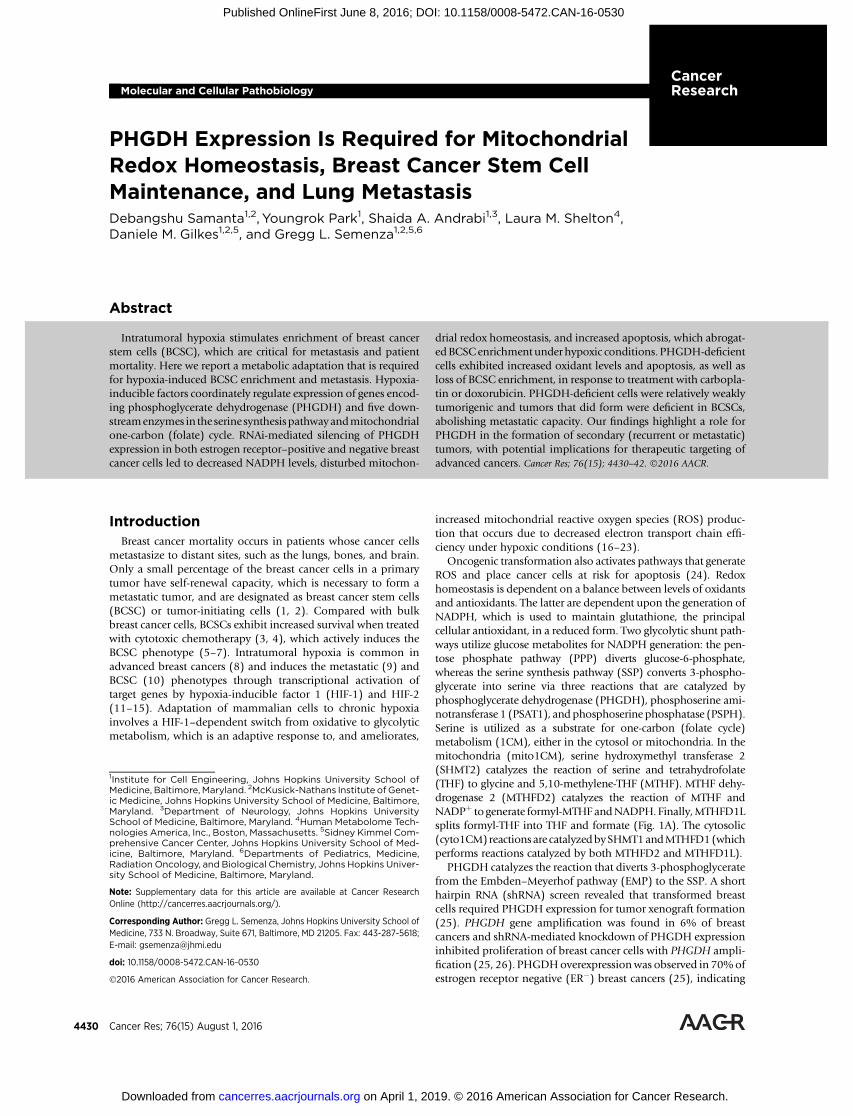
Hypoxia induces expression ofmRNAsencoding SSP and mito1CM enzymes.A, enzymatic reactions. Glucose-derived 3-phosphoglycerate ismetabolized to glycine and NADPþ
is reduced to NADPH through theactivity of SSP (blue) and mito1CM(purple) enzymes. B, mRNAexpression. Breast cancer cell lineswere exposed to 20% or 1% O2 for24 hours and expression of mRNAsencoding SSP and 1CM enzymes wereanalyzed by RT-qPCR. The expressionof each mRNA was quantified relativeto 18S rRNA and then normalized tothe result obtained from MDA-MB-231(MDA-231) cells at 20% O2 (mean �SEM; n ¼ 3). C, summary of mRNAexpression data (columns) in breastcancer cell lines (rows). Red,significantly increased expressionat 1% as compared to 20% O2
(P < 0.001; Student t test); gray, noinduction at 1% O2.
PHGDH Is Required for Breast Cancer Progression
www.aacrjournals.org Cancer Res; 76(15) August 1, 2016 4431
on April 1, 2019. © 2016 American Association for Cancer Research. cancerres.aacrjournals.org Downloaded from
Published OnlineFirst June 8, 2016; DOI: 10.1158/0008-5472.CAN-16-0530
Materials and MethodsFor details, see Supplementary Materials and Methods.
Cell cultureMCF-7, MDA-MB-231, HCC-1954, SUM-149, and SUM-159
cells were cultured as described previously (6). BT-474, ZR75.1,and T47D cells were cultured inRPMI1640with 10%FBS. The celllines were obtained from Dr. Sara Sukumar (Johns HopkinsUniversity, Baltimore, MD) in 2012. Cell authentication wasperformed by PCR analysis of short tandem repeats.
Lentivirus transductionVectors encoding shRNA targeting HIF-1a and HIF-2a, and
generation of MDA-MB-231 and MCF-7 subclones, weredescribed previously (13, 28). pLKO.1-puro lentiviral vectorsencoding shRNA targeting PHGDH (Supplementary Table S1)were purchased from Sigma-Aldrich. Lentiviruses were packagedand transduced cells were selected as described previously (28).
Reverse transcription and quantitative real-time PCRTotal RNA was extracted from cells and tumors using TRIzol
(Invitrogen) and treated with DNase I (Ambion). cDNA synthesiswasperformedusing the iScript cDNASynthesis system(Bio-Rad).qPCR was performed using human-specific primers (Supplemen-tary Table S2) and iQ SYBR Green Supermix (Bio-Rad; ref. 28).
Immunoblot assaysWhole-cell lysates were prepared inmodified RIPA buffer (14).
Blots were probed with antibodies against HIF-1a, PHGDH,PSAT1, and PSPH (Novus Biologicals). HRP-conjugated anti-rabbit and anti-mouse secondary antibodies (Santa Cruz Biotech-nology) were used. Blots were reprobed with anti-actin antibody(Santa Cruz Biotechnology).
BCSC assaysAldefluor and mammosphere assays were performed as
described previously (13).
MitoSOX stainingCells were incubated in 5 mmol/L MitoSOX Red (Molecular
Probes) in PBS/5% FBS at 37�C for 45 minutes and rinsed withPBS. Stained cells were filtered and subjected to flow cytometry.
Apoptosis and viability assaysApoptotic cells were quantified by FITC-Annexin V and APC-7-
AAD staining followed by flow cytometry. Viable cells werequantified by MTT assay (Invitrogen).
Glutathione and NADPH assaysCell lysates were analyzed for glutathione and NADPH using
GSH/GSSG-Glo and NADP/NADPH-Glo assays (Promega).
Glucose uptake assayCells were incubated in 150 mmol/L 2-[N-(7-nitrobenz-2-oxa-
1,3-diazol-4-yl) amino]-2-deoxy-D-glucose (Molecular Probes)and subjected to flow cytometry.
Seahorse assaysOxygen consumption and extracellular acidification were mea-
sured using the XF24-Analyzer (Seahorse Bioscience).
Metabolite analysisMetabolites in culture media and cells were analyzed by cap-
illary electrophoresis and single or tandem mass spectrometry(MS/MS) relative to internal standards (Human MetabolomeTechnologies) as described previously (29, 30).
BioinformaticsFor the HIF signature, the The Cancer Genome Atlas Breast
Invasive Carcinoma Gene Expression Dataset of 1,215 patientswas analyzed (31, 32). Tumor grade was analyzed using GOBO(33). Kaplan–Meier curves were generated using KM plotter (34).
ResultsSSP and mito1CM enzyme expression is induced in hypoxicbreast cancer cells
Breast cancers are classified as ERþ, progesterone receptorpositive (PRþ), human epidermal growth factor receptor 2 pos-itive (HER2þ), or triple negative (ER�/PR�/HER2�). We exposedsix representative human breast cancer cell lines to 20% or 1%O2
for 24 hours: BT-474 (ERþ/PRþ/HER2þ), HCC-1954 (HER2þ),MCF-7 (ERþ/PRþ), MDA-MB-231 (ER�/PR�/HER2�), SUM-149(ER�/PR�/HER2�), and ZR-75.1 (ERþ; ref. 35). Total RNA wasisolated and analyzed for expression of SSP (PHGDH, PSAT1,PSPH), mito1CM (SHMT2, MTHFD2, MTHFD1L), and cyto1CM(SHMT1,MTHFD1)mRNAs. InMDA-MB-231, HCC-1954, MCF-7 and BT-474 cells, hypoxic exposure induced the expression of allthree SSP and all three mito1CMmRNAs, and all six breast cancercell lines exhibited induction of PHGDH and SHMT2 mRNA(Fig. 1B and C), which encode enzymes catalyzing the firstreaction of the SSP and mito1CM, respectively (Fig. 1A). Incontrast, expression of cyto1CMmRNAs was induced by hypoxiain only one or two cell lines (Fig. 1C).
The SSP and PPP represent alternate mechanisms by whichglucose metabolites are utilized to generate NADPH. The firstenzyme of the PPP is glucose-6-phosphate dehydrogenase(G6PD). In contrast to the SSP and 1CM mRNAs, expression ofG6PD mRNA was repressed by hypoxia in all breast cancer linesanalyzed (Supplementary Fig. S1). Taken together, these dataindicate that hypoxia selectively induces the expression ofmRNAsencoding SSP and mito1CM enzymes in cell lines derived fromERþ, PRþ, HER2þ, and triple-negative breast cancers.
HIFs are required for hypoxic induction of SSP and mito1CMenzymes
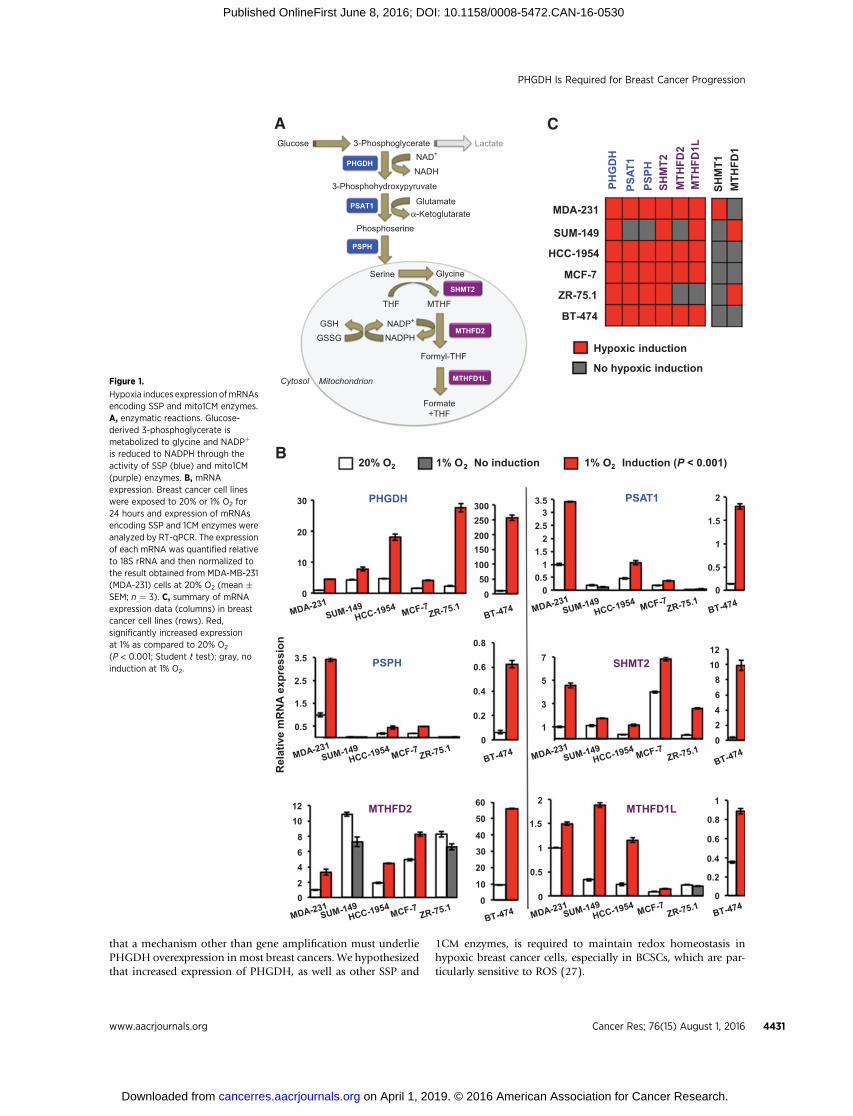
MDA-MB-231 subclones that were stably transfected with avector encoding a nontargeting control shRNA (NTC) or shRNAtargeting HIF-1a (sh1a), HIF-2a (sh2a), or both HIF-1a and HIF-2a [double knockdown (DKD)] have been used to investigate therole of HIFs in breast cancer progression (6, 13, 28). Hypoxicinduction of PHGDH, PSAT1, PSPH, SHMT2, MTHFD2, andMTHFD1L mRNA expression, which was observed in the NTCsubclone, was impaired when HIF-1a or HIF-2a or both weresilenced (Fig. 2A). Immunoblot assays demonstrated hypoxicinduction of PHGDH, PSAT1, and PSPH protein expression in theNTC subclone, which was impaired in the knockdown subclones(Fig. 2B). Similar results were obtained in MCF-7 subclones (Sup-plementary Fig. S2A). Hypoxia-induced PHGDH, PSAT1, andPSPH expression in parental MCF-7 cells was abrogated, in adose-dependent manner, by treatment with acriflavine (Supple-mentary Fig. S2B), which is a drug that inhibits the
Samanta et al.
Cancer Res; 76(15) August 1, 2016 Cancer Research4432
on April 1, 2019. © 2016 American Association for Cancer Research. cancerres.aacrjournals.org Downloaded from
Published OnlineFirst June 8, 2016; DOI: 10.1158/0008-5472.CAN-16-0530
0
1
2
3
4
5 PHGDHA
NTC sh1a sh2a DKD
20% O2 1% O2
MDA-MB-231
0
1
2
3
4
5 SHMT2
NTC sh1a sh2a DKD
0
2
4
6
8
NTC sh1a sh2a DKD
PSAT1
Rel
ativ
e m
RN
A ex
pres
sion
0
1
2
3
4
NTC sh1a sh2a DKD
MTHFD2
Rel
ativ
e m
RN
A ex
pres
sion
0
1
2
3
4
NTC sh1a sh2a DKD
PSPH
0
0.5
1
1.5
2
2.5
NTC sh1a sh2a DKD
MTHFD1L
NTC sh1a1 sh2a1 DKD
O2 (%) 20 1 20 1 20 1 20 1 20 1
sh1a10 CB
PHGDH
PSAT1
PSPH
Actin
HIF-1α
0
1
2
3
4
5
% A
LDH
+C
ells
NTC sh1a sh2a DKD
20% O2 1% O2
Adherent Mammospheres
0
1
2
3
4
5
0
2
4
6
8
10
12
Rel
ativ
e m
RN
A ex
pres
sion
D
*
#
* *
# ###
#
*
*
#
# #* * *
*
# # #
*
# ##
**
*
*
## #
*
# # #* *
* *
*
*
*
*
* * *
*
*
a a
Figure 2.
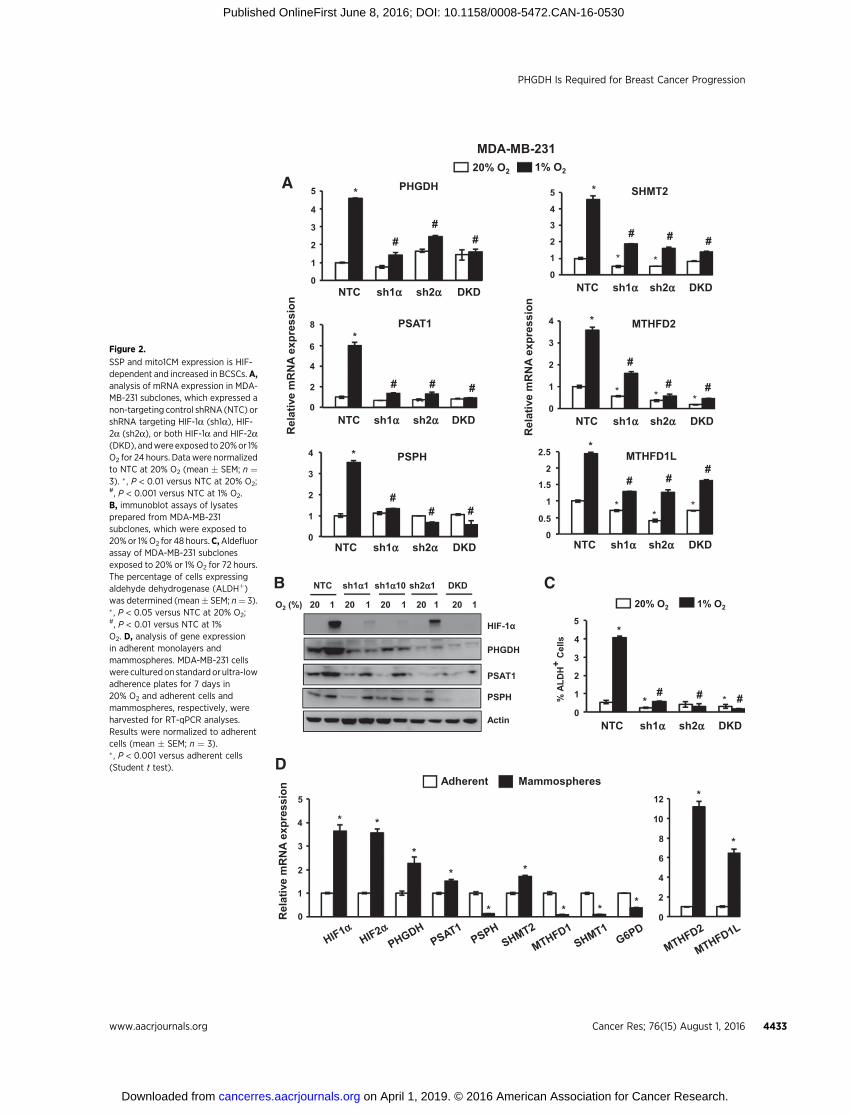
SSP and mito1CM expression is HIF-dependent and increased in BCSCs.A,analysis of mRNA expression in MDA-MB-231 subclones, which expressed anon-targeting control shRNA (NTC) orshRNA targeting HIF-1a (sh1a), HIF-2a (sh2a), or both HIF-1a and HIF-2a(DKD), andwere exposed to 20%or 1%O2 for 24 hours. Data were normalizedto NTC at 20% O2 (mean � SEM; n ¼3). � , P < 0.01 versus NTC at 20% O2;#, P < 0.001 versus NTC at 1% O2.B, immunoblot assays of lysatesprepared from MDA-MB-231subclones, which were exposed to20%or 1%O2 for 48 hours.C,Aldefluorassay of MDA-MB-231 subclonesexposed to 20% or 1% O2 for 72 hours.The percentage of cells expressingaldehyde dehydrogenase (ALDHþ)was determined (mean� SEM; n¼ 3).� , P < 0.05 versus NTC at 20% O2;#, P < 0.01 versus NTC at 1%O2. D, analysis of gene expressionin adherent monolayers andmammospheres. MDA-MB-231 cellswere culturedon standardor ultra-lowadherence plates for 7 days in20% O2 and adherent cells andmammospheres, respectively, wereharvested for RT-qPCR analyses.Results were normalized to adherentcells (mean � SEM; n ¼ 3).� , P < 0.001 versus adherent cells(Student t test).
PHGDH Is Required for Breast Cancer Progression
www.aacrjournals.org Cancer Res; 76(15) August 1, 2016 4433
on April 1, 2019. © 2016 American Association for Cancer Research. cancerres.aacrjournals.org Downloaded from
Published OnlineFirst June 8, 2016; DOI: 10.1158/0008-5472.CAN-16-0530
heterodimerization of HIF-a and HIF-1b subunits (36). Thus,genetic and pharmacologic approaches indicate that HIFs coordi-nately regulate the expression of SSP andmito1CM enzymes whenbreast cancer cells are exposed to hypoxia.
BCSCs are characterized by high aldehyde dehydrogenase(ALDH) activity and can be identified by the Aldefluor assay, inwhich BODIPY-aminoacetaldehyde is converted to the fluores-cent product BODIPY-aminoacetate (37). Exposure of NTC sub-clones ofMDA-MB-231 (Fig. 2C) andMCF-7 (Supplementary Fig.S2C) to hypoxia for 72 hours increased the percentage of ALDHþ
BCSCs, whereas this response was impaired in knockdown sub-clones. Treatment of MCF-7 cells with acriflavine also blockedhypoxic induction of the BCSC phenotype as determined by themammosphere assay (Supplementary Fig. S2D), which is basedon the selective ability of BCSCs to generate multicellular spher-oids under nonadherent culture conditions (38).
Expression of SSP and mito1CM mRNAs is increased in BCSCsThe preceding results demonstrated a correlation between loss
of hypoxia-induced SSP and mito1CM expression and loss ofhypoxia-induced BCSC enrichment. To determine whethermRNAs encoding these enzymes were overexpressed in BCSCsrelative tonon-BCSCs,we culturedMDA-MB-231andMCF-7 cellsas either adherent monolayers or mammospheres for 7 days.HIF1a, HIF-2a, PHGDH, PSAT1, SHMT2, MTHFD2, andMTHFD1L mRNA expression was increased in BCSC-enrichedmammosphere cultures of MDA-MB-231 cells, whereas expres-sion of the cyto1CM enzymes SHMT1 and MTHFD2 wasdecreased in mammospheres relative to adherent cells, as wasthe PPP enzyme G6PD (Fig. 2D). Increased expression of HIF-1a,HIF-2a, PHGDH, SHMT2, MTHFD2, and MTHFD1L mRNA inBCSCs relative to non-BCSCs was also observed in MCF-7 cells(Supplementary Fig. S2E). Thus, HIF, SSP, and mito1CMmRNAsare preferentially expressed in BCSCs, suggesting that they play animportant role in the BCSC phenotype.
PHGDH knockdown abrogates hypoxia-induced BCSCenrichment
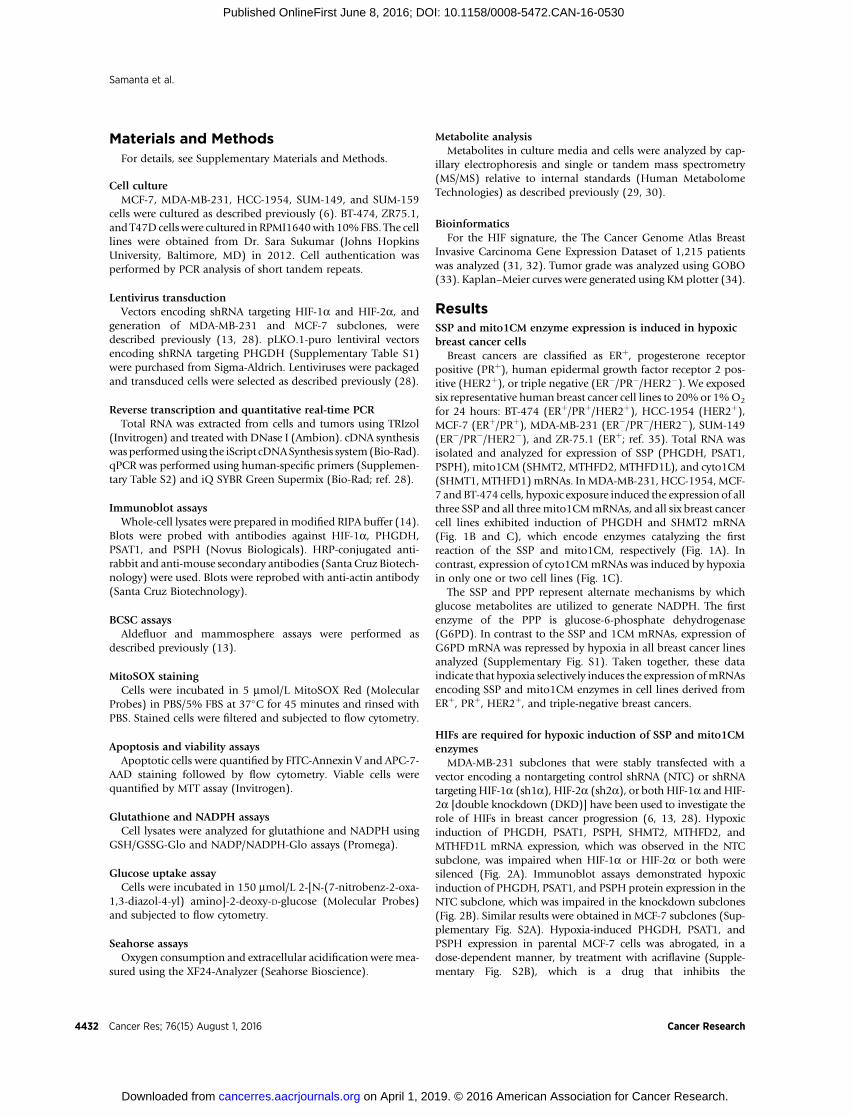
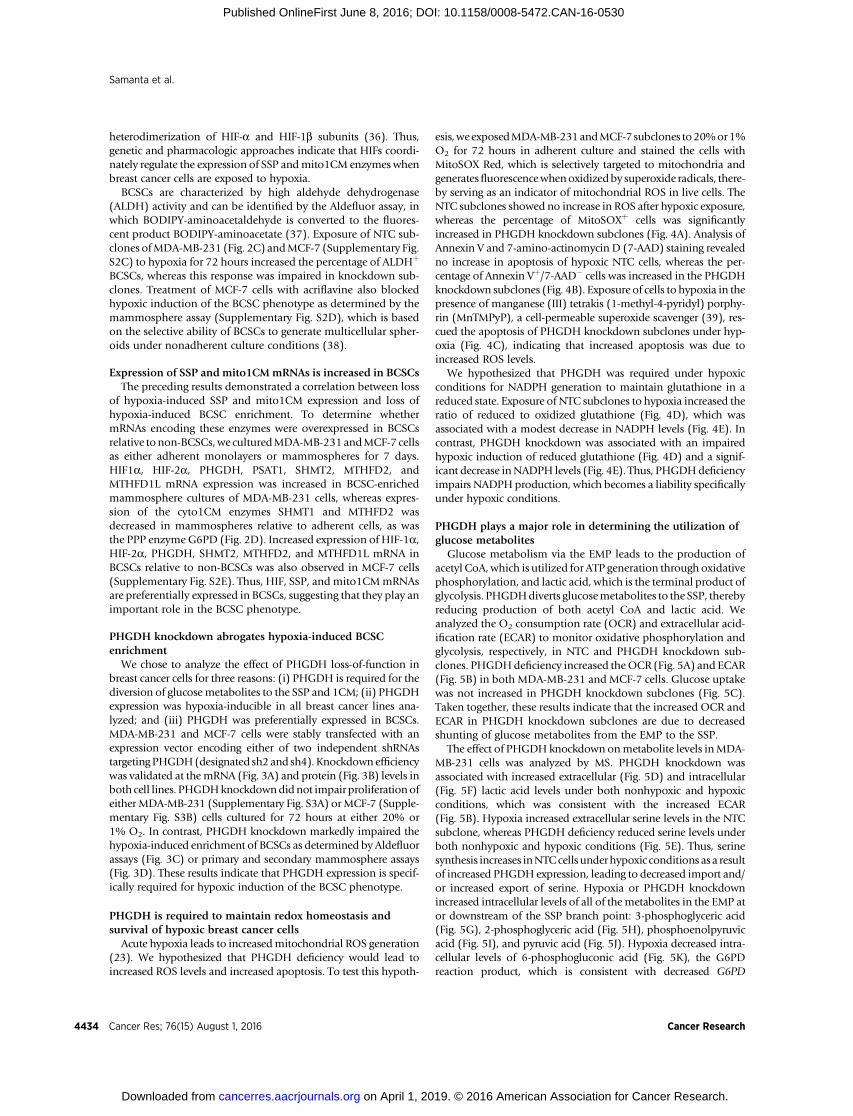
We chose to analyze the effect of PHGDH loss-of-function inbreast cancer cells for three reasons: (i) PHGDH is required for thediversion of glucose metabolites to the SSP and 1CM; (ii) PHGDHexpression was hypoxia-inducible in all breast cancer lines ana-lyzed; and (iii) PHGDH was preferentially expressed in BCSCs.MDA-MB-231 and MCF-7 cells were stably transfected with anexpression vector encoding either of two independent shRNAstargeting PHGDH(designated sh2 and sh4). Knockdownefficiencywas validated at the mRNA (Fig. 3A) and protein (Fig. 3B) levels inboth cell lines. PHGDHknockdowndidnot impair proliferationofeither MDA-MB-231 (Supplementary Fig. S3A) or MCF-7 (Supple-mentary Fig. S3B) cells cultured for 72 hours at either 20% or1% O2. In contrast, PHGDH knockdown markedly impaired thehypoxia-induced enrichment of BCSCs as determined by Aldefluorassays (Fig. 3C) or primary and secondary mammosphere assays(Fig. 3D). These results indicate that PHGDH expression is specif-ically required for hypoxic induction of the BCSC phenotype.
PHGDH is required to maintain redox homeostasis andsurvival of hypoxic breast cancer cells
Acute hypoxia leads to increasedmitochondrial ROS generation(23). We hypothesized that PHGDH deficiency would lead toincreased ROS levels and increased apoptosis. To test this hypoth-
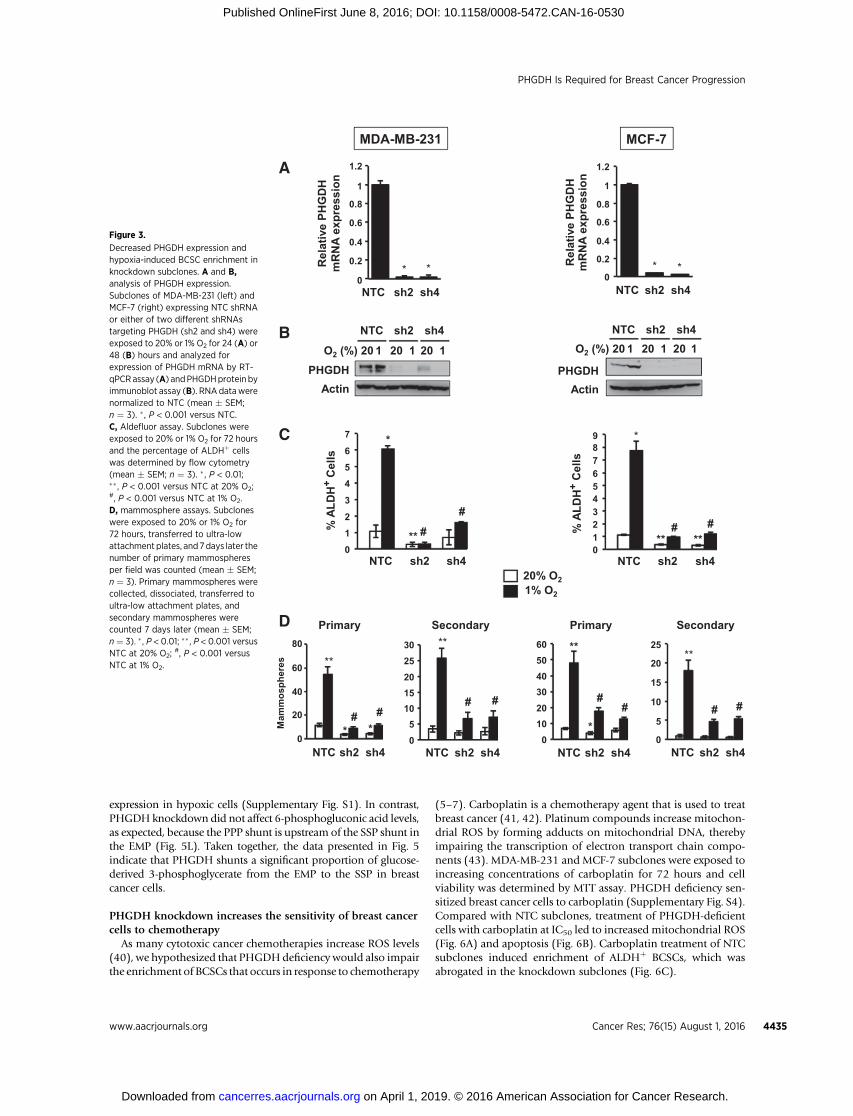
esis,weexposedMDA-MB-231andMCF-7 subclones to20%or1%O2 for 72 hours in adherent culture and stained the cells withMitoSOX Red, which is selectively targeted to mitochondria andgeneratesfluorescencewhenoxidizedby superoxide radicals, there-by serving as an indicator of mitochondrial ROS in live cells. TheNTC subclones showed no increase in ROS after hypoxic exposure,whereas the percentage of MitoSOXþ cells was significantlyincreased in PHGDH knockdown subclones (Fig. 4A). Analysis ofAnnexin V and 7-amino-actinomycin D (7-AAD) staining revealedno increase in apoptosis of hypoxic NTC cells, whereas the per-centage of Annexin Vþ/7-AAD� cells was increased in the PHGDHknockdown subclones (Fig. 4B). Exposure of cells to hypoxia in thepresence of manganese (III) tetrakis (1-methyl-4-pyridyl) porphy-rin (MnTMPyP), a cell-permeable superoxide scavenger (39), res-cued the apoptosis of PHGDH knockdown subclones under hyp-oxia (Fig. 4C), indicating that increased apoptosis was due toincreased ROS levels.
We hypothesized that PHGDH was required under hypoxicconditions for NADPH generation to maintain glutathione in areduced state. Exposure of NTC subclones to hypoxia increased theratio of reduced to oxidized glutathione (Fig. 4D), which wasassociated with a modest decrease in NADPH levels (Fig. 4E). Incontrast, PHGDH knockdown was associated with an impairedhypoxic induction of reduced glutathione (Fig. 4D) and a signif-icant decrease inNADPH levels (Fig. 4E). Thus, PHGDHdeficiencyimpairs NADPHproduction, which becomes a liability specificallyunder hypoxic conditions.
PHGDH plays a major role in determining the utilization ofglucose metabolites
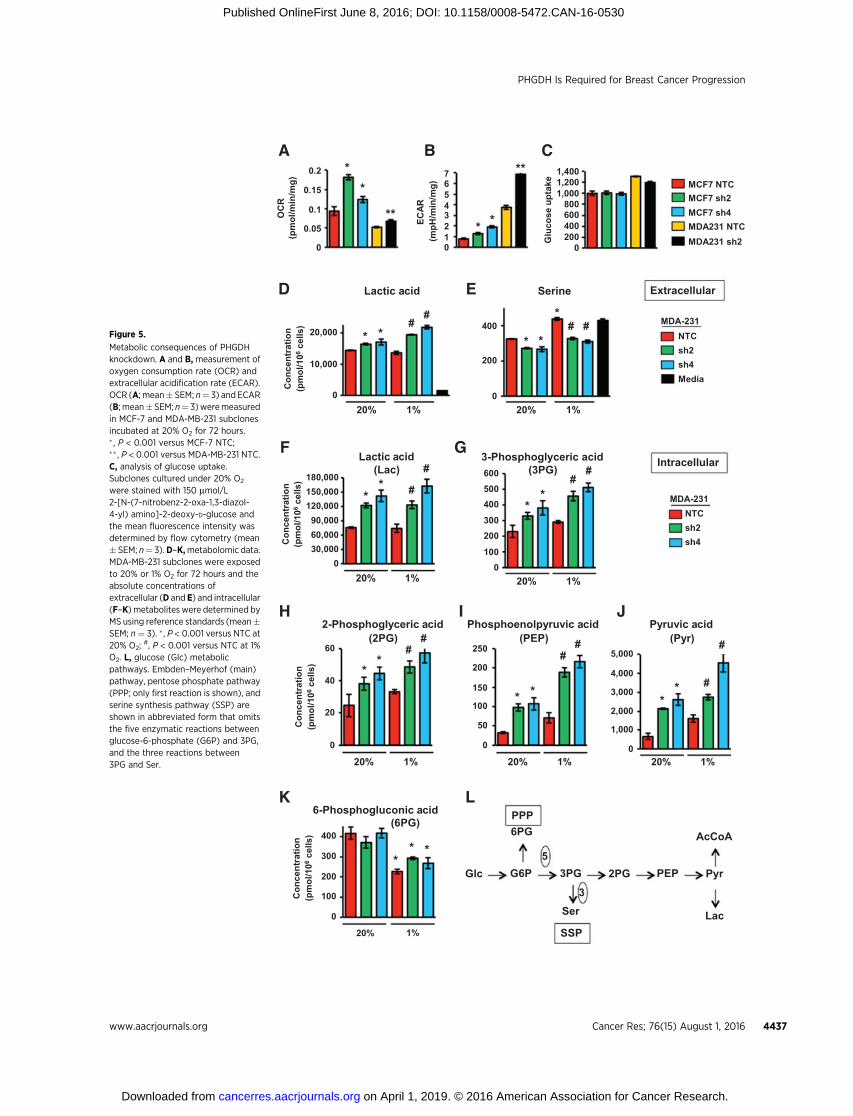
Glucose metabolism via the EMP leads to the production ofacetyl CoA,which is utilized for ATP generation through oxidativephosphorylation, and lactic acid, which is the terminal product ofglycolysis. PHGDHdiverts glucosemetabolites to the SSP, therebyreducing production of both acetyl CoA and lactic acid. Weanalyzed the O2 consumption rate (OCR) and extracellular acid-ification rate (ECAR) to monitor oxidative phosphorylation andglycolysis, respectively, in NTC and PHGDH knockdown sub-clones. PHGDHdeficiency increased theOCR (Fig. 5A) and ECAR(Fig. 5B) in both MDA-MB-231 and MCF-7 cells. Glucose uptakewas not increased in PHGDH knockdown subclones (Fig. 5C).Taken together, these results indicate that the increased OCR andECAR in PHGDH knockdown subclones are due to decreasedshunting of glucose metabolites from the EMP to the SSP.
The effect of PHGDH knockdown onmetabolite levels inMDA-MB-231 cells was analyzed by MS. PHGDH knockdown wasassociated with increased extracellular (Fig. 5D) and intracellular(Fig. 5F) lactic acid levels under both nonhypoxic and hypoxicconditions, which was consistent with the increased ECAR(Fig. 5B). Hypoxia increased extracellular serine levels in the NTCsubclone, whereas PHGDH deficiency reduced serine levels underboth nonhypoxic and hypoxic conditions (Fig. 5E). Thus, serinesynthesis increases inNTCcells underhypoxic conditions asa resultof increased PHGDH expression, leading to decreased import and/or increased export of serine. Hypoxia or PHGDH knockdownincreased intracellular levels of all of the metabolites in the EMP ator downstream of the SSP branch point: 3-phosphoglyceric acid(Fig. 5G), 2-phosphoglyceric acid (Fig. 5H), phosphoenolpyruvicacid (Fig. 5I), and pyruvic acid (Fig. 5J). Hypoxia decreased intra-cellular levels of 6-phosphogluconic acid (Fig. 5K), the G6PDreaction product, which is consistent with decreased G6PD
Samanta et al.
Cancer Res; 76(15) August 1, 2016 Cancer Research4434
on April 1, 2019. © 2016 American Association for Cancer Research. cancerres.aacrjournals.org Downloaded from
Published OnlineFirst June 8, 2016; DOI: 10.1158/0008-5472.CAN-16-0530
expression in hypoxic cells (Supplementary Fig. S1). In contrast,PHGDH knockdown did not affect 6-phosphogluconic acid levels,as expected, because the PPP shunt is upstream of the SSP shunt inthe EMP (Fig. 5L). Taken together, the data presented in Fig. 5indicate that PHGDH shunts a significant proportion of glucose-derived 3-phosphoglycerate from the EMP to the SSP in breastcancer cells.
PHGDH knockdown increases the sensitivity of breast cancercells to chemotherapy
As many cytotoxic cancer chemotherapies increase ROS levels(40), we hypothesized that PHGDHdeficiency would also impairthe enrichment of BCSCs that occurs in response to chemotherapy
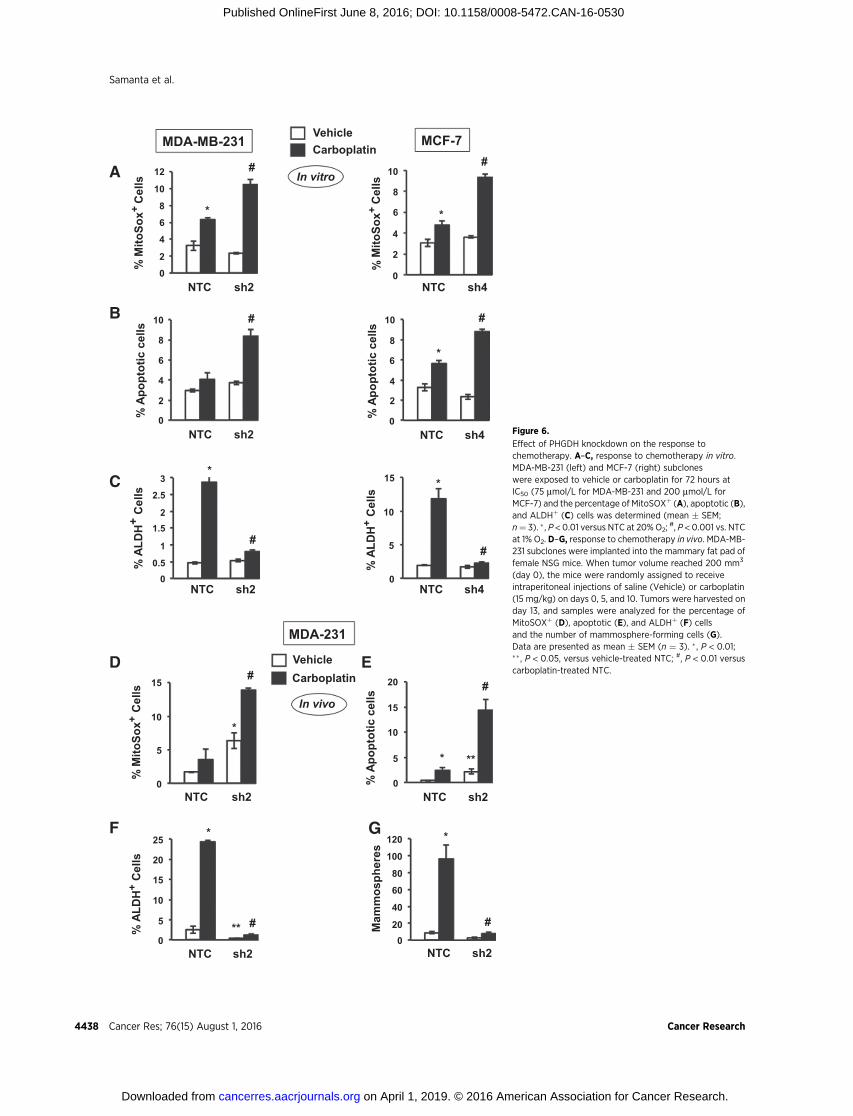
(5–7). Carboplatin is a chemotherapy agent that is used to treatbreast cancer (41, 42). Platinum compounds increase mitochon-drial ROS by forming adducts on mitochondrial DNA, therebyimpairing the transcription of electron transport chain compo-nents (43). MDA-MB-231 and MCF-7 subclones were exposed toincreasing concentrations of carboplatin for 72 hours and cellviability was determined by MTT assay. PHGDH deficiency sen-sitized breast cancer cells to carboplatin (Supplementary Fig. S4).Compared with NTC subclones, treatment of PHGDH-deficientcells with carboplatin at IC50 led to increased mitochondrial ROS(Fig. 6A) and apoptosis (Fig. 6B). Carboplatin treatment of NTCsubclones induced enrichment of ALDHþ BCSCs, which wasabrogated in the knockdown subclones (Fig. 6C).
0
0.2
0.4
0.6
0.8
1
1.2
Rel
ativ
e PH
GD
H
mR
NA
expr
essi
on
sh2 sh4NTC0
0.2
0.4
0.6
0.8
1
1.2
Rel
ativ
e PH
GD
H
mR
NA
expr
essi
on
sh2 sh4NTC
MDA-MB-231 MCF-7
A
PHGDH
NTC sh2
O2 (%) 20 1 20 1 20 1
sh4
Actin
B NTC sh2O2 (%) 20 1 20 1 20 1
sh4
PHGDHActin
sh2 sh4NTC
C
0
12
3
456
7
% A
LDH
+C
ells
0123456789
% A
LDH
+C
ellssh2 sh4NTC
20% O21% O2
sh2 sh4NTC
Primary
sh2 sh4NTC
Secondary Primary Secondary
sh2 sh4NTC sh2 sh4NTC
D
0102030405060
0
5
10
15
20
25
0
20
40
60
80
05
1015202530
Mam
mos
pher
es* * * *
#
*
#
*
# #** ****
**
# #
**
# #
**
## #
**
#
* * *
Figure 3.
Decreased PHGDH expression andhypoxia-induced BCSC enrichment inknockdown subclones. A and B,analysis of PHGDH expression.Subclones of MDA-MB-231 (left) andMCF-7 (right) expressing NTC shRNAor either of two different shRNAstargeting PHGDH (sh2 and sh4) wereexposed to 20% or 1% O2 for 24 (A) or48 (B) hours and analyzed forexpression of PHGDH mRNA by RT-qPCRassay (A) andPHGDHprotein byimmunoblot assay (B). RNA datawerenormalized to NTC (mean � SEM;n ¼ 3). � , P < 0.001 versus NTC.C, Aldefluor assay. Subclones wereexposed to 20% or 1% O2 for 72 hoursand the percentage of ALDHþ cellswas determined by flow cytometry(mean � SEM; n ¼ 3). � , P < 0.01;�� , P < 0.001 versus NTC at 20% O2;#, P < 0.001 versus NTC at 1% O2.D, mammosphere assays. Subcloneswere exposed to 20% or 1% O2 for72 hours, transferred to ultra-lowattachment plates, and 7days later thenumber of primary mammospheresper field was counted (mean � SEM;n ¼ 3). Primary mammospheres werecollected, dissociated, transferred toultra-low attachment plates, andsecondary mammospheres werecounted 7 days later (mean � SEM;n ¼ 3). �, P < 0.01; �� , P < 0.001 versusNTC at 20% O2;
#, P < 0.001 versusNTC at 1% O2.
PHGDH Is Required for Breast Cancer Progression
www.aacrjournals.org Cancer Res; 76(15) August 1, 2016 4435
on April 1, 2019. © 2016 American Association for Cancer Research. cancerres.aacrjournals.org Downloaded from
Published OnlineFirst June 8, 2016; DOI: 10.1158/0008-5472.CAN-16-0530
%M
itoSo
x+ce
lls
NTC sh2 sh4
MDA-MB-231 MCF-7
A
%M
itoSo
x+ce
lls
0
5
10
15
0
2
4
6
8
NTC sh2 sh4
20% O2
1% O2
% A
popt
otic
cel
ls
% A
popt
otic
cel
ls
B
0123456789
NTC sh2 sh40123456789
NTC sh2 sh4
% A
popt
otic
cel
ls
MnTMPyP - - - 50 - 50
% A
popt
otic
cel
ls
MnTMPyP - - - 50 - 50
C
NTC sh2
0
2
4
6
8
0
2
4
6
8
NTC sh4
D
GSH
/GSS
G
GSH
/GSS
G
0
20
40
60
80
100
NTC sh2 sh40
100
200
300
400
500
NTC sh2 sh4
E
NAD
PH
NAD
PH
0
0.5
1
1.5
0
0.5
1
1.5
NTC sh2 sh4 NTC sh2 sh4
##
# #
# # ##
**
**
##
##
##
****
* *
* *
# #
# #
# # # #** * * *
Figure 4.
Effect of PHGDH knockdown on redoxhomeostasis and cell survival.A, analysisof mitochondrial ROS production.MDA-MB-231 (left) and MCF-7 (right)subcloneswere exposed to 20%or 1%O2
for 72 hours and the percentage of cellspositive for MitoSOX Red fluorescencewas determined by flow cytometry(mean� SEM; n¼ 3). #, P < 0.001 versusNTC at 1% O2. B, analysis of apoptosis.The subclones were exposed to 20% or1%O2 for 72 hours and the percentage ofAnnexin Vþ and 7-AAD� apoptotic cellswasdetermined (mean�SEM; n¼3). �� ,P < 0.001 versus NTC at 20% O2;
#P <0.001 versus NTC at 1% O2. C, rescue byROS scavenger. The subclones wereexposed to 20% or 1%O2 in the presenceor absence of 50 mmol/L MnTMPyP for72 hours and the percentage of AnnexinVþ/7-AAD� apoptotic cells wasdetermined (mean � SEM; n ¼ 3).�� , P < 0.001 versus NTC at 20% O2;#, P < 0.001 versus NTC at 1% O2;##, P < 0.001 versus no MnTMPyP.D andE, subcloneswere exposed to 20%or 1% O2 for 72 hours and the GSH/GSSGratio (D) and NADPH levels (E) weremeasured andnormalized toNTCat 20%O2 (mean � SEM; n ¼ 3). � , P < 0.01versusNTCat 20%O2;
#,P<0.001 versusNTC at 1% O2.
Samanta et al.
Cancer Res; 76(15) August 1, 2016 Cancer Research4436
on April 1, 2019. © 2016 American Association for Cancer Research. cancerres.aacrjournals.org Downloaded from
Published OnlineFirst June 8, 2016; DOI: 10.1158/0008-5472.CAN-16-0530
OC
R(p
mol
/min
/mg)
0
0.05
0.1
0.15
0.2
01234567
ECAR
(mpH
/min
/mg)
0200400600800
1,0001,2001,400
Glu
cose
upt
ake MCF7 NTC
MCF7 sh4MCF7 sh2
MDA231 NTCMDA231 sh2
A B C
NTCsh2sh4Media
0
200
400
20% 1%
Serine Extracellular
0
10,000
20,000
20% 1%
Lactic acidDC
once
ntra
tion
(pm
ol/1
06ce
lls)
E
MDA-231
030,00060,00090,000
120,000150,000180,000
20% 1%
Lactic acid(Lac)
Con
cent
ratio
n (p
mol
/106
cells
)
Intracellular
NTCsh2sh4
0100
200300
400500600
3-Phosphoglyceric acid(3PG)
20% 1%
F G
MDA-231
0
20
40
60
2-Phosphoglyceric acid (2PG)
20% 1%
Con
cent
ratio
n (p
mol
/106
cells
)
0
50
100
150
200
250
Phosphoenolpyruvic acid(PEP)
20% 1%
H I
0
1,000
2,000
3,000
4,000
5,000
Pyruvic acid(Pyr)
20% 1%
J
0
100
200
300
400
20% 1%
6-Phosphogluconic acid(6PG)
Con
cent
ratio
n (p
mol
/106
cells
)
K
Glc G6P 3PG 2PG PEP Pyr
Lac
AcCoA 6PG
5
3Ser
LPPP
SSP
**
* ***
**
*# #
* *#
#
**
* #*#
*
#*
#
*#
*
#
*
#
*
#
*#*
#
** *
Figure 5.
Metabolic consequences of PHGDHknockdown. A and B, measurement ofoxygen consumption rate (OCR) andextracellular acidification rate (ECAR).OCR (A; mean� SEM; n¼ 3) and ECAR(B; mean� SEM; n¼ 3)weremeasuredin MCF-7 and MDA-MB-231 subclonesincubated at 20% O2 for 72 hours.� , P < 0.001 versus MCF-7 NTC;�� , P < 0.001 versus MDA-MB-231 NTC.C, analysis of glucose uptake.Subclones cultured under 20% O2
were stained with 150 mmol/L2-[N-(7-nitrobenz-2-oxa-1,3-diazol-4-yl) amino]-2-deoxy-D-glucose andthe mean fluorescence intensity wasdetermined by flow cytometry (mean� SEM; n¼ 3).D–K,metabolomic data.MDA-MB-231 subclones were exposedto 20% or 1% O2 for 72 hours and theabsolute concentrations ofextracellular (D and E) and intracellular(F–K) metaboliteswere determined byMS using reference standards (mean�SEM; n¼ 3). � , P < 0.001 versus NTC at20% O2;
#, P < 0.001 versus NTC at 1%O2. L, glucose (Glc) metabolicpathways. Embden–Meyerhof (main)pathway, pentose phosphate pathway(PPP; only first reaction is shown), andserine synthesis pathway (SSP) areshown in abbreviated form that omitsthe five enzymatic reactions betweenglucose-6-phosphate (G6P) and 3PG,and the three reactions between3PG and Ser.
PHGDH Is Required for Breast Cancer Progression
www.aacrjournals.org Cancer Res; 76(15) August 1, 2016 4437
on April 1, 2019. © 2016 American Association for Cancer Research. cancerres.aacrjournals.org Downloaded from
Published OnlineFirst June 8, 2016; DOI: 10.1158/0008-5472.CAN-16-0530
A
B
C
% A
popt
otic
cel
ls%
Mito
Sox+
Cel
ls%
ALD
H+
Cel
ls
00.5
1
1.52
2.5
3
0
2
4
6
8
10
12
0
2
4
6
8
10
MCF-7
NTC sh4
NTC sh4
NTC sh4
In vitro
Vehicle Carboplatin MDA-MB-231
NTC sh2
NTC sh2
NTC sh2
%M
itoSo
x+C
ells
% A
popt
otic
cel
ls%
ALD
H+
Cel
ls
0
5
10
15
0
2
4
6
8
10
0
2
4
6
8
10
% A
LDH
+C
ells
%M
itoSo
x+C
ells
D
F
0
5
10
15
20
25
NTC sh2
0
5
10
15
NTC sh2
% A
popt
otic
cel
ls
E
0
5
10
15
20
NTC sh2
020
40
60
80
100
120
NTC sh2
Mam
mos
pher
es
MDA-231
Vehicle Carboplatin
In vivo
G
*
#
*
#
*
##
#
*
#
*
*
##
*
**
*
#** #
*
Figure 6.
Effect of PHGDH knockdown on the response tochemotherapy. A–C, response to chemotherapy in vitro.MDA-MB-231 (left) and MCF-7 (right) subcloneswere exposed to vehicle or carboplatin for 72 hours atIC50 (75 mmol/L for MDA-MB-231 and 200 mmol/L forMCF-7) and the percentage of MitoSOXþ (A), apoptotic (B),and ALDHþ (C) cells was determined (mean � SEM;n¼ 3). � , P < 0.01 versus NTC at 20% O2;
#, P < 0.001 vs. NTCat 1% O2. D–G, response to chemotherapy in vivo. MDA-MB-231 subclones were implanted into the mammary fat pad offemale NSG mice. When tumor volume reached 200 mm3
(day 0), the mice were randomly assigned to receiveintraperitoneal injections of saline (Vehicle) or carboplatin(15 mg/kg) on days 0, 5, and 10. Tumors were harvested onday 13, and samples were analyzed for the percentage ofMitoSOXþ (D), apoptotic (E), and ALDHþ (F) cellsand the number of mammosphere-forming cells (G).Data are presented as mean � SEM (n ¼ 3). � , P < 0.01;��, P < 0.05, versus vehicle-treated NTC; #, P < 0.01 versuscarboplatin-treated NTC.
Samanta et al.
Cancer Res; 76(15) August 1, 2016 Cancer Research4438
on April 1, 2019. © 2016 American Association for Cancer Research. cancerres.aacrjournals.org Downloaded from
Published OnlineFirst June 8, 2016; DOI: 10.1158/0008-5472.CAN-16-0530
We also investigated the effect of PHGDH knockdown on theresponse to doxorubicin, which is an anthracycline that iscommonly used in the United States to treat breast cancer andwas the first chemotherapeutic shown to induce HIF activity(44). Compared with NTC subclones, treatment of PHGDH-deficient cells with doxorubicin at IC50 increased mitochondrialROS (Supplementary Fig. S5A) and apoptosis (SupplementaryFig. S5B). Doxorubicin treatment induced enrichment ofALDHþ BCSCs, which was abrogated in the PHGDH-knock-down subclones (Supplementary Fig. S5C). Thus, both plati-num and anthracycline chemotherapy induce PHGDH-depen-dent BCSC enrichment.
To investigate whether carboplatin-induced BCSC enrichmentin vivo also requires PHGDH expression, MDA-MB-231 subclones(2� 106 cells) were implanted in the mammary fat pad (MFP) offemale NSG mice. When tumors reached a volume of 200 mm3,micewere treatedwith 15mg/kg of carboplatin by intraperitonealinjection every 5 days for 3 doses. Tumors were harvested 3 daysafter the last dose for analysis. Compared with NTC subclones,PHGDH knockdown subclones exhibited a greater increase in thepercentage of MitoSOXþ (Fig. 6D) and apoptotic (Fig. 6E) cells.Carboplatin treatment increased the percentage of ALDHþ cells(Fig. 6F) and number ofmammosphere-forming cells (Fig. 6G) inthe NTC subclone, and these effects were abrogated by PHGDHknockdown (Fig. 6F and G). These results indicate that PHGDHdeficiency sensitizes breast cancer cells to chemotherapy andabrogates chemotherapy-induced BCSC enrichment.
PHGDH expression promotes tumor initiation and is requiredfor breast cancer metastasis
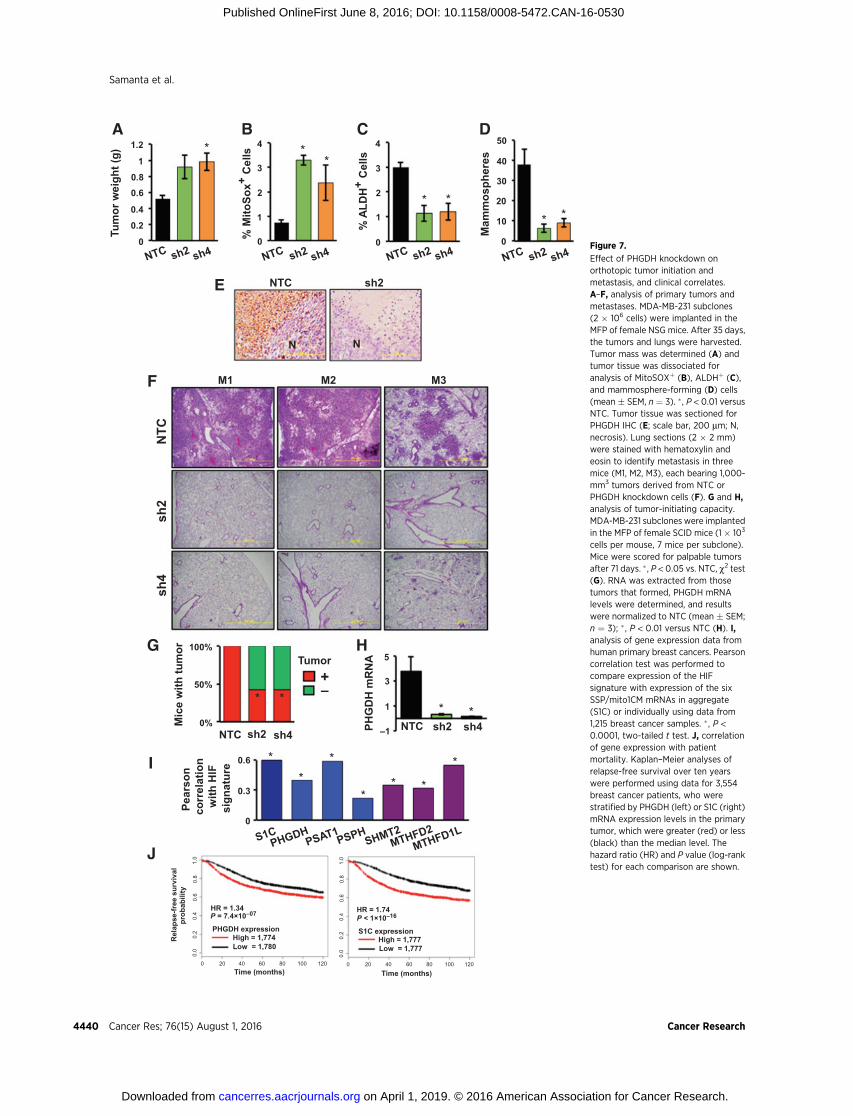
To investigate whether PHGDH regulates other aspects ofbreast cancer progression, MDA-MB-231 NTC and PHGDHknockdown subclones were implanted in the MFP of NSG miceand the resulting tumors were harvested on day 35. PHGDHknockdown was associated with a significant increase in tumormass after orthotopic transplantation of sh2 and sh4 cells(Fig. 7A), which was consistent with cell culture data demonstrat-ing increased growth of the sh2 and sh4 (as well as sh3 and sh5)PHGDH-knockdown subclones in vitro (Supplementary Fig. S3A).The tumors analyzed in Fig. 7A were derived from the injection of2 � 106 cells; under these conditions, BCSCs are not limiting forprimary tumor formation. PHGDH knockdown was associatedwith an increased percentage of MitoSOXþ cells (Fig. 7B) anddecreased BCSCs as determined by Aldefluor (Fig. 7C) andmammosphere (Fig. 7D) assays. IHC revealed PHGDH expres-sion in perinecrotic (hypoxic) regions of NTC tumors but not inknockdown tumors (Fig. 7E).
To determine whether PHGDH is required for spontaneousmetastasis frombreast to lungs,MDA-MB-231 subclones (2� 106
cells) were again injected into the MFP of female NSG mice. Totake into account differences in primary tumor growth, tumorsand lungs were isolated when primary tumors reached a volumeof 1000 mm3. Despite growing faster, PHGDH knockdowntumors did not generate lungmetastases, whereas inmice bearingNTC tumors, metastatic cells occupied large areas of the lungparenchyma (Fig. 7F).
To investigate whether PHGDH promotes the tumor-initiatingpotential of breast cancer cells, we injected only 1� 103 cells intotheMFPof female SCIDmice, so that BCSCswould be limiting fortumor formation. NTC cells formed tumors by day 71 afterinjection in 7 of 7 injected mice, whereas sh2 and sh4 cells each
formed tumors in only 3 out of 7 mice (Fig. 7G). PHGDHmRNAlevels in knockdown tumors were significantly less than in NTCtumors (Fig. 7H).
Analysis of SSP and 1CM expression in primary human breastcancers
To investigate the clinical relevance of our experimental find-ings, we mined gene expression databases. We first investigatedwhether expression of mRNA encoding SSP and mito1CMenzymes, either individually or in aggregate (designated S1C),was correlated with the HIF signature, which comprised expres-sion of HIF-1a mRNA and 13 HIF target-gene mRNAs (PLOD1,VEGFA, LOX, P4HA2, NDRG1, SLC2A1, ERO1L, ADM, LDHA,PGK1, ANGPTL4, SLC2A3, and CA9), in 1,215 breast cancerspecimens (31, 32) using Pearson correlation test. For each ofthe 6 mRNAs encoding an SSP or mito1CM enzyme, expressionwas significantly correlated with the HIF signature (P < 0.0001 ineach case; Fig. 7I). These results are consistent with the dataobtained from breast cancer cell lines demonstrating that hypox-ia-induced expression of these genes is HIF-dependent (Fig. 1and 2). Analysis of the GOBO database (33) revealed that S1Cgene expression increased significantly (P<0.00001)with increas-ing tumor grade (Supplementary Fig. S6A). Analysis of PHGDHorS1CmRNA expression in > 3,500 human breast cancer specimensusing KMPlotter (34) revealed that levels greater than themedianwere associated with decreased relapse-free survival (HR ¼ 1.34and P < 10�7 for PHGDH; HR ¼ 1.74 and P < 10�16 for S1C; Fig.7J). Greater-than-median expression of SHMT2 or MTHFD2, butnot PSAT1or PSPH,was also associatedwith a significant decreasein relapse-free survival (Supplementary Fig. S6B). Thus, expres-sion of SSP and mito1CM mRNAs in primary breast cancers isHIF-regulated and predictive of patient mortality.
DiscussionRecent studies have attempted to determine the mechanisms
and consequences of PHGDHenzyme expression in breast cancer,but these studies have focused on cell proliferation in vitro orprimary tumor growth in vivo (25, 26). Here, we demonstrate thathypoxia induces expression of PHGDH and other SSP andmito1CM enzymes that is mediated by HIF-1 and HIF-2. Thiscoordinate regulation of multiple genes provides a mechanism toincrease flux through the pathway. The expression of at least fourout of six genes encoding SSP/mito1CM enzymes was induced byhypoxia in each of the cell lines analyzed, which included repre-sentative lines derived from ERþ, HER2þ, and triple-negativebreast cancers. PHGDH and SHMT2 expression was hypoxia-induced in all six breast cancer lines and was increased inBCSC-enriched cell populations. In addition, increased expres-sion in primary breast cancers of mRNA encoding PHGDH,SHMT2, MTHFD2, or all six SSP/mito1CM enzymes was associ-ated with HIF target-gene expression and an increased risk ofpatient mortality. Regulation of PHGDH, PSAT1, PSPH, SHMT1,and SHMT2 expression by the transcription factors NRF2 andATF4 in lung cancer andMYC in liver cancer was recently reported(45, 46). Further studies are required to determine whether ATF4or MYC regulates basal expression of these genes in breast cancer.
We studied the consequences of PHGDH deficiency because ofits role as the first enzyme in the SSP that is responsible fordiverting glucose metabolites from the EMP and because thefinding of PHGDH gene amplification in 6% of primary breast
PHGDH Is Required for Breast Cancer Progression
www.aacrjournals.org Cancer Res; 76(15) August 1, 2016 4439
on April 1, 2019. © 2016 American Association for Cancer Research. cancerres.aacrjournals.org Downloaded from
Published OnlineFirst June 8, 2016; DOI: 10.1158/0008-5472.CAN-16-0530
0
1
2
3
4
% A
LDH
+C
ells
0
1
2
3
4
%M
itoSo
x+C
ells
0
10
20
30
40
50
Mam
mos
pher
es
A B C D
0
0.2
0.4
0.60.8
1
1.2
Tum
or w
eigh
t (g)
NTC
sh2
sh4
NTC sh2E
F
N N
M1 M2 M3
G
NTC sh2 sh4
Mic
e w
ith tu
mor
0%
50%
100%
+-
Tumor
1
–1
3
5
PHG
DH
mR
NA
NTC sh2 sh4
H
I
0
0.3
0.6
Pear
son
corr
elat
ion
with
HIF
si
gnat
ure
0.0
0.2
0.4
0.6
0.8
1.0
0.0
0.2
0.4
0.6
0.8
1.0
20 40 60 80 100 1200 20 40 60 80 100 1200Time (months)
Rel
apse
-free
sur
viva
l pr
obab
ility
Time (months)
J
PHGDH expressionHigh = 1,774 Low = 1,780
HR = 1.34P = 7.4×10-07
S1C expressionHigh = 1,777 Low = 1,777
HR = 1.74P < 1×10-16
**
* ** *
*
* ***
**
*
** *
*
Figure 7.
Effect of PHGDH knockdown onorthotopic tumor initiation andmetastasis, and clinical correlates.A–F, analysis of primary tumors andmetastases. MDA-MB-231 subclones(2 � 106 cells) were implanted in theMFP of female NSG mice. After 35 days,the tumors and lungs were harvested.Tumor mass was determined (A) andtumor tissue was dissociated foranalysis of MitoSOXþ (B), ALDHþ (C),and mammosphere-forming (D) cells(mean � SEM, n ¼ 3). �, P < 0.01 versusNTC. Tumor tissue was sectioned forPHGDH IHC (E; scale bar, 200 mm; N,necrosis). Lung sections (2 � 2 mm)were stained with hematoxylin andeosin to identify metastasis in threemice (M1, M2, M3), each bearing 1,000-mm3 tumors derived from NTC orPHGDH knockdown cells (F). G and H,analysis of tumor-initiating capacity.MDA-MB-231 subclones were implantedin the MFP of female SCID mice (1 � 103
cells per mouse, 7 mice per subclone).Mice were scored for palpable tumorsafter 71 days. � , P < 0.05 vs. NTC, c2 test(G). RNA was extracted from thosetumors that formed, PHGDH mRNAlevels were determined, and resultswere normalized to NTC (mean � SEM;n ¼ 3); � , P < 0.01 versus NTC (H). I,analysis of gene expression data fromhuman primary breast cancers. Pearsoncorrelation test was performed tocompare expression of the HIFsignature with expression of the sixSSP/mito1CM mRNAs in aggregate(S1C) or individually using data from1,215 breast cancer samples. � , P <0.0001, two-tailed t test. J, correlationof gene expression with patientmortality. Kaplan–Meier analyses ofrelapse-free survival over ten yearswere performed using data for 3,554breast cancer patients, who werestratified by PHGDH (left) or S1C (right)mRNA expression levels in the primarytumor, which were greater (red) or less(black) than the median level. Thehazard ratio (HR) and P value (log-ranktest) for each comparison are shown.
Samanta et al.
Cancer Res; 76(15) August 1, 2016 Cancer Research4440
on April 1, 2019. © 2016 American Association for Cancer Research. cancerres.aacrjournals.org Downloaded from
Published OnlineFirst June 8, 2016; DOI: 10.1158/0008-5472.CAN-16-0530
cancers suggested a critical role for this enzyme in breast cancerprogression. Our data suggest that a major determinant ofincreased PHGDH expression in breast cancers without geneamplification is intratumoral hypoxia, which is a common find-ing in advanced breast cancer (8). The correlation betweenexpression of PHGDH and HIF target genes in primary breastcancers strongly supports this conclusion. Similar to PHGDH,SHMT2 expression was induced by hypoxia in all breast cancerlines studied and SHMT2 overexpression in breast cancers wasassociated with patient mortality, suggesting that SHMT2 is alsoimportant for breast cancer progression. The expressionof SHMT2is induced by hypoxia in neuroblastoma cells and SHMT2 knock-down was shown to increase ROS levels and cell death underhypoxic conditions, but effects on cancer stem cells andmetastasiswere not studied (47). These findings point to the importance ofcoordinate, HIF-mediated regulation of SSP and mito1CMenzyme expression, and suggest that this metabolic requirementis not limited to breast cancer.
Metabolic analyses revealed that both ERþ and ER� breastcancer cells divert a considerable proportion of glucose-derived3-phosphoglyceric acid to the SSP, as PHGDH knockdown led tosignificantly increased oxidative and glycolytic metabolism undernonhypoxic conditions. Consistent with these findings, metabo-lomic analyses revealed that PHGDHknockdown led to increasedconcentrations of EMP intermediates downstream of and includ-ing 3-phosphoglyceric acid, the substrate for PHGDH. Geneexpression and clinical outcome data from thousands of breastcancers suggest that this metabolic reprogramming is not limitedto tissue culture cells. The orthotopic transplantation studiesprovide evidence that PHGDH expression is a major determinantof BCSC abundance and metastasis.
Our data indicate that PHGDH expression is critical underhypoxic conditions to increase the availability of reduced gluta-thione for maintenance of redox homeostasis. In PHGDH knock-down subclones, NADPH levels were decreased and mitochon-drial ROS levels increased under hypoxic conditions, leading toincreased apoptosis compared with NTC subclones. Gene expres-sion andmetabolomic studies revealed increased expressionof thefirst enzyme of the SSP andmito1CM (PHGDH and SHMT2) andrepression of thefirst enzyme of the PPP (G6PD) in hypoxic breastcancer cells, indicating a switch from cytosolic to mitochondrialproduction of NADPH to combat increased ROS generated by theelectron transport chain (23). Thus, under hypoxic conditions,HIFs mediate a metabolic switch from oxidative to glycolyticmetabolism, which reduces mitochondrial oxidant generation(18), and a switch from cytosolic to mitochondrial NADPHgeneration, which augments antioxidant defenses. The increaseinNADPHcomplements increased glutathione synthesis, which isalso induced in hypoxic breast cancer cells by HIF-1 (7, 48).
PHGDHknockdown reduced the number of BCSCs under bothnonhypoxic andhypoxic conditions in vitro andwithin orthotopictumors. The functional consequences of this loss of BCSCs
included impaired capacity for tumor initiation and lung metas-tasis. We interpret the previously reported failure of PHGDHknockdown cells to form tumor xenografts (25) as due to adeficiency of BCSCs rather than an effect on cell proliferation,which we did not observe in vitro or in vivo. Similarly, the loss ofmetastatic capacity we demonstrated is likely due, at least in part,to a deficiency of BCSCs (49, 50).
PHGDH knockdown sensitized both ERþ and ER� breastcancer lines to chemotherapy, with increasedmitochondrial ROS,increased apoptosis, and loss of chemotherapy-induced BCSCenrichment. These findings suggest that combining chemothera-py with an inhibitor of PHGDH may improve the survival ofwomen with advanced breast cancer by blocking counter-thera-peutic induction of BCSCs. HIF inhibitors may be useful to targetBCSCs because, in addition to blocking induction of SSP andmito1CM enzymes, they block multiple other pathways, whichare induced by hypoxia (13, 14) or chemotherapy (6, 7) andwhich promote BCSC specification or maintenance. Our findingsunderscore the importance of adaptive responses to the hypoxictumor microenvironment and to chemotherapy, whereby cancercells maintain metabolic and redox homeostasis, which isrequired for execution of the BCSC and metastatic programs thatunderlie the lethal cancer phenotype.
Disclosure of Potential Conflicts of InterestThe authors disclose no potential conflicts of interest.
Authors' ContributionsConception and design: D. Samanta, G.L. SemenzaDevelopment of methodology: D. Samanta, S.A. Andrabi, G.L. SemenzaAcquisition of data (provided animals, acquired and managed patients,provided facilities, etc.): D. Samanta, Y. Park, S.A. Andrabi, D.M. GilkesAnalysis and interpretation of data (e.g., statistical analysis, biostatistics,computational analysis): D. Samanta, S.A. Andrabi, G.L. SemenzaWriting, review, and/or revision of themanuscript:D. Samanta, G.L. SemenzaAdministrative, technical, or material support (i.e., reporting or organizingdata, constructing databases): L.M. SheltonStudy supervision: G.L. Semenza
AcknowledgmentsWe thank Haiquan Lu for helpful comments and Karen Padgett (Novus
Biologicals) for providing IgG and antibodies against PHGDH, PSAT1, PSPH,and Annexin V.
Grant SupportThis work was supported by Breast Cancer Research Program Impact Award
W81XWH-12-1-0464 from the Department of Defense and a grant from theCindy Rosencrans Fund for Triple Negative Breast Cancer (G.L. Semenza).
The costs of publication of this articlewere defrayed inpart by the payment ofpage charges. This article must therefore be hereby marked advertisement inaccordance with 18 U.S.C. Section 1734 solely to indicate this fact.
Received February 18, 2016; revised May 23, 2016; accepted May 31, 2016;published OnlineFirst June 8, 2016.
References1. Al-Hajj M, Wicha M, Benito-Hernandez A, Morrison S, Clarke M. Prospec-
tive identification of tumorigenic breast cancer cells. Proc Natl Acad SciU S A 2003;100:3983–8.
2. Charafe-Jauffret E, Ginestier C, Iovino F, Wicinski J, Cervera N, Finetti P,et al. Breast cancer cell lines contain functional cancer stem cells with
metastatic capacity and a distinct molecular signature. Cancer Res2009;69:1302–13.
3. Li X, Lewis MT, Huang J, Gutierrez C, Osborne CK, Wu MF, et al. Intrinsicresistance of tumorigenic breast cancer cells to chemotherapy. J Natl CancerInst 2008;100:672–9.
PHGDH Is Required for Breast Cancer Progression
www.aacrjournals.org Cancer Res; 76(15) August 1, 2016 4441
on April 1, 2019. © 2016 American Association for Cancer Research. cancerres.aacrjournals.org Downloaded from
Published OnlineFirst June 8, 2016; DOI: 10.1158/0008-5472.CAN-16-0530
4. Creighton CJ, Li X, Landis M, Dixon JM, Neumeister VM, Sjolund A, et al.Residual breast cancers after conventional therapy display mesenchymal aswell as tumor-initiating features. ProcNatl AcadSciU SA2009;106:13820–5.
5. Bhola NE, Balko JM, Dugger TC, Kuba MG, Sanchez V, Sanders M, et al.TGF-b inhibition enhances chemotherapy action against triple-negativebreast cancer. J Clin Invest 2013;123:1348–58.
6. Samanta D, Gilkes DM, Chaturvedi P, Xiang L, Semenza GL. Hypoxia-inducible factors are required for chemotherapy resistance of breast cancerstem cells. Proc Natl Acad Sci U S A 2014;111:E5429–38.
7. Lu H, Samanta D, Xiang L, Zhang H, Hu H, Chen I, et al. Chemotherapytriggers HIF-1- dependent glutathione synthesis and copper chelation thatinduces the breast cancer stem cell phenotype. Proc Natl Acad Sci U S A2015;112:E4600–9.
8. Harris AL. Hypoxia – a key regulatory factor in tumor growth. Nat RevCancer 2002;2:38–74.
9. Sullivan R, Graham CH. Hypoxia-driven selection of the metastatic phe-notype. Cancer Metastasis Rev 2007;26:319–31.
10. Conley SJ, Gheordunescu E, Kakarala P, Newman B, Korkaya H, Heath AN,et al. Antiangiogenic agents increase breast cancer stem cells via thegeneration of tumor hypoxia. Proc Natl Acad Sci U S A 2012;109:2784–9.
11. Schwab LP, PeacockDL,Majumdar D, Ingels JF, Jensen LC, Smith KD, et al.Hypoxia- inducible factor 1a promotes primary tumor growth and tumor-initiating cell activity in breast cancer. Breast Cancer Res 2012;14:R6.
12. Regan Anderson TM, Peacock DL, Daniel AR, Hubbard GK, Lofgren KA,Girard BJ, et al. Breast tumor kinase (Brk/PTK6) is a mediator of hypoxia-associated breast cancer progression. Cancer Res 2013;73:5810–20.
13. Xiang L,GilkesDM,HuH, TakanoN, LuoW, LuH, et al.Hypoxia-induciblefactor 1 mediates TAZ expression and nuclear localization to induce thebreast cancer stem cell phenotype. Oncotarget 2014;5:12509–27.
14. Zhang C, Samanta D, Lu H, Bullen JW, Zhang H, Chen I, et al. Hypoxiainduces the breast cancer stem cell phenotype by HIF-dependent andALKBH5-mediatedm6A-demethylation ofNANOGmRNA. ProcNatl AcadSci U S A 2016;113:E2047–56.
15. Semenza GL. The hypoxic tumor microenvironment: a driving force forbreast cancer progression. Biochim Biophys Acta 2016;1863:379–81.
16. Iyer NV, Kotch LE, Agani F, Leung SW, Laughner E, Wenger RH, et al.Cellular and developmental control of O2 homeostasis by hypoxia-induc-ible factor 1a. Genes Dev 1998;12:149–62.
17. Seagroves TN, Ryan HE, Lu H, Wouters BG, Knapp BG, Thibault P, et al.Transcription factor HIF-1 is a necessarymediator of the Pasteur effect. MolCell Biol 2001;21:3436–44.
18. Kim JW, Tchernyshyov I, Semenza GL, Dang CV. HIF-1-mediated expres-sion of pyruvate dehydrogenase kinase: a metabolic switch required forcellular adaptation to hypoxia. Cell Metab 2006;3:177–85.
19. Papandreou I, Cairns RA, Fontana L, Lim AL, Denko NC. HIF-1 mediatesadaptation to hypoxia by actively downregulating mitochondrial oxygenconsumption. Cell Metab 2006;3:187–97.
20. HuangD, Li T, Li X, Zhang L, SunL,HeX, et al.HIF-1-mediated suppressionof acyl-CoA dehydrogenases and fatty acid oxidation is critical for cancerprogression. Cell Rep 2014;8:1930–42.
21. Zhang H, Bosch-Marc�e M, Shimoda LA, Tan YS, Baek JH, Wesley JB, et al.Mitochondrial autophagy is an HIF-1-dependent adaptive metabolicresponse to hypoxia. J Biol Chem 2008;283:10892–903.
22. BellotG, Garcia-Medina R,Gounon P, Chiche J, RouxD, Pouyss�egur J, et al.Hypoxia- induced autophagy is mediated through hypoxia-induciblefactor induction of BNIP3 and BNIP3L via their BH3 domains. Mol CellBiol 2009;29:2570–81.
23. Chandel NS, McClintock DS, Feliciano CE, Wood TM, Melendez JA,Rodriguez AM, et al. Reactive oxygen species generated at mitochondrialcomplex III stabilize hypoxia-inducible factor-1a during hypoxia: a mech-anism of O2 sensing. J Biol Chem 2000;275:25130–8.
24. Schumacker PT. Reactive oxygen species in cancer: a dance with the devil.Cancer Cell 2015;27:156–7.
25. Possemato R, Marks KM, Shaul YD, Pacold ME, Kim D, Birsoy K, et al.Functional genomics reveal that the serine synthesis pathway is essential inbreast cancer. Nature 2011;476:346–50.
26. Locasale JW, Grassian AR, Melman T, Lyssiotis CA, Mattaini KR, Bass AJ,et al. Phosphoglycerate dehydrogenase diverts glycolytic flux and contri-butes to oncogenesis. Nat Genet 2011;43:869–74.
27. Suda T, Takubo S, Semenza GL. Metabolic regulation of hematopoieticstem cells in the hypoxic niche. Cell Stem Cell 2011:9:298–310.
28. Zhang H, Wong CC, Wei H, Gilkes DM, Korangath P, Chaturvedi P, et al.HIF-1-dependent expression of angiopoietin-like 4 and L1CAM mediatesvascular metastasis of hypoxic breast cancer cells to the lungs. Oncogene2012:31:1757–70.
29. Soga T, Ohashi Y, Ueno Y, Naraoka H, Tomita M, Nishioka T. Quantitativemetabolome analysis using capillary electrophoresis mass spectrometry. JProteome Res 2003;2:488–94.
30. Sugimoto M, Wong DT, Hirayama A, Soga T, Tomita M. Capillary elec-trophoresis mass spectrometry-based saliva metabolomics identified oral,breast and pancreatic cancer–specific profiles. Metabolomics 2009;6:78–95.
31. GoldmanM, Craft B, Swatloski T, Ellrott K, ClineM, DiekhansM, et al. TheUCSCCancer Genomics Browser: update 2013.Nucleic Acids Res 2013;41:D949–54.
32. The Cancer Genome Atlas Network. Comprehensivemolecular portraits ofhuman breast tumors. Nature 2012;490:61–70.
33. Ringn�erM, Fredlund E, H€akkinen J, Borg Å, Staaf J. GOBO: gene expressionbased outcome for breast cancer online. PLoS One 2011;6:e17911.
34. Gy€orffy B, Lanczky A, Eklund AC, Denkert C, Budczies J, Li Q, et al. Anonline survival analysis tool to rapidly assess the effect of 22,277 genes onbreast cancer prognosis using microarray data of 1,809 patients. BreastCancer Res Treat 2010;123:725–31.
35. Neve RM,Chin K, Fridlyand J, Yeh J, Baehner FL, Fevr T, et al. A collection ofbreast cancer cell lines for the study of functionally distinct cancer subtypes.Cancer Cell 2006;10:515–27.
36. Lee K, Zhang H, Qian DZ, Rey S, Liu JO, Semenza GL. Acriflavine inhibitsHIF-1 dimerization, tumor growth, and vascularization. Proc Natl Acad SciU S A 2009;106:17910–5.
37. Ginestier C, Hur MH, Charafe-Jauffret E, Monville F, Dutcher J, Brown M,et al. ALDH1 is a marker of normal andmalignant humanmammary stemcells and a predictor of poor clinical outcome. Cell Stem Cell 2007;1:555–67.
38. Ponti D, Costa A, Zaffaroni N, Pratesi G, Petrangolini G, Coradini D, et al.Isolation and in vitro propagation of tumorigenic breast cancer cells withstem/progenitor cell properties. Cancer Res 2005;65:5506–11.
39. Gardner PR, Nguyen DD, White CW. Superoxide scavenging by Mn(II/III)tetrakis (1-methyl-4- pyridyl) porphyrin in mammalian cells. Arch Bio-chem Biophys 1996;325:20–8.
40. Doroshow JH. Redox modulation of chemotherapy-induced tumor cellkilling and normal tissue toxicity. J Natl Cancer Inst 2006;98:223–5.
41. Perez EA. Carboplatin in combination therapy formetastatic breast cancer.Oncologist 2004;9:518–27.
42. Wang H, Li M, Rinehart JJ, Zhang R. Pretreatment with dexamethasoneincreases antitumor activity of carboplatin and gemcitabine in micebearing human cancer xenografts: in vivo activity, pharmacokinetics, andclinical implications for cancer chemotherapy. Clin Cancer Res 2004;10:1633–44.
43. Marullo R, Werner E, Degtyareva N, Moore B, Altavilla G, Ramalingam SS,et al. Cisplatin induces a mitochondrial-ROS response that contributes tocytotoxicity depending on mitochondrial redox status and bioenergeticfunctions. PLoS ONE 2013;8:e81162.
44. Cao Y, Eble JM, Moon E, Yuan H, Weitzel DH, Landon CD, et al. Tumorcells upregulate normoxic HIF-1a in response to doxorubicin. Cancer Res2013;73:6230–42.
45. DeNicola GM, Chen PH,Mullarky E, Sudderth JA, Hu Z,WuD, et al. NRF2regulates serine biosynthesis in non-small cell lung cancer. Nat Genet2015;47:1475–81.
46. Sun L, Song L, WanQ,WuG, Li X, Wang Y, et al. cMyc-mediated activationof serine biosynthesis pathway is critical for cancer progression undernutrient deprivation conditions. Cell Res 2015;25:429–44.
47. Ye J, Fan J, Venneti S, Wan YW, Pawel BR, Zhang J, et al. Serine catabolismregulates mitochondrial redox control during hypoxia. Cancer Discov2014;4:1406–17.
48. Harris IS, Treloar AE, Inoue S, Sasaki M, Gorrini C, Lee KC, et al. Gluta-thione and thioredoxin antioxidant pathways synergize to drive cancerinitiation and progression. Cancer Cell 2002;27:211–22.
49. Brooks MD, Burness ML, Wicha MS. Therapeutic implications of cellularheterogeneity and plasticity in breast cancer. Cell Stem Cell 2015;17:260–71.
50. OskarssonT, Batlle E,Massagu�e J.Metastatic stem cells: sources, niches, andvital pathways. Cell Stem Cell 2014;14:306–21.
Cancer Res; 76(15) August 1, 2016 Cancer Research4442
Samanta et al.
on April 1, 2019. © 2016 American Association for Cancer Research. cancerres.aacrjournals.org Downloaded from
Published OnlineFirst June 8, 2016; DOI: 10.1158/0008-5472.CAN-16-0530
2016;76:4430-4442. Published OnlineFirst June 8, 2016.Cancer Res Debangshu Samanta, Youngrok Park, Shaida A. Andrabi, et al. MetastasisHomeostasis, Breast Cancer Stem Cell Maintenance, and Lung PHGDH Expression Is Required for Mitochondrial Redox
Updated version
10.1158/0008-5472.CAN-16-0530doi:
Access the most recent version of this article at:
Material
Supplementary
http://cancerres.aacrjournals.org/content/suppl/2016/06/08/0008-5472.CAN-16-0530.DC1
Access the most recent supplemental material at:
Cited articles
http://cancerres.aacrjournals.org/content/76/15/4430.full#ref-list-1
This article cites 50 articles, 19 of which you can access for free at:
Citing articles
http://cancerres.aacrjournals.org/content/76/15/4430.full#related-urls
This article has been cited by 9 HighWire-hosted articles. Access the articles at:
E-mail alerts related to this article or journal.Sign up to receive free email-alerts
Subscriptions
Reprints and
To order reprints of this article or to subscribe to the journal, contact the AACR Publications Department at
Permissions
Rightslink site. Click on "Request Permissions" which will take you to the Copyright Clearance Center's (CCC)
.http://cancerres.aacrjournals.org/content/76/15/4430To request permission to re-use all or part of this article, use this link
on April 1, 2019. © 2016 American Association for Cancer Research. cancerres.aacrjournals.org Downloaded from
Published OnlineFirst June 8, 2016; DOI: 10.1158/0008-5472.CAN-16-0530