Embed Size (px)
Citation preview
©FUNPEC-RP www.funpecrp.com.brGenetics and Molecular Research 13 (4): 9828-9845 (2014)
Phenotyping of Passiflora edulis, P. setacea, and their hybrids by a multivariate approach
E.A. Santos1, A.P. Viana1, J.C.O. Freitas1, M.M. Souza2, C.L. Paiva, D.L. Rodrigues1 and R.F. Tavares1
1Laboratório de Melhoramento Genético Vegetal, Centro de Ciências e Tecnologias Agropecuárias, Universidade Estadual do Norte Fluminense Darcy Ribeiro, Campos dos Goytacazes, RJ, Brasil2Departamento de Ciências Biológicas, Universidade Estadual de Santa Cruz, Ilhéus, BA, Brasil
Corresponding author: E.A. SantosE-mail: [email protected]
Genet. Mol. Res. 13 (4): 9828-9845 (2014)Received January 21, 2014Accepted May 11, 2014Published November 27, 2014DOI http://dx.doi.org/10.4238/2014.November.27.10
ABSTRACT. Morphological characterization is the most accessible and used method to quantify the genetic diversity of the available germplasm. The multivariate statistical method is highly important for this purpose. This study aimed to characterize parents and hybrids of Passiflora according to morphoagronomic descriptors and estimate the genetic divergence between them based on the joint analysis of qualitative and quantitative variables using the Ward-modified location model (MLM) procedure. One hundred and thirty-eight individuals were assessed (10 P. edulis, 10 P. setacea, and 118 interspecific hybrids) using 23 quantitative and 12 qualitative descriptors. The values for the quantitative descriptors were measured and subjected to multivariate statistics using the Ward-MLM strategy. Large genetic variability was detected by the morphoagronomic data in the 138 genotypes that were evaluated, and the hybrids presented higher variability than the parents. Pseudo-F and pseudo-t2 criteria showed that the optimal number of groups was three.
9829
©FUNPEC-RP www.funpecrp.com.brGenetics and Molecular Research 13 (4): 9828-9845 (2014)
Phenotyping in Passiflora L.
Group I was composed of 118 hybrid genotypes; group II was composed of the 10 P. setacea genotypes, and group III was composed of the 10 P. edulis genotypes. The longest distance was found between groups II and III (474.96). The shortest distance was detected between groups I and II (198.78), which indicates that the segregating population is genetically closer to P. setacea than to P. edulis. The Ward-MLM procedure is a useful tool to detect genetic diversity and group accessions using both qualitative and quantitative variables.
Key words: Ward-modified location model (MLM) method; Interspecific hybrid; Joint analysis; Morphoagronomic characterization; Genetic divergence
INTRODUCTION
Passion fruit (Passiflora edulis Sims) is a tropical fruit whose cultivation has rapidly evolved in Brazil over the last 30 years (Bernacci et al., 2008; Meletti, 2011). Brazil is the largest passion fruit producer, producing 923.035 ton/ha (IBGE, 2011). Despite its economic relevance, passion fruit production is still limited by diseases in orchards, which lead to losses in fruit quality and production. Passion fruit woodiness virus is caused by Cowpea aphid-borne mosaic virus (CABMV) and is one of the diseases that affects passion fruit crops. It has impaired production in all regions where this fruit is cultivated (Nascimento et al., 2006).
Because of the low genetic variability among the sour passion fruit cultivars that are available for developing resistance to fruit woodiness virus, selected crosses between the culti-vated species and resistant wild relatives are used in some strategies that were adopted to con-trol the disease. Among the wild species that were indicated as potential sources of resistance to diseases affecting passion fruit, Passiflora setacea DC deserves special attention because it is resistant to CABMV (Junqueira et al., 2006; Bellon et al., 2009). The characterization of a segregating population by means of morphoagronomic descriptors is particularly important for breeders because of the wide variability that is available in the population that remains little known or exploited. Furthermore, it also allows the identification of superior genotypes for advanced generations in the breeding program (Primot et al., 2005).
The use of multivariate statistics is very significant, especially when a large number of descriptors are used to quantify the dissimilarity between individuals. Multivariate procedures unify information from a set of traits and provide robust studies related to genetic divergence, which is relevant to understand the genetic variability of populations (Gonçalves et al., 2008).
There are several available methods to estimate genetic diversity. However, caution is necessary in the selection of a method because it may considerably affect the estimates (Moham-madi and Prasanna, 2003). Determining the method to estimate similarity (and its complement, dissimilarity) depends on the objectives proposed in the research, the characteristics of the vari-ables, and the inherent properties of the distances and coefficients. In general, statistical classifi-cation methods only consider continuous or discrete data separately (Padilla et al., 2007). How-ever, new methodologies allow the simultaneous analysis of quantitative and qualitative data.
The Ward-modified location model (MLM) procedure, which was proposed by Franco et al. (1998), is a multivariate method that is an excellent strategy for quantifying variability using quantitative and qualitative variables simultaneously. This strategy involves two stages:
9830
©FUNPEC-RP www.funpecrp.com.brGenetics and Molecular Research 13 (4): 9828-9845 (2014)
E.A. Santos et al.
in the first stage, the groups are defined by the Ward clustering method (Ward Junior, 1963) using the Gower dissimilarity matrix (Gower, 1971); in the second stage, the mean quantita-tive variable vector for each subpopulation is estimated by the MLM procedure, regardless of the values of the qualitative variable. This method has been widely employed in the past five years, especially in studies on genetic diversity aiming to support plant-breeding programs. These procedures have been used by Gonçalves et al. (2009) in Solanum lycopersicum; Barbé et al. (2010) in Phaseolus vulgaris; and Sudré et al. (2010) in Capsicum spp. There are also reports of using this procedure to study banana (Pestana et al., 2011; Pereira et al., 2012) and guava (Campos et al., 2013).
Therefore, this study aimed to characterize parents and hybrids of Passiflora based on morphoagronomic descriptors and to estimate the genetic divergence between them based on the joint analysis of qualitative and quantitative variables using the Ward-MLM procedure.
MATERIAL AND METHODS
Germplasm
We evaluated 138 individuals from the passion fruit breeding program of the Univer-sidade Estadual do Norte Fluminense Darcy Ribeiro (UENF) that included 10 genotypes of P. edulis, 10 genotypes of P. setacea, and 118 interspecific hybrids that were obtained from crosses between these species. The genotypes of P. setacea were from the Active Germplasm Bank (BAG-Passifloras) of the Universidade Estadual de Santa Cruz (UESC), Ilheus, Ba-hia; the genotypes of passion fruit were obtained from the recurrent selection program of the UENF. Hybridizations were performed using P. edulis as the female and male parents to obtain the S0 progenies (Table 1).
Parents/Crosses Progenies Genotypes
Pe 139 (40) x Ps 367 UENFH-1 1, 2, 3, 4, 7, 8, 9, 10, 11, 12, 14, 16, 19, 20, 22Pe 139 (38) x Ps 367 UENFH-2 2, 3, 4, 7, 10, 11, 12, 13, 14, 15, 16, 17, 18, 20, 23Pe 139 (29) x Ps 367 UENFH-3 2, 4, 6, 7, 8, 9, 10, 11, 13Pe 89 (11) x Ps (365) UENFH-4 2, 3, 5, 9, 13, 17, 21Ps 367 x Pe 139 (40) UENFH-5 1, 2, 3, 4, 5, 7, 8, 9, 10, 12, 13, 14, 15, 16, 17, 18, 19, 20, 21, 22, 23Ps 367 x Pe 139 (36) UENFH-6 6, 27Ps 367 x Pe 89 (11) UENFH-7 1, 2, 3, 4, 5, 6, 7, 8, 9, 10, 11, 12, 13, 14Ps 365 x Pe 139 (36) UENFH-8 3, 8, 13, 16, 28, 45, 47, 48, 55, 58, 61, 62, 63, 68, 74Ps 365 x Pe 89 (7) UENFH-9 1, 3, 5, 9, 11, 12, 16, 21, 29, 36, 37, 38, 40, 47, 52, 53, 54, 55, 56, 57
Table 1. Genotypes of Passiflora edulis (Pe) and P. setacea (Ps) used in interspecific crosses to obtain the full-sib progenies of Passiflora spp.
Interspecific hybridizations
The interspecific hybridizations were held at the UESC campus in a greenhouse from July 14 to August 8, 2010. The temperature inside the house ranged from 28° to 22°C, and the relative humidity was between 60 and 98%. The artificial crosses were carried out at differ-ent times, from 1:30 to 2:30 pm for the genotypes of P. edulis and from 7:00 to 7:30 pm for the genotypes of P. setacea. Flower buds of the parents were protected with paper bags in the morning. The anthers of the donor species were collected, placed on Petri dishes containing
9831
©FUNPEC-RP www.funpecrp.com.brGenetics and Molecular Research 13 (4): 9828-9845 (2014)
Phenotyping in Passiflora L.
silica gel, and stored in the refrigerator (10°C) until the occurrence of the anthesis of the flow-ers (anthesis at 12:30 pm in plants of P. edulis and from 6:00 to 7:00 pm in plants of P. seta-cea). During pollination, the anthers of the donor species were carefully rubbed on the stigma of the recipient species with the aid of tweezers. After artificial hybridization, the crosses were identified, and the flowers were protected again for up to 24 h. The fruits that resulted from successful hybridizations were protected using nylon net until their full maturity.
Cultivation conditions
Individuals of different genotypes were planted in November 2011 in the experimen-tal area of the Escola Agrícola Antônio Sarlo, northern State of Rio de Janeiro at the latitude of 21° 45' S and longitude of 41° 20' W and 11 m above sea level. The vertical cordon system was used with stakes that were 2.5 m in height and spaced at 4 m with a number 12 wire that was 1.80 m above the ground. The distance between the crop rows was 3.5 m. The cultural practices recommended for the cultivation of passion fruit were followed (Viana et al., 2003).
The first fruiting occurred in March 2012. The periods of harvesting and evaluation of fruits occurred from March to July 2012. The vegetative and floral morphological characteris-tics were assessed throughout 2012.
Genotypes were characterized according to the list of descriptors for the registration and protection of passion fruit cultivars that was prepared by the National Service for Cultivar Protection of the Ministry of Agriculture, Livestock and Supply. Thirty-five descriptors were used; 12 were qualitative (Table 2) and 23 were quantitative.
Descriptor Classes observed according to the descriptors for Passiflora spp (Ministério da Agricultura Pecuária e Abastecimento - MAPA)
Color of the branch 1: light green; 2: dark greenShape of the leaf 7: brokenDivision of the leaf blade 3: trilobateLeaf blade: sinus 1: absent; 2: presentDepth of the sinus 3: shallow; 5: average; 7: deepLeaf blade: pilosity 1: absent; 2: presentPosition of leaf gland 1: adjacent to the leaf blade; 2: close to the middle of the petiole; 3: adjacent to the insertion of the leaf in the branchPrevailing corona color 1: white; 3: red; 4: purplish-red; 5: purple; 7: dark blue; 8: lilacTime of anthesis 2: evening; 3: nightPulp color 2: greenish-yellow; 3: yellow; 4: orange-yellow; 5: orange; 8: light yellow Prevailing skin color 1: green; 2: yellow; 4: pinkish; 7: greenish-yellow; 8: yellowish-greenFruit shape 1: oval
Table 2. Qualitative descriptors observed in 10 genotypes of Passiflora edulis, 10 genotypes of P. setacea, and 118 interspecific hybrids.
Quantitative descriptors
The following quantitative descriptors and defined measurements were used: stem di-ameter in mm (SD), at the height of the first node of the main axis; leaf length in mm (LL), the longitudinal extent of the highest edge; leaf width in mm (LW), the transverse measurement of the largest dimension; petiole length in mm (PL), from the insertion of the stem until the inser-tion of the leaf; flower diameter in mm (FD), from the extreme points of the flower; corona
9832
©FUNPEC-RP www.funpecrp.com.brGenetics and Molecular Research 13 (4): 9828-9845 (2014)
E.A. Santos et al.
diameter in mm (CD), from the extreme points of the corona filaments; length of outer series of corona filaments in mm (LC), from the insertion in the flower receptacle up to the apex; petal length in mm (LP), from the insertion of the flower in the apex; sepal length in mm (SL), from the insertion in the flower to the apex; petal width in mm (PW), the largest dimension; sepal width in mm (SW), the largest dimension; floral peduncle length in mm (FP), from the insertion in the receptacle of the flower to the insertion in the stem; androgynophore length in mm (AL), the fullest extent that sustains the sexual organs; bract length in mm (BL), from the insertion in the peduncle to the apex; number of fruits (NF) assessed in weekly harvests (for 4 months), and the total number of fruits per plant is counted at the end of the evaluation period; average fruit weight in g (FW), obtained with a digital semianalytical scale for all mature fruits that were collected during the study period; fruit longitudinal diameter in mm (LD), deter-mined in the longitudinal region of the fruits with the aid of a digital caliper; fruit transverse diameter in mm (TD), determined in the equatorial region of the fruits using a digital caliper; shell thickness in mm (ST), determined by the arithmetic mean of the measures of four points of the outer shell in the middle portion of the fruits (transversely cut, toward the largest diam-eter) using a digital caliper; pulp weight in g (WP), obtained by weighing the pulp (seeds with arils) with the aid of the semianalytical balance; content of total soluble solids (SST), obtained by refractometry using an ATAGO N1 portable digital refractometer with readings ranging from 0 to 32°Brix; number of seeds (NS), manual counting (average of 10 fruits); and seed size in mm (SS), the ratio between the length and width of a sample of 10 seeds of 10 fruits.
Statistical analysis
The quantitative and qualitative variables were analyzed simultaneously using the Ward-MLM procedure to form groups of genotypes using the CLUSTER procedure and IML (Interactive Matrix Language) of the SAS software system (SAS Institute, 2000). The dis-tance matrix was obtained by the Gower algorithm (Gower, 1971) to use Ward’s clustering method. The optimal number of groups was defined according to the pseudo-F and pseudo-t2 criteria combined with the likelihood profile associated with the likelihood ratio test (SAS Institute, 2000).
The Gower dissimilarity index was used because the set of variables under study formed a mixed group. The Gower index uses qualitative and quantitative data to generate a single dissimilarity index ranging from 0 to 1. The dissimilarity was given by the following:
∑
∑
=
== p
Kijk
ijk
p
kijk
W
SWSij
1
1.
(Equation 1)
where i and j refer to the individuals to be compared with regard to trait k, p is the total number of traits, and Sij is the contribution of the variable k to the total distance. If a variable is qualita-tive, Sijk takes the value 1 when the concordance is positive or negative for the trait k between individuals i and j. On the other hand, when the variable is quantitative,
9833
©FUNPEC-RP www.funpecrp.com.brGenetics and Molecular Research 13 (4): 9828-9845 (2014)
Phenotyping in Passiflora L.
where Rk is the range of variation of the variable k, with values between 0 and 1. The value of Wijk was used to define the contributions of Sijk individuals. Thus, when the value of the vari-able k is absent in one or both individuals, Wijk is 0; otherwise, it is equal to 1.
RESULTS AND DISCUSSION
Ward-MLM method
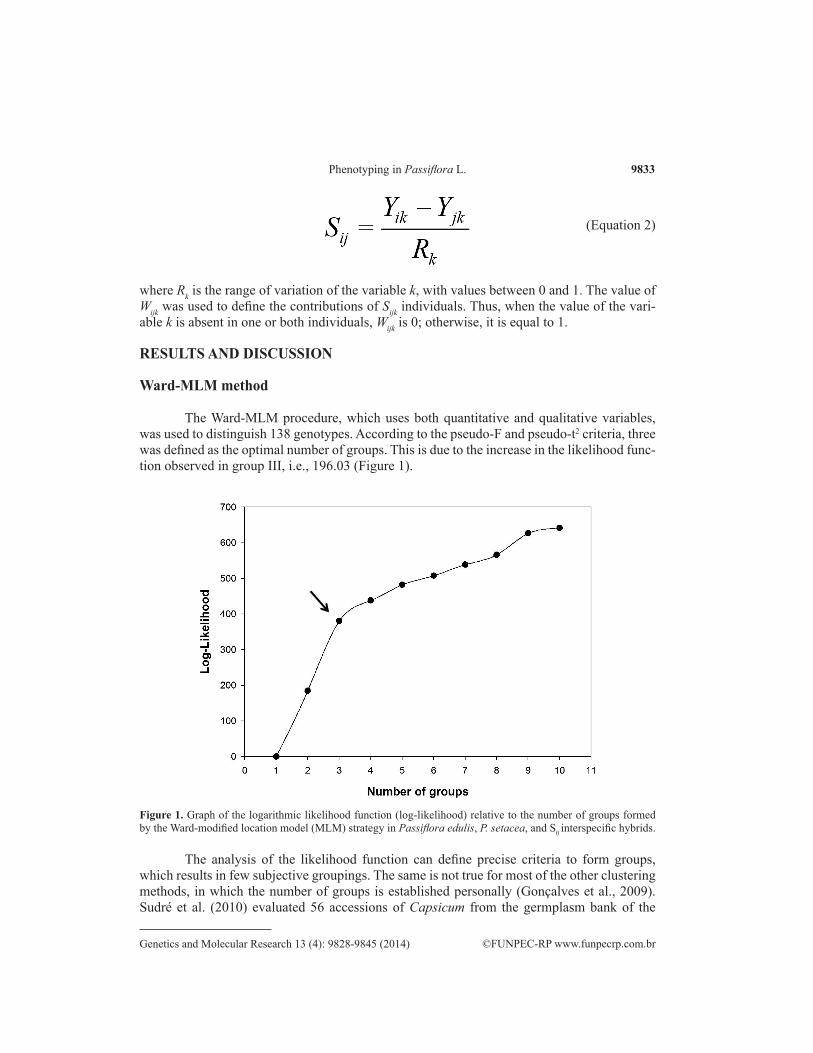
The Ward-MLM procedure, which uses both quantitative and qualitative variables, was used to distinguish 138 genotypes. According to the pseudo-F and pseudo-t2 criteria, three was defined as the optimal number of groups. This is due to the increase in the likelihood func-tion observed in group III, i.e., 196.03 (Figure 1).
Figure 1. Graph of the logarithmic likelihood function (log-likelihood) relative to the number of groups formed by the Ward-modified location model (MLM) strategy in Passiflora edulis, P. setacea, and S0 interspecific hybrids.
The analysis of the likelihood function can define precise criteria to form groups, which results in few subjective groupings. The same is not true for most of the other clustering methods, in which the number of groups is established personally (Gonçalves et al., 2009). Sudré et al. (2010) evaluated 56 accessions of Capsicum from the germplasm bank of the
(Equation 2)
9834
©FUNPEC-RP www.funpecrp.com.brGenetics and Molecular Research 13 (4): 9828-9845 (2014)
E.A. Santos et al.
UENF and set five as the optimal number of groups because the maximum value was reached at this point. Pestana et al. (2011) analyzed 74 banana mutants and observed greater increases in the probability function in group III, which agrees with the findings of this study. In turn, Campos et al. (2013) evaluated a population of 138 Psidium guajava individuals from the UENF breeding program and found that the greatest increase in the probability function was achieved when five groups were considered. The number of groups may vary according to the species, number of accessions, and number and type of descriptors (Gonçalves et al., 2009).
The Ward-MLM classification strategy for the analysis of the morphoagronomic data allowed the separation of 138 genotypes into three homogeneous groups that were formed according to their similarities. Group I was composed of 118 hybrid genotypes, group II was composed of 10 P. setacea genotypes, and group III was composed of 10 P. edulis genotypes. The clear separation between the groups indicates that the morphoagronomic traits efficiently discriminated the parents and their hybrids. Santos et al. (2012) evaluated the morphological diversity in Passiflora sublanceolata (e.g., Passiflora palmeri var. sublanceolata), Passiflora foetida, and their hybrids, and the observed clear separation between these species and the segregating population.
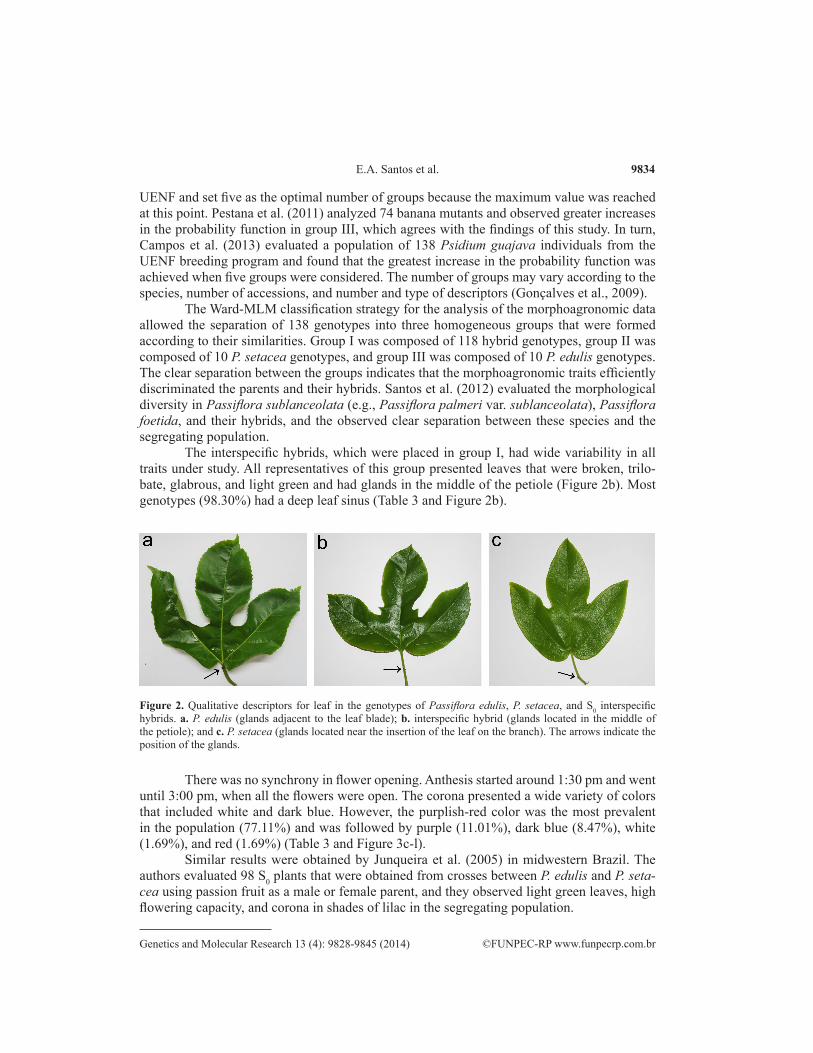
The interspecific hybrids, which were placed in group I, had wide variability in all traits under study. All representatives of this group presented leaves that were broken, trilo-bate, glabrous, and light green and had glands in the middle of the petiole (Figure 2b). Most genotypes (98.30%) had a deep leaf sinus (Table 3 and Figure 2b).
Figure 2. Qualitative descriptors for leaf in the genotypes of Passiflora edulis, P. setacea, and S0 interspecific hybrids. a. P. edulis (glands adjacent to the leaf blade); b. interspecific hybrid (glands located in the middle of the petiole); and c. P. setacea (glands located near the insertion of the leaf on the branch). The arrows indicate the position of the glands.
There was no synchrony in flower opening. Anthesis started around 1:30 pm and went until 3:00 pm, when all the flowers were open. The corona presented a wide variety of colors that included white and dark blue. However, the purplish-red color was the most prevalent in the population (77.11%) and was followed by purple (11.01%), dark blue (8.47%), white (1.69%), and red (1.69%) (Table 3 and Figure 3c-l).
Similar results were obtained by Junqueira et al. (2005) in midwestern Brazil. The authors evaluated 98 S0 plants that were obtained from crosses between P. edulis and P. seta-cea using passion fruit as a male or female parent, and they observed light green leaves, high flowering capacity, and corona in shades of lilac in the segregating population.
9835
©FUNPEC-RP www.funpecrp.com.brGenetics and Molecular Research 13 (4): 9828-9845 (2014)
Phenotyping in Passiflora L.
Descriptors Groups
GI (118) GII (10) GIII (10)
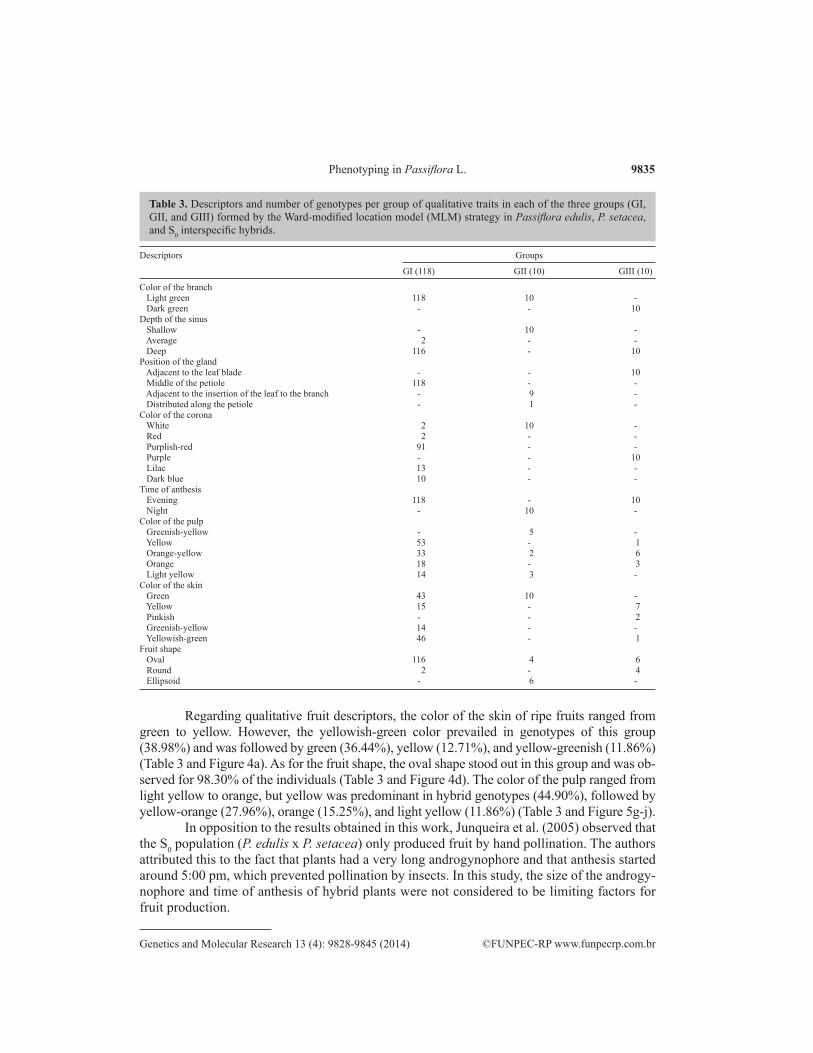
Color of the branch Light green 118 10 - Dark green - - 10Depth of the sinus Shallow - 10 - Average 2 - - Deep 116 - 10Position of the gland Adjacent to the leaf blade - - 10 Middle of the petiole 118 - - Adjacent to the insertion of the leaf to the branch - 9 - Distributed along the petiole - 1 -Color of the corona White 2 10 - Red 2 - - Purplish-red 91 - - Purple - - 10 Lilac 13 - - Dark blue 10 - -Time of anthesis Evening 118 - 10 Night - 10 -Color of the pulp Greenish-yellow - 5 - Yellow 53 - 1 Orange-yellow 33 2 6 Orange 18 - 3 Light yellow 14 3 -Color of the skin Green 43 10 - Yellow 15 - 7 Pinkish - - 2 Greenish-yellow 14 - - Yellowish-green 46 - 1Fruit shape Oval 116 4 6 Round 2 - 4 Ellipsoid - 6 -
Table 3. Descriptors and number of genotypes per group of qualitative traits in each of the three groups (GI, GII, and GIII) formed by the Ward-modified location model (MLM) strategy in Passiflora edulis, P. setacea, and S0 interspecific hybrids.
Regarding qualitative fruit descriptors, the color of the skin of ripe fruits ranged from green to yellow. However, the yellowish-green color prevailed in genotypes of this group (38.98%) and was followed by green (36.44%), yellow (12.71%), and yellow-greenish (11.86%) (Table 3 and Figure 4a). As for the fruit shape, the oval shape stood out in this group and was ob-served for 98.30% of the individuals (Table 3 and Figure 4d). The color of the pulp ranged from light yellow to orange, but yellow was predominant in hybrid genotypes (44.90%), followed by yellow-orange (27.96%), orange (15.25%), and light yellow (11.86%) (Table 3 and Figure 5g-j).
In opposition to the results obtained in this work, Junqueira et al. (2005) observed that the S0 population (P. edulis x P. setacea) only produced fruit by hand pollination. The authors attributed this to the fact that plants had a very long androgynophore and that anthesis started around 5:00 pm, which prevented pollination by insects. In this study, the size of the androgy-nophore and time of anthesis of hybrid plants were not considered to be limiting factors for fruit production.
9836
©FUNPEC-RP www.funpecrp.com.brGenetics and Molecular Research 13 (4): 9828-9845 (2014)
E.A. Santos et al.
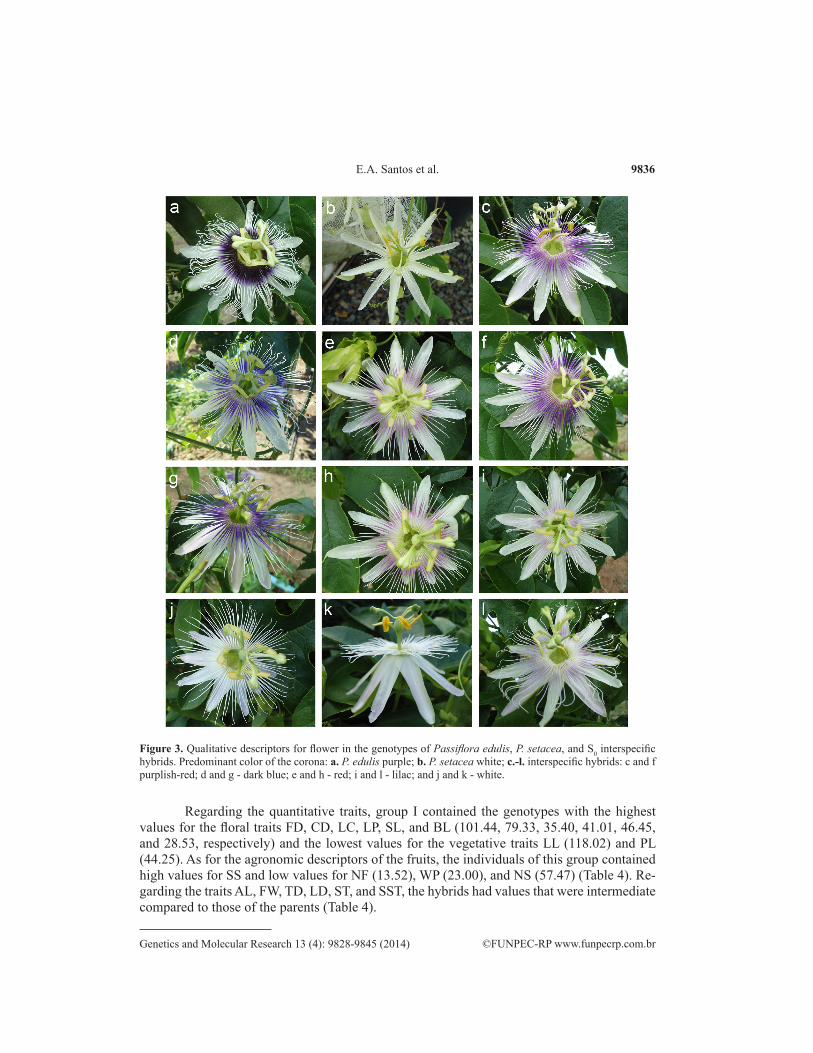
Figure 3. Qualitative descriptors for flower in the genotypes of Passiflora edulis, P. setacea, and S0 interspecific hybrids. Predominant color of the corona: a. P. edulis purple; b. P. setacea white; c.-l. interspecific hybrids: c and f purplish-red; d and g - dark blue; e and h - red; i and l - lilac; and j and k - white.
Regarding the quantitative traits, group I contained the genotypes with the highest values for the floral traits FD, CD, LC, LP, SL, and BL (101.44, 79.33, 35.40, 41.01, 46.45, and 28.53, respectively) and the lowest values for the vegetative traits LL (118.02) and PL (44.25). As for the agronomic descriptors of the fruits, the individuals of this group contained high values for SS and low values for NF (13.52), WP (23.00), and NS (57.47) (Table 4). Re-garding the traits AL, FW, TD, LD, ST, and SST, the hybrids had values that were intermediate compared to those of the parents (Table 4).
9837
©FUNPEC-RP www.funpecrp.com.brGenetics and Molecular Research 13 (4): 9828-9845 (2014)
Phenotyping in Passiflora L.
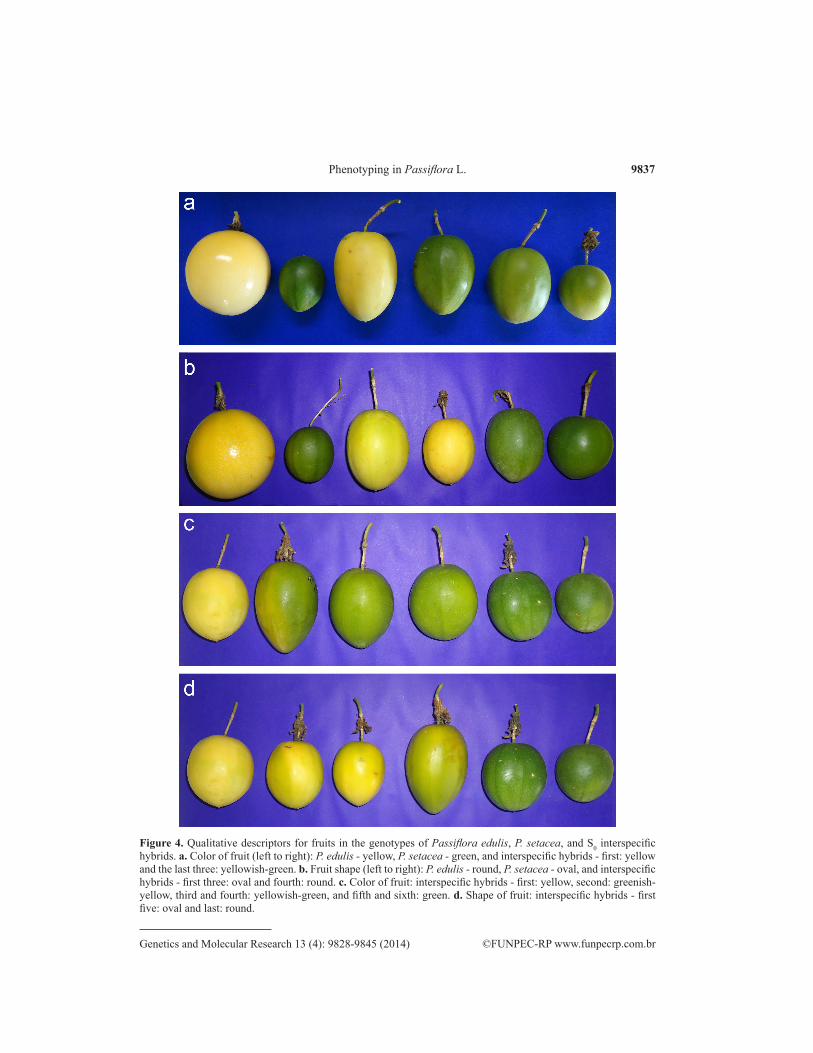
Figure 4. Qualitative descriptors for fruits in the genotypes of Passiflora edulis, P. setacea, and S0 interspecific hybrids. a. Color of fruit (left to right): P. edulis - yellow, P. setacea - green, and interspecific hybrids - first: yellow and the last three: yellowish-green. b. Fruit shape (left to right): P. edulis - round, P. setacea - oval, and interspecific hybrids - first three: oval and fourth: round. c. Color of fruit: interspecific hybrids - first: yellow, second: greenish-yellow, third and fourth: yellowish-green, and fifth and sixth: green. d. Shape of fruit: interspecific hybrids - first five: oval and last: round.
9838
©FUNPEC-RP www.funpecrp.com.brGenetics and Molecular Research 13 (4): 9828-9845 (2014)
E.A. Santos et al.
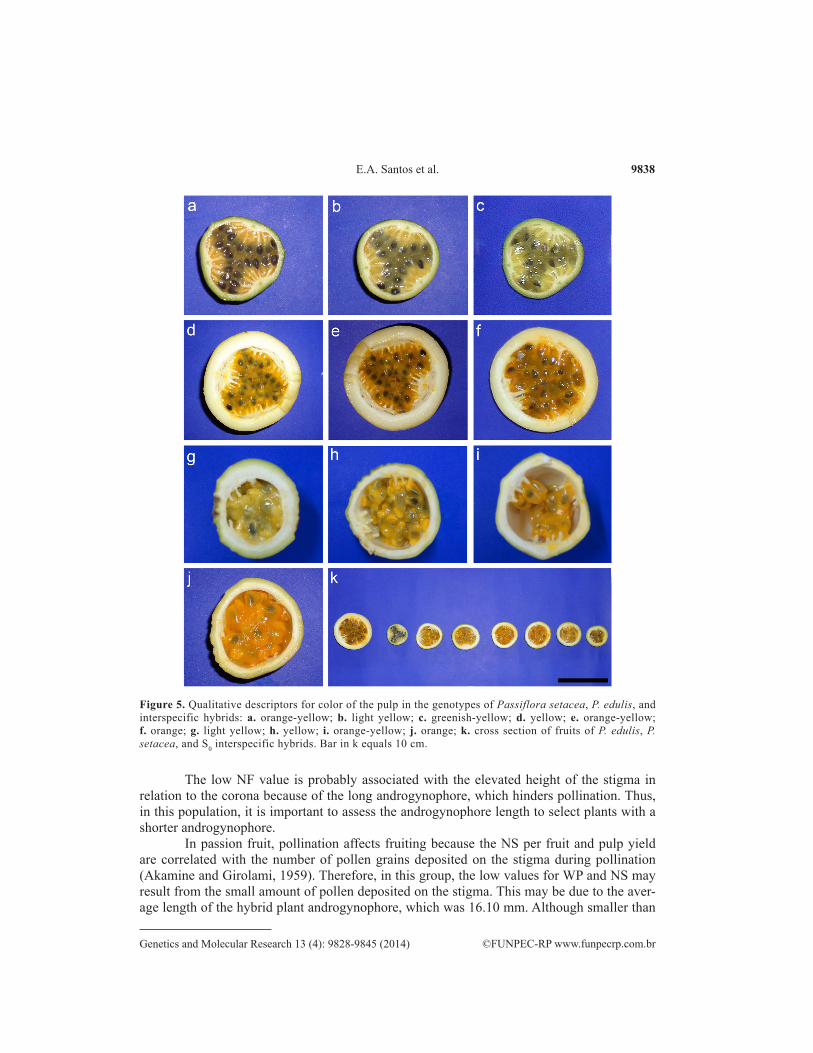
The low NF value is probably associated with the elevated height of the stigma in relation to the corona because of the long androgynophore, which hinders pollination. Thus, in this population, it is important to assess the androgynophore length to select plants with a shorter androgynophore.
In passion fruit, pollination affects fruiting because the NS per fruit and pulp yield are correlated with the number of pollen grains deposited on the stigma during pollination (Akamine and Girolami, 1959). Therefore, in this group, the low values for WP and NS may result from the small amount of pollen deposited on the stigma. This may be due to the aver-age length of the hybrid plant androgynophore, which was 16.10 mm. Although smaller than
Figure 5. Qualitative descriptors for color of the pulp in the genotypes of Passiflora setacea, P. edulis, and interspecific hybrids: a. orange-yellow; b. light yellow; c. greenish-yellow; d. yellow; e. orange-yellow; f. orange; g. light yellow; h. yellow; i. orange-yellow; j. orange; k. cross section of fruits of P. edulis, P. setacea, and S0 interspecific hybrids. Bar in k equals 10 cm.
9839
©FUNPEC-RP www.funpecrp.com.brGenetics and Molecular Research 13 (4): 9828-9845 (2014)
Phenotyping in Passiflora L.
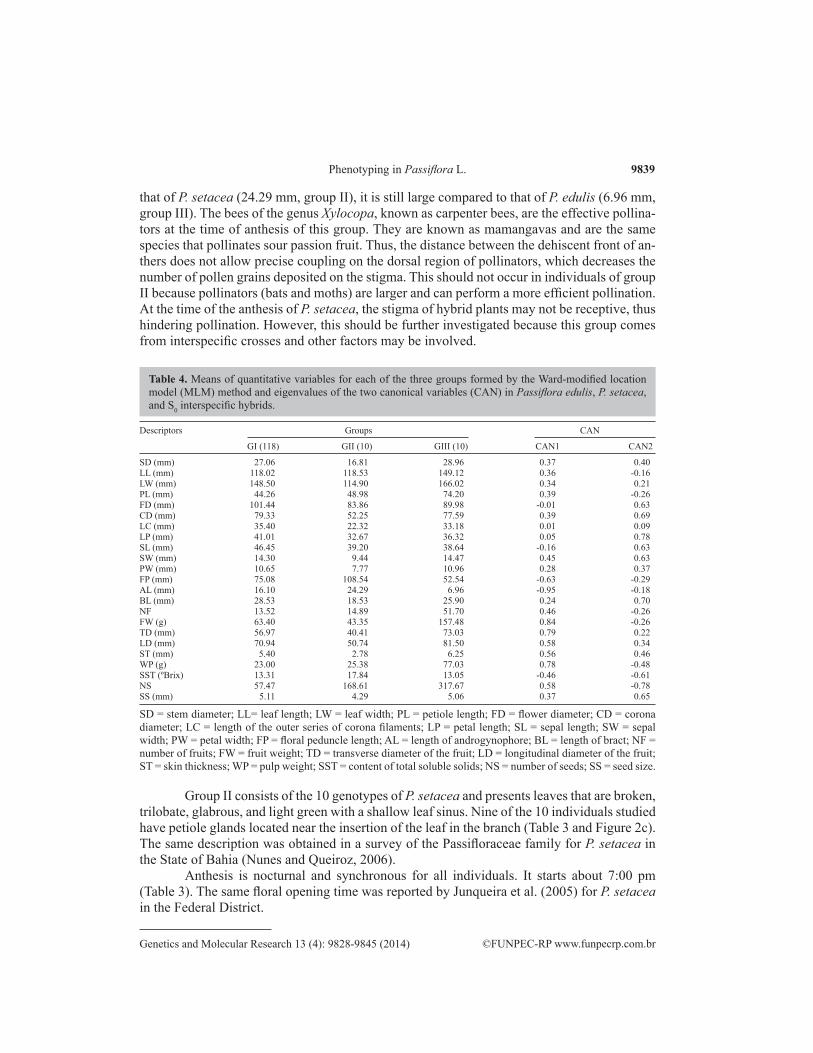
that of P. setacea (24.29 mm, group II), it is still large compared to that of P. edulis (6.96 mm, group III). The bees of the genus Xylocopa, known as carpenter bees, are the effective pollina-tors at the time of anthesis of this group. They are known as mamangavas and are the same species that pollinates sour passion fruit. Thus, the distance between the dehiscent front of an-thers does not allow precise coupling on the dorsal region of pollinators, which decreases the number of pollen grains deposited on the stigma. This should not occur in individuals of group II because pollinators (bats and moths) are larger and can perform a more efficient pollination. At the time of the anthesis of P. setacea, the stigma of hybrid plants may not be receptive, thus hindering pollination. However, this should be further investigated because this group comes from interspecific crosses and other factors may be involved.
Descriptors Groups CAN
GI (118) GII (10) GIII (10) CAN1 CAN2
SD (mm) 27.06 16.81 28.96 0.37 0.40LL (mm) 118.02 118.53 149.12 0.36 -0.16LW (mm) 148.50 114.90 166.02 0.34 0.21PL (mm) 44.26 48.98 74.20 0.39 -0.26FD (mm) 101.44 83.86 89.98 -0.01 0.63CD (mm) 79.33 52.25 77.59 0.39 0.69LC (mm) 35.40 22.32 33.18 0.01 0.09LP (mm) 41.01 32.67 36.32 0.05 0.78SL (mm) 46.45 39.20 38.64 -0.16 0.63SW (mm) 14.30 9.44 14.47 0.45 0.63PW (mm) 10.65 7.77 10.96 0.28 0.37FP (mm) 75.08 108.54 52.54 -0.63 -0.29AL (mm) 16.10 24.29 6.96 -0.95 -0.18BL (mm) 28.53 18.53 25.90 0.24 0.70NF 13.52 14.89 51.70 0.46 -0.26FW (g) 63.40 43.35 157.48 0.84 -0.26TD (mm) 56.97 40.41 73.03 0.79 0.22LD (mm) 70.94 50.74 81.50 0.58 0.34ST (mm) 5.40 2.78 6.25 0.56 0.46WP (g) 23.00 25.38 77.03 0.78 -0.48SST (ºBrix) 13.31 17.84 13.05 -0.46 -0.61NS 57.47 168.61 317.67 0.58 -0.78SS (mm) 5.11 4.29 5.06 0.37 0.65
SD = stem diameter; LL= leaf length; LW = leaf width; PL = petiole length; FD = flower diameter; CD = corona diameter; LC = length of the outer series of corona filaments; LP = petal length; SL = sepal length; SW = sepal width; PW = petal width; FP = floral peduncle length; AL = length of androgynophore; BL = length of bract; NF = number of fruits; FW = fruit weight; TD = transverse diameter of the fruit; LD = longitudinal diameter of the fruit; ST = skin thickness; WP = pulp weight; SST = content of total soluble solids; NS = number of seeds; SS = seed size.
Table 4. Means of quantitative variables for each of the three groups formed by the Ward-modified location model (MLM) method and eigenvalues of the two canonical variables (CAN) in Passiflora edulis, P. setacea, and S0 interspecific hybrids.
Group II consists of the 10 genotypes of P. setacea and presents leaves that are broken, trilobate, glabrous, and light green with a shallow leaf sinus. Nine of the 10 individuals studied have petiole glands located near the insertion of the leaf in the branch (Table 3 and Figure 2c). The same description was obtained in a survey of the Passifloraceae family for P. setacea in the State of Bahia (Nunes and Queiroz, 2006).
Anthesis is nocturnal and synchronous for all individuals. It starts about 7:00 pm (Table 3). The same floral opening time was reported by Junqueira et al. (2005) for P. setacea in the Federal District.
9840
©FUNPEC-RP www.funpecrp.com.brGenetics and Molecular Research 13 (4): 9828-9845 (2014)
E.A. Santos et al.
The color of the corona in this group was predominantly white (Table 3 and Figure 3b), which differs from the description of white corona filaments with blue bands that was mentioned by Nunes and Queiroz (2006). The green ripe fruit skin was prevalent in this group (Figure 4a). Concerning fruit shape, 60% of the genotypes have an ellipsoid shape (Table 3 and Figure 4b). The shape and color of fruits were similar to those described by Nunes and Queiroz (2006) for P. setacea. With regard to pulp color, three categories have been reported, but the predominant color in this group was greenish yellow (50%), followed by light yellow (30%) and orange-yellow (20%) (Table 3 and Figure 5a-c).
With respect to the quantitative descriptors, this group presented the lowest values for SD (16.81), LW (114.90), and the following traits related to flowers: FD, CD, LC, LP, SW, PW, and BL (83.86, 52.25, 22.32, 32.67, 9.44, 7.77, and 18.53, respectively). The highest values were obtained for FP and AL, which were 108.74 and 24.29, respectively. Regarding the quantitative floral morphological descriptors, the values described by Nunes and Queiroz (2006) for FP (60-120 mm), BL (10-20), FD (50-100), LC (20-25), and AL (25-35) are similar to those obtained in this study (Table 4). Smaller and lighter fruits, as well as thinner skin and smaller seed size were found in group II than in other groups, with low values for FW, TD, LD, ST, and SS (43.35, 40.41, 50.74, 2.78, and 4.29, respectively). On the other hand, the highest mean SST (17.84) was obtained in this group (Table 4).
The sleep passion fruit is an excellent source of genetic resistance to plant pathogens that affect passion fruit crops. Thus, it is widely used in sour passion fruit breeding programs to transfer resistance genes to the commercial species (Cerqueira-Silva et al., 2009). The pro-duction of sleep passion fruit is restricted to areas where the species occur and are sold in a small domestic scale. In the municipalities of Curaçá, Uauá, and Canudos in the State of Ba-hia, this fruit is used for both fresh consumption and the production of jams and jellies that are manufactured in processing industries (Cerqueira-Silva et al., 2012). Thus, studies that seek to characterize wild species morphoagronomically are fundamental in the pre-breeding stage because they generate potentially useful information about the organoleptic properties of fruits and contribute to the dissemination and use of new species for consumption.
In this study, the average values for FW, TD, and LD were similar to those obtained for genotypes of P. setacea that were investigated in southwestern Bahia (Cerqueira-Silva et al., 2009). As for the average skin thickness, which is intended to be reduced, the value that was obtained in this study was lower than that found by Cardoso-Silva et al. (2007) and was similar to that reported by Cerqueira-Silva et al. (2009). Higher levels of SST, above 13 °Brix, are desirable for the juice industry (Fortaleza et al., 2005). The average SST reported in this study was similar to that found for sleep passion fruit genotypes that were assessed in southwestern Bahia (Cerqueira-Silva et al., 2009). A thin shell and high soluble solid content are traits that can be included in the passion fruit breeding program to improve fruit quality.
Group III was formed by the 10 cultivars of P. edulis. All individuals in this group have leaves that are broken, trilobate, glabrous, and dark green and present a deep leaf sinus and petiole glands adjacent to the leaf blade (Table 3 and Figure 2a); similar observations of P. edulis were reported by Cervi and Linsingen (2008). Purple was the predominant corona color in all individuals (Table 3 and Figure 3a), which was also noted by Crochemore et al. (2003) and Nunes and Queiroz (2006), who assessed passion fruit trees from the States of Paraná and Bahia, respectively. The flowers of this group showed no synchrony with floral opening, but flowers started a period of anthesis about 12:00 pm. The beginning of the anthesis period coincides with that found for the sour passion fruit in northern Rio de Janeiro State (Benevi-
9841
©FUNPEC-RP www.funpecrp.com.brGenetics and Molecular Research 13 (4): 9828-9845 (2014)
Phenotyping in Passiflora L.
des et al., 2009) and in Juazeiro, BA (Siqueira et al., 2009). Souza et al. (2012) studied the reproductive phenology of sour passion fruit from September 2009 to September 2010 under the conditions of the municipality of Campos dos Goytacazes, and they found that flowering occurred from October to March, when the highest average temperatures were observed, with a peak in January and highest percentage of ripe fruit in February.
Regarding the qualitative descriptors of the fruits, yellow was the prevailing skin color (70%), followed by pink (20%) and yellowish-green (10%) (Table 3 and Figure 4a). Cervi and Linsingen (2008) reported wide variation in the fruit skin color of P. edulis: yel-low, greenish-yellow, red, and purple. The oval fruit shape prevailed in this group and was observed for 60% of individuals (Table 3 and Figure 4b); this observation agrees with the findings of Cervi and Linsingen (2008). Oval passion fruits have always been preferably selected because they are more marketable and have higher yield for juice than other fruit shapes. Meletti et al. (2000) recommend the selection of plants with ovate fruits because they have high juice content. However, Negreiros et al. (2007) found that pulp yield was not correlated with fruit shape.
The pulp color ranged from yellow to orange, but orange-yellow (60%) predominated in the genotypes (Table 3 and Figure 5d-f). Variations in the color of the skin and fruit pulp were also observed by Crochemore et al. (2003) for P. edulis. The color of passion fruit skin was used to distinguish the yellow and purple passion fruits. Today, this distinction is not ac-cepted because the external color of the fruit is a trait of complex inheritance, which allows a wide variety of intermediate colors (Bernacci et al., 2008).
Regarding quantitative descriptors, this group presented the highest values for the vegetative traits SD, LL, LW, and PL (28.96, 149.12, 166.02, and 74.20, respectively) and for the flower traits SW and PW (14.47 and 10.96, respectively) (Table 4). The lowest values for floral traits were 52.54 and 6.96 for FP and AL, respectively (Table 4). In this study, the values obtained for the vegetative and floral traits were higher than those reported by Cervi and Linsingen (2008).
The length of the androgynophore is an important trait and should be considered in morphoagronomic assessments of sour passion fruit because it is directly linked to pollination, which, in turn, is related to production. This is the first study that investigated this trait in sour passion fruit. Short androgynophores reduce the height of the stigmas in relation to the corona, thus favoring pollination. At the time of maximum curvature of the stylet, stigmas even touch the corona, and thus, can be easily pollinated by smaller bees (Siqueira et al., 2009).
Group III obtained the highest values for NF, FW, TD, LD, ST, WP, and NS (51.70, 157.48, 73.03, 81.50, 6.25, 77.03, and 317.67, respectively). However, the lowest value for SST (13.05) was obtained in this group (Table 4).
Since the 1980s, the genetic breeding of sour passion fruit has led to increased means of agronomic traits, productivity, and fruit quality in each niche market. Heavy, larger, sweeter, and less acidic sour passion fruits are desirable for fresh consumption, while the industry prefers fruits with higher juice yield and high content of soluble solids (Meletti, 2011). The contents of soluble solids indicate the amount of solids dissolved in the pulp; in general, high SST contents are desirable for industrial purposes because they require less sugar (Farias et al., 2005). In this study, we found higher values for FW, LD, and SST than those obtained by Silva et al. (2012) while evaluating 144 full-sib progenies derived from the second cycle of recurrent selection. Abreu et al. (2009) found values that were lower than those obtained in this study for FW, WP, SST, and NS for the cultivar Gigante Amarelo.
9842
©FUNPEC-RP www.funpecrp.com.brGenetics and Molecular Research 13 (4): 9828-9845 (2014)
E.A. Santos et al.
When searching for sour passion fruits with improved qualities, thin skin is a desir-able trait. Breeding programs seek to select genotypes with reduced skin thickness, which may indicate a greater amount of pulp for the populations studied. Negreiros et al. (2008) report that both the juice industry and the fresh fruit market regard skin thickness as a relevant factor in fruit ranking because it is inversely proportional to juice yield. The hybrid EC-L-7 (Sul Brasil x Marília), which was rated by Abreu et al. (2009), showed an average skin thickness of 7.0 mm and a WP value of 37.75 g. In this study, group III obtained an average skin thickness of 6.6 mm and a WP value of 77.03 g, which indicates that selection over time was effective for these traits.
Akamine and Girolami (1959) found a positive correlation between the NS per fruit and juice content; thus, a larger NS tends to provide higher yields of juice. The average NS per fruit obtained in this study was similar to that found by Santos et al. (2009), who assessed 20 half-sib progenies of sour passion fruit.
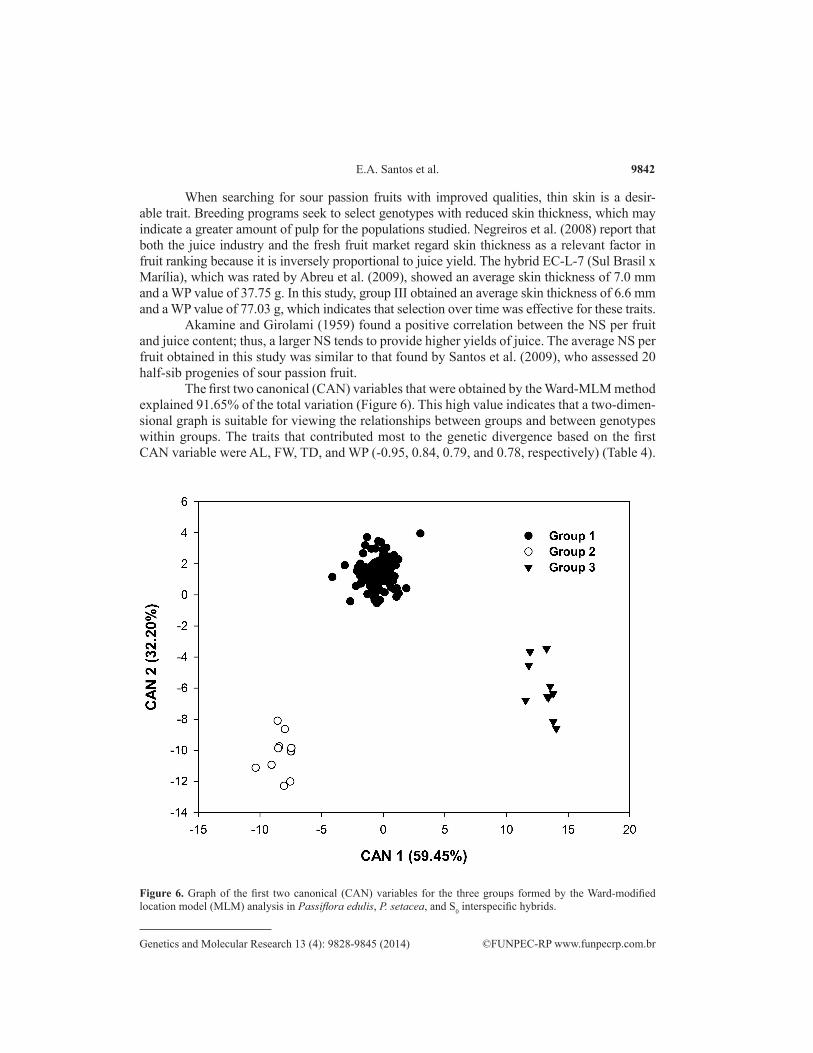
The first two canonical (CAN) variables that were obtained by the Ward-MLM method explained 91.65% of the total variation (Figure 6). This high value indicates that a two-dimen-sional graph is suitable for viewing the relationships between groups and between genotypes within groups. The traits that contributed most to the genetic divergence based on the first CAN variable were AL, FW, TD, and WP (-0.95, 0.84, 0.79, and 0.78, respectively) (Table 4).
Figure 6. Graph of the first two canonical (CAN) variables for the three groups formed by the Ward-modified location model (MLM) analysis in Passiflora edulis, P. setacea, and S0 interspecific hybrids.
9843
©FUNPEC-RP www.funpecrp.com.brGenetics and Molecular Research 13 (4): 9828-9845 (2014)
Phenotyping in Passiflora L.
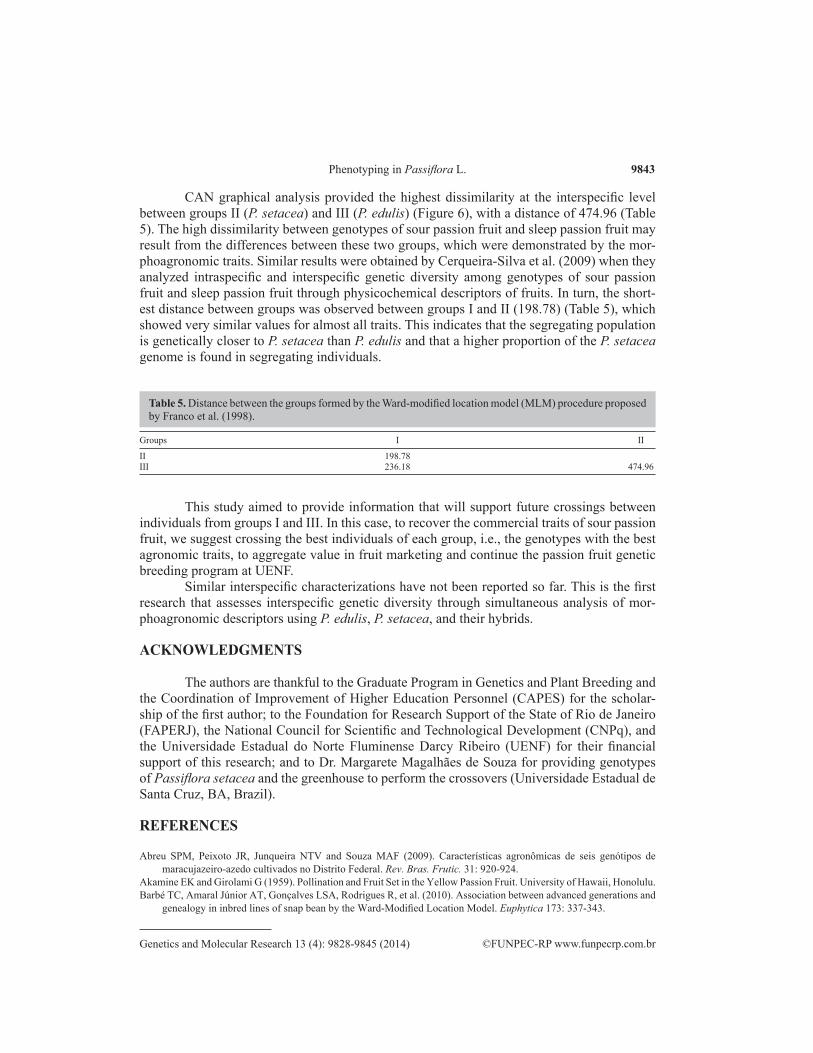
CAN graphical analysis provided the highest dissimilarity at the interspecific level between groups II (P. setacea) and III (P. edulis) (Figure 6), with a distance of 474.96 (Table 5). The high dissimilarity between genotypes of sour passion fruit and sleep passion fruit may result from the differences between these two groups, which were demonstrated by the mor-phoagronomic traits. Similar results were obtained by Cerqueira-Silva et al. (2009) when they analyzed intraspecific and interspecific genetic diversity among genotypes of sour passion fruit and sleep passion fruit through physicochemical descriptors of fruits. In turn, the short-est distance between groups was observed between groups I and II (198.78) (Table 5), which showed very similar values for almost all traits. This indicates that the segregating population is genetically closer to P. setacea than P. edulis and that a higher proportion of the P. setacea genome is found in segregating individuals.
Groups I II
II 198.78 III 236.18 474.96
Table 5. Distance between the groups formed by the Ward-modified location model (MLM) procedure proposed by Franco et al. (1998).
This study aimed to provide information that will support future crossings between individuals from groups I and III. In this case, to recover the commercial traits of sour passion fruit, we suggest crossing the best individuals of each group, i.e., the genotypes with the best agronomic traits, to aggregate value in fruit marketing and continue the passion fruit genetic breeding program at UENF.
Similar interspecific characterizations have not been reported so far. This is the first research that assesses interspecific genetic diversity through simultaneous analysis of mor-phoagronomic descriptors using P. edulis, P. setacea, and their hybrids.
ACKNOWLEDGMENTS
The authors are thankful to the Graduate Program in Genetics and Plant Breeding and the Coordination of Improvement of Higher Education Personnel (CAPES) for the scholar-ship of the first author; to the Foundation for Research Support of the State of Rio de Janeiro (FAPERJ), the National Council for Scientific and Technological Development (CNPq), and the Universidade Estadual do Norte Fluminense Darcy Ribeiro (UENF) for their financial support of this research; and to Dr. Margarete Magalhães de Souza for providing genotypes of Passiflora setacea and the greenhouse to perform the crossovers (Universidade Estadual de Santa Cruz, BA, Brazil).
REFERENCES
Abreu SPM, Peixoto JR, Junqueira NTV and Souza MAF (2009). Características agronômicas de seis genótipos de maracujazeiro-azedo cultivados no Distrito Federal. Rev. Bras. Frutic. 31: 920-924.
Akamine EK and Girolami G (1959). Pollination and Fruit Set in the Yellow Passion Fruit. University of Hawaii, Honolulu.Barbé TC, Amaral Júnior AT, Gonçalves LSA, Rodrigues R, et al. (2010). Association between advanced generations and
genealogy in inbred lines of snap bean by the Ward-Modified Location Model. Euphytica 173: 337-343.
9844
©FUNPEC-RP www.funpecrp.com.brGenetics and Molecular Research 13 (4): 9828-9845 (2014)
E.A. Santos et al.
Bellon G, Faleiro FG, Peixoto JR, Junqueira KP, et al. (2009). Variabilidade genética de acessos obtidos de populações cultivadas e silvestres de maracujazeiro-doce com base em marcadores RAPD. Rev. Bras. Frutic. 31: 197-202.
Benevides CR, Gaglianone MC and Hoffmann M (2009). Visitantes florais do maracujá-amarelo (Passiflora edulis f. flavicarpa Deg. Passifloraceae) em áreas de cultivo com diferentes proximidades a fragmentos florestais na região Norte Fluminense, RJ. Rev. Bras. Entomol. 53: 415-421.
Bernacci LC, Soares-Scott MD, Junqueira NTV, Passos IRS, et al. (2008). Passiflora edulis Sims: the correct taxonomic way to cite the yellow passion fruit (and of others colors). Rev. Bras. Frutic. 30: 566-576.
Campos BM, Viana AP, Quintal SSR, Gonçalves LSA, et al. (2013). Quantificação da divergência genética entre acessos de goibeira por meio da estratégia Ward-MLM. Rev. Bras. Frutic. 35: 571-578.
Cardoso-Silva CB, Melo JRF, Pereira AS, Cerqueira-Silva CBM, et al. (2007). Estudo da diversidade genética mediante caracterização físico-química de frutos de maracujazeiros-do-sono nativos da Bahia. Magistra 19: 352-358.
Cerqueira-Silva CBM, Cardoso-Silva CB, Nonato JVA, Corrêa RX, et al. (2009). Genetic dissimilarity of ‘yellow’ and ‘sleep’ passion fruit accessions based on the fruits physical-chemical characteristics. Crop Breed. Appl. Biotechnol. 9: 210-218.
Cerqueira-Silva CB, Santos ES, Conceição LD, Cardoso-Silva CB, et al. (2012). Genetic variation in a wild population of the ‘sleep’ passion fruit (Passiflora setacea) based on molecular markers. Genet. Mol. Res. 11: 731-738.
Cervi AC and Linsingen LV (2008). Sinopse taxonômica das Passifloraceae Juss. no complexo de cerrado (savana) no estado do Paraná - Brasil. Iheringia Ser. Bot. 63: 145-157.
Crochemore ML, Molinari HBC and Vieira LGE (2003). Genetic diversity in passion fruit (Passiflora spp.) evaluated by RAPD markers. Braz. Arch. Biol. Technol. 46: 521-527.
Farias MAA, Faria GA, Cunha MAP, Peixoto CP, et al. (2005). Caracterização física e química de frutos de maracujá-amarelo de ciclos de seleção massal estratificada e de populações regionais. Magistra 17: 83-87.
Fortaleza JM, Peixoto JR, Junqueira NTV, Oliveira AT, et al. (2005). Características físicas e químicas em nove genótipos de maracujá-azedo cultivado sob três níveis de adubação potássica. Rev. Bras. Frutic. 27: 124-127.
Franco J, Crossa J, Villaseñor J, Taba S, et al. (1998). Classifying genetic resources by categorical and continuous variables. Crop Sci. 38: 1688-1696.
Gonçalves LS, Rodrigues R, Amaral AT Jr, Karasawa M, et al. (2008). Comparison of multivariate statistical algorithms to cluster tomato heirloom accessions. Genet. Mol. Res. 7: 1289-1297.
Gonçalves LS, Rodrigues R, do Amaral Junior AT, Karasawa M, et al. (2009). Heirloom tomato gene bank: assessing genetic divergence based on morphological, agronomic and molecular data using a Ward-modified location model. Genet. Mol. Res. 8: 364-374.
Gower JC (1971). A general coefficient of similarity and some of its properties. Biometrics 27: 857-871.IBGE (2011). Banco de Dados Agregados: Produção Agrícola Municipal. Instituto Brasileiro de Geografia e Estatística,
Rio de Janeiro. Available at [http://www.sidra.ibge.gov.br./bda/tabela/protabl.asp?c=1613&z=p&o=23&i=P.]. Accessed January 23, 2013.
Junqueira NTV, Braga MF, Faleiro FG, Peixoto JR, et al. (2005). Potencial de Espécies Silvestres de Maracujazeiro como Fonte de Resistência a Doenças. In: Maracujá: Germoplasma e Melhoramento Genético (Braga MF, Faleiro FG, Peixoto JR and Bernacci LC, eds.). Embrapa Cerrados, Planaltina, 81-108.
Junqueira NTV, Lage DAC, Braga MF, Peixoto JR, et al. (2006). Reação a doenças e produtividade de um clone de maracujazeiro-azedo propagado por estaquia e enxertia em estacas herbáceas de Passiflora silvestre. Rev. Bras. Frutic. 28: 97-100.
Meletti LMM (2011). Avanços na cultura do maracujá no Brasil. Rev. Bras. Frutic. 33: 83-91.Meletti LMM, Santos RR and Minami K (2000). Melhoramento do maracujazeiro-amarelo: obtenção do ‘Composto IAC-
27’. Sci. Agríc. 57: 491-498.Mohammadi SA and Prasanna BM (2003). Analysis of genetic diversity in crop plants - salient statistical tools and
considerations. Crop Sci. 43: 1235-1248.Nascimento AVS, Santana EN, Braz ASK, Alfenas PF, et al. (2006). Cowpea aphid-borne mosaic virus (CABMV) is
widespread in passionfruit in Brazil and causes passionfruit woodiness disease. Arch. Virol. 151: 1797-1809.Negreiros JRS, Álvares VS, Bruckner CH, Morgado MAD, et al. (2007). Relação entre características físicas e o
rendimento de polpa de maracujá-amarelo. Rev. Bras. Frutic. 29: 540-545.Negreiros JRS, Araújo-Neto SE, Álvares VS, Lima VA, et al. (2008). Caracterização de frutos de progênies de meios-
irmãos de maracujazeiro-amarelo em Rio Branco - Acre. Rev. Bras. Frutic. 30: 431-437.
Nunes TS and Queiroz LP (2006). Flora da Bahia: Passifloraceae. Sitientibus Ser. Cienc. Biol. 6: 194-226.Padilla G, Cartea ME and Ordás A (2007). Comparison of several clustering methods in grouping kale landraces. J. Am.
Soc. Hortic. Sci. 132: 387-395.Pereira VM, Borges CV, Brandão LP, Oliveira LS, et al. (2012). Genetic diversity between improved banana diploids
9845
©FUNPEC-RP www.funpecrp.com.brGenetics and Molecular Research 13 (4): 9828-9845 (2014)
Phenotyping in Passiflora L.
using canonical variables and the Ward-MLM method. Pesq. Agropec. Bras. 47: 1480-1488.Pestana RK, Amorim EP, Ferreira CF, Amorim VB, et al. (2011). Genetic dissimilarity of putative gamma-ray-induced
’Preciosa-AAAB-Pome type’ banana (Musa sp) mutants based on multivariate statistical analysis. Genet. Mol. Res. 10: 3976-3986.
Primot S, d’Eeckenbrugge GC, Rioux V, Pérez JAO, et al. (2005). Variación morfológica de tres especies de curubas (Passiflora tripartita var. mollissima, P. tarminiana y P. mixta) y sus híbridos en el Valle del Cauca (Colombia). Rev. Bras. Frutic. 22: 467-471.
SAS Institute (2000). Statistical Analysis System: User’s Guide. SAS, Cary.Santos CEM, Bruckner CH, Cruz CD, Siqueira DL, et al. (2009). Características físicas do maracujá-azedo em função do
genótipo e massa do fruto. Rev. Bras. Frutic. 31: 1102-1110.Santos EA, Souza MM, Abreu PP, Conceição LDHCS, et al. (2012). Confirmation and characterization of interspecific
hybrids of Passiflora L. (Passifloraceae) for ornamental use. Euphytica 184: 389-399.Silva MGM, Viana AP, Amaral Júnior AT, Gonçalves LSA, et al. (2012). Biometria aplicada ao melhoramento
intrapopulacional do maracujazeiro-amarelo. Rev. Cienc. Agron. 43: 493-499.Siqueira KMM, Kiill LHP, Martins CF, Lemos IB, et al. (2009). Ecologia da polinização do maracujá-amarelo, na região
do Vale do Submédio São Francisco. Rev. Bras. Frutic. 31: 1-12.Souza SAM, Martins KC, Azevedo AS and Pereira TNS (2012). Fenologia reprodutiva do maracujazeiro-azedo no
município de Campos dos Goytacazes, RJ. Cienc. Rural 42: 1774-1780.Sudré CP, Gonçalves LSA, Rodrigues R, Amaral Júnior AT, et al. (2010). Genetic variability in domesticated Capsicum
spp. as assessed by morphological and agronomic data in mixed statistical analysis. Genet. Mol. Res. 9: 283-294.Viana AP, Pereira TNS, Pereira MG, Souza MM, et al. (2003). Simple and canonic correlation between agronomical and
fruit quality traits in yellow passion fruit (Passiflora edulis f. flavicarp) populations. Crop Breed. Appl. Biotechnol. 3: 133-140.
Ward Junior JH (1963). Hierarchical grouping to optimize an objective function. J. Am. Stat. Assoc. 58: 236-244.