Embed Size (px)
Citation preview
Phenotypic evolution in high-elevation populations ofwestern fence lizards (Sceloporus occidentalis) in theSierra Nevada Mountains
ADAM D. LEACHÉ1*, DER-SHING HELMER2 and CRAIG MORITZ2
1Genome Center and Department of Evolution & Ecology, University of California, Davis, CA 95616,USA2Museum of Vertebrate Zoology and Department of Integrative Biology, 3101 Valley Life Sciences Build-ing, University of California, Berkeley, CA 94720-3160, USA
Received 17 December 2009; revised 11 February 2010; accepted for publication 11 February 2010bij_1462 630..641
Adaptive divergence in response to variable habitats, climates, and altitude is often accentuated along elevationgradients. We investigate phenotypic evolution in body size and coloration in the western fence lizard (Sceloporusoccidentalis Baird & Girard, 1852) across elevation gradients in Yosemite National Park, California, situated in theSierra Nevada mountains of Western North America. High-elevation populations occurring above 2100 m a.s.l. arerecognized as a separate subspecies (Sceloporus occidentalis taylori Camp, 1916), with a distinctive phenotypecharacterized by a large body size and extensive blue ventral pigmentation. We sampled S. occidentalis from acrosselevation gradients in Yosemite National Park, California, and collected phenotypic data (body size and ventralcoloration measurements; 410 specimens) and mitochondrial DNA sequence data (complete NADH1 gene; 969 bp,181 specimens) to infer phylogenetic relationships, and examine the genetic and phenotypic diversity amongpopulations. Populations of S. occidentalis in Yosemite National Park follow Bergmann’s rule and exhibit largerbody sizes in colder, high-elevation environments. The high-elevation subspecies S. o. taylori is not monophyletic,and the mitochondrial DNA genealogy supports a model of convergent phenotypic evolution among high-elevationpopulations belonging to different river drainages. The hypothesis that separate populations of S. occidentalisexpanded up river drainages after the recession of glaciers is supported by population demographic analyses, andsuggest that Bergmann’s clines can evolve rapidly along elevation gradients. The distinctive high-elevationphenotype that is attributable to S. o. taylori has evolved independently several times, and includes adaptivephenotypic changes associated with increases in body size and ventral coloration. © 2010 The Linnean Society ofLondon, Biological Journal of the Linnean Society, 2010, 100, 630–641.
ADDITIONAL KEYWORDS: Bayesian analysis – Bergmann’s rule – body size – coloration – mitochondrialDNA – phylogeography – population expansion – Yosemite National Park.
INTRODUCTION
Elevation gradients offer great potential for adaptivedivergence in response to changing habitats, climates,and altitude. The Sierra Nevada mountain range inWestern North America extends 650 km across Cali-fornia, and reaches 4421 m in elevation (Storer,Usinger & Lukas, 2004). Sharp ecological and cli-matic transitions separate five major biotic zones,which include the foothill woodland (300–900 m),
lower montane forest (900–2100 m a.s.l.), uppermontane forest (2100–2750 m a.s.l.), subalpineforest (2750–2900 m a.s.l.), and alpine zone (over2900 m a.s.l.). Numerous studies have documentedexamples of phylogenetic diversification in the SierraNevadas (Calsbeek, Thompson & Richardson, 2003;Patterson & Givnish, 2004; Rissler et al., 2006).Yosemite National Park, situated on the westernslope of the Sierra Nevada and containing all fivemajor biotic zones, is among the largest (3081 km2)and least fragmented habitat blocks remaining in theSierra Nevada, and is well-situated for studies ofadaptive divergence along elevation gradients.*Corresponding author. E-mail: [email protected]
Biological Journal of the Linnean Society, 2010, 100, 630–641. With 4 figures
© 2010 The Linnean Society of London, Biological Journal of the Linnean Society, 2010, 100, 630–641630
Between 1914 and 1915, the Museum of VertebrateZoology (MVZ) at the University of California, Berke-ley, undertook a natural history survey of theYosemite region of the Sierra Nevada, and docu-mented a new high-elevation subspecies of thewestern fence lizard (Sceloporus occidentalis Baird &Girard, 1852) inhabiting boulder and talus slopesover 2100 m a.s.l. in the upper Merced and TuolumneRiver drainages (Camp, 1916). The ventral colorationof the Sierra fence lizard (Sceloporus occidentalistaylori Camp, 1916) diagnoses it from all other S.occidentalis: specifically, adult males have extensivelight-blue ventral coloration that is continuousbetween the chest, belly, limbs, throat, chin, and lips(Camp, 1916). In addition, high-elevation populationsare larger in size compared with those occurring atlower or intermediate elevations, with adult malesreaching 94 mm in snout–vent length (Smith et al.,1992). Although the populations of S. occidentalis athigh elevations in the Yosemite area have distinctivephenotypes, the variation in body size and colorationcould represent gradual clinal variation along anelevation gradient rather than a sharp discontinuityin phenotype.
As part of the MVZ Grinnell Resurvey Project(Moritz et al., 2008), we returned to Yosemite NationalPark between 2003 and 2005 and collected S. occiden-talis from the same localities visited by the originalMVZ expedition, in addition to new localities, to inferphylogenetic relationships, and describe genetic andphenotypic diversity, among populations distributedacross elevation gradients. Evaluating genetic diver-sity along elevation gradients is critical in Yosemitegiven the recent and dramatic glacial history that hasaffected the region. The most recent episode of glacia-tion, the Tioga, peaked only 15 000–20 000 years ago,with the formation of an extensive ice field thatcovered the upper Tuolumne and Merced river basins,and extended down the western and southern slopes tothe Yosemite and Hetch Hetchy Valley floors (Huber,1987). Based on this geologic scenario, we predict thatpopulations of S. occidentalis expanded up the Mercedand Tuolumne river drainages following the thawingand receding of the glaciers. If this model of populationdivergence is supported, then it raises the possibilitythat the distinctive phenotype of S. o. taylori may haveevolved recently and independently in separate riverdrainages.
MATERIAL AND METHODSBODY SIZE AND VENTRAL COLORATION
We recorded phenotypic data from 410 specimens ofS. occidentalis (177 females and 233 males; Appen-dix 1). For each specimen, we recorded sex and snout–
vent length (SVL), and latitude, longitude, andelevation using a handheld GPS (Garmin GPS 72;geodetic datum = WGS84). We validated the elevationreadings using Google Earth v.4.0.2413 (Google, Inc.).All voucher specimens and tissue samples are depos-ited in the MVZ (accession nos. 13817, 13957, and14091).
To quantify ventral pigmentation, we obtaineddigital images of specimens (at 100 ppi) by laying themon a flatbed scanner and then uploading the imagesinto Adobe Photoshop CS2. The total body area of eachlizard, defined as the underside of the head, throat,abdomen, and vent, was selected using the lasso tool,which was measured through the ‘extended histogram’reading. From the selected body outline of each indi-vidual, areas of blue, dark blue, and black were furtherselected for using the lasso tool. For areas of mixedblack and white pigmentation, only half of the areawas counted. All areas of white were ignored. Pig-mented areas on the arms, legs, and tail were likewisenot measured. We calculated the percentage of colora-tion on the ventral surface by dividing the total area ofpigmentation by the total body area, and used thisvalue in subsequent statistical tests.
After sorting the samples by sex, we then dividedthe samples into four groups corresponding to riverdrainage (Merced versus Tuolumne) and two eleva-tion categories (high versus low), with a cut-off of2100 m a.s.l. reflecting the minimum elevation limitof S. o. taylori (Camp, 1916). We excluded juvenilespecimens measuring < 50 mm from our estimates ofmean SVL. We tested for significant differences inbody size and ventral coloration between groups usingANOVA (both one- and two-way) in Aabel 3.0.3(Gigawiz). As the ventral coloration percentages arenon-parametric, we also conducted a Kruskall–WallisH-test, which has less explicit data requirements. Tofurther ensure that the statistical tests were notnegatively influenced by the inclusion of juvenile/sub-adult specimens, only the upper 50% quantile of bodysize and ventral coloration data for each group wereincluded in the ANOVA tests.
MOLECULAR DATA
We collected mitochondrial DNA sequence data fromthe NADH-1 (ND1) protein-coding gene for 181 S.occidentalis representing 56 localities in YosemiteNational Park (Appendix 2). Individuals collectedwithin a radius of 250 m of a single locality werepooled to condense some of the spatial extent of ourpopulation-level sampling (Chapman & Wieczorek,2006). To amplify and sequence the ND1 gene, weused the primers described in Leaché & Cole (2007)and a new internal primer (5′-GAACCAATCCGCCCATCATCCTC-3′). Our molecular methods follow
DIVERGENCE ALONG ELEVATION GRADIENTS 631
© 2010 The Linnean Society of London, Biological Journal of the Linnean Society, 2010, 100, 630–641
Leaché & Cole (2007), with the exception that wecollected DNA sequences with an ABI 48-capillary3730 DNA analyzer. All sequences are deposited inGenBank (accession nos. GU723963–GU724143).
Contiguous sequences of DNA were aligned andedited using Sequencher v.4.2. The protein codingsequences lacked any length variation. We down-loaded from GenBank three additional samples of S.occidentalis and four closely related species withinthe Sceloporus undulatus species group to placeS. o. taylori within a broader phylogenetic context.These samples include S. occidentalis (AlpineCounty, California: AF440021), S. occidentalis (SanDiego County, California: AF440023), S. occidentalis(Jackson County, Oregon: AF440022), Sceloporuscautus (AF440020), S. undulatus (AF440083), Sce-loporus virgatus (AF440085), Sceloporus woodi(AF440087), and Sceloporus graciosus (AF440090).We rooted our phylogenetic trees with S. graciosus,which is the most distantly related species in thestudy (Leaché, 2010).
GENE TREE RECONSTRUCTION
We inferred the phylogenetic relationships of allunique haplotypes using a partitioned Bayesiananalysis with MrBayes v3.1.2 (Ronquist & Huelsen-beck, 2003). We separated the data into three parti-tions corresponding to codon positions, and tested thispartitioning strategy against a model with just asingle substitution model for the entire gene usingBayes factors (see Brandley et al. 2005). We used theAkaike information criterion in MrModeltest v2.2(Nylander, 2004) to determine the best-fit nucleotidesubstitution model for each data partition. We ranfour separate Bayesian analyses (each using a differ-ent starting seed) with default heating values for 10million generations (sampling every 1000 genera-tions). We assessed convergence by inspecting thecumulative posterior probabilities of clades using theprogram AWTY (Nylander et al. 2008). After discard-ing burn-in samples from the separate analyses (thefirst 1000 samples), we combined the remainingsamples from the four separate analyses to produce a50% majority rule consensus tree. We also con-structed haplotype networks under the statistical par-simony model, with a 95% connection significance,using TCS v1.21 (Clement, Posada & Crandall, 2000).
GENETIC DIVERSITY AND POPULATION EXPANSION
We calculated genetic diversity measures for high-and low-elevation populations of S. occidentalis in theMerced and Tuolumne river basins using Arlequinv.3.1 (Excoffier, Laval & Schneider, 2005). The geneticdiversity measures include the number of polymor-
phic sites (s), nucleotide diversity (p; the probabilitythat two randomly chosen homologous sites are dif-ferent), and mean number of pairwise differences (k).Hierarchical analyses of molecular variance (AMOVA;Excoffier, Smouse & Quattro, 1992) were used todetermine how genetic diversity is partitioned acrosselevation (high versus low, with a 2100 m a.s.l. cut-off), between river drainages (Merced versus Tuol-umne), and between mitochondrial DNA (mtDNA)clades. AMOVA analyses were conducted using Arle-quin v.3.1 (Excoffier et al., 2005). We also conductedFu’s test of neutrality by calculating Fs, which is alsosensitive to population expansions (Fu, 1997). Largenegative values of Fs indicate population expansion,but only in the absence of selection. The significanceof the Fs statistic is calculated by generating arandom sample under the hypothesis of populationstability and selective neutrality (Excoffier et al.,2005). Following the simulation results of Fu (1997),we consider Fs values significant at the 5% level iftheir P value is below 0.02 (Fu, 1997).
To test the population expansion hypothesisfurther, we estimated population size (calculated asNe, where e is effective population size) through timeusing Bayesian skyline plots (Drummond et al., 2005).An advantage of using Bayesian skyline plots forexamining population demographics is that they donot require a specified demographic model (e.g. con-stant size, exponential growth, logistic growth, orexpansive growth). We used BEAST v.1.5.3 (Drum-mond & Rambaut, 2007) to conduct Bayesian skylineanalyses for the Merced and Tuolumne populations.We applied 10 grouped coalescent intervals and ranthe analyses for 10 million generations (sampling atintervals of 1000), with the first 10% discarded asburn-in. In order to explore the timing of populationexpansion, we assumed a fixed 2% substitution rateper million years. Bayesian skyline reconstructionsfor each population were visualized using Tracerv1.4.1 (Rambaut & Drummond, 2007).
RESULTSBODY SIZE AND VENTRAL COLORATION
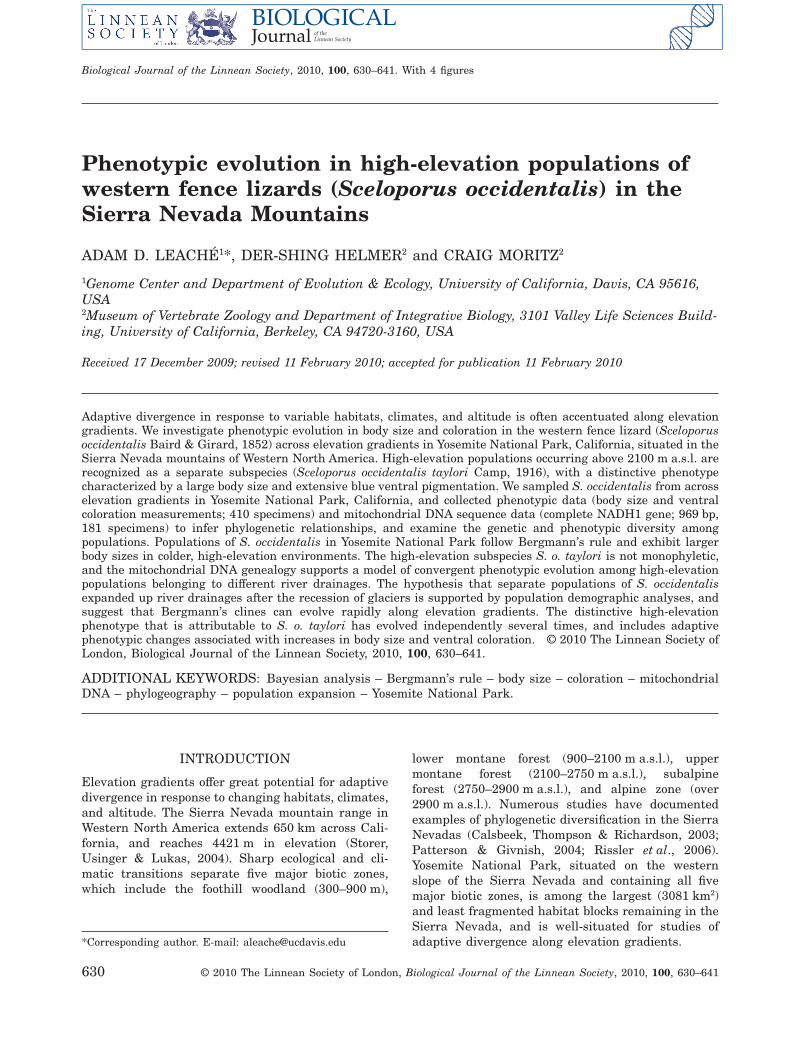
Sceloporus occidentalis males and females are largerand have more ventral pigmentation at higher eleva-tions in Yosemite National Park (Fig. 1; Table 1; ). Formales, the mean SVL at low elevations (below2100 m a.s.l.) are 73.4 and 70.0 mm for samples fromthe Merced and Tuolumne rivers, respectively(Table 1). At high elevation, these average body sizemeasurements increase to 82.0 (Merced) and 76.3 mm(Tuolumne). A similar pattern is observed for femalelizards, although the overall body sizes are lower(Table 1). The maximum size recorded for any
632 A. D. LEACHÉ ET AL.
© 2010 The Linnean Society of London, Biological Journal of the Linnean Society, 2010, 100, 630–641
specimen was for a male collected from the MercedDrainage measuring 99 mm SVL, whereas the largestspecimen collected from low elevations measures only90 mm SVL, and was also collected along the Merced(Table 1). The extent of blue ventral coloration inmales, measured as the proportion of the ventralsurface containing blue or black pigmentation,increases in high-elevation populations from a meanof 57.9 to 70.0% for Merced samples, and from 54.9to 69.8% for Tuolumne samples (Fig. 1; Table 1).Females show a similar increase in the extent of
ventral pigmentation, but the overall proportions arelower (Table 1).
The results of the ANOVA indicate that the differ-ences in body size and coloration observed betweenlow- and high-elevation populations of S. occidentalisare significant for males and females in the Mercedand Tuolumne drainages (P < 0.001; Table 2). The dif-ferences in body size and coloration among high-elevation populations (i.e. Merced versus Tuolumne)are not significant (P � 0.072), with the exception ofmale body size (P < 0.001; Table 2). In comparisons
Figure 1. High-elevation populations of Sceloporus occidentalis in Yosemite National Park are larger in (A) body size and(B) ventral coloration versus low-elevation populations. A cut-off of 2100 m a.s.l. is used to separate populations at lowelevation (circles) and high elevation (triangles). The centroid for each group represents the group mean (calculated fromthe upper 50% quantile).
DIVERGENCE ALONG ELEVATION GRADIENTS 633
© 2010 The Linnean Society of London, Biological Journal of the Linnean Society, 2010, 100, 630–641
between low-elevation populations, female body sizeand male ventral coloration are not significantly dif-ferent (P � 0.057; Table 2). The two-way ANOVA(Table 2) also indicates that body size is significantlydifferent between elevation (P < 0.001) and riverdrainage (P � 0.042). Results of the Kruskall–WallisH-test on ventral coloration also support a significantdifference between high- and low-elevation popula-tions for males and females (P < 0.002), but the dif-ference among high-elevation populations is notsignificantly different (Pmales = 0.26; Pfemales = 0.061).
PHYLOGENY RECONSTRUCTION
AND HAPLOTYPE NETWORKS
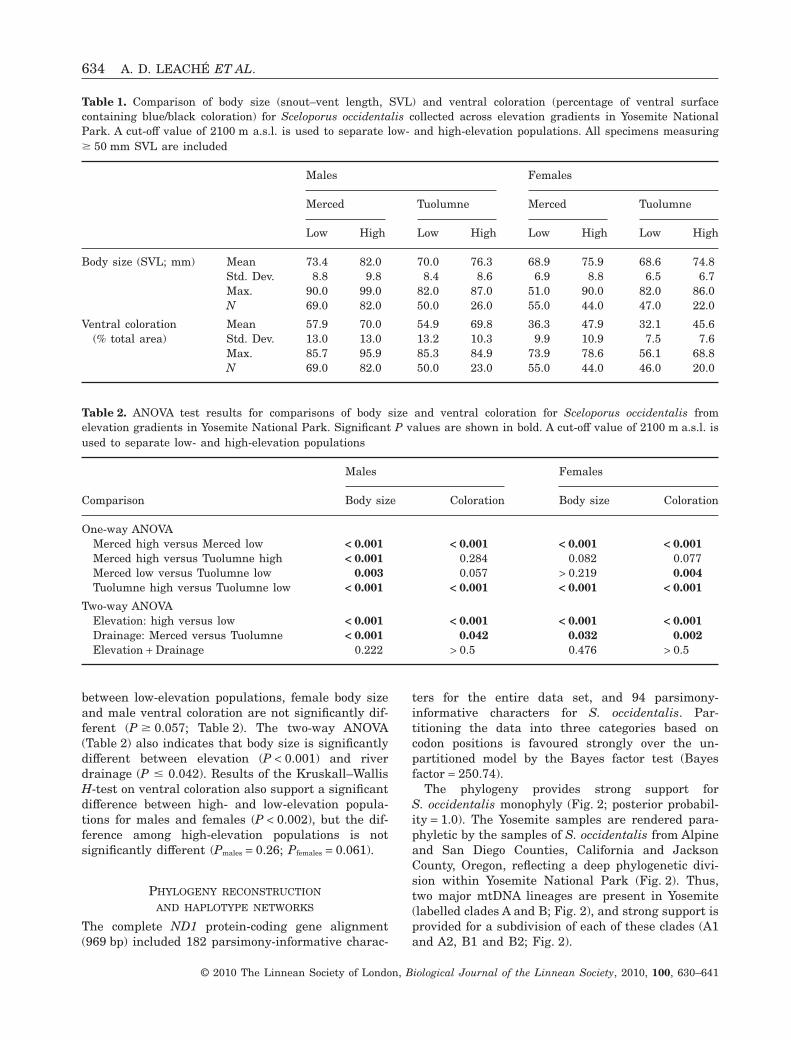
The complete ND1 protein-coding gene alignment(969 bp) included 182 parsimony-informative charac-
ters for the entire data set, and 94 parsimony-informative characters for S. occidentalis. Par-titioning the data into three categories based oncodon positions is favoured strongly over the un-partitioned model by the Bayes factor test (Bayesfactor = 250.74).
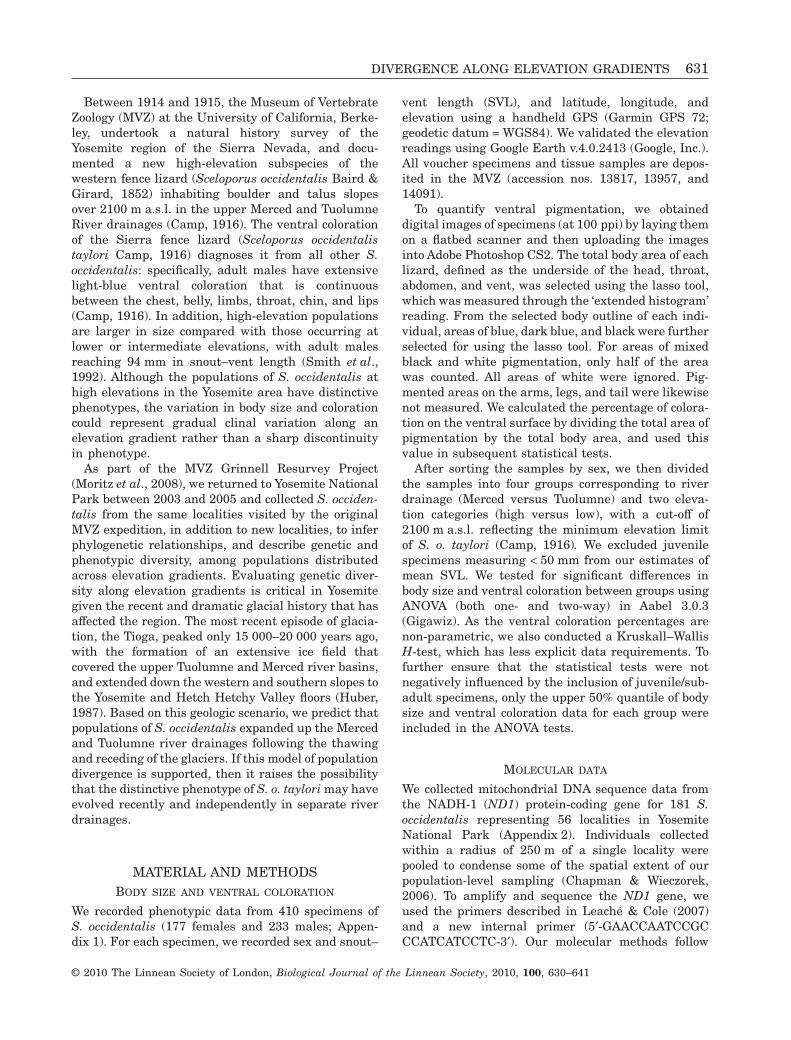
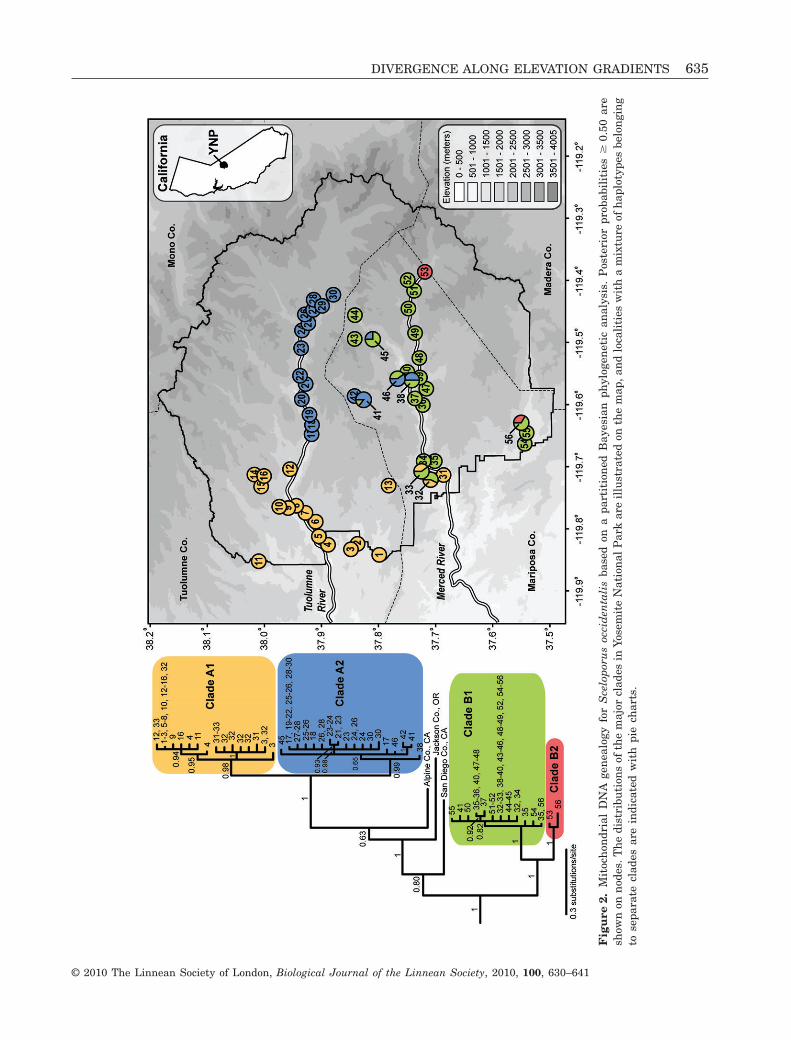
The phylogeny provides strong support forS. occidentalis monophyly (Fig. 2; posterior probabil-ity = 1.0). The Yosemite samples are rendered para-phyletic by the samples of S. occidentalis from Alpineand San Diego Counties, California and JacksonCounty, Oregon, reflecting a deep phylogenetic divi-sion within Yosemite National Park (Fig. 2). Thus,two major mtDNA lineages are present in Yosemite(labelled clades A and B; Fig. 2), and strong support isprovided for a subdivision of each of these clades (A1and A2, B1 and B2; Fig. 2).
Table 1. Comparison of body size (snout–vent length, SVL) and ventral coloration (percentage of ventral surfacecontaining blue/black coloration) for Sceloporus occidentalis collected across elevation gradients in Yosemite NationalPark. A cut-off value of 2100 m a.s.l. is used to separate low- and high-elevation populations. All specimens measuring� 50 mm SVL are included
Males Females
Merced Tuolumne Merced Tuolumne
Low High Low High Low High Low High
Body size (SVL; mm) Mean 73.4 82.0 70.0 76.3 68.9 75.9 68.6 74.8Std. Dev. 8.8 9.8 8.4 8.6 6.9 8.8 6.5 6.7Max. 90.0 99.0 82.0 87.0 51.0 90.0 82.0 86.0N 69.0 82.0 50.0 26.0 55.0 44.0 47.0 22.0
Ventral coloration(% total area)
Mean 57.9 70.0 54.9 69.8 36.3 47.9 32.1 45.6Std. Dev. 13.0 13.0 13.2 10.3 9.9 10.9 7.5 7.6Max. 85.7 95.9 85.3 84.9 73.9 78.6 56.1 68.8N 69.0 82.0 50.0 23.0 55.0 44.0 46.0 20.0
Table 2. ANOVA test results for comparisons of body size and ventral coloration for Sceloporus occidentalis fromelevation gradients in Yosemite National Park. Significant P values are shown in bold. A cut-off value of 2100 m a.s.l. isused to separate low- and high-elevation populations
Comparison
Males Females
Body size Coloration Body size Coloration
One-way ANOVAMerced high versus Merced low < 0.001 < 0.001 < 0.001 < 0.001Merced high versus Tuolumne high < 0.001 0.284 0.082 0.077Merced low versus Tuolumne low 0.003 0.057 > 0.219 0.004Tuolumne high versus Tuolumne low < 0.001 < 0.001 < 0.001 < 0.001
Two-way ANOVAElevation: high versus low < 0.001 < 0.001 < 0.001 < 0.001Drainage: Merced versus Tuolumne < 0.001 0.042 0.032 0.002Elevation + Drainage 0.222 > 0.5 0.476 > 0.5
634 A. D. LEACHÉ ET AL.
© 2010 The Linnean Society of London, Biological Journal of the Linnean Society, 2010, 100, 630–641
Fig
ure
2.M
itoc
hon
dria
lD
NA
gen
ealo
gyfo
rS
celo
poru
soc
cid
enta
lis
base
don
apa
rtit
ion
edB
ayes
ian
phyl
ogen
etic
anal
ysis
.P
oste
rior
prob
abil
itie
s�
0.50
are
show
non
nod
es.T
he
dist
ribu
tion
sof
the
maj
orcl
ades
inYo
sem
ite
Nat
ion
alP
ark
are
illu
stra
ted
onth
em
ap,a
nd
loca
liti
esw
ith
am
ixtu
reof
hap
loty
pes
belo
ngi
ng
tose
para
tecl
ades
are
indi
cate
dw
ith
pie
char
ts.
DIVERGENCE ALONG ELEVATION GRADIENTS 635
© 2010 The Linnean Society of London, Biological Journal of the Linnean Society, 2010, 100, 630–641
The major mtDNA clades in Yosemite NationalPark are not geographically exclusive (Fig. 2). CladeA1 is distributed across low elevations on the westernedge of Yosemite, and extends to mid elevations to thenorth and south of the Tuolumne River, but alsooverlaps spatially with clade B1 at low elevationsalong the Merced River (Fig. 2). Clade A2 is primarilydistributed along the Tuolumne River from theeastern edge of the Hetch Hetchy Reservoir to highelevations, and overlaps with clade B1 at high andlow elevations along the Merced River (Fig. 2). Hap-lotypes in clade B1 are found along the Merced Riverdrainage from low to high elevations, and to the southin Wawona. Only two haplotypes belong to clade B2,which are found at Washburn Lake (on the edge ofMadera Co.) and Wawona.
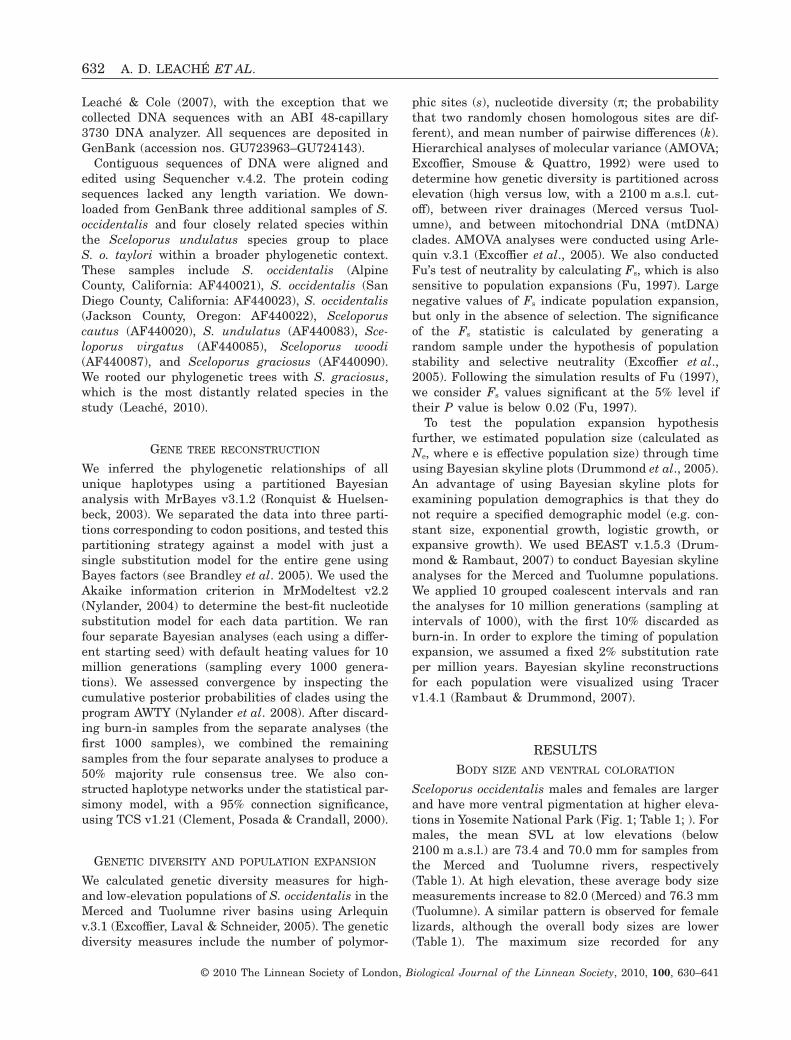
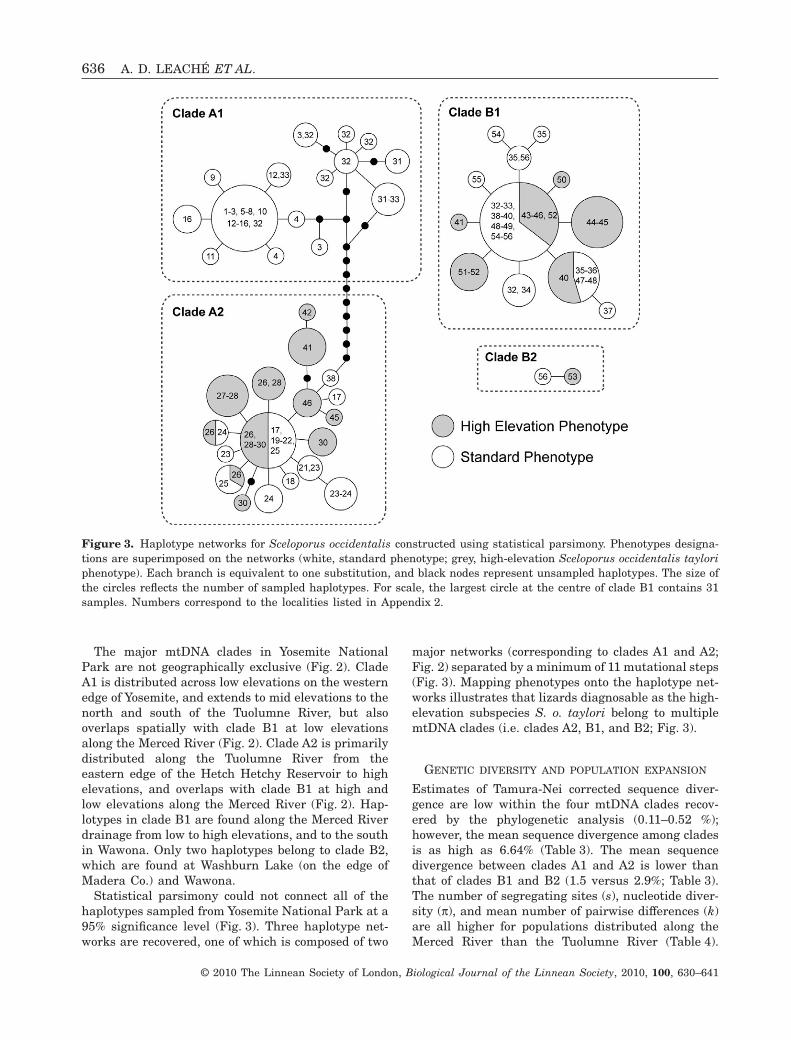
Statistical parsimony could not connect all of thehaplotypes sampled from Yosemite National Park at a95% significance level (Fig. 3). Three haplotype net-works are recovered, one of which is composed of two
major networks (corresponding to clades A1 and A2;Fig. 2) separated by a minimum of 11 mutational steps(Fig. 3). Mapping phenotypes onto the haplotype net-works illustrates that lizards diagnosable as the high-elevation subspecies S. o. taylori belong to multiplemtDNA clades (i.e. clades A2, B1, and B2; Fig. 3).
GENETIC DIVERSITY AND POPULATION EXPANSION
Estimates of Tamura-Nei corrected sequence diver-gence are low within the four mtDNA clades recov-ered by the phylogenetic analysis (0.11–0.52 %);however, the mean sequence divergence among cladesis as high as 6.64% (Table 3). The mean sequencedivergence between clades A1 and A2 is lower thanthat of clades B1 and B2 (1.5 versus 2.9%; Table 3).The number of segregating sites (s), nucleotide diver-sity (p), and mean number of pairwise differences (k)are all higher for populations distributed along theMerced River than the Tuolumne River (Table 4).
Figure 3. Haplotype networks for Sceloporus occidentalis constructed using statistical parsimony. Phenotypes designa-tions are superimposed on the networks (white, standard phenotype; grey, high-elevation Sceloporus occidentalis tayloriphenotype). Each branch is equivalent to one substitution, and black nodes represent unsampled haplotypes. The size ofthe circles reflects the number of sampled haplotypes. For scale, the largest circle at the centre of clade B1 contains 31samples. Numbers correspond to the localities listed in Appendix 2.
636 A. D. LEACHÉ ET AL.
© 2010 The Linnean Society of London, Biological Journal of the Linnean Society, 2010, 100, 630–641
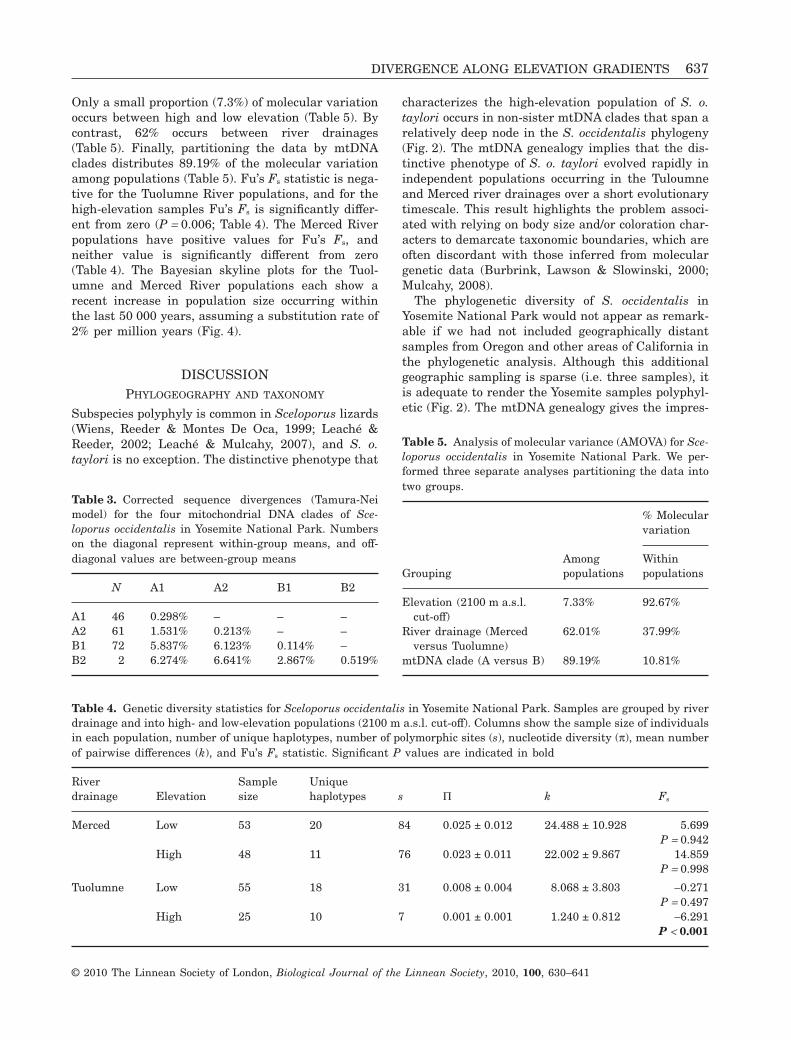
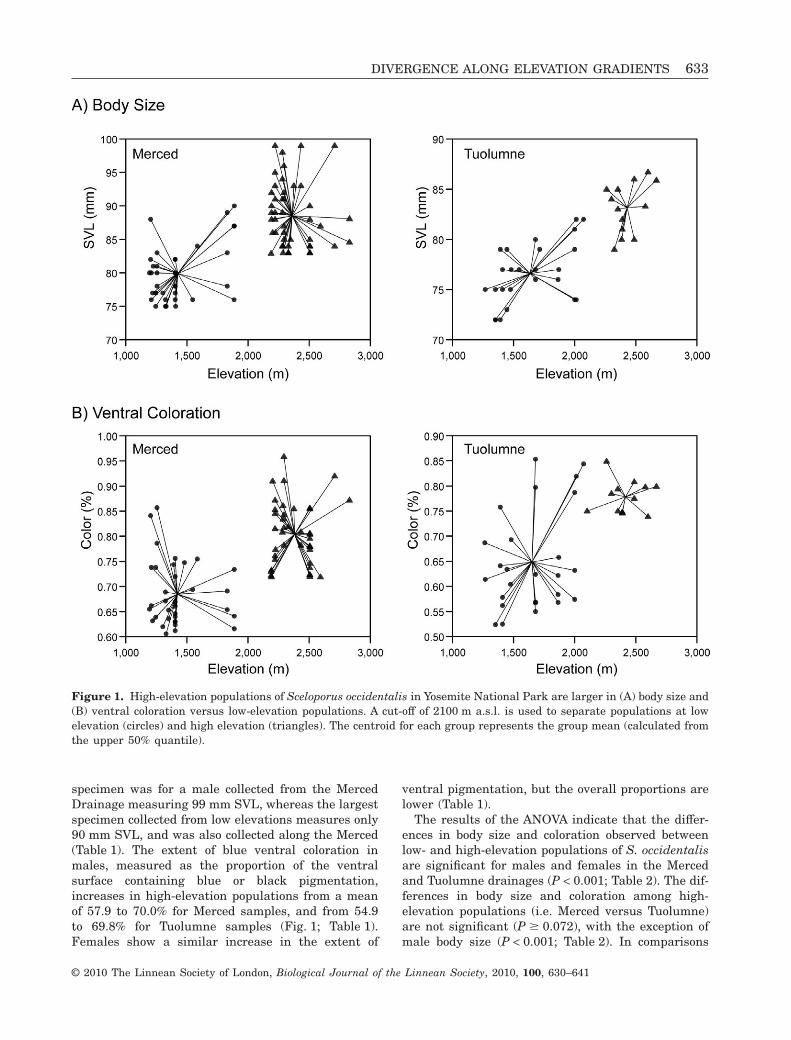
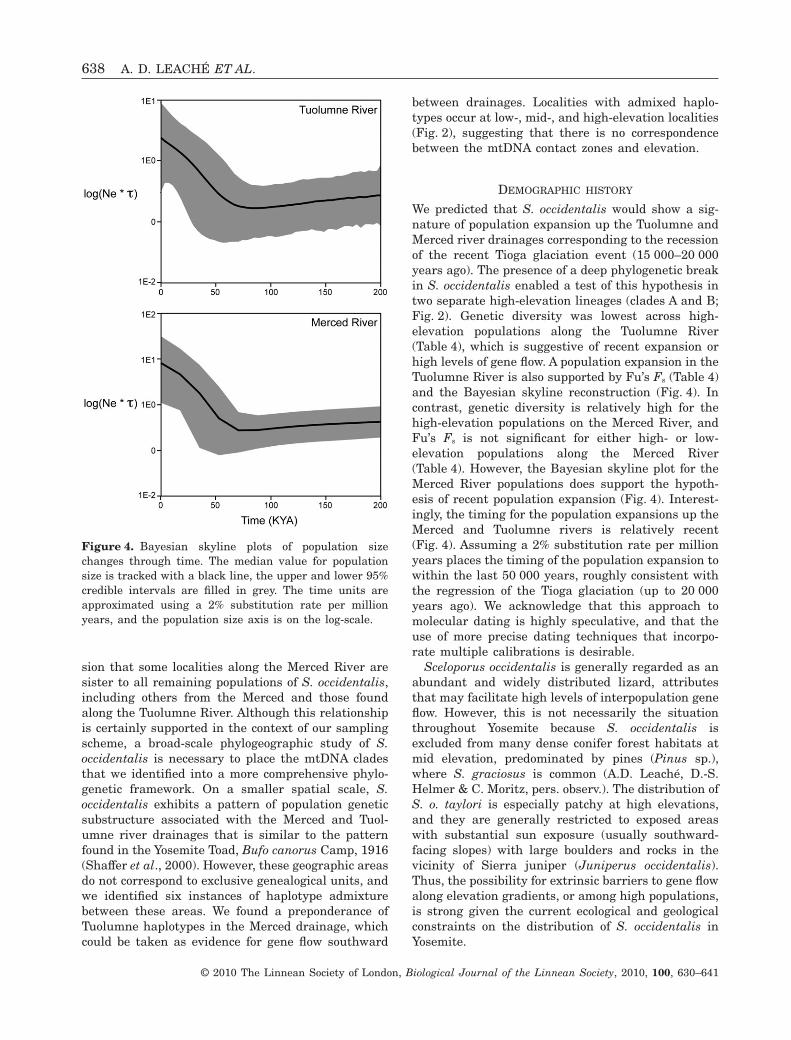
Only a small proportion (7.3%) of molecular variationoccurs between high and low elevation (Table 5). Bycontrast, 62% occurs between river drainages(Table 5). Finally, partitioning the data by mtDNAclades distributes 89.19% of the molecular variationamong populations (Table 5). Fu’s Fs statistic is nega-tive for the Tuolumne River populations, and for thehigh-elevation samples Fu’s Fs is significantly differ-ent from zero (P = 0.006; Table 4). The Merced Riverpopulations have positive values for Fu’s Fs, andneither value is significantly different from zero(Table 4). The Bayesian skyline plots for the Tuol-umne and Merced River populations each show arecent increase in population size occurring withinthe last 50 000 years, assuming a substitution rate of2% per million years (Fig. 4).
DISCUSSIONPHYLOGEOGRAPHY AND TAXONOMY
Subspecies polyphyly is common in Sceloporus lizards(Wiens, Reeder & Montes De Oca, 1999; Leaché &Reeder, 2002; Leaché & Mulcahy, 2007), and S. o.taylori is no exception. The distinctive phenotype that
characterizes the high-elevation population of S. o.taylori occurs in non-sister mtDNA clades that span arelatively deep node in the S. occidentalis phylogeny(Fig. 2). The mtDNA genealogy implies that the dis-tinctive phenotype of S. o. taylori evolved rapidly inindependent populations occurring in the Tuloumneand Merced river drainages over a short evolutionarytimescale. This result highlights the problem associ-ated with relying on body size and/or coloration char-acters to demarcate taxonomic boundaries, which areoften discordant with those inferred from moleculargenetic data (Burbrink, Lawson & Slowinski, 2000;Mulcahy, 2008).
The phylogenetic diversity of S. occidentalis inYosemite National Park would not appear as remark-able if we had not included geographically distantsamples from Oregon and other areas of California inthe phylogenetic analysis. Although this additionalgeographic sampling is sparse (i.e. three samples), itis adequate to render the Yosemite samples polyphyl-etic (Fig. 2). The mtDNA genealogy gives the impres-
Table 3. Corrected sequence divergences (Tamura-Neimodel) for the four mitochondrial DNA clades of Sce-loporus occidentalis in Yosemite National Park. Numberson the diagonal represent within-group means, and off-diagonal values are between-group means
N A1 A2 B1 B2
A1 46 0.298% – – –A2 61 1.531% 0.213% – –B1 72 5.837% 6.123% 0.114% –B2 2 6.274% 6.641% 2.867% 0.519%
Table 4. Genetic diversity statistics for Sceloporus occidentalis in Yosemite National Park. Samples are grouped by riverdrainage and into high- and low-elevation populations (2100 m a.s.l. cut-off). Columns show the sample size of individualsin each population, number of unique haplotypes, number of polymorphic sites (s), nucleotide diversity (p), mean numberof pairwise differences (k), and Fu’s Fs statistic. Significant P values are indicated in bold
Riverdrainage Elevation
Samplesize
Uniquehaplotypes s P k Fs
Merced Low 53 20 84 0.025 ± 0.012 24.488 ± 10.928 5.699P = 0.942
High 48 11 76 0.023 ± 0.011 22.002 ± 9.867 14.859P = 0.998
Tuolumne Low 55 18 31 0.008 ± 0.004 8.068 ± 3.803 -0.271P = 0.497
High 25 10 7 0.001 ± 0.001 1.240 ± 0.812 -6.291P < 0.001
Table 5. Analysis of molecular variance (AMOVA) for Sce-loporus occidentalis in Yosemite National Park. We per-formed three separate analyses partitioning the data intotwo groups.
Grouping
% Molecularvariation
Amongpopulations
Withinpopulations
Elevation (2100 m a.s.l.cut-off)
7.33% 92.67%
River drainage (Mercedversus Tuolumne)
62.01% 37.99%
mtDNA clade (A versus B) 89.19% 10.81%
DIVERGENCE ALONG ELEVATION GRADIENTS 637
© 2010 The Linnean Society of London, Biological Journal of the Linnean Society, 2010, 100, 630–641
sion that some localities along the Merced River aresister to all remaining populations of S. occidentalis,including others from the Merced and those foundalong the Tuolumne River. Although this relationshipis certainly supported in the context of our samplingscheme, a broad-scale phylogeographic study of S.occidentalis is necessary to place the mtDNA cladesthat we identified into a more comprehensive phylo-genetic framework. On a smaller spatial scale, S.occidentalis exhibits a pattern of population geneticsubstructure associated with the Merced and Tuol-umne river drainages that is similar to the patternfound in the Yosemite Toad, Bufo canorus Camp, 1916(Shaffer et al., 2000). However, these geographic areasdo not correspond to exclusive genealogical units, andwe identified six instances of haplotype admixturebetween these areas. We found a preponderance ofTuolumne haplotypes in the Merced drainage, whichcould be taken as evidence for gene flow southward
between drainages. Localities with admixed haplo-types occur at low-, mid-, and high-elevation localities(Fig. 2), suggesting that there is no correspondencebetween the mtDNA contact zones and elevation.
DEMOGRAPHIC HISTORY
We predicted that S. occidentalis would show a sig-nature of population expansion up the Tuolumne andMerced river drainages corresponding to the recessionof the recent Tioga glaciation event (15 000–20 000years ago). The presence of a deep phylogenetic breakin S. occidentalis enabled a test of this hypothesis intwo separate high-elevation lineages (clades A and B;Fig. 2). Genetic diversity was lowest across high-elevation populations along the Tuolumne River(Table 4), which is suggestive of recent expansion orhigh levels of gene flow. A population expansion in theTuolumne River is also supported by Fu’s Fs (Table 4)and the Bayesian skyline reconstruction (Fig. 4). Incontrast, genetic diversity is relatively high for thehigh-elevation populations on the Merced River, andFu’s Fs is not significant for either high- or low-elevation populations along the Merced River(Table 4). However, the Bayesian skyline plot for theMerced River populations does support the hypoth-esis of recent population expansion (Fig. 4). Interest-ingly, the timing for the population expansions up theMerced and Tuolumne rivers is relatively recent(Fig. 4). Assuming a 2% substitution rate per millionyears places the timing of the population expansion towithin the last 50 000 years, roughly consistent withthe regression of the Tioga glaciation (up to 20 000years ago). We acknowledge that this approach tomolecular dating is highly speculative, and that theuse of more precise dating techniques that incorpo-rate multiple calibrations is desirable.
Sceloporus occidentalis is generally regarded as anabundant and widely distributed lizard, attributesthat may facilitate high levels of interpopulation geneflow. However, this is not necessarily the situationthroughout Yosemite because S. occidentalis isexcluded from many dense conifer forest habitats atmid elevation, predominated by pines (Pinus sp.),where S. graciosus is common (A.D. Leaché, D.-S.Helmer & C. Moritz, pers. observ.). The distribution ofS. o. taylori is especially patchy at high elevations,and they are generally restricted to exposed areaswith substantial sun exposure (usually southward-facing slopes) with large boulders and rocks in thevicinity of Sierra juniper (Juniperus occidentalis).Thus, the possibility for extrinsic barriers to gene flowalong elevation gradients, or among high populations,is strong given the current ecological and geologicalconstraints on the distribution of S. occidentalis inYosemite.
Figure 4. Bayesian skyline plots of population sizechanges through time. The median value for populationsize is tracked with a black line, the upper and lower 95%credible intervals are filled in grey. The time units areapproximated using a 2% substitution rate per millionyears, and the population size axis is on the log-scale.
638 A. D. LEACHÉ ET AL.
© 2010 The Linnean Society of London, Biological Journal of the Linnean Society, 2010, 100, 630–641
PHENOTYPIC EVOLUTION
Body size differences among populations of S. occi-dentalis support a Bergmann’s cline along elevationgradients in Yosemite, with high-elevation popula-tions attaining a larger size compared with those atlow elevations. Hatchling lizards at high elevationhave fewer and shorter daily opportunities for foodintake, which translates to lower growth rates anddelayed maturation in colder environments (Sinervo& Adolph, 1994). These differences in thermal envi-ronments and maturation times can manifest asBergmann’s clines in body size along elevation andlatitudinal gradients in Sceloporus (Angilletta et al.,2004, 2006). Laboratory studies of S. occidentaliscollected from high- and low-elevation populationshave demonstrated that population origin deter-mines body size to a greater extent than phenotypicplasticity, which suggests a genetic component tobody size differences (Buckley, Irschick & Adolph,2010). However, populations of S. occidentalis froman elevation gradient in southern California do notshow a Bergmann’s cline, presumably as a result ofgene flow among high- and low-elevation popula-tions (Buckley et al., 2010). Thus, the complex andpatchy distribution of S. occidentalis at high eleva-tions in the Sierra Nevada may promote phenotypicdivergence by impeding gene flow along elevationgradients.
The coupling of body size evolution with increasedlevels of blue ventral coloration in high-elevationpopulations is intriguing. High-elevation populationsof S. occidentalis in Yosemite are darker in colour,which, similar to increased body size, is presumablyan adaptation for coping with a more challengingthermal environment. In Sceloporus, the depositionof the pigment melanin is largely responsible fordetermining the darkness of the body (Morrison,Rand & Frost-Mason, 1995). The blue ventral col-oration in Sceloporus is a structural colour reflectedby iridophores, but an underlying melanin layer isrequired to absorb the remaining light to produceblue coloration (Quinn & Hews, 2003). Thus, theevolution of extensive blue ventral coloration inS. occidentalis may be a by-product of increasedmelanism in response to the more challengingthermal environment experienced by lizards at highelevations.
ACKNOWLEDGEMENTS
We thank the National Park Service for permission toconduct research and collect specimens in YosemiteNational Park. We thank W. Brown, F. Burbrink. L.Clampitt, C. Conroy, T. Devitt, R. Hijmans, A. Leaché,D. Leaché, C. Linkem, J. McGuire, C. Spencer, and G.
Wogan for field assistance. This manuscript benefitedfrom comments provided by C. Conroy, J. McGuire,T. Papenfuss, J. Patton, R. Gillespie, and D. Wake.Funding was provided by the National Park Serviceand the Museum of Vertebrate Zoology, University ofCalifornia, Berkeley.
REFERENCES
Angilletta MJ, Niewiarowski PH, Dunham AE, LeachéAD, Porter W. 2004. Bergmann’s clines in ectotherms:illustrating a life-history perspective with sceloporinelizards. American Naturalist 164: E168–E183.
Angilletta MJ, Oufiero CE, Leaché AD. 2006. Direct andindirect effects of environmental temperature on the evolu-tion of reproductive strategies: an information-theoreticapproach. American Naturalist 168: E123–E135.
Brandley MC, Schmitz A, Reeder TW. 2005. PartitionedBayesian analyses, partition choice, and the phylogeneticrelationships of scincid lizards. Systematic Biology 54: 373–390.
Buckley CR, Irschick DJ, Adolph SC. 2010. The contribu-tions of evolutionary divergence and phenotypic plasticity togeographic variation in the western fence lizard, Sceloporusoccidentalis. Biological Journal of the Linnean Society 99:84–98.
Burbrink FT, Lawson R, Slowinski JB. 2000. Mitochon-drial DNA phylogeography of the polytypic North Americanrat snake (Elaphe obsoleta): a critique of the subspeciesconcept. Evolution 54: 2107–2118.
Calsbeek R, Thompson JN, Richardson JE. 2003. Pat-terns of molecular evolution and diversification in a biodi-versity hotspot: the California Floristic Province. MolecularEcology 12: 1021–1029.
Camp CL. 1916. The subspecies of Sceloporus occidentaliswith description of a new form from the Sierra Nevada, andsystematic notes on other California lizards. University ofCalifornia Publications in Zoology 17: 63–74.
Chapman AD, Wieczorek J. 2006. Guide to best practicesfor georeferencing. In: Chapman AD, Wieczorek J, eds.Global biodiversity information facility. Copenhagen: GlobalBiodiversity Information Facility, 1–80.
Clement M, Posada D, Crandall KA. 2000. TCS: a com-puter program to estimate gene genealogies. MolecularEcology 9: 1657–1659.
Drummond AJ, Rambaut A. 2007. BEAST: Bayesian evo-lutionary analysis by sampling trees. BMC EvolutionaryBiology 7: 214–221.
Drummond AJ, Rambaut A, Shapiro B, Pybus OG. 2005.Bayesian coalescent inference of past population dynamicsfrom molecular sequences. Molecular Biology and Evolution22: 1185–1192.
Excoffier L, Laval G, Schneider S. 2005. Arlequin (version3.0): an integrated software package for population geneticsdata analysis. Evolutionary Bioinformatics Online 1: 47–50.
Excoffier L, Smouse PE, Quattro JM. 1992. Analyses ofmolecular variance inferred from metric distances among
DIVERGENCE ALONG ELEVATION GRADIENTS 639
© 2010 The Linnean Society of London, Biological Journal of the Linnean Society, 2010, 100, 630–641
DNA haplotypes: application to human mitochondrial DNArestriction data. Genetics 131: 479–491.
Fu YX. 1997. Statistical tests of neutrality of mutationsagainst population growth, hitchhiking and backgroundselection. Genetics 147: 915–925.
Huber NK. 1987. The geologic story of Yosemite NationalPark. US Geological Survey Bulletin 1595: 1–64.
Leaché AD. 2010. Species trees for spiny lizards (GenusSceloporus): identifying points of concordance and conflictbetween nuclear and mitochondrial data. Molecular Phylo-genetics and Evolution 54: 162–171.
Leaché AD, Cole CJ. 2007. Hybridization between multiplefence lizard lineages in an ecotone: locally discordant varia-tion in mitochondrial DNA, chromosomes, and morphology.Molecular Ecology 16: 1035–1054.
Leaché AD, Mulcahy DG. 2007. Phylogeny, divergencetimes and species limits of spiny lizards (Sceloporus mag-ister species group) in western North American deserts andBaja California. Molecular Ecology 16: 5216–5233.
Leaché AD, Reeder TW. 2002. Molecular systematics of theeastern fence lizard (Sceloporus undulatus): a comparison ofparsimony, likelihood, and Bayesian approaches. SystematicBiology 51: 44–68.
Moritz C, Patton JL, Conroy CJ, Parra JL, White GC,Beissinger SR. 2008. Impact of a century of climatechange on small-mammal communities in YosemiteNational Park. Science 322: 261–264.
Morrison RL, Rand MS, Frost-Mason SK. 1995. Cellularbasis of color differences in three morphs of the lizardSceloporus undulatus erythrocheilus. Copeia 1995: 397–408.
Mulcahy DG. 2008. Phylogeography and species boundariesof the western North American Nightsnake (Hypsiglenatorquata): revisiting the subspecies concept. Molecular Phy-logenetics and Evolution 46: 1095–1115.
Nylander JAA. 2004. MrModletest, version 2. Programdistributed by the author. Evolutionary Biology Centre,Uppsala University.
Nylander JAA, Wilgenbusch JC, Warren DL, SwoffordDL. 2008. AWTY (are we there yet?): a system for graphicalexploration of MCMC convergence in Bayesian phylogenet-ics. Bioinformatics 24: 581–583.
Patterson TB, Givnish TJ. 2004. Geographic cohesion, chro-mosomal evolution, parallel adaptive radiations, and conse-quent floral adaptations in Calochortus (Calochortaceae):evidence from a cpDNA phylogeny. New Phytologist 161:253–264.
Quinn VS, Hews KD. 2003. Positive relationships betweenabdominal coloration and dermal melanin density inphrynosomatid lizards. Copeia 2003: 858–864.
Rambaut A, Drummond AJ. 2007. Tracer. University ofOxford: Oxford.
Rissler LJ, Hijmans RJ, Graham CH, Moritz C, WakeDB. 2006. Phylogeographic lineages and species compari-sons in conservation analyses: a case study of Californiaherpetofauna. American Naturalist 167: 655–666.
Ronquist F, Huelsenbeck JP. 2003. MrBayes version 3:Bayesian phylogenetic inference under mixed models. Bio-informatics 19: 1572–1574.
Shaffer HB, Feller GM, Magee A, Voss SR. 2000. Thegenetics of amphibian declines: population substructure andmolecular differentiation in the Yosemite Toad, Bufocanorus (Anura, Bufonidae) based on single-strand confor-mation polymorphism analysis (SSCP) and mitochondrialDNA sequence data. Molecular Ecology 9: 245–257.
Sinervo B, Adolph SC. 1994. Growth plasticity andthermal opportunity in Sceloporus lizards. Ecology 5: 776–790.
Smith HM, Bell ES, Applegarth JS, Chiszar D. 1992.Adaptive convergence in the lizard superspecies Sceloporusundulatus. Bulletin of the Maryland Herpetological Society28: 123–149.
Storer TI, Usinger RL, Lukas D. 2004. Sierra Nevadanatural history. Berkeley: University of California Press.
Wiens JJ, Reeder TW, Montes De Oca, AN. 1999. Molecu-lar phylogenetics and evolution of sexual dichromatismamong populations of the Yarrow’s Spiny Lizard (Sceloporusjarrovii). Evolution 53: 1884–1897.
APPENDIX 1
Voucher specimens of Sceloporus occidentalis scoredfor body size and coloration. All specimens are depos-ited in the Museum of Vertebrate Zoology (MVZ),and specific locality data and GPS coordinates canbe obtained from http://mvz.berkeley.edu/. Vouchernumbers in the 5900 series correspond to specimenscollected in 1915 during the original MVZ survey ofYosemite National Park. Body size and colorationdata were collected for all specimens unless notedotherwise (C = coloration only; S = body size only).
Females (N = 177): 5935–7, 5940, 5942, 5946, 5949–50, 5957 (C), 240907–10, 240916–7, 240920–2, 240924–7, 240925–7, 240936–8, 240941 (C),240950–1, 240959, 240961–2, 240963 (C), 240966,240967 (S), 240968, 240970–2, 240976–7, 240985–6, 240989, 240993–4 (S), 241000–5, 241011, 241013,241015–9, 241021–7, 241039–42, 241046–9,241056–7, 241060 (C), 241062–3, 241068, 241071–3, 241076, 245615, 245631–6, 245639–42, 245646–8,245651–2, 245655–6, 245661–2, 245669, 245672–8, 245682–3, 245685–6, 245688, 245693–5, 245698,245703–4, 245708, 245712, 245715, 245719–21,245724–5, 245730, 245735, 245737–8, 245742(S), 245743, 245750–2, 245762–4, 245767, 245774,245776, 245778–9, 245782, 245785, 245787–8,250088–9, 250106, 250110–2, 250114, 250118–22, 250125–6, 250129, 250131–4, 250141–2, 250150,250155–6, 250158, 250162.
Males (N = 233): 5859, 5863–4, 5934, 5938–9, 5941,5944–5, 5947–8, 5951–56, 240905–6, 240911–15,240918–19, 240923, 240928–35, 240942–9, 240952–8, 240960, 240964–5, 240969, 240973–5, 240978–84,240990–2 (S), 240995–9, 241006–10, 241012, 241014,
640 A. D. LEACHÉ ET AL.
© 2010 The Linnean Society of London, Biological Journal of the Linnean Society, 2010, 100, 630–641
241020, 241028–38, 241043, 241050–5, 241058–9, 241061, 241064–7, 241069–70, 241074–5, 245616–30, 245637–8, 245643–5, 245649–50, 245653–4,245657–60, 245663–8, 245670–1, 245684, 245687,245689–92, 245696–7, 245699–702, 245705–7, 245709–10, 245713–14, 245718, 245722–3,245726–9, 245734, 245740–1, 245748–9, 245758(C), 245760, 245765, 245770–1 (C), 245773, 245777,245780–1, 245784, 245786, 245789–91, 250086–7, 250090–5, 250097–100, 250104–5, 250107–9,250113, 250115–7, 250123–4, 250128, 250130, 250135(C), 250137 (C), 250138, 250143–9, 250151–4, 250157(C), 250159–61.
APPENDIX 2
Locality data and voucher specimen numbers for Sce-loporus occidentalis included in the genetic analyses.All specimens are deposited in the Museum of Verte-brate Zoology (MVZ), and specific locality data andGPS coordinates can be obtained from http://mvz.berkeley.edu/. Locality numbers refer to labelsused in the phylogenetic analysis and haplotypenetwork.
(1) Hodgon Meadows (245580); (2) Evergreen Road,Stanislaus N.F. (241057); (3) Evergreen Road, Stani-slaus N.F. (241059, 241062–3); (4) Hetch Hetchy Road(241043, 245734); (5) Hetch Hetchy Road (241056,245747); (6) Hetch Hetchy Road (250135–6); (7) HetchHetchy Road (250138); (8) Hetch Hetchy, S. of Reser-voir (241066); (9) Hetch Hetchy, N. of Reservoir(245776); (10) Hetch Hetchy, N. of Reservoir (250128);(11) Lake Eleanor (245773); (12) Rancheria Falls(250151, 250153–4); (13) Tuolumne River South Fork,Tioga Road (241058); (14) Lake Vernon (250124);
(15) Lake Vernon (250133–4); (16) Lake Vernon(250141–4, 250147–8, 250158–9); (17) Hetch Hetchy,E. of Reservoir (245737, 245736); (18) Hetch Hetchy,E. of Reservoir (247739); (19) Hetch Hetchy, E. ofReservoir (245792); (20) Pate Valley (245779); (21)Pate Valley (245743, 245748); (22) Pate Valley(245762); (23) 7.5 miles West of Glen Aulin (241036,241038–42); (24) Return Creek (241027–31); (25)between LeConte and Waterwheel Falls (241010–1,241019–21); (26) between LeConte and WaterwheelFalls (241005, 241012–5); (27) California Falls(241006, 241009); (28) Glen Aulin (240999, 241001–4,240991–4); (29) McGee Lake (241073–6); (30) PotholeDome (245785–6, 245788–90); (31) Arch Rock,Yosemite Valley (240952–6); (32) Foresta (240919–22,240907–10, 240948–50, 245641, 250094–5); (33)Wildcut Creek, Big Oak Flat Road (240962–6); (34)Cascade Creek, Yosemite Valley (245677); (35) Turtle-back Dome (250089–92); (36) Yellowpine Camp,Yosemite Valley (245666); (37) 4–Mile Trail, YosemiteValley (245622); (38) Mirror Lake Trail, YosemiteValley (250110–1); (39) Happy Isles Nature Center,Yosemite Valley (240985–6); (40) Mirror Lake,Yosemite Valley (250115–7); (41) Yosemite CreekCampground (245724–30); (42) Yosemite Creek, TiogaRoad (250086); (43) May Lake (245695–8, 245701);(44) Lake Tenaya (240932–6, 241045, 241048,241051–4); (45) Olmsted Point (240925–8); (46) NorthDome (25099–100, 245703–5); (47) Glacier Point(240972–7); (48) Little Yosemite Valley (245702,245643, 245000); (49) Moraine Dome (245667); (50)Echo Valley (245682); (51) Merced High Sierra Camp(245656); (52) Lake Babcock (245706–9, 245637,245640); (53) Washburn Lake (245615); (54) WawonaCampground (240911, 240913–6); (55) ChilnualnaCreek, Wawona (240979–81); (56) Chilnualna FallsTrail, Wawona (240967, 250103, 250000).
DIVERGENCE ALONG ELEVATION GRADIENTS 641
© 2010 The Linnean Society of London, Biological Journal of the Linnean Society, 2010, 100, 630–641