Embed Size (px)
Citation preview

Swedish University of Agricultural Sciences Faculty of Veterinary Medicine and Animal Science
Phenotypic effects of a fertility mutation in norwegian white sheep
Sadia Afrin Siddiqua
Examensarbete / Swedish University of Agricultural Sciences, Department of Animal Breeding and Genetics,
423
Uppsala 2013
Master’s Thesis, 30 HEC
Erasmus Mundus Programme – European Master in Animal Breeding and Genetics


Swedish University of Agricultural Sciences Faculty of Veterinary Medicine and Animal Science Department of Animal Breeding and Genetics
Phenotypic effects of a fertility mutation in norwegian white sheep Sadia Afrin Siddiqua Supervisors: Göran Andersson, SLU, Department of Animal Breeding and Genetics Dag Inge Våge, UMB, Norway Examiner: Erling Strandberg, SLU, Department of Animal Breeding and Genetics Credits: 30 HEC Course title: Degree project in Animal Science Course code: EX0556 Programme: Erasmus Mundus Programme - European Master in Animal Breeding and Genetics Level: Advanced, A2E Place of publication: Uppsala Year of publication: 2013 Name of series: Examensarbete / Swedish University of Agricultural Sciences,
Department of Animal Breeding and Genetics, 423 On-line publication: http://epsilon.slu.se Key words: Sheep, fertility, GDF9, litter size, genetic variant


European Master in Animal Breeding and Genetics
PHENOTYPIC EFFECTS OF A FERTILITY
MUTATION IN NORWEGIAN WHITE SHEEP
SADIA AFRIN SIDDIQUA Registration number: 840202-P268 (SLU)/980676 (UMB)
THESIS ANIMAL BREEDING AND GENETICS
COURSE CODE: EX0556 (SLU)/M30-IHA (UMB) MAY 2013
Department of Animal and Aquacultural Sciences SUPERVISORS Prof. Dag Inge Våge Ph.D (UMB) Prof. Göran Andersson Ph.D (SLU)

European Master in Animal Breeding and Genetics

1
Acknowledgements
The thesis project was carried out with the collaboration of Center for Integrative Genetics (CIGENE), Department of Animal and Aquacultural Sciences (IHA), University of Life Sciences (UMB) and The Norwegian Association of Sheep and Goat Breeders (NSG).
I would like to give my gratitude to
My supervisor at University of Life Sciences (UMB), Professor Dag Inge Våge for giving me the opportunity to work with his research group, for his continuous support and encouragement during the whole thesis semester and for invaluable help during the writing process.
My supervisor at Swedish University of Agricultural Sciences (SLU), Professor Göran Andersson for his suggestion during our skype meetings and for reading and commenting on my thesis..
The Norwegian Association of Sheep and Goat Breeders (NSG) for providing the blood samples and data on two fertility traits of each experimental sheep for this study.
Kristina Vogonyte-Hallan, technician at CIGENE for all her help with the DNA extraction and MassARRAY platform methods.
Inger Anne Boman of The Norwegian Association of Sheep and Goat Breeders for her support during analysis the genotyping results.
To my family especially to my daughter (Subaita Mariam Adeba) for her greatest support.
Finally, thanks to the Consortium Committee of the Erasmus Mundus MSc Program for the European Master in Animal Breeding and Genetics (EM-ABG) and all the professors firstly for granting me the opportunity to discover the field of animal breeding and genetics and secondly for the continuous help (teaching, organization, mobility, etc.) during our studies.
Sadia Afrin Siddiqua
May, 2013
Ås, Norway

2
Abstract
Norwegian White Sheep (NWS) is a synthetic breed that results from crosses between local Norwegian and foreign breeds. This breed is mainly kept for the meat production, and litter size is therefore a trait of large economic value. A mutation in the ovine GDF9 gene (c.1111G>A) on chromosome 5 was recently found to be associated with increased litter size in daughters of AI rams of Norwegian White Sheep (NWS). This thesis aims at estimating the phenotypic effect of the (c.1111G>A) mutation in nearly 900 NWS-ewes’. Since litter size can only be directly observed at females, genotyping of the mother is considered to give a better phenotypic estimate of the allelic effect compared to estimates based on the EBVs of the rams. The information available for these ewes was number of lambs born at age 1 year and 2 year of age. A total of 853 NWS ewes were genotyped for the (GDF9 c.111G>A) mutation by the iPLEX Gold technology (SEQUENOM). The genotyping success rate was more than 90%. The average litter size for ewes at 1 and 2 year of age was 2.061±0.73 and 2.671±0.91, respectively, showing that the average litter size was lower at 1 year compared to those at 2 years. The phenotypic effect of being homozygous for the mutant allele at age 1 and 2 year was found to be 0.54 and 0.87 additional lamb per litter, respectively. The frequency of the c.1111A allele was 0.38 in NWS ewe population. As the experimental ewes were heavily selected for large litter size and strong association between c.1111A allele and litter size is known, it can be assumed that the selection has increased the frequency among these ewes. Handling of c.1111A allele in NWS will significantly influence the future litter size in this population. The Norwegian Association of Sheep and Goat Breeders will design how to exploit the rams carrying the c.1111A allele in Norwegian White Sheep breeding program.

3
Table of Contents Page No 1. Introduction………………………………………………………………………………....07
1.1 Fertility in sheep…………………………………………………………......................07 1.2 Fertility in Norwegian White Sheep (NWS)………………………………...................07 1.3 Norwegian Sheep Breeding………………………………………………….................07 1.4 Known genes for fertility in sheep and their functions……………………...................08
1.4.1 BMPR1B……………………………………………………………………........08 1.4.2 BMP15………………………………………………………………..................09 1.4.3 Ovine GDF9 gene ………………………………………………….....................09 1.4.4 Probable functions of GDF9 gene………………………………........................11
1.5 Mutations recently found in the GDF9 gene....................................................................12 1.6 SNP genotyping by MassArray platform method with iPLEX assay……….................12 1.7 Aim of the Study…………………………………………………………………..........15
2 Materials and Methods……………………………………………………………..............16 2.1 Animals…………………………………………………………………………............16 2.2 SNP Genotyping by iPLEX MassARRY MALDI-TOF MS method………..................16
2.2.1 DNA isolation…………………………………………………………...............16 2.2.2 DNA quantifiction………………………………………………........................17 2.2.3 DNA Amplification…………………………………………………..................18
2.2.3.1 Primer design………………………………………………......................18 2.2.3.2 Primer dilution………………………………………………....................18 2.2.3.3 Polymerase Chain Reaction (PCR)…………………………….................19
2.2.4 Dephosphorylation of dNTPs (SAP Reaction)……………………….................20 2.2.5 iPLEX Gold Reaction/Extension Reaction…………………………..................20 2.2.6 Conditioning the iPLEX Gold Reaction products/ Desalting………..................21 2.2.7 Dispensing of iPLEX Gold reaction product to spectroCHIP® Arrays................21 2.2.8 Defining the setup of assays and plates in the MassARRAY…………...............22 2.2.9 Acquisition and Analyzing of spectra using mass spectrometer……...................22 2.2.10 Statistical Analysis……………………………………………………….........22
3 Results…………………………………………………………………………………........23
3.1 DNA quantification…………………………………………………………….............23 3.2 Genotyping………………………………………………………………………..........23 3.3 Animals............................................................................................................................23 3.4 Descriptive Statistics of the GDF9 SNP……………………….....................................23 3.5 Statistical Analysis………………………………………………………………..........24
4 Discussion…………………………………………………………………………….........29 5 Reference List........................................................................................................................31 6 Appendix ……………………………………………………………………………...........36

4
Abbreviations
AE buffer Adams-Evans buffer
AI Artificial insemination
BCO2 Beta-carotene oxygenase 2
BMP15 Bone morphogenic protein 15
BMPR1B Bone morphogenetic protein 1B receptor
DNA Deoxyribonucleic acid
EBV Estimated breeding value
EDTA Ethylenediaminetetraacetic acid
GDF9 Growth differentiation actor 9
GWAS Genome wide association study
LS Litter size
MALDI-TOF Matrix assisted laser desorption/ ionization-time of flight
MC1R Melanocortin 1 receptor
MS Mass spectrometry
MSTN Myoststin
NWS Norwegian White Sheep
PBS Phosphate buffered saline
PCR Polymerase Chain Reaction
QTL Quantitative Trait loci
rpm Rotations per minute
SAP Shrimp Alkaline Phosphatase
SNP Single nucleotide polymorphism
NSG Norwegian Sheep and Goat Association

5
List of Tables Page No.
Table 1.1 Mutation in different fertility genes in sheep and their effects………………………..11
Table 2.1 Reagents used in DNA extraction from blood in ewes………………………………..17
Table 2.2 Primers for GDF9_c1111G>A…………………………………………………..........18 Table 2.3: Master mix for PCR to obtain ovine specific c1111G>A amplicon............................19 Table 2.4: PCR cycle adjusted for the amplification of c1111G>A in ewe…………………….19 Table 2.5: Master mix for SAP enzyme cocktail mix……………………………………............20 Table 2.6: Thermal cycle for SAP program………………………………………………...........20 Table 2.7: Master mix for iPLEX Gold Reaction cocktail………………………………………21 Table 2.8: Thermal cycle for iPLEX Gold Reaction…………………………………………….21 Table 3.1: Genotype and allele frequency of c.1111G>A in Norwegian White Ewes…………...24 Table 3.2: Number of ewes and lambs born (LS) per genotype…………………………............24 Table 3.3: Mean and least-square means of LS per genotype………………………….............25 Table 3.4: Effect of different sources on phenotype……………………………………………..26 Table 3.5: Least means for LS contrasts between GDF9 c.1111 genotypes……………………..27 Table 3.6: Adjusted p- values for pair wise LS-means difference of effect genotype for LSs….27 Table 3.7: Number of lambs born per genotype with different observations……………………28

6
List of Figures Page No.
Figure 1.1 Linkage map position of GDF9 in the central portion of sheep chromosome 5……..10 Figure 1.2 GDF9 mRNA………………………………………………………………………...10 Figure 1.3: GDF9 amino acid sequence………………………………………………………….11 Figure 1.4 iPLEX Assay (The scheme depicts a single assay)…………………………………..14 Figure 3.1 Average litter size at 1 year of age per genotyp………...……………………………25 Figure 3.2: Average litter size at 2 year of age per genotype …………………………………...26

7
1. Introduction
1.1 Fertility in sheep
Fertility is the ability of an individual to produce live offspring and also the birth rate of a population refers to fertility (Frank, 2012; www.biology-online.org/dictionary/Fertility). In sheep the number of lambs born by a ewe or her litter size (LS) can be considered as fertility. Fertility is controlled by genetics and environmental factors (i.e. nutrition, season, herd, farm system etc.) Litter size is a complex trait with very low repeatability (Nichol et al., 2009) and the heritability is less than 10% (Notter, 2008). Number of lambs born is the ewe trait that is important in sheep breeding program (Steinheim et al., 2008). Litter size is an important economic trait in sheep production (Javanmard et al., 2011), mainly due to high economic value of meat (D'Arcy, 1990; Abdulkhaliq et al., 1989; Nitter, 1985; Well Gully, 2013). Increasing multiple births in sheep might improve meat production per ewe (Rajab et al., 1992).
1.2 Fertility in Norwegian White Sheep (NWS)
Norwegian White Sheep (NWS) is a synthetic breed resulting from cross-breeding between Norwegian and foreign breeds like Finnish Landrace (to improve fertility) and with East Friesian Dairy Sheep (to increase milking capacity) into 1970s and 1990s, respectively (Ådnøy, 1988; Larsgard and Standal, 1999). Since 2000-2001, this sheep breed has been considered as Norway’s own breed and it is grouped among long-tailed breeds. This breed is now found throughout Norway and is used for meat and wool production. NWS is slightly smaller in size and the fertility is higher compared to the original Dala sheep (NORDGEN, 2013). The average number of lambs born alive (NLBA) was reported to be 2.06 in 2007 (Steinheim et al., 2008) and mean litter size (LS) of NWS at 1 year and 2 years of age was reported as be1.63 and 2.10, respectively (Eikje, 2008). In Norwegian Sheep Breeding Scheme, litter size has been considered as one of the major traits with high economic value (about 12% of the National Sheep Breeding goal) (NGS, 2013). Selective breeding for this trait has been successful, and the number of lambs born or litter size (LS) in NWS has been increasing over the years. 1.3 Norwegian Sheep Breeding
For the genetic improvement of Norwegian sheep, the Norwegian Sheep and Goat Breeder’s Association established the Norwegian Sheep Breeding Scheme in the 1960s. In early 1990s Norwegian sheep breeding had developed and merged into a single NWS breeding group. The Norwegian Sheep and Goat Breeder’s Association (NSG) is taking care of the NWS recording

8
system and breeding program. The breeding stocks are kept in several small “ram-circles”, (breeding co-operative groups of 10-30 farmers) where the young rams are selected and progeny-tested. During the mating season, the tested rams are moved among different flocks. The ram lambs are selected based on their pedigree information and own performance; the ewes are selected following the selection index (for litter size, fleece weight, maternal effect on weaning weight, carcass weight and so on). By selection indices rams can also be selected elite rams for mating and some of the most promising (based on first year results) rams can be selected for artificial insemination (AI), to increase the genetic gain (Eikje et al., 2008). The semen is collected for long time storage from two AI-stations in Norway (Valdez-Nava, 2011).
1.4 Known genes for fertility in sheep and their functions A large body of evidence supported that the oocyte plays a central role in regulating of ovarian follicle growth and development (Matzuk et al., 2002; Gilchrist et al., 2008; Su et al., 2009; Otsuka et al., 2011). In particular, the proteins secreted from oocytes play a vital role in ovulation rate with the follicular growth regulation (Juengel and McNatty, 2005; Moore et al., 2003). Booroola was the first gene to be identified as a major gene for prolificacy in sheep (Piper et al., 1985). Litter size in sheep was recorded among different breeds and within breeds (Montgomery et al., 1992). Most of the domestic sheep breeds have one or two lambs per lambing, whereas only few breeds like the Booroola, Merino, Cambridge, D'Man, Finnish Landrace, and Romanov were proved more prolific (three or more lambs per ewe lambing) (Montgomery et al., 1992). From the genetic studies of prolificacy in sheep, it has been shown that litter size and ovulation rate can be influenced by segregation of a single gene (Piper and Bindon, 1982; Davis et al., 1982) and mutations in these genes have been associated with increased litter size and ovulation rate (Bindon et al., 1996).
Members of the transforming growth factor receptor beta (TGFβ) super family BMP15, BMPR1and GDF9 genes has been shown to play important roles in regulating fertility in sheep (Knight and Glister, 2001; Chang et al., 2002; Durlinger et al., 2002). BMP15, BMPR1and GDF9 genes are described below:
1.4.1 BMPR1B Bone morphogenetic protein 1B receptor (BMPR-1B) gene or the Booroola gene (FecB) is situated on sheep chromosome 6 and is expressed in oocytes and granulosa cells (Piper et al., 1985; Wilson et al., 2001; Souza et al. 2001). BMPR1B was identified as the first major gene associated with prolificacy in sheep in 1980 (Davis et al., 1982). Mutations in this gene are associated with increased ovulation rate and litter size and have large effect on prolificacy in

9
ewes. In Merino Booroola sheep the Booroola variant (FecBB) was found in the BMPR1B gene (Mulsant et al., 2001; Souza et al., 2001; Wilson et al., 2001) (Table 1.1). 1.4.2 BMP15 Bone morphogenetic protein 15 (BMP-15) is a growth factor and a member of the TGFβ superfamily, expressed in oocytes during follicular development (Hanrahan et al., 2004; Galloway et al., 2000). The ovine BMP-15 gene is situated on chromosome X. BMP15 is produced as a precursor protein that consists of 393 amino acids. This consists of a short signal peptide (1-25) followed by a propeptide (26-268) and finally the mature region of the protein (269-393) (Bodensteiner et al., 1999; Galloway et al., 2000). In sheep, BMP15 is essential for activation of primordial follicle and subsequently in all stages of normal follicular development, maturation and ovulation (Bodensteiner et al., 1999; Eppig, 2001; Juengel et al., 2004; Mandon-Pepin et al., 2003). Mutations in the BMP-15 gene have been found associated with increased ovulation rate and fertility (Hanrahan et al., 2004). Polymorphism in the BMP15 gene was found to be associated with increased ovulation rate in Inverdale (FecXI) and Hanna (FecXH) sheep (Galloway et al., 2000) (Table 1.1). 1.4.3 Ovine GDF9 gene The ovine GDF9 gene was mapped to ovine chromosome number 5, between the markers BM7247 and BMS2258 on the framework map (Figure 1.1) by linkage analysis (Maddox et al., 2001).
Ovine GDF9 gene is 2.5 kb long, consists of two exons and one intron. Exon 1 and exon 2 is 397 bp and 968 bp, respectively and encodes for amino acids1–134 and 135–456, respectively (Hanrahan et al., 2004). Figure 1.2 showing the GDF9 mRNA below. The GDF9 mRNA is translated into a preprotein (Figure 1.3) having a signal peptide (27 aa), a propeptide (291 aa) and a small mature chain (135 aa) (McNatty et al., 2004).

10
Figure 1.1 Linkage map position of GDF9 in the central portion of sheep chromosome 5 (Maddox et al., 2001).
Figure 1.2: GDF9 mRNA (EMBL-EBI)

11
Figure 1.3: GDF9 amino acid sequence (SWISS-PROT; UNIPROT) 1.4.4 Probable functions of GDF9 gene GDF9 was the first gene found to be essential for follicular development in sheep (Dong et al., 1996). The protein encoded by the GDF9 gene is involved in cumulus expansion, oocyte maturation, ovulation (Elvin et al., 1999, 2000), cumulus and granulosa cell proliferation (Hayashi et al., 1999). The changes in the concentration of GDF9 in vivo also exhibited increased ovulation rate in sheep (Galloway et al., 2000). GDF9 was the latest gene found to be strongly association with prolificacy in Cambridge and F700-Belclare sheep, animals heterozygous for the FecGH mutation were fertile while homozygous animals were sterile. The same phenomenon (sterile homozygous animals) was also observed for the BMP15 mutations (Hanrahan et al., 2004) (Table 1.1).
Table 1.1 Mutation in different fertility genes in sheep with their affect
IOR=Increased ovulation rate, IF=Increased fertility
12
1) Hanrahan et al., (2004) Biol. Reprod , 70(4):900-909. 2) Nicol et al., (2009) Reproduction, 138(6):921-933. 3) Silva et al., (2011) Anim. Genet, 42(1):89-92. 4) Galloway et al., (2000) Nat. Genet, 25(3):279-283. 5) Bodin et al., (2007) Endocrinology, 148(1):393-400. 6) Martinez-Royo et al., (2008) Anim. Genet, 39(3):294-297. 7) Monteagudo et al., (2009) Anim. Reprod. Sci 2009, 110(1-2):139-146. 8) Mulsant et al., (2001) Proc. Natl. Acad. Sci. USA 2001, 98(9):5104-5109. 9) Souza et al., (2001) J. Endocrinol, 169(2):R1-6. 10) Wilson et al., (2001) Biol. Reprod, 64(4):1225-1235
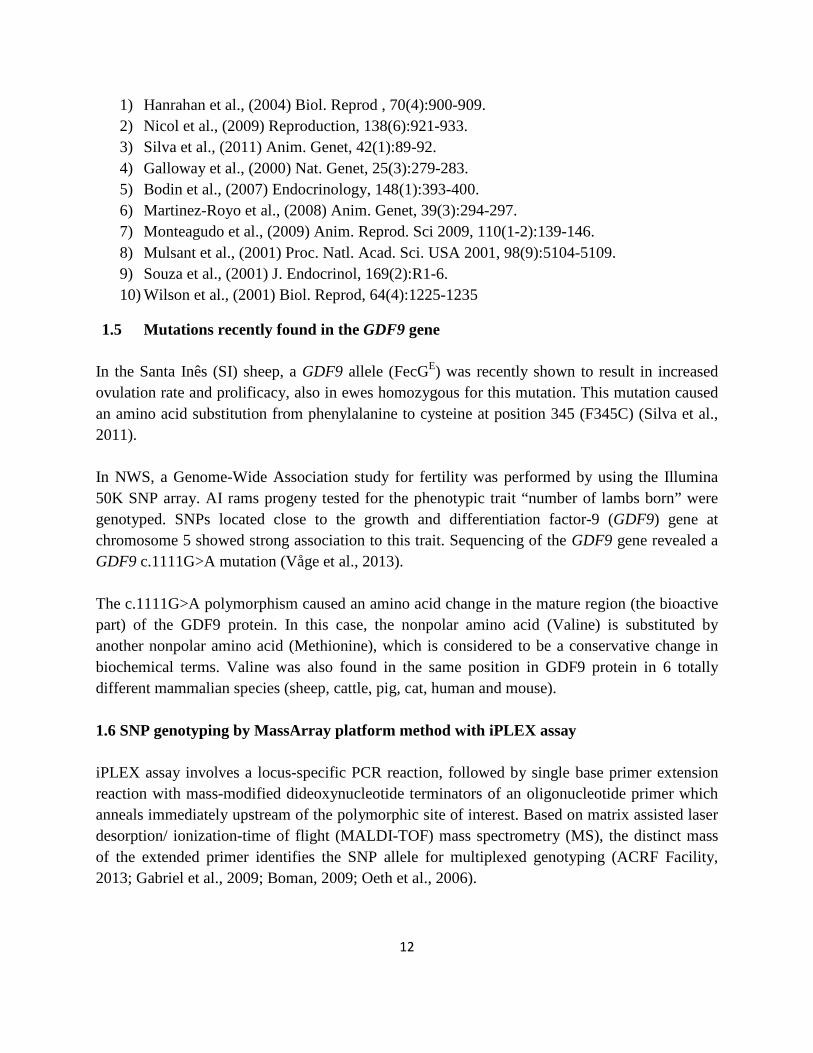
1.5 Mutations recently found in the GDF9 gene In the Santa Inês (SI) sheep, a GDF9 allele (FecGE) was recently shown to result in increased ovulation rate and prolificacy, also in ewes homozygous for this mutation. This mutation caused an amino acid substitution from phenylalanine to cysteine at position 345 (F345C) (Silva et al., 2011). In NWS, a Genome-Wide Association study for fertility was performed by using the Illumina 50K SNP array. AI rams progeny tested for the phenotypic trait “number of lambs born” were genotyped. SNPs located close to the growth and differentiation factor-9 (GDF9) gene at chromosome 5 showed strong association to this trait. Sequencing of the GDF9 gene revealed a GDF9 c.1111G>A mutation (Våge et al., 2013). The c.1111G>A polymorphism caused an amino acid change in the mature region (the bioactive part) of the GDF9 protein. In this case, the nonpolar amino acid (Valine) is substituted by another nonpolar amino acid (Methionine), which is considered to be a conservative change in biochemical terms. Valine was also found in the same position in GDF9 protein in 6 totally different mammalian species (sheep, cattle, pig, cat, human and mouse). 1.6 SNP genotyping by MassArray platform method with iPLEX assay iPLEX assay involves a locus-specific PCR reaction, followed by single base primer extension reaction with mass-modified dideoxynucleotide terminators of an oligonucleotide primer which anneals immediately upstream of the polymorphic site of interest. Based on matrix assisted laser desorption/ ionization-time of flight (MALDI-TOF) mass spectrometry (MS), the distinct mass of the extended primer identifies the SNP allele for multiplexed genotyping (ACRF Facility, 2013; Gabriel et al., 2009; Boman, 2009; Oeth et al., 2006).

13
According to the iPLEX® Gold Application Guide (SEQUENOME®, www.sequenome.com) SNP genotyping by MassARRAY include the following steps: i. DNA isolation and quantification ii. DNA amplification iii. Preparation of iPLEX Gold reaction products iv. Transfer of iPLEX Gold reaction products to SpectroCHIP® Arrays v. Defining the setup of assays and plates in the MassARRAY database vi. Acquisition of spectra using mass spectrometer vii. Analysis of spectral data. Different steps (Figure 1.4) in MassARRAY platform are shortly described below. To detect single nucleotide polymorphism (SNP) the isolated DNA should be of high purity. Genomic DNA is used to amplify the surrounding areas of the genetic variation (s) of interest. The genomic DNA should be amplified using PCR method. The PCR conditions for the iPLEX assay have been optimized for amplification of multiplexed reactions (upto 40 plexes). The SAP (Shrimp alkaline phosphatase) enzyme treatment is applied to neutralize unincorporated dNTPs in the PCR amplicons and convert them into dNDPs by cleaving. The conditioning or cleaning of extension products with Clean Resin is very important to optimize the mass spectrometry analysis of the iPLEX Gold Reaction products (Oeth et al., 2006). By using MALDI-TOF mass spectrometry the mass of the extended primer in the spectrum acquired thereby identifying the sequence and alleles at the polymorphic site of interest.

14
Figure 1.4: iPLEX Assay (The scheme depicts a single assay) (Gabriel et al., 2009; Oeth et al., 2006)

15
1.7 Aim of the Study
The EBVs for number of lambs born were estimated for the AI rams based on their daughters’ performance. According to the EBVs, daughters of AI rams being homozygous for c.1111A gave birth to 0.46 - 0.57 additional lambs compared to daughters of c.1111G homozygous wild rams. When the frequency of the c.1111G>A allele in the ewe population is low, only the rams will contribute this allele, while the phenotypic effect will be “shared” by the dams when calculating EBVs, and the allele effect will therefore be underestimated. Since only females are showing this trait, it was decided to genotype a larger number of ewes to observe the direct allelic effect of c.1111G>A on the numbers of lambs born. Moreover, we wanted to verify that homozygous ewes are fertile as indicated in the report of Hanrahan et al., 2004, investigating Cambridge and Belclare sheep.
The aim of this thesis is to estimate the phenotypic effect of the (c.1111G>A) mutation in nearly 900 NWS-ewes. The information available for these ewes is number of lambs born at age 1 year, and for a subset of this population, also the number of lambs born at age 2 year is available.

16
2 Materials and Methods
This chapter describes the materials and methods used in this thesis. An introduction to different steps of method; composition of master mix, reagents used and the settings for specific PCR reactions are given bellow:
2.1 Animals
Only flocks (farms) participating in a NWS ram circle were considered for inclusion in this study (1036 flocks). The flocks were ranked according to flock-mean breeding values (best linear unbiased prediction (BLUP-solutions)) for litter size at age 1 and age 2 year (two separate rankings). The flocks were also ranked according to flock average phenotypic litter size at age 1 and age 2 year (two separate rankings). The flocks that ranked in the best third (345) for all four traits were invited to participate. After a second ranking among those that were willing to participate, 15 different farms contributed in total 884 individual blood samples to this study. The ewes were born in 2010 and 2011. The blood samples were collected by local veterinarians. About 5 ml blood were collected from the jugular vein of each experimental ewe in vacutainers containing EDTA as anticoagulant.
2.2 SNP Genotyping by iPLEX MassARRY MALDI-TOF MS method
2.2.1 DNA isolation
Genomic DNA was extracted from 884 blood samples using DNeasy®96 Blood and Tissue kit (QIAGEN, Hilden, Germany) according to the manufacturer’s instruction. 100 μl blood sample was transferred into each microtube of 96-well plate from the EDTA mixed vacutainer. 96-Well-Register was used to maintain the identification of each sample. In each 96-well plate one well was filled with dionized water as “negative control”, while other 95 wells were filled with blood. 20 μl enzyme (proteinase K) and 100 μl of phosphate buffered saline (PBS) were added to each collection microtube. Then, 200 μl of cell lysis solution (Buffer AL) (without ethanol) was added to each microtube in the plate and the microtubes were sealed with caps; each plate was covered with clear cover, shacked vigorously up and down for 15 seconds and centrifuged at 3000 rpm for 1-2 minute in the SIGMA 4-15 C Centrifuge machine (LABEX, France). The plate was then incubated at 56˚ C for 10 minutes in Termaks incubator (Termaks, Norway). The caps and cover were remove carefully and 200 μl of ethanol (96-100%) was added to each blood samples, microtubes were sealed with caps and covered with a clear cover, shacked up and down vigorously for 15 seconds and centrifuged again for about 1-2 minutes at 3000 rpm. Each DNeasy 96 plate was placed on top of an S-Block. The caps and cover were removed and the total lysis mixture (around 620 μl) from each microtube of a 96-well plate was carefully transferred to well of each DNeasy 96 plate. Each DNeasy 96 plate was sealed with a AirPore Tape Sheet and centrifuged at 6000 rpm for 4 minutes. Plates were centrifuged several times at same speed until the lytate mixture completely passed through the membrane in each well of the

17
DNeasy 96 plates. 500 μl of first washing buffer (AW1) was added to each well and was ensured that ethanol was added according to the manufacturer’s instruction; each DNeasy 96 plate was sealed with AirPore Tape Sheet and centrifuged at 6000 rpm for 2 minutes. 500 μl of second washing buffer (AW2) was added to each sample and centrifuged for 15 minutes at 6000 rpm without sealing the DNeasy 96 plate. In elution step the DNeasy 96 plate was placed to a new rack of elution Microtubes RS. Total of 100 μl elution buffer (AE) was added to each sample by adding of 50 μl AE buffer, kept in room temperature for 1 minute and centrifuge at 6000 rpm for 4 min (twice). During each step of transfer of sample, buffer and so on multichannel pipettes were used. The final isolated DNA samples were stored in refrigerator at (-20) ˚C until the next step starts. Reagents used for DNA extraction from blood samples are given in Table 2.1.
Table 2.1 Reagents used in DNA extraction from blood in ewe
Reagents Volume (μl) per well
Proteinase K enzyme (lytate) 20
PBS buffer 100
AL buffer (without ethanol) 200
Ethanol (96-100%) 200
AW1 buffer (washing buffer) 500
AW1 buffer (washing buffer) 500
AE buffer (elution buffer) 100
Blood sample 100
2.2.2 DNA quantification
The concentration and purity of isolated DNA was measured using NanoDrop 8000 Spectrophotometer (Thermo Scientific, Waltham, Massachusetts, USA) by Absorbance method. About 1.5 μl isolated DNA was used for measuring the concentration and purity in each spectrophotometer well. The absorbance reading was recorded at 260 (A260) and 280 (A280) nm. Then the DNA concentration (ng/μl) and DNA purity (A260/280) was calculated. Good quality DNA should have A260/280 ratio of 1.8-2.2.

18
2.2.3 DNA amplification
2.2.3.1 Primer design For genotyping the GDF9 c.1111G>A SNP the Sequenom MassARRAY Workstation 4.O was used. The MassARRAY®Design software (www.sequenome.com) was used for designing both PCR primers and Mass EXTEND® primers for the multiplexed assay. Mass EXTEND® is a primer extension process designed to detect sequence differences at the single nucleotide level. A10-mer tag (5′-ACGTTGGATG-3′) was added on the 5′- end of each PCR primer for allowing greater flexibility in their masses. Table 2.2 shows the sequences of forward, reverse and extension primer pairs for c1111G>A SNP in ovine GDF9 gene in ewes at chromosome 5. In addition, 5 SNPs routinely tested in NWS AI rams were included in the same multiplex (multiplex 6). These are MSTN_c.120insA, MSTN_c.969delG, MSTN_c*1232G>A, BCO2_c.196C>T, MC1R_c361G>A. The primers of the above mentioned SNPs are shown in Table 2.2.
Table 2.2 Primers for GDF9_c1111G>A
SNP
Primer sequences
Forward Reverse Extension
MSTN_c120insA ACGTTGGATGCGAGCAGAAGGAAAATGTGG
ACGTTGGATGTATGGCTTCTAGTCTTGAGG
CTCCACAAGCATGCATT
MC1R_c361G_A ACGTTGGATGTGGTACAGCAGCTGGACAAT
ACGTTGGATGAAGCAGAGGCTGGACACCAT
GCTGCAGATGAGCACGT
BCO2_c196C_T ACGTTGGATGTTCTAACCACGGTGGAAGAG
ACGTTGGATGATAGCCATTGAGCCACTCAG
CGGTGGAAGAGACTCTG
MSTN_c960delG ACGTTGGATGTAAGGCCAATTACTGCTCTG
ACGTTGGATGTTGCTTGGTGCACAAGATGG
CAAGATGGGTATGAGGATA
MSTN_cS1232G_A ACGTTGGATGGGTTTACTGTCATTGTATTC
ACGTTGGATGGTTAAATCATTTTGGTTTGC
GTCATTGTATTCAAATCTCAAC
GDF9_c1111G_A ACGTTGGATGGCTTTAGTCAGCTGAAGTGG
ACGTTGGATGCAGTCCCCTTTACAGTATCG
TGAAGTGGGACAACTGGATT
2.2.3.2 Primer dilution
Both PCR primers and Extend primers were transferred from stock plates into 96-well Sarstedt plates by Beckman®FX (Beckman Coulture, CA, USA) pipetting robot. The concentration for PCR primers (forward and reverse) and Extend primers (without dilution) was 50 μM each and 500 μM, respectively for the PCR protocols.

19
2.2.3.3 Polymerase Chain Reaction (PCR) The cocktail mix for the first PCR in SEQUENOME iPLEX reaction in MassARRAY method was calculated automatically using the “HotStar” PCR-program. Reactions were performed in 384 formats by liquid handling process. PCR master mix was made in Ultraviolet Sterilizing PCR Station using the iPLEX Multiplexed PCR cocktail mix (same multiplexed assay, different DNA) kit protocol (SEQUENOME, San Diego, CA, USA) and the set up for PCR reaction in a 384-well PCR plate was by Beckman®FX (Beckman Coulture, CA, USA) pipetting robot. The plates were the sealed and the “HotStar” program was run in Veriti 384-Well Thermal Cycler (Applied Biosystems, Foster city, CA, USA) in a specific settings. Table 2.3 and Table 2.4 showing the composition of cocktail mix for PCR reaction and PCR cycle, respectively.
Table 2.3: Master mix for PCR to obtain ovine specific c1111G>A amplicon
Reagent Final Conc. Volume 1x
dH2O NA 0.750 Hotstar Taq PCR buffer (10x)
Containing 15 mM MgCl2 1.875 mM MgCl2 0.625
dNTP mix (25 mM) 500 μM each 0.100
Primer mix (500 nM each) 100 nM each 1.000
MgCl2 (25 mM) 1.625 mM 0.325 HotStar Taq (5U/μl) 1 U/rxn 0.200
Total 3.00 μl Genomic DNA (5-10 ng/μl) 2.00 μl 2-10ng/rxn
Total 5.00 μl
Table 2.4: PCR cycle adjusted for the amplification of c1111G>A in ewe
Reactions Temperature °C Time Repeats
Initial denaturation 95 5 min 1 cycle
Denaturation 94 30 sec. 40 cycles Annealing 56 30 sec.
Extension 72 1 min
Final extension 72 3 min 1 cycle
Hold 4 Forever Final step

20
2.2.4 Dephosphorylation of dNTPs (SAP Reaction)
SAP enzyme cocktail mix was mixed with the genomic DNA on 384-well micro pipetter following SEQUENOME SAP enzyme cocktail mix protocol by Biomek® FX (Beckman Coulture, CA, USA) robot and was set into Veriti 384-Well Thermal Cycler. No primer was added in this step. The SAP cocktail mix and the thermal cycle are given in Table 2.5 and Table 2.6 below:
Table 2.5: Master mix for SAP enzyme cocktail mix
Reagent Volume 1x
dH20 1.53 μl
SAP buffer (10x) 0.17μl
Shrimp alkaline phosphatase (SAP) 0.30 μl
Total 2.00 μl
Table 2.6: Thermal cycle for SAP program
Temperature ° C Time Repeats
37 40 min 1 cycle
85 5 min 1 cycle
4 forever Final step
2.2.5 iPLEX Gold Reaction /Extension Reaction To optimize the extension primers, the masses of primers were divided into low mass group and high mass group and the master mix for iPLEX Gold Reaction cocktail was mixed with the SAP treated PCR products by Biomek® FX pipetting (Beckman Coulture, CA, USA) robot and set for extension PCR reaction into Veriti 384-Well Thermal Cycler. All primers in the high mass group were doubled in concentration with respect to the low mass group. Composition of iPLEX Gold Reaction cocktail (Table 2.7) and the thermal cycles (Table 2.8) are shown below.

21
Table 2.7: Master mix for iPLEX Gold Reaction cocktail
Reagent Final Conc. Volume 1x (μl)
dH20 NA 0.619
iPLEX Plus buffer (10x) 0.222x 0.20
iPLEX termination mix 1x 0.20
Primer mix (7μM, 9μM,11μM,14μM) - 0.940
iPLEX enzyme 1x 0.041
Total 2.00 μl
Table 2.8: Thermal cycle for iPLEX Gold Reaction
Steps Temperature° C Time Repeats
Initial denaturation 94 30 sec 1 cycle
Denaturation) 94 5 sec 40 cycles Annealing 52 5 sec 5 cycles
Extension 80 5 sec
Final extension 72 3 sec 1 cycle
Hold 4 Forever
2.2.6 Conditioning the iPLEX Gold Reaction products/ Desalting 6 mg of Clean Resin was added into each well of a 384 dimple plate according to manufacturer’s instruction (SEQUENOM, CA, USA) and was kept for 20 min at room temperature. iPLEX Gold Reaction products in 384-microplate was diluted with 16 μl nanopure water in each well using the robot by the “hME_4x_Wash_Water_Add” method and thereafter Resin was added , sealed with cover and was rotated at room temperature for minimum 5 min. Sealed 384-microplate was centrifuged for 5 min. at 1600 rpm. iPLEX Gold Reaction products were ready for dispensing to SpectroCHIP®Array. 2.2.7 Dispensing of iPLEX Gold reaction products to SpectroCHIP® Arrays
To dispense the iPLEX Gold reaction products to a 384-well SpectroCHIP® Array in SEQUONOME MassARRAY™Nanodispenser (SEQUENOME) was used. By MassARRAY

22
nanodispenser small amount of samples (~15 nl) were transferred onto 384 SpectroCHIP® array from the 384-microplates and for the calibration the calibrant was transferred from calibration well onto the calibrant patches of the 384 chip. This step was done by using SpectroPint program. 2.2.8 Defining the setup of assays and plates in the MassARRAY After the completion of nanodispension onto the SpectroCHIP®, the assay and plates were designed in the MassARRAY database using Assay Editor 4.0 and Plate Editor 4.0 software.
2.2.9 Acquisition and Analyzing of spectra using mass spectrometer
Genotype calling and results of SpectroCHIP®Array was placed into MALDI-TOF by mass spectrometer and by MassARRAY Analyzer 4. 0 (SEQUENOME) mass correlation genotype was determined in real time. The Call Rate and Extension Rate were calculated by Caller 4.0 software in Microsoft Excel 2010 (Microsoft Corp., www.microsoft.com) and peak areas were calculated by TYPER 4.0 software. The calculated rates and peaks were then transferred to Minitab for analysis. One-way analysis of variance (ANOVA) was conducted using Minitab software (Minitab Inc., www.minitab.com).
2.2.10 Statistical Analysis
Data were sorted as required for the model used. The main issue was to measure the effect of GDF9_c.1111G>A SNP genotypes on two differently correlated fertility traits; number of lambs born at age 1 year (LS1) and age 2 years (LS2) of aged Norwegian White ewes. However, the additional 5 SNPs in the multiplex were also tested to exclude any possible effect on fertility The dataset with genotypes of 6 SNPs was converted from excel to a plain text file for analysis. Traits were adjusted for fixed effects of genotype and flock year. Best fitted bivariate analyses in the linear model in GLM (generalized linear model) procedure were used to estimate the allelic effect on the phenotypes, LS1 and LS2 by SAS (Version 9.2) program (SAS Institute Inc., Cary, NC, USA). The following model was used for multivariate comparison in litter size among three different genotypes Yij = μ + Gi + FYj + eij, where, Yij is the phenotypic value of number of lams born ; μ is the population mean; Gi is the fixed effect of the ith genotype (GG, GA and AA) ; FYj is the fixed effect of the jth flock year (j = 1, 2…..,30) and eij is the residual effect of each observation. Flock year is the combination of farm number and birth year (2010-2011) of lambs. Least-square means procedure was applied for significant difference test (Cao et al., 2010).

23
3 Results
This chapter represents the results obtained from the SNP genotyping and statistical analysis. SNP genotyping was conducted using MassARRAY platform method. SAS 9.2 software was used for analyzing descriptive statistics and genotypic effect of GDF9_c.1111G>A on two differently closely linked traits i.e. number of lambs born at 1 year (LS1) and 2 years (LS2) of age of in Norwegian White ewes by GLM (generalized linear model) model. Snap shorts for SAS commands and results are given in Appendix.
3.1 DNA measurement
The concentration of extracted DNA was measured as ng/μl. Ideal range of A260/280 ratio purity of DNA is 1.8-2.2. Not all samples had sufficiently high concentration and/or purity results. The variation for the A260/280 among the samples was high and the DNA concentration for each sample was not high. The A260/280 was not adjusted in this study and the quality of the samples was just routinely measured. The purity and DNA concentration of the samples indicated that they were suitable for the PCR step in SNP genotyping method.
3.2 Genotyping The success rate of genotyping was more than 90%. Some animals received “no call”, which means that it is not possible to obtain a reliable genotype. The BCO2_c.196C>T SNP’s genotype quality was generally bad, and was deleted from the dataset. The final dataset consisted of genotypes for the 5 SNPs remaining SNPs for all experimental ewes.
3.3 Animals
Among the 884 initially genotyped ewes a total of 853 animals were found to have both a reliable genotype and phenotypic information available. Of these, 364 were born in 2010 and 489 in 2011. Number of lambs born of ewes at age 1 year (LS1) and age 2 year (LS2) were registered in the 15 different flocks included in the study during 2011 and 2012. Animals born on 2010 have data on LS1 and LS2, but animals born on 2011 only have information of LS1.
3.4 Descriptive Statistics of the GDF9 SNP
The overall allelic frequency was 0.623 for the GDF9_c.1111G allele and 0.377 for the c.1111A allele. The number of ewes in our study being homozygous (GG) for wild type allele (c.1111G), heterozygote (GA) and homozygote (AA) for mutant allele (c.1111A) were 337, 388 and 128, respectively (Table 3.1). Among the animals genotyped for the GDF9_c.1111G>A SNP , 364 ewes have LS1 data and 489 ewes have LS2 data, respectively. The number of ewes and number of lambs at 1 year and 2 years with each genotype are shown in Table 3.2.

24
Table 3.1: Genotype and allele frequency of c.1111G>A in Norwegian White Ewes
Genotype Number of ewes Frequency of Genotype
GG 337 0.40
GA 388 0.45
AA 128 0.15
Table 3.2: Number of ewes and lambs born (LS) per genotype
Phenotype Number of
Ewes
Number of Lambs born
Number of Lambs born for different genotypes
GG GA AA
LS1 364 743 298 332 113
LS2 489 359 146 169 44
Total 444 501 157
3.5 Statistical Analysis The SAS package version 9.2 was used for analyzing the data. After genotyping 853 ewes for MRC1_c.361G>A, 788 ewes for MSTN_c.S1232G>A , 848 ewes for MSTN_c.960delG>A,845 ewes for MSTN_c.120insA and 853 ewes for GDF9_c.1111G>A, SNPs genotype were analyzed according to the given statistical model. As expected only the GDF9_c.1111G>A mutation showed any effect on number of lambs born alive at 1 year (LS1) and 2 years (LS2). Therefore, further statistical analysis was only conducted for the GDF9_c.1111G>A SNP.
The mean litter size at 1 year was 2.061±0.73 (mean±sd) and at 2 years it was 2.671±0.91. The genotype showed significant effect on litter size (p<0.0001) at both 1 year and 2 year. The mean and least square means (lsmeans) for number of lambs born at 1 year and 2 years per genotypes are shown in Table 3.3. The mean litter size at 2 years is bigger than that of 1 year. The lsmeans among the genotypes for the phenotypic number of lambs born at 2 year also differed from 1 year and was higher indeed. Ewes that were homozygous for the mutant GDF variant (AA) produced the largest litter size for both years, whereas animals homozygous for the wild type had the smallest litter size and heterozygous had an intermediate litter size. Ewes homozygous for c.1111A gave birth to more lambs than their contemporaries (GG and GA). The difference in genotype mean was highest between animals with homozygous wild type and homozygous

25
mutant allele for both traits. Also for lsmeans ewes with mutant homozygote allele had larger litter size than other genotype groups for both phenotypes. The mean of litter size per genotypes for first and second year are shown in Figure 3.1 and Figure 3.2.
Table 3.3: Mean and least-square means of LS per genotype
Phenotype Genotypes Means±sd lsmeans
LS1
GG 1.922±0.674 1.955
GA 2.066±0.705 2.085
AA 2.415±0.831 2.496
Mean 2.061±0.736
LS2
GG 2.349±0.784 2.271
GA 2.834±0.835 2.777
AA 3.113±1.145 3.141
Mean 2.671±0.921
Figure 3.1: Average litter size at 1 year of age per genotype

26
Figure 3.2: Average litter size at 2 year of age per genotype
The genotype has a significant effect on LS1 and LS2 phenotypes. The difference was largest between animals homozygous for the wild type allele and those homozygous for the mutant, both for LS1 and LS2. The effect of genotype on number of lambs born was significant (p<0.0001) for both phenotypes. Farm year only proved significance for second year (p=0.4682) but did not shown a significant effect on second year (Table 3.4).
Table 3.4: Effect of different sources on phenotype
Phenotype
Effects
Genotype Farm_yr
F value Pr > F F value Pr > F
LS1 21.21 <0.0001 2.00 0.0015
LS2 20.65 <0.0001 0.98 0.4682
Difference between least square means of three different genotypes (GG, GA and AA) is shown in Table 3.5. Ewes with the mutant allele (homozygous) showed highest difference in mean number of lamb production (0.541-0.87) compared to the wild homozygous contemporaries. For the heterozygous (GG vs GA) the difference was lowest among the three difference groups. But the GA vs AA group is different from the other two genotype groups.

27
Table 3.5: Least means for LS contrasts between GDF9 c.1111 genotypes
Phenotype GG vs GA GA vs AA GG vs AA
LS1 0.13 0.411 0.541
LS2 0.506 0.364 0.87
All three genotypes for Least-square means differed from each other. For phenotype LS1, the homozygous mutant ewes had significant difference (p<0.0001) from both the wild type homozygote ewes and from the heterozygote and these two genotype groups also differed from each other (p=0.0234l). Least-square means for LS2, homozygous ewes (AA) also differed significantly from wild type ewes (p<0.0001) and heterozygous ewes (p<0.05). Wild type ewes had difference (p<0.0001) in litter size than the other two genotype groups, while heterozygote individuals showed difference from mutant homozygote (p<0.05) and wild type individuals (p<0.0001) (Table 3.6).
Table 3.6: Adjusted p- values for pair wise LS-means difference of effect genotype for LSs
LS1 GG GA AA
GG - 0.0234 <0.0001
GA 0.0234 - <0.0001
AA <0.0001 <0.0001 -
LS2
GG - <0.0001 <0.0001
GA <0.0001 - 0.0175
AA <0.0001 0.0175 -
The data on litter size at 1 year and 2 years for three different genotypes are shown in Table 3.7. Total number of lambs produced by homozygote mutant ewes was smallest among the three genotype groups for both phenotypes. More lambing data was available for 1 year than for the 2 year phenotype. Number of lambs born per genotype differed greatly from each other in this study. Wild type homozygote ewes had the highest number of lambs born at 1 year and heterozygote ewes had highest for 2 year than their contemporaries in this study. Ewes homozygote for c.1111A had the lowest number of observations for 1, 2 and 3 lambs for both

28
phenotypes and both year than the other two genotype groups. Homozygote (mutant) ewes at first year (10) and heterozygote ewes at second year (31) produced the highest incidence for 4 lambs among the three genotype groups. No observation found on 5 lambs at first year but all three genotype had incidence of 5 lambs at second year lambing. The only incidence (1) of 6 lambs at 1 year and 2 year of lambing was observed in wild homozygote and mutant homozygote, respectively while two other genotypes did not have any incidence of 6 lambs in any of the two year of ewe lambing.
Table 3.7: Number of lambs born per genotype with different observations
Genotypes No. of lambs at 1yr Total No. of lambs at 2yr Total
1 2 3 4 5 6 1 2 3 4 5 6
GG 70 188 35 4 0 1 298 21 59 61 4 1 0 146
GA 65 187 73 7 0 0 332 7 51 77 31 3 0 169
AA 15 46 46 10 0 0 113 5 5 19 11 3 1 44
150 421 150 21 0 1 743 33 157 157 46 7 1 359

29
4. Discussion
The number of live lambs born per breeding ewe is an important trait in commercial sheep breeding, since the litter size largely determines the amount of meat produced per ewe. In this study we have investigated the phenotypic effect of a mutation in the ovine GDF9 that recently has been reported to segregate in the Norwegian White Sheep population (Våge et al., 2013). A material of 853 ewes has been genotyped for the GDF9 c.111G>A mutation. All three possible genotypes (GG, GA and AA) were well represented in the genotyped material, making it possible to perform reliable comparisons between the different genotype groups. We found that the phenotypic effect of the mutation was smaller for ewes at 1 year of age compared to ewes at 2 years of age. Since the average number of lambs born also is lower for ewes at 1 year of age compared to those at 2 years of age, this is not very surprising. However, since this material is limited to ages of 1 and 2 year, we cannot conclude whether the effect of the mutation can be even bigger for ewes older than two years. The phenotypic effect of being homozygous for the mutant allele at age 1 year was 0.54, while the effect of being homozygous for the mutant allele at age 2 year was 0.87. This is a higher phenotypic effect than reported by Våge et al., 2013, supporting the assumption of these authors that the phenotypic effect based on the EBVs of the AI rams is slightly underestimated. The frequency for c.1111A allele was found to be 0.38 in this NWS experimental ewe population. This is a relatively high frequency compared to the corresponding frequency among the NWS AI rams (Våge et al., 2013). However, one must keep in mind that our experimental ewe population is heavily selected for large litter size. Given the strong association between this allele and litter size, there is reason to believe that this selection has influenced the frequency among these ewes. It is therefore likely that the frequency in the general ewe population is lower than this. However, by using this highly selected ewes in the present study we succeeded in obtaining a reasonable high number of animals in all the three genotypic classes (337 GG, 388 GA, 128 AA), making it possible to get a reliable estimate of the effect of the c.1111A allele. The reason for the increased frequency of c.1111A allele in Norwegian White Sheep AI ram population and also among the ewes (as shown in this study), may be due to the introduction of Finnish Landrace sheep in Norway for genetic improvement of NWS in 1960s and 1970s, also supported by Vage et al., (2013); Donald and Read (1967) and Ercanbrack and Knight (1985). Finnish Landrace or Finnsheep is a prolific (multiple births are very common) sheep breed and its crosses with other sheep breeds have been recognized for their higher fertility. Increased meat production in Norway can be obtained increasing litter size by selection, both traditional phenotypes based breeding and/or by using the c.1111A allele for genotype assisted selection. However, NWS is a small size sheep and it might have some impact with really big LS

30
in ewes. No adverse effect on ewe has yet been reported in NWS ewes, but higher number of lambs born can cause lower birth weight and increased post-natal mortality. So, an optimum number of lambs born should be desired for Norwegian White ewes. The Norwegian Sheep and Goat Breeder’s association will take the decision how the ram with c.1111A allele will be used in Norwegian White sheep breeding program. The genotyping success rate in this study was more than 90% and it can be said that the quality of the extracted DNA was generally good. The “no calls” obtained during genotyping might be due to technical error, human error or poor DNA in some samples.

31
5. Reference List
Abdulkhaliq,A.M., Harvey,W.R., and Parker,C.F., (1989). Genetic parameters for ewe productivity traits in the Columbia, Suffolk and Targhee breeds. Journal of Animal Science, 67: 3250.
Ådnøy,T., (1988). Selection for prolificacy in Finnsheep and Norwegian sheep. Journal of
Agricultural Science Finland, 60, 518–522. Australia Cancer Research Foundation (ACRF) Facility. http://www.garvan.org.au/facilities
http://linkage.garvan.unsw.edu.au/ACRF/snp_genotyping.html. 2013 (retrieved 16-3-2013). Bindon,B.M., Piper,L.R., and Hillarda,M.A., (1996). In: Prolific Sheep. (Fahmy MH, ed), CAB
International, Wallingford, UK. Bodensteiner, K.J., Clay,C.M., Moeller,C.L., and Sawyer,H.R., (1999). Molecular Cloning of the
Ovine Growth/Differentiation Factor-9 Gene and Expression of Growth/Differentiation Factor-9 in Ovine and Bovine Ovaries.Biology of Reproduction,60:381–386
Boman,I,A., (2009). Mutations in the Myostatin (MSTN) Gene in Norwegian Sheep. Thesis,
Department of Animal and Aquacultural Sciences, Norwegian University of Life Sciences, Ås. ISBN 978-82-575-0888-3. p. 100.
Cao,G.L., Chu,M.X., Fang,L., Di,R., Feng,T., and Li,N., (2010). Analysis on DNA sequence of
KiSS-1 gene and its association with litter size in goats. Molecular Biology Reports, 37:3921–3929.
Chang,H., Brown,C.W., and Matzuk,M.M., (2002). Genetic analysis of the mammalian
transforming growth factor-superfamily. Endocrine Reviews, 23:787–823. D'Arcy,J.B., (1990). In: Sheep Management and Wool Technology (Williams YJ, Walker GP and Doyle PT, Eds), New South Wales University Press: Kensington, Sydney, Australia, 248. Davis,G.H., Montgomery,G.W., Allison,A.J., Kelly,R.W., and Bray,A.R., (1982). Segregation of
a major gene influencing fecundity in progeny of Booroola sheep. New Zealand Journal of Agricultural Research, 25:525–529.
Donald,H.P., and Read,J.L., (1967). Performance of Finnish Landrace Sheep in Britain. Animal
Production, 9:471. Dong,J., Albertini,D.F., Nishimori,K., Kumar,T.R., Lu,N., and Matzuk,M. (1996). Growth
differentiation factor-9 is required during early ovarian folliculogenesis. Nature, 383:531–535.
Durlinger,A.L.L., Visser,J.A., and Themmen,A.P.N., (2002). Regulation of ovarian function: the role of anti-Mullerian hormone. Reproduction, 124:601–609

32
Elvin,J.A., Clark,A.T., Wang,P., Wolfman,N.M., and Matzuk,M.M., (1999). Paracrine actions of growth differentiation factor-9 in the mammalian ovary. Molecular Endocrinology, 13:1035–48.
Elvin,J.A., Yan,C., and Matzuk,M.M., (2000). Growth differentiation factor-9 stimulates
progesterone synthesis in granulosa cells via a prostaglandin E2/EP2 receptor pathway. Proceedings of the National Academy of Sciences of the United States of America 97: 10288–93.
Eikje,L.S., Ådnøy,T., and Klemetsdal,G., (2008). The Norwegian sheep breeding scheme:
description, genetic and phenotypic change. Animal, 2(2):167–176. Eppig,J.J., (2001). Oocyte control of ovarian follicular development and function in mammals.
Reproduction, 122:829–838. Frank, O., (2012). Reproductive health: The demography of fertility and infertility. Geneva
Foundation for Medical Education and Research. (http://www.gfmer.ch/Books/Reproductive_health/The_demography_of_fertility_and_infertility.html). Retrieved on 22 March, 2013.
Gabriel,S., Ziaugra,L., and Tabbaa,D., (2009). SNP genotyping using the Sequenom MassARRAY iPLEX platform. Current Protocols in Human Genetics, 60:2.12.1- 2.12.18.// Chapter 2: Unit 2.12.
Galloway,S.M., McNatty,K.P., Cambridge,L.M., Laitinen,M.P., Juengel,J.L., Jokiranta,T.S.,
McLaren,R.J., Luiro,K., Dodds,K.G., Montgomery,G.W., Beattie,A.E., Davis,G.H., and Ritvos, O., (2000). Mutations in an oocyte-derived growth factor gene (BMP15) cause increased ovulation rate and infertility in a dosage-sensitive manner. Nature Genetics, 25:279–283.
Gilchrist,R.B., Lane,M., and Thompson,J.G., (2008). Oocyte-secreted factors: Regulators of
cumulus cell function and oocyte quality. Human Reproduction Update, 14:159–177. Hanrahan,J.P., Gregan,S.M., Mulsant,P., Mullen,M., Davis,G.H., Powell,R., and Galloway,S.M.,
(2004). Mutations in the genes for oocyte-derived growth factors GDF9 and BMP15 are associated with both increased ovulation rate and sterility in Cambridge and Belclare sheep (Ovis aries). Biology of Reproduction, 70:900–909.
Hayashi,M., McGee,E.A., Min,G., Klein,C., Rose,U.M., van Duin,M., and Hsueh,A.J., (1999). Recombinant growth differentiation factor-9 (GDF-9) enhances growth and differentiation of cultured early ovarian follicles. Endocrinology, 140:1236-44.
Javanmard,A., Azadzadeh,N., and Esmailizadeh,A. K., (2011). Mutations in bone morphogenetic
protein 15 and growth differentiation factor 9 genes are associated with increased litter size in fat-tailed sheep breeds. Veterinary Research Community, 35:157–167.

33
Juengel,J.L., Bodensteiner,K.J., Heath,D.A., Hudson,N.L., Moeller,C.L., Smith,P., Galloway, S.M., Davis,G.H., Sawyer,H.R., and McNatty,K.P., (2004). Physiology of GDF9 and BMP15 signaling molecules. Animal Reproduction Science, 82–83:447–460.
Juengel,J.L., and McNatty,K.P., (2005). The role of protein of the transformation growth factor-
beta superfamily in the intraovarian regulation of follicular development. Human Reproduction Update, 11:144-161.
Knight,P.G., and Glister,C., (2001). Potential local regulatory functions of inhibins, activins and
follistatin in the ovary. Reproduction, 121:503–512. Larsgard,A.G., and Standal,N., (1999). Introduction of East Friesian dairy sheep into the
Norwegian sheep population. Small Ruminant Research, 33, 87–98. Maddox,J.F., Davies,K.P., Crawford,A.M., Hulme,D.J., Vaiman,D., Cribiu,E.P., Bradley,A.,
Freking,B.A., Ken,J., Beh,K.J., Cockett,N.E., Kang,N., Riffkin,C.D., Drinkwater,R., Moore,S.S., Dodds,K.G., Joanne,M., Lumsden,J.M., Van-Stijn,T.C., Phua,S.H., Adelson,D.L., Burkin,H.R., Broom,J.E., Buitkamp,J., Cambridge,L., Cushwa,W.T., Gerard,E., Galloway,S.M., Harrison,B., Hawken,R.J., Hiendleder,S., Henry,H.M., Medrano,J.F., Paterson,K.A., Schibler,L., Stone,R.T., and van-Hest,B., (2001). An Enhanced Linkage Map of the Sheep Genome Comprising More 1000 loci. Genome Research, 11: 1275-1289.
Mandon-Pepin,B., Oustry-Vaiman,A., Vigier,B., Piumi,F., Cribiu,E., Cotinot,C., (2003). Expression profiles and chromosomal localization of genes controlling meiosis and
follicular development in the sheepovary. Biology of Reproduction, 68:985–995 Martinez-Royo,A., Jurado,J.J., Smulders,J.P., Marti,J.I., Alabart,J.L., Roche,A., Fantova,E.,
Bodin,L., Mulsant,P., Serrano,M., Folch,J., and Calvo,J.H., (2008). A deletion in the bone morphogenetic protein 15 gene causes sterility and increased prolificacy in Rasa Aragonesa sheep. Animal Genetics, 39:294–297.
Matzuk,M.M., Burns,K.H., Viveiros,M.M., and Eppig,J.J., (2002). Intercellular communication
in the mammalian ovary: Oocytes carry the conversation. Science, 296:2178–2180. McNatty,K.P., Moore,L.G., Hudson,N.L., Quirke,L.D., Lawrence,S.B., Reader,K., Hanrahan,J.P,
Smith,P., Groome,N.P., Laitinen,M., Ritvos,O., and Juengel,J.L., (2004). The oocyte and its role in regulating ovulation rate: a new paradigm in reproductive biology. Reproduction, 128(4):379-86.
Monteagudo,L.V., Ponz,R., Tejedor,M.T., Lavina,A., and Sierra,I., (2009). A 17 bp deletion in the bone morphogenetic protein 15 (BMP15) gene is associated to increased prolificacy in the Rasa Aragonesa sheep breed. Animal Reproduction Science, 110, 139–146.
Montgomery,G.W., McNatty,K.P., and Davis,G.H., (1992). Physiology and molecular genetics
of mutations that increase ovulation rate in sheep. Endocrine Reviews, 13:309–328.

34
Moore,R.K., Otsuka,F., and Shimasaki,S., (2003). Molecular basis of bone morphogenetic protein-15 signaling in granulose cells. Journal of Biological Chemistry, 278: 304-310.
Mulsant,P., Lecerf,F., Fabre,S., Schibler,L., Monget,P., Lanneluc,I., Pisselet,C., Riquet,J.,
Monniaux,D., Callebaut,I., Cribiu,E., Thimonier,J., Teyssier,J., Bodin,L., Cognie,Y., Chitour,N., and Elsen,J.M., (2001). Mutation in bone morphogenetic protein receptor-IB is associated with increased ovulation rate in Booroola Merino ewes. Proceeding of the National Academy of Sciences of the United States of America, 98:5104–5109.
Nicol, L., Bishop,S.C., Pong-Wong, R., Bendixen,C., Holm,L-E., Rhind, S.M., and McNeilly,
A.S., (2009). Homozygosity for a single base-pair mutation in the oocyte specific GDF9 gene results in sterility in Thoka sheep. Reproduction, 138:921–933.
Nitter,G., (1985). Economic response to increase the genetic potential for reproductive
performance. In: New Techniques in Sheep Production (Faize I, Maraim M and Owen JP, Eds), Butterworths, London, UK, 271-280.
NORDGEN, (2013). (Nordic Genetic Resource Center) - Norwegian White Sheep. Retrieved 25-
2-2013. Notter, D.R., (2008). Genetic aspects of reproduction in sheep. Reproduction of Domestic
Animal, 43(2):122-128. NSG, (2013). National sheep recording system (Norwegian Sheep and Goat Association).
Retrieved on 12-3-2013. Oeth,P., Beaulieu,M., Park,C., Kosman,D., del Mistro,G., van den Boom,D., and Jurinke,C.,
(2006). iPLEX™ Assay: Increased Plexing Efficiency and Flexibility for MassARRAY® System Through Single Base Primer Extension with Mass-Modified Terminators. SEQUENOME® Application Note. www.sequenome.com.
Otsuka,F., McTavish,K.J., and Shimasaki,S., (2011). Integral Role of GDF-9 and BMP-15 in
Ovarian Function. Molecular Reproduction and Development, 78:9–21. Piper,L.R., and Bindon,B.M., (1982). The Booroola Merino and the performance of medium
non-peppin crosses at Armidale. In: Piper, L. R., Bindon, B. M., and Nethery, R. D. (Eds.), The Booroola Merino. Proceedings of a Workshop, Armidale, 24-25 August 1980, CSIRO, pp. 9–19.
Piper,L.R., Bindon,B.M., and Davis,G.H., (1985). The single gene inheritance of the high litter
size of the Booroola Merino. In: Genetics of Reproduction in Sheep, (Land RB and Robinson DW, Eds.), Butterworths, London, UK, 115–125.
Rajab, M.H., Cartwright,T.C., Dahm,P.F., and Figueiredo, E.A., (1992). Performance of three
tropical hair sheep breeds. Journal of Animal Science, 70:3351–3359.

35
Silva,B.D.M., Castro,E.A., Souza,C.J., Paiva,S.R., Sartori,R., Franco,M.M, Azevedo,H.C., Silva, T.A., Vieira,A.M., Neves,J.P., and Melo,E.O., (2011). A new polymorphism in the Growth and Differentiation Factor 9 (GDF9) gene is associated with increased ovulation rate and prolificacy in homozygous sheep. Animal Genetics, 42(1):89-92.
Souza,C.J., MacDougall,C., MacDougall,C., Campbell,B.K., McNeilly,A.S., and Baird,D.T.,
(2001). The Booroola (FecB) phenotype is associated with a mutation in the bone morphogenetic receptor type 1 B (BMPR1B) gene. Journal of Endocrinology, 169(2):R1–R6.
Steinheim,G., Ødegård,J., Ådnøy,T., and Klemetsdal,G., (2008). Genotype by environment
interaction for lamb weaning weight in two Norwegian sheep breeds. Journal of Animal Science, 86:33–39.
Su,Y.Q., Sugiura, K., and Eppig,J.J., (2009). Mouse oocyte control of granulosa cell
development and function: Paracrine regulation of cumulus cell metabolism. Seminars in Reproductive Medicine, 27:32–42.
Våge,D.I., Maren,H.M., Kent,M.P., Klemetsdal,G., and Boman,I.A., (2013). A missense
mutation in growth differentiation factor 9 (GDF9) is strongly associated with litter size in sheep. BioMed Central Genetics, 14(1):1-8.
Valdez-Nava Y., (2011). Genotype by environment interaction effect on lamb weaning weight in
Norwegian White Sheep. Master’s Thesis: Norwegian University of Life Sciences, Department of Animal and Aquaculture Sciences.
Well Gully, (2013). www.wellgully.com.au. Retrieved on 20 March, 2013. Wilson,T., Wu,X.Y., Juengel,J.L., Ross,I.K., Lumsden,J.M., Lord,E.A., Dodds,K.G.,
Walling,G.A., McEwan,J.C., O’Connell,A.R., McNatty,K.P., and Montgomery,G.W., (2001). Highly prolific Booroola sheep have a mutation in the intracellular kinase domain of bone morphogenetic protein IB receptor (ALK-6) that is expressed in both oocytes and granulosa cells. Biology of Reproduction, 64:1225–123
Citation Fertility: http://www.biology-online.org/dictionary/Fertility. Retrieved on 22 March, 2013. EMBL-EBI database: http://www.ebi.ac.uk. Retrieved on 21 March, 2013.
SWISS-PROT database: http://www.ebi.ac.uk/swiss-prot. Retrieved on 25 March, 2013.
UNIPROT database: http://www.ebi.ac.uk. Retrieved on 25 March, 2013.
SEQUENOME: www.sequenome.com. Retrieved on 20 February, 2013

36
6. Appendix
Commands used in SAS 9.2 Editor for ananlysis
Commands used for the model for bivariate analysis

37
Measurement of frequency for Flock_yr (Flock year)
Measurement of frequency for different Genotypes (GG=1, GA=2, AA=3)

38
Measurement of frequency of Flock_no (Flock number)
Measurement of frequency of Birth_yr (Birth year)
39
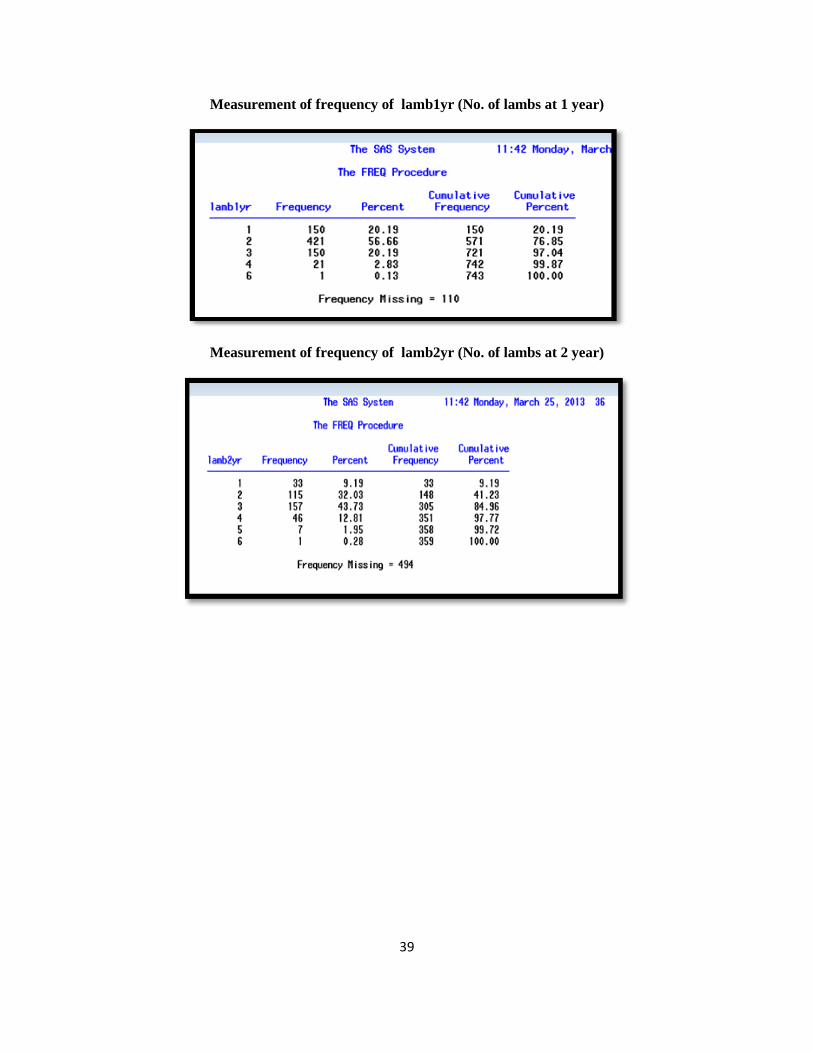
Measurement of frequency of lamb1yr (No. of lambs at 1 year)
Measurement of frequency of lamb2yr (No. of lambs at 2 year)

40
Frequency table of Flock_yr by Genotype (3 tables)

41
Frequency table of Birth_yr by Genotype

42
Frequency table of Flock_no by genotype (2 tables)

43
Ferquency table of lamb1yr by Genotype

44
Ferquency table of lqmb2yr by Genotype
Means of different variables used for analysis in this study

45
Data level in the model
ANOVA Table for litter size at 1 year

46
Means of litter size at 1 year per Genotypes
Least-square means and difference matrix for lamb1yr
ANOVA Table for lamb2yr

47
Means of lamb2yr per Genotype
lsmeans and difference matrix of lamb2yr for Genotypes