Embed Size (px)
Citation preview
Phenotypic Consequences of Copy Number Variation:Insights from Smith-Magenis and Potocki-LupskiSyndrome Mouse ModelsGuenola Ricard1., Jessica Molina2., Jacqueline Chrast1, Wenli Gu3, Nele Gheldof1, Sylvain
Pradervand1,4, Frederic Schutz1,4, Juan I. Young2,5,6, James R. Lupski3,7,8, Alexandre Reymond1*",
Katherina Walz2,5*"
1 Center for Integrative Genomics, University of Lausanne, Lausanne, Switzerland, 2 Centro de Estudios Cientıficos (CECS), Valdivia, Chile, 3 Molecular & Human Genetics,
Baylor College of Medicine, Houston, Texas, United States of America, 4 Swiss Institute of Bioinformatics (SIB), Lausanne, Switzerland, 5 John P. Hussman Institute for
Human Genomics, University of Miami Miller School of Medicine, Miami, Florida, United States of America, 6 CIN (Centro de Ingenierıa de la Innovacion del CECS), Valdivia,
Chile, 7 Pediatrics, Baylor College of Medicine, Houston, Texas, United States of America, 8 Texas Children’s Hospital, Houston, Texas, United States of America
Abstract
A large fraction of genome variation between individuals is comprised of submicroscopic copy number variation ofgenomic DNA segments. We assessed the relative contribution of structural changes and gene dosage alterations onphenotypic outcomes with mouse models of Smith-Magenis and Potocki-Lupski syndromes. We phenotyped mice with 1n(Deletion/+), 2n (+/+), 3n (Duplication/+), and balanced 2n compound heterozygous (Deletion/Duplication) copies of thesame region. Parallel to the observations made in humans, such variation in gene copy number was sufficient to generatephenotypic consequences: in a number of cases diametrically opposing phenotypes were associated with gain versus lossof gene content. Surprisingly, some neurobehavioral traits were not rescued by restoration of the normal gene copynumber. Transcriptome profiling showed that a highly significant propensity of transcriptional changes map to theengineered interval in the five assessed tissues. A statistically significant overrepresentation of the genes mapping to theentire length of the engineered chromosome was also found in the top-ranked differentially expressed genes in the micecontaining rearranged chromosomes, regardless of the nature of the rearrangement, an observation robust across differentcell lineages of the central nervous system. Our data indicate that a structural change at a given position of the humangenome may affect not only locus and adjacent gene expression but also ‘‘genome regulation.’’ Furthermore, structuralchange can cause the same perturbation in particular pathways regardless of gene dosage. Thus, the presence of a genomicstructural change, as well as gene dosage imbalance, contributes to the ultimate phenotype.
Citation: Ricard G, Molina J, Chrast J, Gu W, Gheldof N, et al. (2010) Phenotypic Consequences of Copy Number Variation: Insights from Smith-Magenis andPotocki-Lupski Syndrome Mouse Models. PLoS Biol 8(11): e1000543. doi:10.1371/journal.pbio.1000543
Academic Editor: Nicholas D. Hastie, Medical Research Council Human Genetics Unit, United Kingdom
Received May 26, 2010; Accepted October 4, 2010; Published November 23, 2010
Copyright: � 2010 Ricard et al. This is an open-access article distributed under the terms of the Creative Commons Attribution License, which permitsunrestricted use, distribution, and reproduction in any medium, provided the original author and source are credited.
Funding: This work was supported by FONDECYT [grant 1061067 (KW), 1051079 (JIY)], FIC [R03 TW07536 (KW and JRL)], the National Institutes of Health [NINDSRO1 NS058529 (JRL)], the Jerome Lejeune Foundation (KW and AR), the Telethon Action Suisse Foundation (AR), the Swiss National Science Foundation (AR) andthe European Commission anEUploidy Integrated Project grant 037627 (AR). The Centro de Estudios Cientıficos (CECS) is funded by the Chilean Governmentthrough the Millennium Science Initiative and the Centers of Excellence Base Financing Program of CONICYT. CECS is also supported by a group of privatecompanies, which at present includes Antofagasta Minerals, Arauco, Empresas CMPC, Indura, Naviera Ultragas and Telefonica del Sur. The funders had no role instudy design, data collection and analysis, decision to publish, or preparation of the manuscript.
Competing Interests: The authors have declared that no competing interests exist.
Abbreviations: ASD, autism spectrum disorder; CNV, Copy number variation; GEO, Gene Expression Omnibus; MMU11, Mus musculus chromosome 11; PCR,Polymerase Chain Reaction; PTLS, Potocki-Lupski syndrome; RAI1, Retinoic Acid Induced gene 1; SCN, suprachiasmatic nucleus; SD, Standard Deviation; SMS,Smith-Magenis Syndrome
* E-mail: [email protected] (AR); [email protected] (KW)
. These authors contributed equally to this work.
" The two laboratories of AR and KW contributed equally to this work
Introduction
Copy number variation (CNV) of genomic segments among
phenotypically normal human individuals was recently shown to
be surprisingly frequent [1,2]. It covers a large proportion of the
human genome and encompasses thousands of genes [3,4]. About
58,000 human CNVs from approximately 14,500 regions
(CNVRs) have been identified to date (http://projects.tcag.ca/
variation/). They contribute to genetic variation and genome
evolution [5–8] by modifying the expression of genes mapping
within the CNV and in its flanks [9–13]. Consistently, initial cases
of adaptive CNV alleles under positive selection were recently
uncovered [14] and several structural variants were shown to be
associated with ‘‘genomic disorders’’ [15–17] and susceptibility to
disease (reviewed in [7,18–21]). For example, a microdeletion and
its reciprocal microduplication at chromosomal band 17p11.2
were shown to be associated with Smith-Magenis (SMS;
OMIM#182290) and Potocki-Lupski syndromes (PTLS;
OMIM#610883), respectively [22–24]. The Retinoic Acid
Induced gene 1 (RAI1; GeneID: 10743) is thought to be the main
PLoS Biology | www.plosbiology.org 1 November 2010 | Volume 8 | Issue 11 | e1000543
dosage-sensitive gene within this genomic interval. Consistently,
SMS patients with only RAI1 mutation have been identified [25–
28]. However, accumulating evidence indicates that other factors
also contribute to the spectrum of clinical findings in patients. For
example, SMS patients with RAI1 mutations are less likely than
SMS patients with the deletion to be short and suffer from hearing
loss, cardiovascular, and renal tract abnormalities. On the other
hand, they are at higher risk for obesity [29–33]. Mouse models of
these syndromes were generated. These engineered animals
recapitulate several of the multiple phenotypes present in the
human patients. The SMS mice show craniofacial abnormalities,
obesity, overt seizures, hypoactivity levels, and circadian rhythm
anomalies, while the PTLS model is underweight and presents
hyperactivity, learning and memory deficiencies, and social
impairment [11,27,34,35].
We took advantage of these models and of a third strain that is a
compound heterozygote balanced for copy number—it harbors
the SMS deletion on one allele and the PTLS duplication on the
other—to tease apart the phenotypic consequences of gene dosage
alterations versus genomic structural changes.
Results
The functional impact of CNV of a given genomic interval
remains unstudied at a genome-wide scale. Such a global
assessment is achievable nowadays using the mouse as a model
organism. Mouse models of the Smith-Magenis and Potocki-
Lupski syndromes carry a deletion (strain Df(11)17/+) and its
reciprocal duplication (Dp(11)17/+), engineered rearrangements
involving the syntenic genomic regions at band MMU11B2,
respectively [11,22–24,27,28,30,34,35]. These heterozygous mice
and their wild type littermates (+/+) allow the study of the
influence of one, two, and three copies of the same CNV in an
otherwise identical genomic background (see below). A fourth
strain (Df(11)17/Dp(11)17) obtained by mating the Dp(11)17/+and Df(11)17/+ animals enables the generation of genomically
balanced mice with two copies of that same CNV in cis, while they
are in trans in +/+ animals (see Figure 1 for a schematic
representation of the four genotypes).
Influence of Gene Dosage and Structural Changes on thePhenotypic Outcome
To investigate the phenotypic outcome of modifying gene
dosage or of maintaining gene dosage but with a structural change,
we assessed 14 different phenotypes in the four different mouse
genotypes (i.e., 1n, 2n, 3n, and 2n compound heterozygote)
(Table 1). The decreased embryonic survival, craniofacial
abnormalities, overt seizures, and altered neuromotor function
observed in Df(11)17/+ and the learning and memory impair-
ments shown by Dp(11)17/+ animals were absent in the
genetically balanced Df(11)17/Dp(11)17 mice (summarized in
Table 1; for details see Text S1, Figures S1–S2 and Table S1).
Likewise, the significant differences in body weight and abdominal
fat found in the SMS and the PTLS mouse models when
compared to +/+ animals were absent in Df(11)17/Dp(11)17 (Text
S1 and Figure S3). Furthermore, we found that ‘‘backing out of
the test tube,’’ when confronted by a wild type mouse, was only
correlated with copy numbers but not with structural changes per se
(Text S1 and Figure S4). A summary of phenotypic differences
between Rai1 +/2 and Df(11)17/+ mice can be found in Text S1.
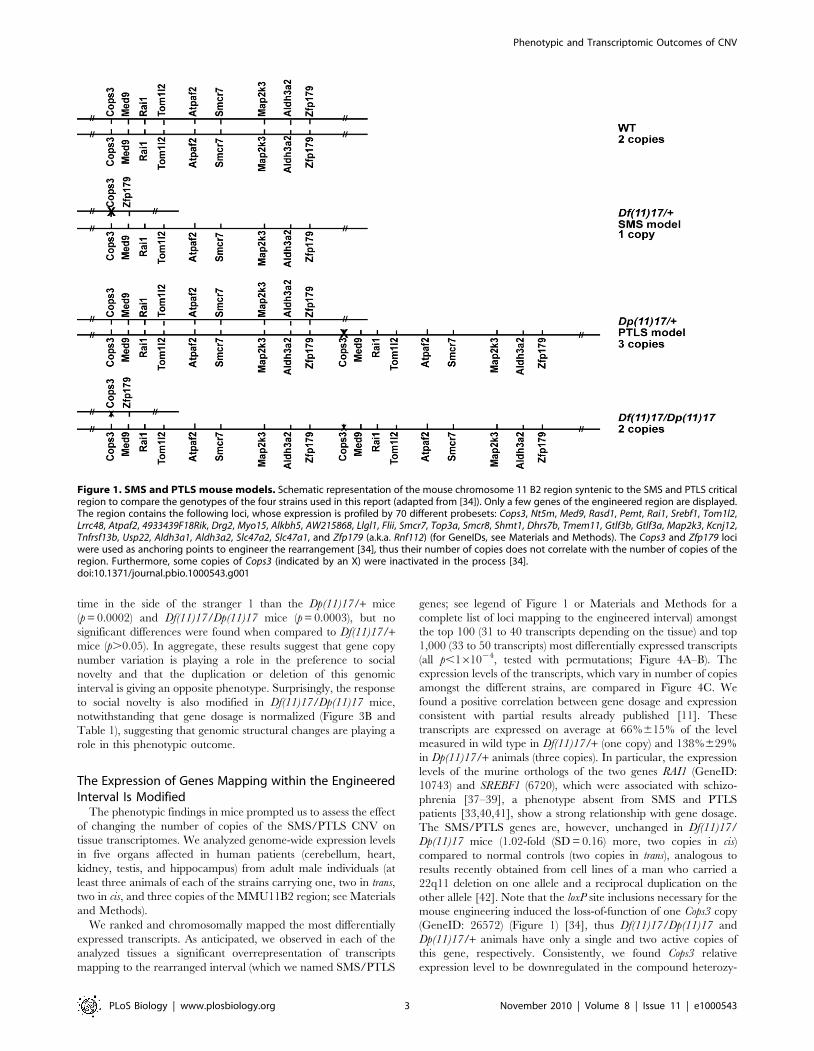
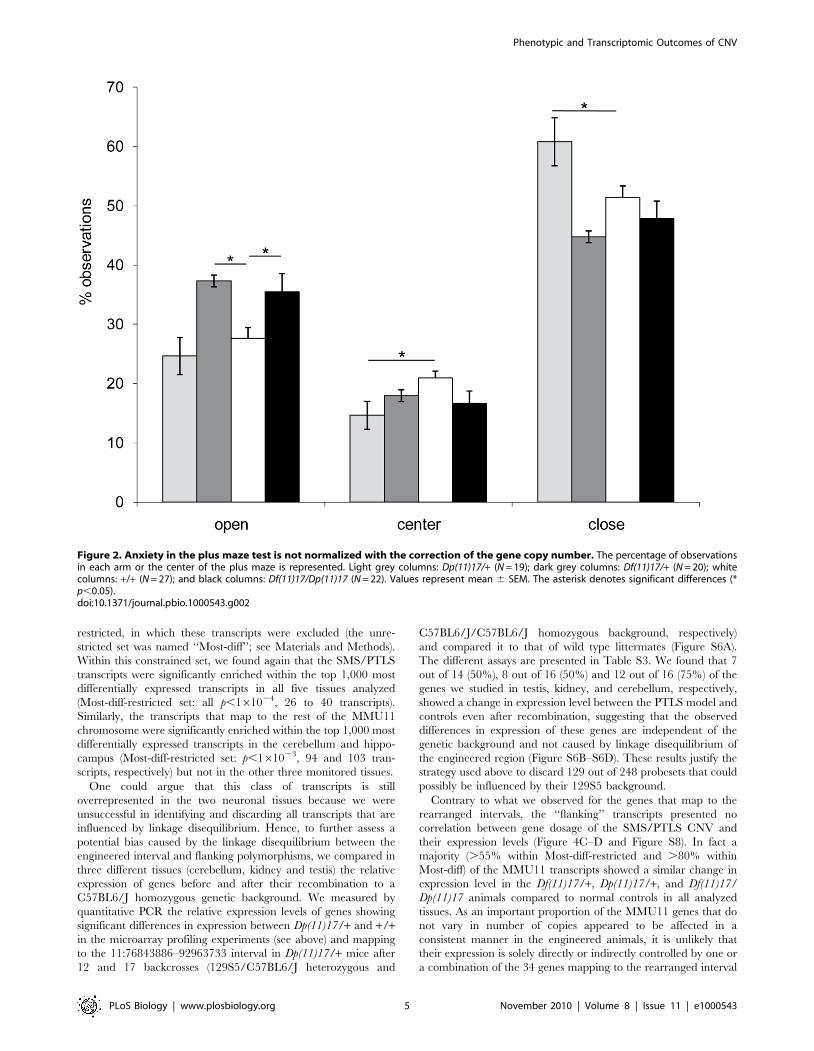
Anxiety was found increased in Dp(11)17/+ mice in the elevated
plus maze test [11]. We found an overall significant difference in
the percentage of observations in the open arms (F(3, 87) = 5.9;
p = 0.001) and closed arms (F(3, 87 = 8; p,0.0001). Post-hoc
analysis showed that Dp(11)17/+ mice spend significantly more
time in the closed arms (62.1%63%) than their wild type
littermates (51%61.9%) (p = 0.002). In contrast, the percentage
of observations in the open arms was significantly increased for
Df(11)17/+ mice (37%62.5%), when compared with +/+ animals
(29%61.9%) (p = 0.023). The percentage of observations in the
open arm was also significantly increased for Df(11)17/Dp(11)17
mice (36%62.2%), when compared with +/+ (p = 0.045), however
the p value is in the borderline range. The number of observations
of Df(11)17/Dp(11)17 mice in the center and the close arm was
always smaller than that of wild type. This is concordant with what
we observed for Df(11)17/+ mice. While none of these differences
are significant, both Df(11)17/+ and Df(11)17/Dp(11)17 mice
behave similarly. No significant differences were observed when
Df(11)17/Dp(11)17 were compared to the Df(11)17/+ mice
(p.0.05). These results indicate that dosage of genes mapping
within the engineered genomic interval is associated with the levels
of anxiety in mice, since the gain or loss of genetic material are
giving opposite phenotypes. However, structural changes play a
role, as restoration of the number of copies (2n in cis) does not
rescue the phenotype (Figure 2 and Table 1). This observation was
similar to what was found for activity levels in the open field
(Table1) [27].
Dp(11)17/+ mice showed a subtle impairment in the preference
of a social target versus an inanimate target and a clear impaired
preference for social novelty when compared to +/+ mice [11] in
the three-chamber test [36] that is based on the tendency of a
subject mouse to approach and engage in social interaction with
an unfamiliar mouse. We performed this test in the four different
groups of purebred mice with distinct CNV genotypes. The
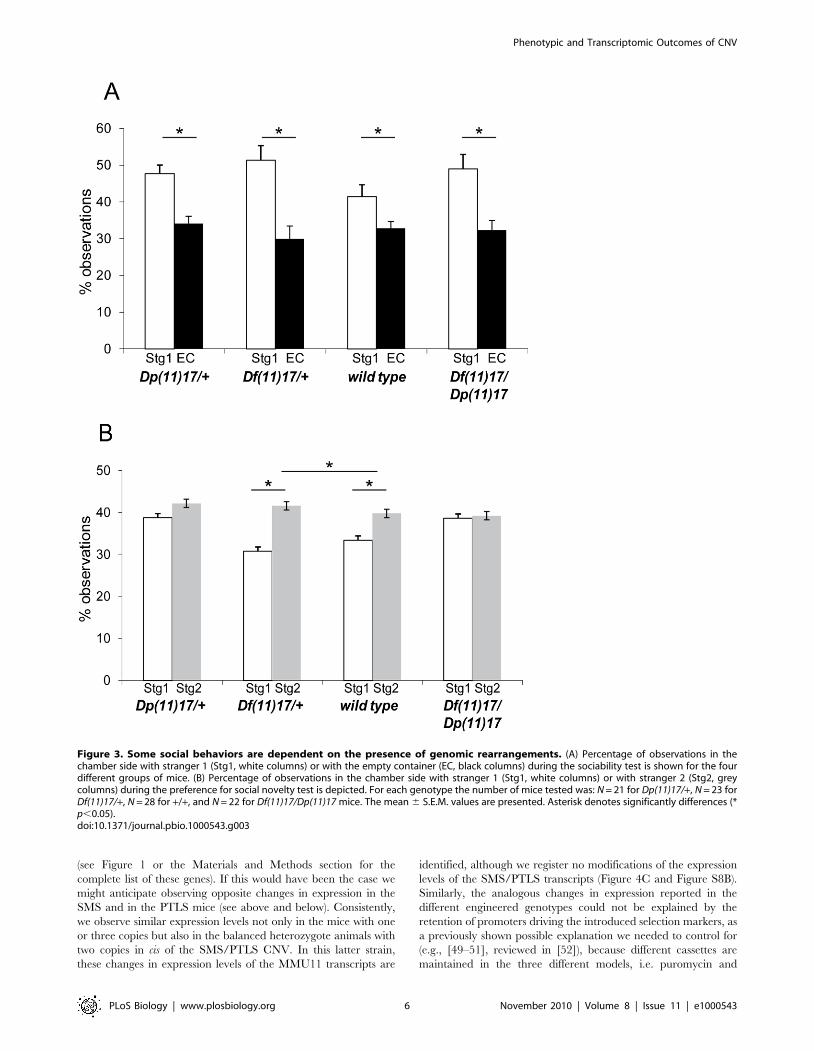
analysis of the sociability part of the test showed a significant effect
of chamber side (F(1, 90) = 38.99, p,0.0001). Post-hoc analysis
demonstrated that mice from all analyzed genotypes spend more
time in the chamber side that contains the stranger 1 versus the
side with the empty container (p,0.01 in all cases) (Figure 3A). In
the preference for social novelty data, we observed a significant
difference for chamber side (F(1, 90) = 9.6, p = 0.0025) and genotype
(F(3, 90) = 5.74, p = 0.0012). Post-hoc analysis revealed that wild
type (p = 0.04) and Df (11)17/+ mice (p = 0.0002) tend to spend
significantly more time with stranger 2 than with stranger 1, but
Dp(11)17/+ and Df(11)17/Dp(11)17 mice spent the same amount
of time with stranger 1 and stranger 2 (p = 0.37 and 0.87,
respectively). Moreover, when +/+ mice were compared with the
other three genotypes we found that they spend significantly less
Author Summary
Mammalian genomes contain many forms of geneticvariation. For example, some genome segments wereshown to vary in their number of copies betweenindividuals of the same species, i.e. there is a range ofnumber of copies in the normal population instead of theusual two copies (one per chromosome). These geneticdifferences play an important role in determining thephenotype (the observable characteristics) of each indi-vidual. We do not know, however, if such influences arebrought about solely through changes in the number ofcopies of the genomic segments (and of the genes thatmap within) or if the structural modification of thegenome per se also plays a role in the outcome. We usemouse models with different number of copies of thesame genomic region to show that rearrangements of thegenetic materials can affect the phenotype independentlyof the dosage of the rearranged region.
Phenotypic and Transcriptomic Outcomes of CNV
PLoS Biology | www.plosbiology.org 2 November 2010 | Volume 8 | Issue 11 | e1000543
time in the side of the stranger 1 than the Dp(11)17/+ mice
(p = 0.0002) and Df(11)17/Dp(11)17 mice (p = 0.0003), but no
significant differences were found when compared to Df(11)17/+mice (p.0.05). In aggregate, these results suggest that gene copy
number variation is playing a role in the preference to social
novelty and that the duplication or deletion of this genomic
interval is giving an opposite phenotype. Surprisingly, the response
to social novelty is also modified in Df(11)17/Dp(11)17 mice,
notwithstanding that gene dosage is normalized (Figure 3B and
Table 1), suggesting that genomic structural changes are playing a
role in this phenotypic outcome.
The Expression of Genes Mapping within the EngineeredInterval Is Modified
The phenotypic findings in mice prompted us to assess the effect
of changing the number of copies of the SMS/PTLS CNV on
tissue transcriptomes. We analyzed genome-wide expression levels
in five organs affected in human patients (cerebellum, heart,
kidney, testis, and hippocampus) from adult male individuals (at
least three animals of each of the strains carrying one, two in trans,
two in cis, and three copies of the MMU11B2 region; see Materials
and Methods).
We ranked and chromosomally mapped the most differentially
expressed transcripts. As anticipated, we observed in each of the
analyzed tissues a significant overrepresentation of transcripts
mapping to the rearranged interval (which we named SMS/PTLS
genes; see legend of Figure 1 or Materials and Methods for a
complete list of loci mapping to the engineered interval) amongst
the top 100 (31 to 40 transcripts depending on the tissue) and top
1,000 (33 to 50 transcripts) most differentially expressed transcripts
(all p,161024, tested with permutations; Figure 4A–B). The
expression levels of the transcripts, which vary in number of copies
amongst the different strains, are compared in Figure 4C. We
found a positive correlation between gene dosage and expression
consistent with partial results already published [11]. These
transcripts are expressed on average at 66%615% of the level
measured in wild type in Df(11)17/+ (one copy) and 138%629%
in Dp(11)17/+ animals (three copies). In particular, the expression
levels of the murine orthologs of the two genes RAI1 (GeneID:
10743) and SREBF1 (6720), which were associated with schizo-
phrenia [37–39], a phenotype absent from SMS and PTLS
patients [33,40,41], show a strong relationship with gene dosage.
The SMS/PTLS genes are, however, unchanged in Df(11)17/
Dp(11)17 mice (1.02-fold (SD = 0.16) more, two copies in cis)
compared to normal controls (two copies in trans), analogous to
results recently obtained from cell lines of a man who carried a
22q11 deletion on one allele and a reciprocal duplication on the
other allele [42]. Note that the loxP site inclusions necessary for the
mouse engineering induced the loss-of-function of one Cops3 copy
(GeneID: 26572) (Figure 1) [34], thus Df(11)17/Dp(11)17 and
Dp(11)17/+ animals have only a single and two active copies of
this gene, respectively. Consistently, we found Cops3 relative
expression level to be downregulated in the compound heterozy-
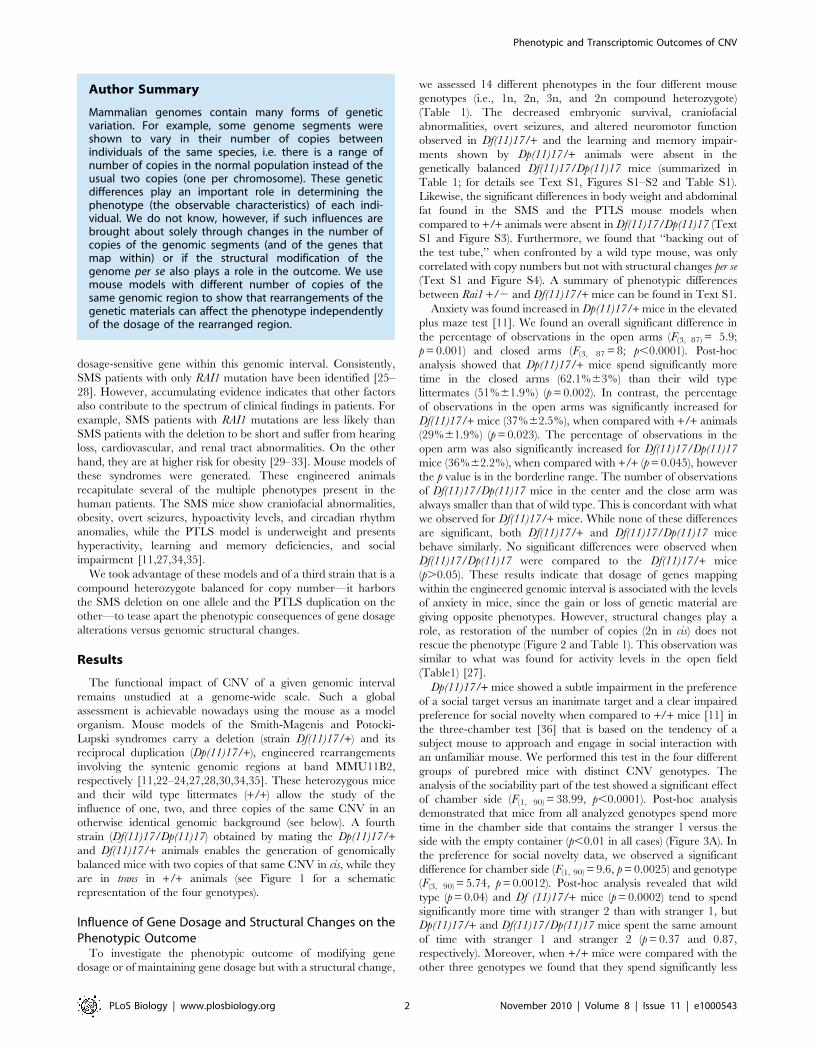
Figure 1. SMS and PTLS mouse models. Schematic representation of the mouse chromosome 11 B2 region syntenic to the SMS and PTLS criticalregion to compare the genotypes of the four strains used in this report (adapted from [34]). Only a few genes of the engineered region are displayed.The region contains the following loci, whose expression is profiled by 70 different probesets: Cops3, Nt5m, Med9, Rasd1, Pemt, Rai1, Srebf1, Tom1l2,Lrrc48, Atpaf2, 4933439F18Rik, Drg2, Myo15, Alkbh5, AW215868, Llgl1, Flii, Smcr7, Top3a, Smcr8, Shmt1, Dhrs7b, Tmem11, Gtlf3b, Gtlf3a, Map2k3, Kcnj12,Tnfrsf13b, Usp22, Aldh3a1, Aldh3a2, Slc47a2, Slc47a1, and Zfp179 (a.k.a. Rnf112) (for GeneIDs, see Materials and Methods). The Cops3 and Zfp179 lociwere used as anchoring points to engineer the rearrangement [34], thus their number of copies does not correlate with the number of copies of theregion. Furthermore, some copies of Cops3 (indicated by an X) were inactivated in the process [34].doi:10.1371/journal.pbio.1000543.g001
Phenotypic and Transcriptomic Outcomes of CNV
PLoS Biology | www.plosbiology.org 3 November 2010 | Volume 8 | Issue 11 | e1000543
gous animals and unchanged in the PTLS mouse model
(Figure 4C). The Df(11)17/+ and Df(11)17/Dp(11)17 strains carry
two and three copies of Zfp179 (a.k.a. Rnf112, GeneID: 22671),
respectively (Figure 1 and 4C), thus this gene could be considered
in the ‘‘flanking’’ genes category in some strains (see below).
To confirm the transcriptome profiling results, we indepen-
dently measured by Taqman quantitative PCR the relative
expression levels of 43 genes in the hippocampus and cerebellum
of males (N = 3) and females (N = 3) and the cortex, liver, and lung
of female mice (N = 3) of the +/+, Dp(11)17/+, and Df(11)17/+genotypes. The list of genes and assays used are presented in Table
S2. They map either centromeric, within, or telomeric to the
rearranged region. We found good reproducibility of the data for
the three genes that were quantified with two different Taqman
assays (Figure S5). Likewise, we noted a robust correlation between
the Taqman and expression microarray results (correlation
coefficient, R2 = 0.87; Figure S5A). Furthermore, the assays
performed on female tissues demonstrated that the above
described influences on the expression levels of genes situated
within the rearrangement are not restricted to one sex and to the
five tissues monitored by microarray (Figure S5B and S5C). Thus,
the altered expression of SMS/PTLS genes are most probably
relevant to the development of the phenotypic manifestations of
PTLS and SMS mouse models that are absent in the Df(11)17/
Dp(11)17 animals.
The Expression of Normal Copy Number Genes Mappingon MMU11 Is Modified
A second category of transcripts, those that map to the rest of
mouse chromosome 11 (MMU11 genes), was significantly
enriched within the top 1,000 most differentially expressed
transcripts in all five tissues (all p,161024, 97 to 138 transcripts,
Figure 4B; ‘‘Most-diff’’ set of data, see below and Materials and
Methods). This ‘‘flanking effect’’ might not be an effect of
structural changes but could potentially be caused by linkage
disequilibrium between the engineered interval and flanking
polymorphisms. Consistently, retention of large blocks from the
parental strain through genetic selection even after repeated
backcrossing has been reported [43–45].
The SMS and PTLS mouse models were generated from a
different genetic background (i.e., the AB2.2 ES cell line derived
from a 129S5 mouse, see [34] for details) and were backcrossed for
12 generations to C57BL/6J-Tyrc-Brd. Genotyping of the entire
length of MMU11 revealed that, whereas the region proximal to
the engineered interval had recombined, the distal section had
either only partially or not recombined at all to the C57BL/6J
background in Dp(11)17/+ and Df(11)17)/+, respectively (Figure
S6A). These sequence variants may have a significant impact on
microarray-based transcriptome profiling [46–48]. For example,
almost half of the reported 100 most significant cis-acting
expression QTLs could be attributed to sequence diversity in
probe regions in [46].
We thus devised a strategy to identify and discard the transcripts
that could possibly be influenced by their 129S5 genetic makeup
rather than by the modification of the number of copies of the
CNV. As we found that 129S5 and 129S2 mice were genetically
identical at all tested loci from the SMS/PTLS engineered interval
to the telomere, we thought to use expression data previously
established in our laboratory with the same microarray platform
(GEO Series accession number: GSE10744) [12] to identify the
transcripts that show a different level of expression between 129S2
and C57BL/6J animals in at least one of six major tissues (brain,
liver, testis, kidney, lung, and heart) (false discovery rate,0.1;
corrected for multiple testing) and that thus should be removed
from our analysis (see Materials and Methods, Figure S7). This
allowed establishment of a restricted set of data, named Most-diff-
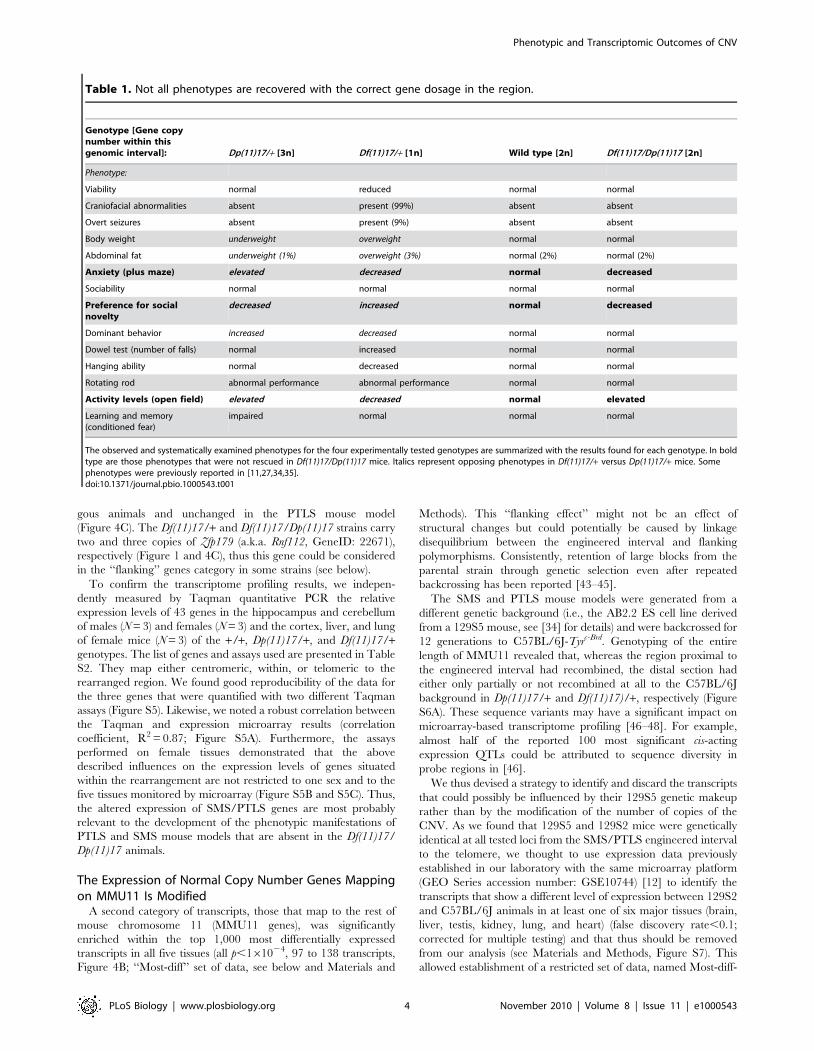
Table 1. Not all phenotypes are recovered with the correct gene dosage in the region.
Genotype [Gene copynumber within thisgenomic interval]: Dp(11)17/+ [3n] Df(11)17/+ [1n] Wild type [2n] Df(11)17/Dp(11)17 [2n]
Phenotype:
Viability normal reduced normal normal
Craniofacial abnormalities absent present (99%) absent absent
Overt seizures absent present (9%) absent absent
Body weight underweight overweight normal normal
Abdominal fat underweight (1%) overweight (3%) normal (2%) normal (2%)
Anxiety (plus maze) elevated decreased normal decreased
Sociability normal normal normal normal
Preference for socialnovelty
decreased increased normal decreased
Dominant behavior increased decreased normal normal
Dowel test (number of falls) normal increased normal normal
Hanging ability normal decreased normal normal
Rotating rod abnormal performance abnormal performance normal normal
Activity levels (open field) elevated decreased normal elevated
Learning and memory(conditioned fear)
impaired normal normal normal
The observed and systematically examined phenotypes for the four experimentally tested genotypes are summarized with the results found for each genotype. In boldtype are those phenotypes that were not rescued in Df(11)17/Dp(11)17 mice. Italics represent opposing phenotypes in Df(11)17/+ versus Dp(11)17/+ mice. Somephenotypes were previously reported in [11,27,34,35].doi:10.1371/journal.pbio.1000543.t001
Phenotypic and Transcriptomic Outcomes of CNV
PLoS Biology | www.plosbiology.org 4 November 2010 | Volume 8 | Issue 11 | e1000543
restricted, in which these transcripts were excluded (the unre-
stricted set was named ‘‘Most-diff’’; see Materials and Methods).
Within this constrained set, we found again that the SMS/PTLS
transcripts were significantly enriched within the top 1,000 most
differentially expressed transcripts in all five tissues analyzed
(Most-diff-restricted set: all p,161024, 26 to 40 transcripts).
Similarly, the transcripts that map to the rest of the MMU11
chromosome were significantly enriched within the top 1,000 most
differentially expressed transcripts in the cerebellum and hippo-
campus (Most-diff-restricted set: p,161023, 94 and 103 tran-
scripts, respectively) but not in the other three monitored tissues.
One could argue that this class of transcripts is still
overrepresented in the two neuronal tissues because we were
unsuccessful in identifying and discarding all transcripts that are
influenced by linkage disequilibrium. Hence, to further assess a
potential bias caused by the linkage disequilibrium between the
engineered interval and flanking polymorphisms, we compared in
three different tissues (cerebellum, kidney and testis) the relative
expression of genes before and after their recombination to a
C57BL6/J homozygous genetic background. We measured by
quantitative PCR the relative expression levels of genes showing
significant differences in expression between Dp(11)17/+ and +/+in the microarray profiling experiments (see above) and mapping
to the 11:76843886–92963733 interval in Dp(11)17/+ mice after
12 and 17 backcrosses (129S5/C57BL6/J heterozygous and
C57BL6/J/C57BL6/J homozygous background, respectively)
and compared it to that of wild type littermates (Figure S6A).
The different assays are presented in Table S3. We found that 7
out of 14 (50%), 8 out of 16 (50%) and 12 out of 16 (75%) of the
genes we studied in testis, kidney, and cerebellum, respectively,
showed a change in expression level between the PTLS model and
controls even after recombination, suggesting that the observed
differences in expression of these genes are independent of the
genetic background and not caused by linkage disequilibrium of
the engineered region (Figure S6B–S6D). These results justify the
strategy used above to discard 129 out of 248 probesets that could
possibly be influenced by their 129S5 background.
Contrary to what we observed for the genes that map to the
rearranged intervals, the ‘‘flanking’’ transcripts presented no
correlation between gene dosage of the SMS/PTLS CNV and
their expression levels (Figure 4C–D and Figure S8). In fact a
majority (.55% within Most-diff-restricted and .80% within
Most-diff) of the MMU11 transcripts showed a similar change in
expression level in the Df(11)17/+, Dp(11)17/+, and Df(11)17/
Dp(11)17 animals compared to normal controls in all analyzed
tissues. As an important proportion of the MMU11 genes that do
not vary in number of copies appeared to be affected in a
consistent manner in the engineered animals, it is unlikely that
their expression is solely directly or indirectly controlled by one or
a combination of the 34 genes mapping to the rearranged interval
Figure 2. Anxiety in the plus maze test is not normalized with the correction of the gene copy number. The percentage of observationsin each arm or the center of the plus maze is represented. Light grey columns: Dp(11)17/+ (N = 19); dark grey columns: Df(11)17/+ (N = 20); whitecolumns: +/+ (N = 27); and black columns: Df(11)17/Dp(11)17 (N = 22). Values represent mean 6 SEM. The asterisk denotes significant differences (*p,0.05).doi:10.1371/journal.pbio.1000543.g002
Phenotypic and Transcriptomic Outcomes of CNV
PLoS Biology | www.plosbiology.org 5 November 2010 | Volume 8 | Issue 11 | e1000543
(see Figure 1 or the Materials and Methods section for the
complete list of these genes). If this would have been the case we
might anticipate observing opposite changes in expression in the
SMS and in the PTLS mice (see above and below). Consistently,
we observe similar expression levels not only in the mice with one
or three copies but also in the balanced heterozygote animals with
two copies in cis of the SMS/PTLS CNV. In this latter strain,
these changes in expression levels of the MMU11 transcripts are
identified, although we register no modifications of the expression
levels of the SMS/PTLS transcripts (Figure 4C and Figure S8B).
Similarly, the analogous changes in expression reported in the
different engineered genotypes could not be explained by the
retention of promoters driving the introduced selection markers, as
a previously shown possible explanation we needed to control for
(e.g., [49–51], reviewed in [52]), because different cassettes are
maintained in the three different models, i.e. puromycin and
Figure 3. Some social behaviors are dependent on the presence of genomic rearrangements. (A) Percentage of observations in thechamber side with stranger 1 (Stg1, white columns) or with the empty container (EC, black columns) during the sociability test is shown for the fourdifferent groups of mice. (B) Percentage of observations in the chamber side with stranger 1 (Stg1, white columns) or with stranger 2 (Stg2, greycolumns) during the preference for social novelty test is depicted. For each genotype the number of mice tested was: N = 21 for Dp(11)17/+, N = 23 forDf(11)17/+, N = 28 for +/+, and N = 22 for Df(11)17/Dp(11)17 mice. The mean 6 S.E.M. values are presented. Asterisk denotes significantly differences (*p,0.05).doi:10.1371/journal.pbio.1000543.g003
Phenotypic and Transcriptomic Outcomes of CNV
PLoS Biology | www.plosbiology.org 6 November 2010 | Volume 8 | Issue 11 | e1000543
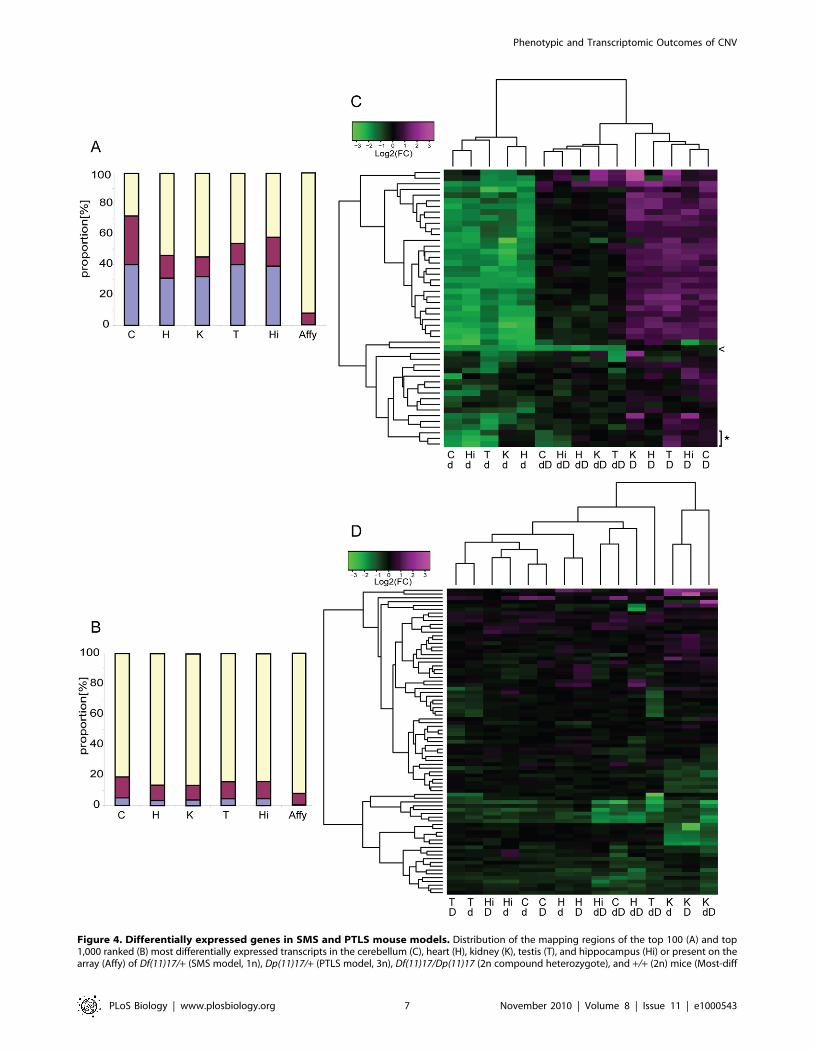
Figure 4. Differentially expressed genes in SMS and PTLS mouse models. Distribution of the mapping regions of the top 100 (A) and top1,000 ranked (B) most differentially expressed transcripts in the cerebellum (C), heart (H), kidney (K), testis (T), and hippocampus (Hi) or present on thearray (Affy) of Df(11)17/+ (SMS model, 1n), Dp(11)17/+ (PTLS model, 3n), Df(11)17/Dp(11)17 (2n compound heterozygote), and +/+ (2n) mice (Most-diff
Phenotypic and Transcriptomic Outcomes of CNV
PLoS Biology | www.plosbiology.org 7 November 2010 | Volume 8 | Issue 11 | e1000543
neomycin resistance genes in Df(11)17/+ and Df(11)17/Dp(11)17
and Hprt, tyrosinase and K14Agouti genes in Dp(11)17/+ and
Df(11)17/Dp(11)17 [34].
One mechanism explaining the observed deregulation of
MMU11 transcripts might be the dissociation of these transcripts
from their long-range regulatory elements, a phenomenon known
as position effect [53]. If the changes in gene expression were
caused by the physical separation of cis-acting regulatory elements
mapping to the rearranged interval and MMU11 genes, we should
expect an enrichment of affected genes close to the breakpoints
(i.e., the loxP sites necessary for the mouse engineering [34]). This
is only partially the case (Figure S9). In fact, we find genes with
modified expression mapping on the entirety of mouse chromo-
some 11, for example, tens of megabases from the breakpoints,
suggesting that other mechanisms of regulation might also be at
play (Figure S9). We find, however, no correlation between the
distance from the breakpoints and the extent of expression change
(Figure S10). Many of the transcripts that show changes in relative
expression appear to cluster in discrete groups along the
chromosome. We tested this assumption using a modified version
of the method described by Tang and Lewontin to infer
significance (see Materials and Methods) [54,55] but found no
significant clustering of the modified transcripts. We thus infer that
the observed clustering is simply due to the non-homogenous
distribution of genes along mouse chromosome 11 (Figure S9B).
Similarly, we found no significant enrichment of genes that
neighbor CpG islands within the set of MMU11 CNV-affected
transcripts (Most-diff-restricted: p,0.25; Most-diff: p,0.15 tested
with permutations; see Materials and Methods), which could have
suggested that these genes are expressed in many tissues [56]. We
found, however, that the MMU11 transcripts modified in
expression were expressed in a significantly greater fraction of
the tissues we assessed (average 2.6, median 3) relative to other
transcripts (1.8, 2; two-tailed p,2.2610216, Mann-Whitney U
test). They are, however, not expressed at higher levels than their
unchanged counterparts (Figure S11).
Interestingly, the two tissues that show a significant number of
differentially expressed genes mapping to MMU11, i.e. hippo-
campus and cerebellum, are part of the central nervous system
(CNS). This observation suggests that copy number changes may
have more of an effect on normal copy neighboring genes
expressed in the brain. Other reports have shown that genes
expressed in the brain have changed less than have genes
expressed in other tissues during evolution [57] and that CNV
genes expressed in the brain are more tightly regulated than other
CNV genes [12]. The stricter expression regulation of genes with a
function in the CNS is possibly brought about by their increased
interdependency through multiple feedback loops, common long-
range cis-acting regulatory units, and/or changes in the chromatin
conformation. Thus, suggesting that perturbation to such ‘‘higher
order’’ genome organization would be more identifiable and
consequential in the CNS. Consistently, the phenotypes that
persist upon restoration of gene dosage, modification of activity,
anxiety, and sociability levels, are most probably from a
neurological origin. We identified gene(s) that are modified in
their relative expression levels in the Df(11)17/Dp(11)17 mouse
(see above). The comparison of the hippocampal and cerebellar
transcriptomes of these mice with that of +/+ littermates showed
that expression levels of genes involved in detection of stimuli,
visual perception, as well as neuronal differentiation were modified
and, thus ultimately, might be at the origin of the change in
phenotypic outcome (Text S1, Table S4–S6).
Taken together our results indicate that structural changes per se,
i.e. without changes in gene dosage, have genomic consequences
on gene expression far beyond the locus whose structure is varied
and that structural variation can profoundly modify the pheno-
typic outcome.
Discussion
Copy Number Variants (CNVs), because of their prevalence,
e.g. 10% of the mouse autosomal genome and 60% of its
duplicated regions [12,58], constitute important contributors to
intraspecific genetic variation. Multiple human CNVs have been
associated with diseases, susceptibility to diseases, and adaptation
(reviewed in [7,8,18–20]).
We show that mouse models of Smith-Magenis and Potocki-
Lupski syndromes, engineered to have one and three copies,
respectively, of the mouse chromosome 11 (MMU11) band B2
region (Figure 1) present altered expression of the genes mapping
within the rearranged interval and diametrically opposing
phenotypes in body weight, percent fat, anxiety, preference for
social novelty, dominant behavior, and activity levels (Table 1).
Similarly, the deletion and reciprocal duplication of the 1q21.1
region are associated with micro- and macrocephaly, respectively
[59], while the reciprocal diametric changes in head size were
reported for 16p11.2 rearrangements [60,61]. These observations
and the associations of these genomic disorders with autism
spectrum disorder (ASD) (1q21.1 duplication and 16p11.2
deletion) and schizophrenia (1q21.1 deletion and 16p11.2
duplication) [59,61–72] lend support to the hypothesis that these
conditions are at different ends of a spectrum related to evolution
of the social brain [73,74]. SMS and PTLS, like 1q21.1 and
16p11.2 rearrangements, are so-called genomic sister-disorders—
disease mediated by duplications versus deletions of the same
regions—with overlapping phenotypic traits (for a complete list,
see [75]) in which conditions/phenotypes appeared to be linked to
gene dosage. However, patients presenting ASD and 1q21.1
deletions or 16p11.2 duplications, as well as individuals with
schizophrenia associated with 1q21.1 duplications or 16p11.2
deletions, were also reported ([61–65,72]; reviewed in [74]),
suggesting that some conditions might be due to altered gene(s)
function(s) through both under- and overexpression. Alternatively,
we can hypothesize that some phenotypes are not associated with a
specific number of copies of a particular CNV but rather that the
simple presence of a structural change at a given position of the
human genome may cause perturbation in particular pathways
regardless of gene dosage.
Murine genes mapping centromeric or telomeric to the SMS/
PTLS rearrangement show analogous changes in expression.
dataset, see Figure 1 for a schematic representation of the mouse 11 B2 region of the different mouse models). Proportion of transcripts mapping tothe SMS/PTLS rearranged interval (purple), the remainder of mouse chromosome 11 (burgundy), and elsewhere (yellow). Transcripts mapping to therearranged interval and to the remainder of mouse chromosome 11 are both statistically overrepresented in all tested tissues (all p,161024).Heatmap of the changes in expression levels of the 49 Most-diff transcripts mapping to the SMS/PTLS rearranged interval (C) and the remainder ofmouse chromosome 11 (81 transcripts) (D) measured in Df(11)17/+ (d), Dp(11)17/+ (D), and Df(11)17/Dp(11)17 (dD) mice as compared to +/+individuals in cerebellum (C), heart (H), kidney (K), testis (T), and hippocampus (Hi). The arrowhead and asterisk denote Cops3 and Zfp179 transcripts,respectively. These transcripts were used as anchors in the strain engineering process, thus they are not present in the same number of copies thanother SMS/PTLS genes in the mice models (see Figure 1 and text for details).doi:10.1371/journal.pbio.1000543.g004
Phenotypic and Transcriptomic Outcomes of CNV
PLoS Biology | www.plosbiology.org 8 November 2010 | Volume 8 | Issue 11 | e1000543
Specifically, a MMU11 gene over- or underexpressed in the SMS
mouse model has more than 50% chance to be also over- or
underexpressed in the PTLS mouse model, respectively. Remark-
ably, affected genes are mapping on the entirety of the
chromosome and not only in proximity to the breakpoints. The
uncoupling between the number of copies of the CNV genes and
the phenotype, here the effect on expression of genes outside of the
rearrangement, is further illustrated by the fact that we detect the
same changes in expression in the compound heterozygote, i.e. a
mouse model with a normal number of copies in a cis
configuration (Figure 1). Concomitantly, this restoration of gene
copy number within a structural change was shown not to rescue
all phenotypic manifestations observed in the SMS and PTLS
mice. Indeed some complex phenotypes such as activity, anxiety,
and preference for social novelty were still present in these
animals. These observations suggest a contribution of genomic
structural changes to the final phenotypic outcome and experi-
mentally document that simple gene dosage alone cannot account
for these phenotypes. The non-concordant absence of compensa-
tion in Df(11)17/Dp(11)17 mice (i.e. Df(11)17/Dp(11)17 mice
anxiety mimics the phenotype observed in the SMS model, while
their preference for social novelty is similar to that of PTLS
animals; Table 1) further uncovers the complexity resulting of
CNV-related genomic alteration.
The activity levels measured in the open field test exemplify the
interaction between gene dosage and final phenotypic outcome of
a specific CNV. Df(11)17/+ mice are hypoactive while Dp(11)17/
+ are hyperactive, hence the opposing phenotypes implicate gene
dosage in the final outcome. Consistently, Rai1 +/2 heterozygote
and Rai1 transgenic mice were found to be hypo- and hyperactive
in the open field, respectively [27,76]. However, the compound
heterozygote Df(11)17/Dp(11)17 and Dp(11)17/Rai- mice [27] are
also hyperactive in the open field, establishing that we are
confronted with a complex phenotypic outcome. In conclusion,
the presence of a CNV generates a phenotype through gene
dosage imbalance and/or the presence of genomic structural
changes. Further studies are warranted to resolve the underlying
causes and assess the relevance of our findings beyond genetically
engineered model and/or rare and highly penetrant CNVs.
Although we performed a broad battery of behavioral
experiments and studied the gene expression profile in five tissues
to address different aspects of SMS/PTLS phenotypes, there are
still other facets that are yet to be studied. One of the most
significant and consistent phenotypes displayed by almost all SMS
patients is sleep disturbance, including early sleep onset and offset,
repeated and prolonged nocturnal awakening, as well as excessive
daytime sleepiness (‘‘sleep attacks’’). Sleep disturbance in SMS is
accompanied by intrinsically inverted melatonin rhythms and is
often claimed by patients and their families as one of the most
challenging aspects of the SMS spectrum [33,77,78]. We suggest
that with approaches similar to this study, by combining
expression analyses in the suprachiasmatic nucleus (SCN) and
performing circadian experiments of the SMS mouse models,
valuable insights can be gained also for this important SMS
phenotype.
Importantly, our results suggest that the pathways through
which CNVs (including both deletions and duplications) result in
complex traits, particularly those involving the CNS, might
include not only alteration of the expression of genes included in
the rearranged interval but also the subtle modification of the
regulation of gene(s) mapping to the rest of the rearranged
chromosome. These changes in expression levels might be
triggered by a position effect, modification of the chromatin
structure, perturbation of chromatin loops, disruption of long
transcript structure, reflection of a regulatory interaction between
chromosome homologues (e.g. transvection), and/or repositioning
within the nucleus of a genomic region (e.g., in [79–83]; reviewed
in [5]). Consistently, a balanced translocation was shown to
significantly modify transcriptome profiles [84]. The results
presented here also suggest that the chromosome and its gene
collection are not randomly devised. The location and order are
maintained possibly in relation to a higher level genomic
organization required for proper regulation.
The potential unidirectionality of the long-range effects of
CNVs on gene expression and phenotypic outcome independent
of copy number change that has been uncovered in this report
poses an important challenge in appreciating the contribution of
this class of variation to phenotypic features. To include this
variable in genome-wide [85] as well as in eQTL association
studies [10], it might be necessary to combine all rearrangements
that differ from normality regardless of their directionality.
Materials and Methods
The materials and methods used for this report can be accessed
online (Text S1).
Supporting Information
Figure S1 Neuromotor dysfunction in Df(11)17/+ miceis gene dosage dependent. (A) The total number of falls in the
dowel test for each of the genotypes is depicted. (B) The average
time in seconds that mice from each genotype could be hanging
from a wire is shown. For each genotype the number of tested
mice was: N = 14 for Dp(11)17/+, N = 9 for Df(11)17/+, N = 14 for
+/+, and N = 12 for Df(11)17/Dp(11)17 mice. The performance
in the rotating rod is normal in mice with the correct gene dosage
within this specific genomic interval. (C) Average time on top of
the rotating rod for Dp(11)17/+ (light grey squares) and +/+ (white
squares), (D) Df(11)17/+ (dark grey squares) and +/+ (white
squares), and (E) Df(11)17/Dp(11)17 (black squares) and +/+(white squares) are represented. For each genotype the number of
mice tested in the rotating rod was: N = 14 for Dp(11)17/+, N = 6
for Df(11)17/+, N = 12 for +/+, and N = 8 for Df(11)17/Dp(11)17
mice. The mean 6 S.E.M. values are presented. Asterisk denotes
significantly different (* p,0.05).
Found at: doi:10.1371/journal.pbio.1000543.s001 (0.62 MB TIF)
Figure S2 Craniofacial abnormalities are dependent ongene CNV within this genomic interval. (A) Dp(11)17/+, (B)
Df(11)17/+, (C) +/+, and (D) Df(11)17/Dp(11)17 mice facial and
skull pictures are shown. Note the position of the snout and the
broader distance between the eyes (hypertelorism) for the
Df(11)17/+ mouse compared with the other mice. The shorter
distance between the eyes and the nose can also be visualized in
the Df(11)17/+ mice. (E–L) Skeletal preparations of Dp(11)17/+(E, I), Df(11)17/+ (F, J), wild type (G, K), and Df(11)17/Dp(11)17
(H, L) skulls of 3-mo male animals are shown for comparison. The
shape of the nasal bone of the Df(11)17/+ mice is shown with an
arrow (J). This phenotype is completely rescued with the addition
of an extra copy of the genes that are deleted (Df(11)17/Dp(11)17
animals) (L). (K) The different landmarks pictured in (C, I) were
used to objectively measure the distances between them. Cranial
landmarks (letter label) are as follows: b: nasal; a and c: anterior
notch on frontal process lateral to intraorbital fissure; d:
intersection of parietal and intraparietal bones; e: intersection of
the interparietal and occipital bones at the midline; f: bregma; g:
intersection of maxilla and sphenoid on inferior alveolar ridge.
The relative distances (in centimeters; see Materials and Methods)
Phenotypic and Transcriptomic Outcomes of CNV
PLoS Biology | www.plosbiology.org 9 November 2010 | Volume 8 | Issue 11 | e1000543
were used for the statistical analysis, and the averages of the
distances are shown in (M). The asterisk denotes significant
differences (p,0.05). An N = 3 was utilized for each genotype.
Found at: doi:10.1371/journal.pbio.1000543.s002 (2.91 MB TIF)
Figure S3 Weight differences are recovered with thecorrect (i.e., diploid 2n) gene copy number within thisgenomic interval. (A) Total body weight in grams, and (B)
abdominal fat weight in grams are depicted for Dp(11)17/+ (N = 8)
light grey columns, Df(11)17/+ (N = 7) dark grey columns, +/+(N = 8) white columns, and Df(11)17/Dp(11)17 (N = 8) black
columns. The mean 6 S.E.M. values are presented. The asterisk
denotes significant differences (p,0.05).
Found at: doi:10.1371/journal.pbio.1000543.s003 (0.43 MB TIF)
Figure S4 The results for the first and second round ofthe tube test for social dominance are depicted as thepercentage of winning for each genotype for (A) +/+(white columns) versus Dp(11)17/+ (light grey columns)(N = 10) mice, (B) +/+ (white columns) versus Df(11)17/+mice (dark grey columns) (N = 10), and (C) +/+ (whitecolumns) versus Df(11)17/Dp(11)17 (black columns)(N = 10) mice.
Found at: doi:10.1371/journal.pbio.1000543.s004 (0.29 MB TIF)
Figure S5 Relative expression levels measured byquantitative PCR. Ratio of aneuploid/euploid normalized
relative expression levels measured by quantitative PCR in male
cerebellum (A), female hippocampus (B), and female lung (C). The
comparisons between Df(11)17/+ (SMS model, 1n) and +/+ (2n)
and Dp(11)17/+ (PTLS model, 3n) and +/+ (2n) are shown with
burgundy squares and blue triangles, respectively (see Figure 1 for
a schematic representation of the mouse 11 B2 region of the
different mouse models). The assayed genes are ordered according
to their mapping order on MMU11. Note that the SMS/PTLS
engineered region maps from Cops3 to Zfp179. Genes and assays
are presented in Table S2.
Found at: doi:10.1371/journal.pbio.1000543.s005 (0.66 MB TIF)
Figure S6 Expression levels of flanking genes beforeand after recombination. Comparison of relative expression
levels measured by quantitative PCR in Dp(11)17/+ and +/+littermates before and after recombination. The selected genes
showed significant differences in expression between Dp(11)17/+and +/+ animals in the microarray profiling experiments (see main
text for details). They map to a 16 megabase (coordinates
MMU11:76843886-92963733) interval that recombined from a
129S5/C57BL6/J heterozygous background to a C57BL6/J/
C57BL6/J homozygous background between the 12th and 17th
backcross in Dp(11)17/+ model animals as schematically shown in
(A). Amplification results obtained in kidney (B), testis (C), and
cerebellum (D) for three different male individuals of each
genotype and backcross are shown. Blue and green triangles
denote +/+ animals after 12th and 17th backcross, respectively,
while red and black disks indicate Dp(11)17/+ animals after 12th
and 17th backcross, respectively. Genes and assays are presented in
Table S3.
Found at: doi:10.1371/journal.pbio.1000543.s006 (0.38 MB PDF)
Figure S7 Cumulative distribution of the probesetsshowing a differential expression between C57BL6/Jand 129S2 mice. The 129 probesets were removed to create the
Most-diff-restricted dataset (see main text for details).
Found at: doi:10.1371/journal.pbio.1000543.s007 (0.50 MB TIF)
Figure S8 Differentially expressed genes in SMS andPTLS mouse models. Heatmap of the changes in expression
levels of the 36 Most-diff-restricted transcripts mapping to the
SMS/PTLS rearranged interval (A) and the remainder of mouse
chromosome 11 (59 transcripts) (B) measured in Df(11)17/+ (d),
Dp(11)17/+, and Df(11)17/Dp(11)17 (dD) mice as compared to +/
+ individuals in cerebellum (C), heart (H), kidney (K), testis (T),
and hippocampus (Hi). The arrowhead and asterisk denote Cops3
and Zfp179 transcripts, respectively. These transcripts were used as
anchors in the strain engineering process, thus they are not present
in the same number of copies than other SMS/PTLS genes in the
mice models (see Figure 1 and text for details).
Found at: doi:10.1371/journal.pbio.1000543.s008 (1.52 MB TIF)
Figure S9 Genes differentially expressed in SMS andPTLS mouse models map along the entire length ofmouse chromosome 11. Normalized relative expression of
aneuploid/euploid in the vicinity of the SMS/PTLS region (A) or
along the entirety of mouse chromosome 11 (B) for Most-diff-
restricted dataset. The four top panels show measurements in four
different tissues (C, cerebellum; H, heart; K, kidney; T, testis),
while the bottom panel presents the merge of all data. The
following comparisons are shown: Df(11)17/+ (SMS model, 1n) to
+/+ (2n) with squares; Dp(11)17/+ (PTLS model, 3n) to +/+ (2n)
with triangles; and Df(11)17/Dp(11)17 (2n compound heterozy-
gote) to +/+ (2n) with disks (see Figure 1 for a schematic
representation of the mouse 11 B2 region of the different mouse
models). The genes, which show statistically significant changes in
expression between aneuploid and euploid models, are depicted
with colored signs. Chromosome 11 coordinates are shown below.
The SMS/PTLS engineered region is highlighted in light purple.
Relative gene density along the chromosome is indicated in the
bottom panels with a black line. The region between the red
dotted lines in (A) is enlarged in (B).
Found at: doi:10.1371/journal.pbio.1000543.s009 (4.12 MB PDF)
Figure S10 Affected transcripts show no correlationbetween extent of expression changes and distance fromthe breakpoints. For each affected transcripts (Most-diff-
restricted dataset), we plotted the expression changes between
aneuploid and euploid animals in function of their distance to the
breakpoints (top panel: Df(11)17/+ versus +/+; central panel:
Dp(11)1/+ versus +/+; and bottom panel: Df(11)17/Dp(11)17
versus +/+). Data for each assessed tissue were merged and the
correlation coefficient (r) was calculated.
Found at: doi:10.1371/journal.pbio.1000543.s010 (0.57 MB TIF)
Figure S11 The affected transcripts are not highlyexpressed. For each tissue and each expressed transcript, the
F-test value is plotted against the expression level measured in wild
type (+/+ genotype) or the 2n compound heterozygote (Df(11)17/
Dp(11)17). Red signs and curve denote the transcripts belonging to
the most differentially expressed set and their corresponding
Lowess curve.
Found at: doi:10.1371/journal.pbio.1000543.s011 (0.70 MB TIF)
Table S1 The viability of the different genotypes in thisinbreed genetic background is dependent on genedosage. Typical matings between animals Dp(11)17/+ 6 +/+,
Df(11)17/+ 6 +/+ and Df(11)17/+ 6 Dp(11)17/+ mice (12th
backcross in C57BL/6-Tyrc-Brd genetic background). The total
numbers of mice born from each mating type is indicated, plus the
resulting n of each genotype. The % of mice born/% expected for
each genotype is shown. The * denotes significantly different from
the expected Mendelian ratio. Gene copy number within this
genomic interval is indicated in brackets for each genotype.
Found at: doi:10.1371/journal.pbio.1000543.s012 (0.03 MB
DOC)
Phenotypic and Transcriptomic Outcomes of CNV
PLoS Biology | www.plosbiology.org 10 November 2010 | Volume 8 | Issue 11 | e1000543
Table S2 Genes and quantitative PCR assays to validatemicroarrays experiments.Found at: doi:10.1371/journal.pbio.1000543.s013 (0.05 MB XLS)
Table S3 Genes and quantitative PCR assays beforeand after recombination in three tissues.Found at: doi:10.1371/journal.pbio.1000543.s014 (0.06 MB
DOC)
Table S4 Transcripts differentially expressed in thehippocampus of Df(11)17/Dp(11)17 mouse.Found at: doi:10.1371/journal.pbio.1000543.s015 (0.08 MB XLS)
Table S5 Transcripts differentially expressed in thecerebellum of Df(11)17/Dp(11)17 mouse.Found at: doi:10.1371/journal.pbio.1000543.s016 (0.08 MB XLS)
Table S6 Genes with abnormal expression in thecompound heterozygous mice that can putatively ex-plain the phenotypes found in Df(11)17/Dp(11)17.
Found at: doi:10.1371/journal.pbio.1000543.s017 (0.05 MB
DOC)
Text S1 Online supplementary text and online supple-mentary materials and methods.Found at: doi:10.1371/journal.pbio.1000543.s018 (0.20 MB
DOC)
Acknowledgments
We thank Juan Manuel Baamonde, Otto Hagenbuchle, Keith Harshman,
Alexandra Paillusson, and Hannes Richter for technical support.
Author Contributions
The author(s) have made the following declarations about their
contributions: Conceived and designed the experiments: AR KW.
Performed the experiments: GR JM JC JIY. Analyzed the data: GR JM
NG SP FS. Contributed reagents/materials/analysis tools: WG JRL.
Wrote the paper: JRL AR KW.
References
1. Iafrate AJ, Feuk L, Rivera MN, Listewnik ML, Donahoe PK, et al. (2004)
Detection of large-scale variation in the human genome. Nat Genet 36:
949–951.
2. Sebat J, Lakshmi B, Troge J, Alexander J, Young J, et al. (2004) Large-scale copy
number polymorphism in the human genome. Science 305: 525–528.
3. Redon R, Ishikawa S, Fitch KR, Feuk L, Perry GH, et al. (2006) Global
variation in copy number in the human genome. Nature 444: 444–454.
4. Conrad DF, Pinto D, Redon R, Feuk L, Gokcumen O, et al. (2010) Origins and
functional impact of copy number variation in the human genome. Nature 464:
704–712.
5. Reymond A, Henrichsen CN, Harewood L, Merla G (2007) Side effects of
genome structural changes. Curr Opin Genet Dev 17: 381–386.
6. Hurles ME, Dermitzakis ET, Tyler-Smith C (2008) The functional impact of
structural variation in humans. Trends Genet 24: 238–245.
7. Henrichsen CN, Chaignat E, Reymond A (2009) Copy number variants,
diseases and gene expression. Hum Mol Genet 18: R1–R8.
8. Carvalho CM, Zhang F, Lupski JR (2010) Evolution in health and medicine
Sackler colloquium: genomic disorders: a window into human gene and genome
evolution. Proc Natl Acad Sci U S A 107 Suppl 1: 1765–1771.
9. Merla G, Howald C, Henrichsen CN, Lyle R, Wyss C, et al. (2006)
Submicroscopic deletion in patients with Williams-Beuren syndrome influences
expression levels of the nonhemizygous flanking genes. Am J Hum Genet 79:
332–341.
10. Stranger BE, Forrest MS, Dunning M, Ingle CE, Beazley C, et al. (2007)
Relative impact of nucleotide and copy number variation on gene expression
phenotypes. Science 315: 848–853.
11. Molina J, Carmona-Mora P, Chrast J, Krall PM, Canales CP, et al. (2008)
Abnormal social behaviors and altered gene expression rates in a mouse model
for Potocki-Lupski syndrome. Hum Mol Genet 17: 2486–2495.
12. Henrichsen CN, Vinckenbosch N, Zollner S, Chaignat E, Pradervand S, et al.
(2009) Segmental copy number variation shapes tissue transcriptomes. Nat
Genet 41: 424–429.
13. Cahan P, Li Y, Izumi M, Graubert TA (2009) The impact of copy number
variation on local gene expression in mouse hematopoietic stem and progenitor
cells. Nat Genet 41: 430–437.
14. Perry GH, Dominy NJ, Claw KG, Lee AS, Fiegler H, et al. (2007) Diet and the
evolution of human amylase gene copy number variation. Nat Genet 39:
1256–1260.
15. Lupski JR (1998) Genomic disorders: structural features of the genome can lead
to DNA rearrangements and human disease traits. Trends Genet 14: 417–422.
16. Stankiewicz P, Lupski JR (2002) Genome architecture, rearrangements and
genomic disorders. Trends Genet 18: 74–82.
17. Lupski JR (2009) Genomic disorders ten years on. Genome Med 1: 42.
18. Ionita-Laza I, Rogers AJ, Lange C, Raby BA, Lee C (2009) Genetic association
analysis of copy-number variation (CNV) in human disease pathogenesis.
Genomics 93: 22–26.
19. Zhang F, Gu W, Hurles ME, Lupski JR (2009) Copy number variation in
human health, disease, and evolution. Annu Rev Genomics Hum Genet 10:
451–481.
20. Fanciulli M, Petretto E, Aitman TJ (2010) Gene copy number variation and
common human disease. Clin Genet 77: 201–213.
21. Stankiewicz P, Lupski JR (2010) Structural variation in the human genome and
its role in disease. Annu Rev Med 61: 437–455.
22. Chen KS, Manian P, Koeuth T, Potocki L, Zhao Q, et al. (1997) Homologous
recombination of a flanking repeat gene cluster is a mechanism for a common
contiguous gene deletion syndrome. Nat Genet 17: 154–163.
23. Bi W, Yan J, Stankiewicz P, Park SS, Walz K, et al. (2002) Genes in a refinedSmith-Magenis syndrome critical deletion interval on chromosome 17p11.2 and
the syntenic region of the mouse. Genome Res 12: 713–728.
24. Potocki L, Chen KS, Park SS, Osterholm DE, Withers MA, et al. (2000)
Molecular mechanism for duplication 17p11.2- the homologous recombination
reciprocal of the Smith-Magenis microdeletion. Nat Genet 24: 84–87.
25. Slager RE, Newton TL, Vlangos CN, Finucane B, Elsea SH (2003) Mutations in
RAI1 associated with Smith-Magenis syndrome. Nat Genet 33: 466–468.
26. Bi W, Saifi GM, Girirajan S, Shi X, Szomju B, et al. (2006) RAI1 pointmutations, CAG repeat variation, and SNP analysis in non-deletion Smith-
Magenis syndrome. Am J Med Genet A 140: 2454–2463.
27. Walz K, Paylor R, Yan J, Bi W, Lupski JR (2006) Rai1 duplication causes
physical and behavioral phenotypes in a mouse model of dup(17)(p11.2p11.2).J Clin Invest 116: 3035–3041.
28. Zhang F, Potocki L, Sampson JB, Liu P, Sanchez-Valle A, et al. (2010)
Identification of uncommon recurrent Potocki-Lupski syndrome-associatedduplications and the distribution of rearrangement types and mechanisms in
PTLS. Am J Hum Genet 86: 462–470.
29. Potocki L, Shaw CJ, Stankiewicz P, Lupski JR (2003) Variability in clinicalphenotype despite common chromosomal deletion in Smith-Magenis syndrome
[del(17)(p11.2p11.2)]. Genet Med 5: 430–434.
30. Yan J, Bi W, Lupski JR (2007) Penetrance of craniofacial anomalies in mouse
models of Smith-Magenis syndrome is modified by genomic sequence
surrounding Rai1: not all null alleles are alike. Am J Hum Genet 80: 518–525.
31. Edelman EA, Girirajan S, Finucane B, Patel PI, Lupski JR, Smith AC, Elsea SH
(2007) Gender, genotype and phenotype differences in Smith-Magenissyndrome: a meta-analysis of 105 cases. Clin Genet 71: 540–550.
32. Yang Y, Chung EK, Wu YL, Savelli SL, Nagaraja HN, et al. (2007) Gene copy-
number variation and associated polymorphisms of complement component C4in human systemic lupus erythematosus (SLE): low copy number is a risk factor
for and high copy number is a protective factor against SLE susceptibility inEuropean Americans. Am J Hum Genet 80: 1037–1054.
33. Elsea SH, Girirajan S (2008) Smith-Magenis syndrome. Eur J Hum Genet 16:
412–421.
34. Walz K, Caratini-Rivera S, Bi W, Fonseca P, Mansouri DL, et al. (2003)
Modeling del(17)(p11.2p11.2) and dup(17)(p11.2p11.2) contiguous gene syn-dromes by chromosome engineering in mice: phenotypic consequences of gene
dosage imbalance. Mol Cell Biol 23: 3646–3655.
35. Walz K, Spencer C, Kaasik K, Lee CC, Lupski JR, et al. (2004) Behavioralcharacterization of mouse models for Smith-Magenis syndrome and
dup(17)(p11.2p11.2). Hum Mol Genet 13: 367–378.
36. Nadler JJ, Moy SS, Dold G, Trang D, Simmons N, et al. (2004) Automated
apparatus for quantitation of social approach behaviors in mice. Genes Brain
Behav 3: 303–314.
37. Le Hellard S, Muhleisen TW, Djurovic S, Ferno J, Ouriaghi Z, et al. (2010)
Polymorphisms in SREBF1 and SREBF2, two antipsychotic-activated tran-scription factors controlling cellular lipogenesis, are associated with schizophre-
nia in German and Scandinavian samples. Mol Psychiatry 15: 463–472.
38. Joober R, Benkelfat C, Toulouse A, Lafreniere RG, Lal S, et al. (1999) Analysisof 14 CAG repeat-containing genes in schizophrenia. Am J Med Genet 88:
694–699.
39. Toulouse A, Rochefort D, Roussel J, Joober R, Rouleau GA (2003) Molecular
cloning and characterization of human RAI1, a gene associated with
schizophrenia. Genomics 82: 162–171.
40. Treadwell-Deering DE, Powell MP, Potocki L (2010) Cognitive and behavioral
characterization of the Potocki-Lupski syndrome (duplication 17p11.2). J DevBehav Pediatr 31: 137–143.
Phenotypic and Transcriptomic Outcomes of CNV
PLoS Biology | www.plosbiology.org 11 November 2010 | Volume 8 | Issue 11 | e1000543
41. Potocki L, Bi W, Treadwell-Deering D, Carvalho CM, Eifert A, et al. (2007)
Characterization of Potocki-Lupski syndrome (dup(17)(p11.2p11.2)) and delin-eation of a dosage-sensitive critical interval that can convey an autism
phenotype. Am J Hum Genet 80: 633–649.
42. Carelle-Calmels N, Saugier-Veber P, Girard-Lemaire F, Rudolf G, Doray B,et al. (2009) Genetic compensation in a human genomic disorder. N Engl J Med
360: 1211–1216.43. Wolfer DP, Crusio WE, Lipp HP (2002) Knockout mice: simple solutions to the
problems of genetic background and flanking genes. Trends Neurosci 25:
336–340.44. Valor LM, Grant SG (2007) Clustered gene expression changes flank targeted
gene loci in knockout mice. PLoS One 2: e1303. doi:10.1371/journal.pone.0001303.
45. Gerlai R (1996) Gene-targeting studies of mammalian behavior: is it themutation or the background genotype? Trends Neurosci 19: 177–181.
46. Alberts R, Terpstra P, Li Y, Breitling R, Nap JP, et al. (2007) Sequence
polymorphisms cause many false cis eQTLs. PLoS One 2: e622. doi:10.1371/journal.pone.0000622.
47. Benovoy D, Kwan T, Majewski J (2008) Effect of polymorphisms within probe-target sequences on olignonucleotide microarray experiments. Nucleic Acids Res
36: 4417–4423.
48. Walter NA, McWeeney SK, Peters ST, Belknap JK, Hitzemann R, et al. (2007)SNPs matter: impact on detection of differential expression. Nat Methods 4:
679–680.49. Fiering S, Epner E, Robinson K, Zhuang Y, Telling A, et al. (1995) Targeted
deletion of 59HS2 of the murine beta-globin LCR reveals that it is not essentialfor proper regulation of the beta-globin locus. Genes Dev 9: 2203–2213.
50. Pham CT, MacIvor DM, Hug BA, Heusel JW, Ley TJ (1996) Long-range
disruption of gene expression by a selectable marker cassette. Proc Natl AcadSci U S A 93: 13090–13095.
51. Scarff KL, Ung KS, Sun J, Bird PI (2003) A retained selection cassette increasesreporter gene expression without affecting tissue distribution in SPI3 knockout/
GFP knock-in mice. Genesis 36: 149–157.
52. Muller U (1999) Ten years of gene targeting: targeted mouse mutants, fromvector design to phenotype analysis. Mech Dev 82: 3–21.
53. Kleinjan DA, van Heyningen V (2005) Long-range control of gene expression:emerging mechanisms and disruption in disease. Am J Hum Genet 76: 8–32.
54. Dermitzakis ET, Reymond A, Scamuffa N, Ucla C, Kirkness E, et al. (2003)Evolutionary discrimination of mammalian conserved non-genic sequences
(CNGs). Science 302: 1033–1035.
55. Reymond A, Marigo V, Yaylaoglu MB, Leoni A, Ucla C, et al. (2002) Humanchromosome 21 gene expression atlas in the mouse. Nature 420: 582–586.
56. Saxonov S, Berg P, Brutlag DL (2006) A genome-wide analysis of CpGdinucleotides in the human genome distinguishes two distinct classes of
promoters. Proc Natl Acad Sci U S A 103: 1412–1417.
57. Khaitovich P, Hellmann I, Enard W, Nowick K, Leinweber M, et al. (2005)Parallel patterns of evolution in the genomes and transcriptomes of humans and
chimpanzees. Science 309: 1850–1854.58. She X, Cheng Z, Zollner S, Church DM, Eichler EE (2008) Mouse segmental
duplication and copy number variation. Nat Genet 40: 909–914.59. Brunetti-Pierri N, Berg JS, Scaglia F, Belmont J, Bacino CA, et al. (2008)
Recurrent reciprocal 1q21.1 deletions and duplications associated with
microcephaly or macrocephaly and developmental and behavioral abnormal-ities. Nat Genet 40: 1466–1471.
60. Shinawi M, Liu P, Kang SH, Shen J, Belmont JW, et al. (2010) Recurrentreciprocal 16p11.2 rearrangements associated with global developmental delay,
behavioral problems, dysmorphism, epilepsy, and abnormal head size. J Med
Genet 47: 332–341.61. McCarthy SE, Makarov V, Kirov G, Addington AM, McClellan J, et al. (2009)
Microduplications of 16p11.2 are associated with schizophrenia. Nat Genet 41:1223–1227.
62. Consortium (2008) Rare chromosomal deletions and duplications increase risk of
schizophrenia. Nature 455: 237–241.
63. Stefansson H, Rujescu D, Cichon S, Pietilainen OP, Ingason A, et al. (2008)
Large recurrent microdeletions associated with schizophrenia. Nature 455:232–236.
64. Mefford HC, Sharp AJ, Baker C, Itsara A, Jiang Z, et al. (2008) Recurrent
rearrangements of chromosome 1q21.1 and variable pediatric phenotypes.N Engl J Med 359: 1685–1699.
65. Weiss LA, Shen Y, Korn JM, Arking DE, Miller DT, et al. (2008) Associationbetween microdeletion and microduplication at 16p11.2 and autism.
N Engl J Med 358: 667–675.
66. Walters RG, Jacquemont S, Valsesia A, de Smith AJ, Martinet D, et al. (2010) Anew highly penetrant form of obesity due to deletions on chromosome 16p11.2.
Nature 463: 671–675.67. Bochukova EG, Huang N, Keogh J, Henning E, Purmann C, et al. (2010) Large,
rare chromosomal deletions associated with severe early-onset obesity. Nature463: 666–670.
68. Consortium TIS (2008) Rare chromosomal deletions and duplications increase
risk of schizophrenia. Nature 455: 237–241.69. Walsh T, McClellan JM, McCarthy SE, Addington AM, Pierce SB, et al. (2008)
Rare structural variants disrupt multiple genes in neurodevelopmental pathwaysin schizophrenia. Science 320: 539–543.
70. Bijlsma EK, Gijsbers AC, Schuurs-Hoeijmakers JH, van Haeringen A, Fransen
van de Putte DE, et al. (2009) Extending the phenotype of recurrentrearrangements of 16p11.2: deletions in mentally retarded patients without
autism and in normal individuals. Eur J Med Genet 52: 77–87.71. Kumar RA, KaraMohamed S, Sudi J, Conrad DF, Brune C, et al. (2008)
Recurrent 16p11.2 microdeletions in autism. Hum Mol Genet 17: 628–638.72. Marshall CR, Noor A, Vincent JB, Lionel AC, Feuk L, et al. (2008) Structural
variation of chromosomes in autism spectrum disorder. Am J Hum Genet 82:
477–488.73. Crespi B, Badcock C (2008) Psychosis and autism as diametrical disorders of the
social brain. Behav Brain Sci 31: 241–261; discussion 261–320.74. Crespi B, Stead P, Elliot M (2010) Evolution in health and medicine Sackler
colloquium: comparative genomics of autism and schizophrenia. Proc Natl Acad
Sci U S A 107 Suppl 1: 1736–1741.75. Crespi B, Summers K, Dorus S (2009) Genomic sister-disorders of neurodevel-
opment: an evolutionary approach. Evolutionary Applications 2: 81–100.76. Girirajan S, Patel N, Slager RE, Tokarz ME, Bucan M, et al. (2008) How much
is too much? Phenotypic consequences of Rai1 overexpression in mice.Eur J Hum Genet 16: 941–954.
77. De Leersnyder H (2006) Inverted rhythm of melatonin secretion in Smith-
Magenis syndrome: from symptoms to treatment. Trends Endocrinol Metab 17:291–298.
78. Gropman AL, Elsea S, Duncan WC, Jr., Smith AC (2007) New developments inSmith-Magenis syndrome (del 17p11.2). Curr Opin Neurol 20: 125–134.
79. Gabellini D, Green MR, Tupler R (2002) Inappropriate gene activation in
FSHD: a repressor complex binds a chromosomal repeat deleted in dystrophicmuscle. Cell 110: 339–348.
80. Lettice LA, Horikoshi T, Heaney SJ, van Baren MJ, van der Linde HC, et al.(2002) Disruption of a long-range cis-acting regulator for Shh causes preaxial
polydactyly. Proc Natl Acad Sci U S A 99: 7548–7553.81. Denoeud F, Kapranov P, Ucla C, Frankish A, Castelo R, et al. (2007) Prominent
use of distal 59 transcription start sites and discovery of a large number of
additional exons in ENCODE regions. Genome Res 17: 746–759.82. Finlan LE, Sproul D, Thomson I, Boyle S, Kerr E, et al. (2008) Recruitment to
the nuclear periphery can alter expression of genes in human cells. PLoS Genet4: e1000039. doi:10.1371/journal.pgen.1000039.
83. Deng W, Blobel GA (2010) Do chromatin loops provide epigenetic gene
expression states? Curr Opin Genet Dev 20: 548–554.84. Harewood L, Schutz F, Boyle S, Perry P, Delorenzi M, et al. (2010) The effect of
translocation-induced nuclear reorganization on gene expression. Genome Res20: 554–564.
85. McCarroll SA (2008) Extending genome-wide association studies to copy-
number variation. Hum Mol Genet 17: R135–R142.
Phenotypic and Transcriptomic Outcomes of CNV
PLoS Biology | www.plosbiology.org 12 November 2010 | Volume 8 | Issue 11 | e1000543