Embed Size (px)
Citation preview
PHENOMENON OF AN ENERGETIC CHARGED PARTICLEEMISSION FROM HYDROGEN/DEUTERIUM LOADED METALS
A.G. LIPSON AND G.H. MILEY
Department of Nuclear, Plasma and Radiological EngineeringUniversity of Illinois at Urbana-Champaign
103S Goodwin Avenue, Urbana, IL 61801, USAand
Russian Academy of Sciences, Institute of Physical Chemistry, 31 Leninsky prospect,Moscow 117915, Russia
G.H. MILEY
Department of Nuclear, Plasma and Radiological EngineeringUniversity of Illinois at Urbana-Champaign, 103S Goodwin Avenue, Urbana, IL 61801,
USA
A.S. ROUSSETSKI
Russian Academy of Sciences, Lebedev Physics Institute, 53 Leninsky Prospect, Moscow117333, Russia
E.I. SAUNIN
Russian Academy of Sciences, Institute of Physical Chemistry, 31 Leninsky prospect,Moscow 117915, Russia
We report the discovery of the new phenomenon of energetic alpha emission (up
to 16.0MeV), and proton emission (∼1.7MeV), from a metal surface possessinga large affinity for hydrogen and loaded/excited by electrolysis, glow discharge or
powerful laser. Various experiments on charged particle emission show a remark-able feature: all exhibit a similar yield per unit input energy of energetic alphas
[one alpha particle per 10–15eV input energy/Pd(Ti) target atom], independentof the excitation power of delivering method (electrolysis, glow discharge or laser
irradiation). The results suggest that the mechanism of energy transfer resultingin energetic particle emission in metal targets loaded with hydrogen is similar,
despite the seemingly dissimilar excitation techniques.
1. Introduction
Charged particle emission from the surface of Pd and Ti deuterides has been studiedsince the beginning of experiments on low energy nuclear reactions (LENR) productdetection in metal deuterides. The first charged particle detection experiments wereintended primarily to confirm the generation of DD-reaction products (3.0MeVprotons and 1.0 MeV tritons) in the metal deuteride system. However, along with
539
540
0.5 1.0 2.0 3.0 4.0 5.0 6.0 7.0 8.0 9.0 10.0 E[MeV]
0
5
10
15
Cou
nt
1000 2000 3000 40000
Channel Number
Figure 1. Typical silicon surface barrier detector charged particle spectrum taken over 8 days.
charged DD-reaction products, there appeared reports concerning the detection ofmore energetic particles than would be expected from DD-reactions,1–4 especiallyduring accelerator bombardment of Ti and Pd targets with deuterons at 100-keV.
We reported previously the observation of high energy alpha particle emissionin the energy range 8–14MeV during exothermic deuterium or hydrogen desorptionthat could not be ascribed to known natural alpha emitters. A typical charged par-ticle spectrum taken in vacuum using an SSB-detector for about 8 days shows nocounts beyond an energy of 8.0MeV (Fig. 1).5 This is not surprising since the max-imum alpha energy of radon series is about 7.8MeV, while the energy of cosmic rayinduced protons rarely exceeds 2.0MeV. In contrast to the background, the dE–E
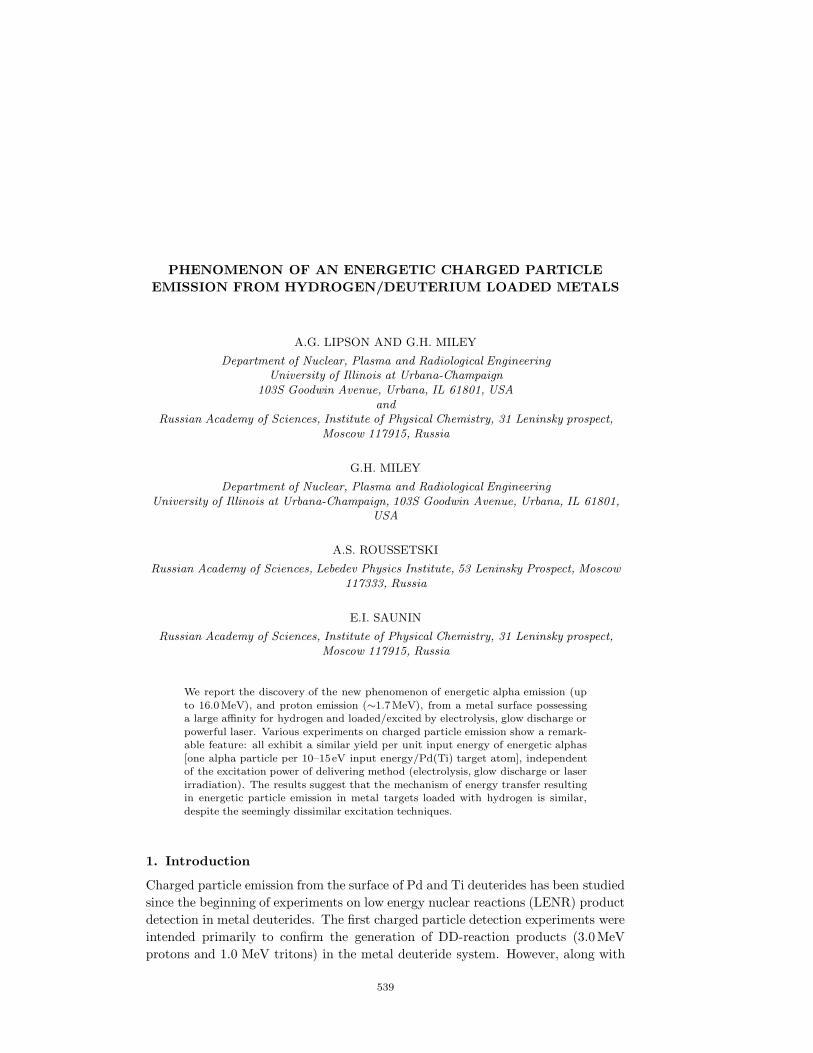
spectra detected (see Fig. 2) from Au/Pd/PdO:D(H)x samples during exothermic
Figure 2. Schematic of experimental arrangement for detection with dE-E detector.
541
dE/E TDC 750-920 ch
dE/E TDC 750-920 ch
2000
1750
1500
1250
1000
750
500
250
00
dE [C
hann
el]
2000
1750
1500
1250
1000
750
500
250
0
dE [C
hann
el]
250 500 750 1000 1250 1500 1750 2000
E[Channel]
0 250 500 750 1000 1250 1500 1750 2000E[Channel]
7.0 MeV
8.0 MeV
10.0 MeV
12.0 MeV14.0 MeV
3.5
3.0
3.5
2.0
1.5
Ep
Ep
Eα
Eα
(a)
(b)
7.0 MeV
8.0 MeV
10.0 MeV
12.0 MeV
14.0 MeV
3.5
2.5
2.0
1.5
3.0
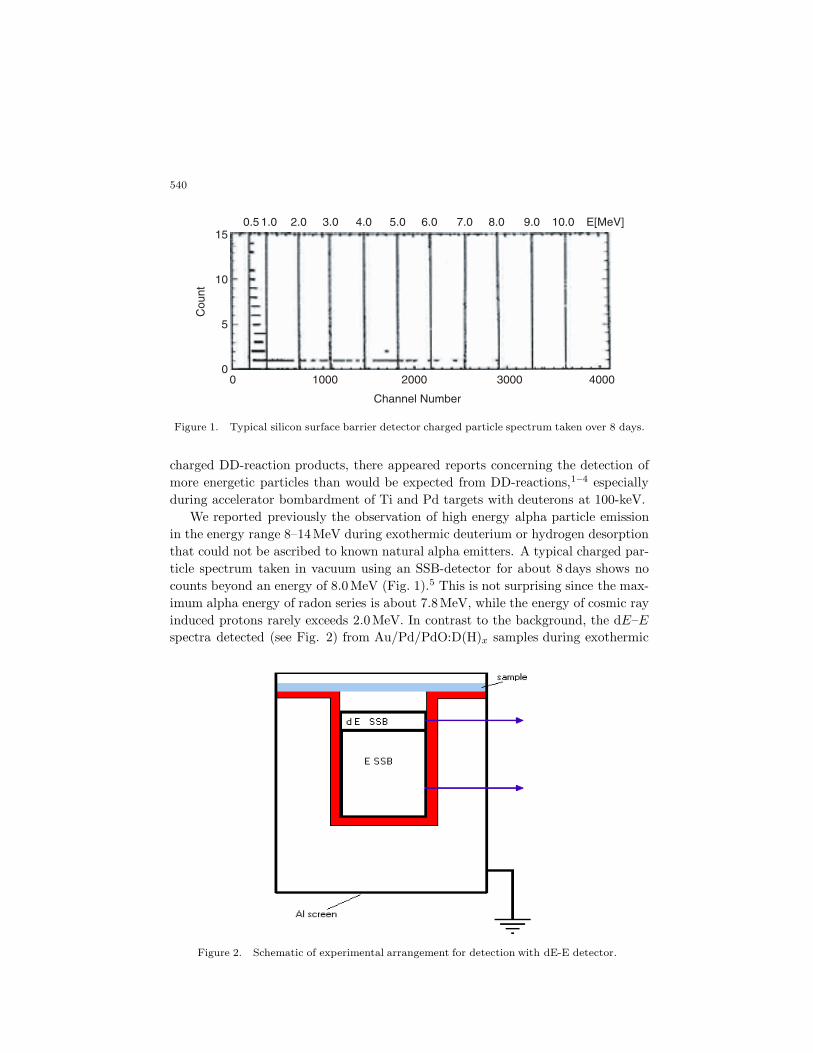
Figure 3. Summary of the results of two-dimensional charged particle spectra obtained with dE-E
counter telescope at atmospheric pressure. (a) Au/Pd/PdO:D samples with thickness in the rangeof 40 - 60 µm (for total exposure time
∑τD = 2.0×10⁶ s); (b) and for the similar Au/Pd/PdO:H
samples (∑
τH = 4.5×10⁵ s). The broad inclined strip within 200 - 2000 ch on the E axes and 600- 1200 ch on dE axes corresponds to alpha particle positions in the energy range 5.5 < Eα < 14.0
MeV in accordance with stopping range calculation for Si taking into account dE and E detectorthickness (dashed line with error bars). The dashed line below alpha-band marks the 1.0-3.5 MeV
proton band. The counts that are shown directly at both E and dE axes (i.e. one - dimensional)are ascribed to electromagnetic noise or high/low energy cosmic background particles.
deuterium desorption showed clearly the presence of a high energy alpha component(Fig. 3).6 New insight was recently obtained from the use of CR-39 track detectorsto the study energetic particle emissions from the surface of Pd/Ti loaded withhydrogen/deuterium.7 Experimental runs with CR-39 to detect long-range alphaparticles in situ during electrolysis of Pd/dielectric substrate cathodes showed en-
542
trac
k di
amet
er (µm
)
alpha energy (MeV)
5
6
7
8
9
10
11
12
13
0 5 10 15 20 25 30
Fukuvi
Landauer
4.5
5
5.5
6
6.5
7
7.5
8
8.5
9
0.5 1 1.5 2 2.5 3 3.5
Landauer CR-39
Fukuvi CR-39
trac
k di
amet
er (µm
)
proton energy (MeV)
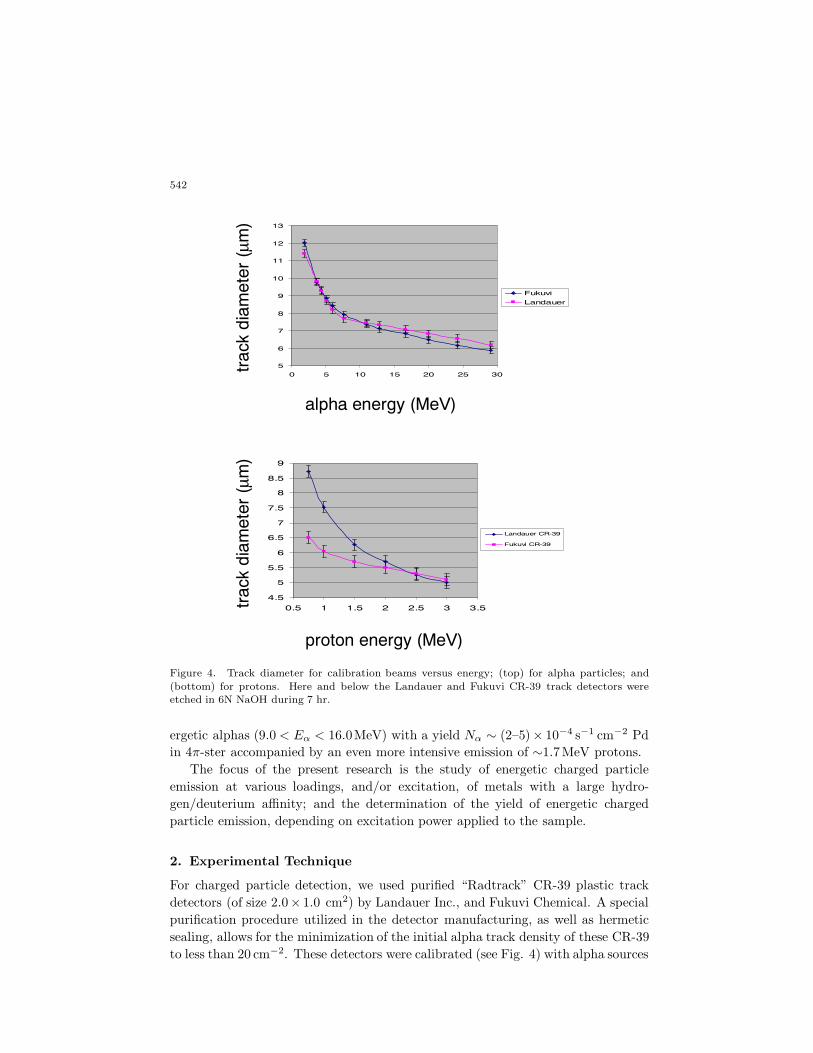
Figure 4. Track diameter for calibration beams versus energy; (top) for alpha particles; and
(bottom) for protons. Here and below the Landauer and Fukuvi CR-39 track detectors wereetched in 6N NaOH during 7 hr.
ergetic alphas (9.0 < Eα < 16.0MeV) with a yield Nα ∼ (2–5)× 10−4 s−1 cm−2 Pdin 4π-ster accompanied by an even more intensive emission of ∼1.7MeV protons.
The focus of the present research is the study of energetic charged particleemission at various loadings, and/or excitation, of metals with a large hydro-gen/deuterium affinity; and the determination of the yield of energetic chargedparticle emission, depending on excitation power applied to the sample.
2. Experimental Technique
For charged particle detection, we used purified “Radtrack” CR-39 plastic trackdetectors (of size 2.0× 1.0 cm2) by Landauer Inc., and Fukuvi Chemical. A specialpurification procedure utilized in the detector manufacturing, as well as hermeticsealing, allows for the minimization of the initial alpha track density of these CR-39to less than 20 cm−2. These detectors were calibrated (see Fig. 4) with alpha sources
543
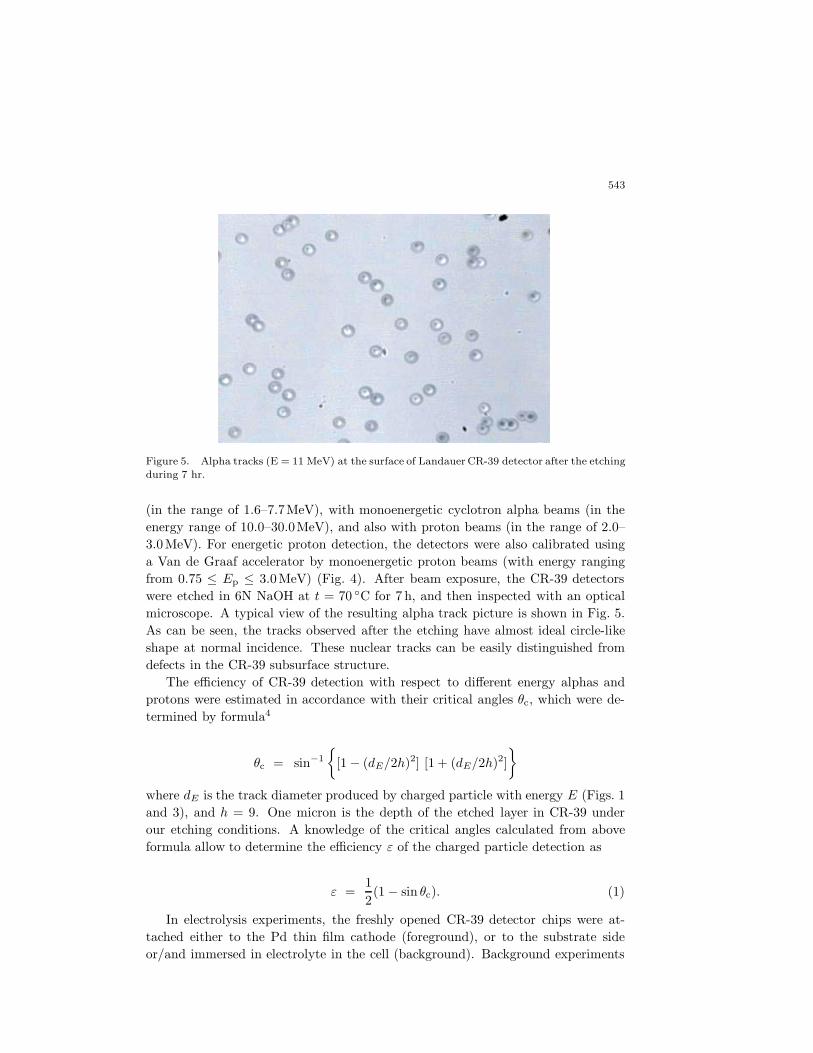
Figure 5. Alpha tracks (E = 11 MeV) at the surface of Landauer CR-39 detector after the etching
during 7 hr.
(in the range of 1.6–7.7MeV), with monoenergetic cyclotron alpha beams (in theenergy range of 10.0–30.0MeV), and also with proton beams (in the range of 2.0–3.0MeV). For energetic proton detection, the detectors were also calibrated usinga Van de Graaf accelerator by monoenergetic proton beams (with energy rangingfrom 0.75 ≤ Ep ≤ 3.0MeV) (Fig. 4). After beam exposure, the CR-39 detectorswere etched in 6N NaOH at t = 70 ◦C for 7 h, and then inspected with an opticalmicroscope. A typical view of the resulting alpha track picture is shown in Fig. 5.As can be seen, the tracks observed after the etching have almost ideal circle-likeshape at normal incidence. These nuclear tracks can be easily distinguished fromdefects in the CR-39 subsurface structure.
The efficiency of CR-39 detection with respect to different energy alphas andprotons were estimated in accordance with their critical angles θc, which were de-termined by formula4
θc = sin−1
{[1 − (dE/2h)2] [1 + (dE/2h)2]
}
where dE is the track diameter produced by charged particle with energy E (Figs. 1and 3), and h = 9. One micron is the depth of the etched layer in CR-39 underour etching conditions. A knowledge of the critical angles calculated from aboveformula allow to determine the efficiency ε of the charged particle detection as
ε =12(1 − sin θc). (1)
In electrolysis experiments, the freshly opened CR-39 detector chips were at-tached either to the Pd thin film cathode (foreground), or to the substrate sideor/and immersed in electrolyte in the cell (background). Background experiments
544
Ti:D, GD, U=2175 V, I=250 mA, t=7.0 hrs(CR-39/11µm AI)Background in GD chamber, CR-39/11 µm AI[Ti:D - Background]
7 8 9 10 11
25
20
15
10
5
0
−5 Track diameter, [µm]
Trac
k de
nsity
, [cm
-2]
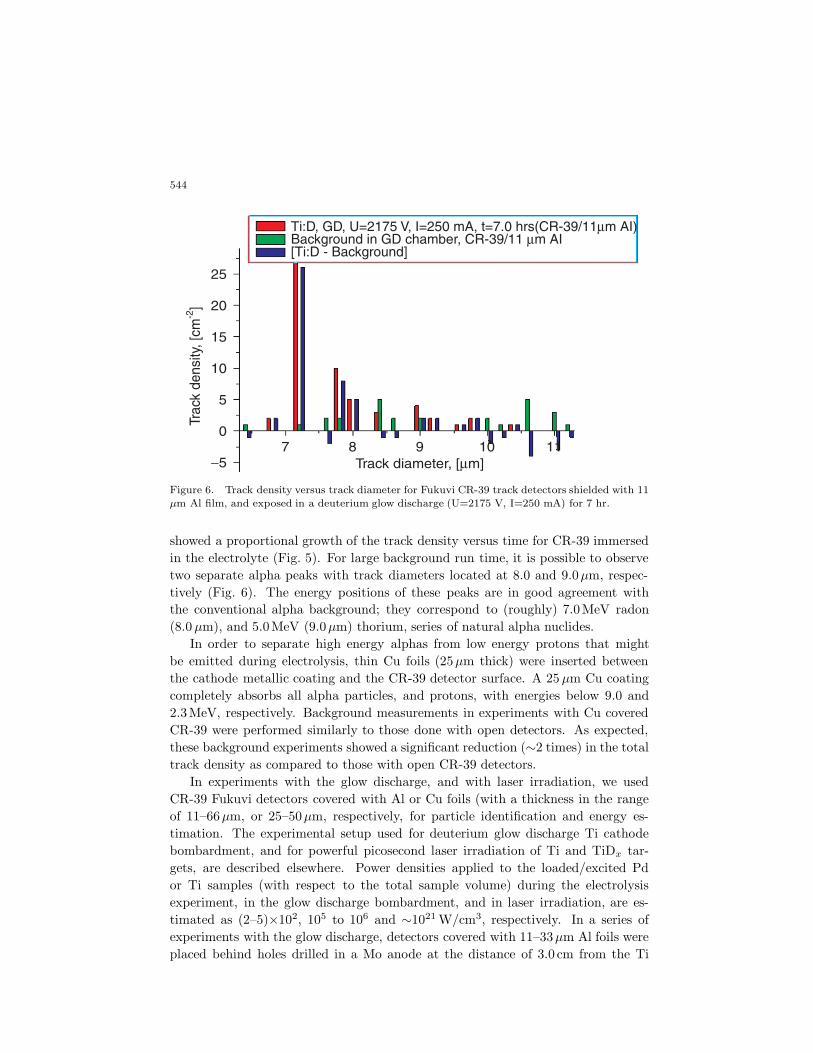
Figure 6. Track density versus track diameter for Fukuvi CR-39 track detectors shielded with 11
µm Al film, and exposed in a deuterium glow discharge (U=2175 V, I=250 mA) for 7 hr.
showed a proportional growth of the track density versus time for CR-39 immersedin the electrolyte (Fig. 5). For large background run time, it is possible to observetwo separate alpha peaks with track diameters located at 8.0 and 9.0µm, respec-tively (Fig. 6). The energy positions of these peaks are in good agreement withthe conventional alpha background; they correspond to (roughly) 7.0MeV radon(8.0 µm), and 5.0MeV (9.0µm) thorium, series of natural alpha nuclides.
In order to separate high energy alphas from low energy protons that mightbe emitted during electrolysis, thin Cu foils (25µm thick) were inserted betweenthe cathode metallic coating and the CR-39 detector surface. A 25 µm Cu coatingcompletely absorbs all alpha particles, and protons, with energies below 9.0 and2.3MeV, respectively. Background measurements in experiments with Cu coveredCR-39 were performed similarly to those done with open detectors. As expected,these background experiments showed a significant reduction (∼2 times) in the totaltrack density as compared to those with open CR-39 detectors.
In experiments with the glow discharge, and with laser irradiation, we usedCR-39 Fukuvi detectors covered with Al or Cu foils (with a thickness in the rangeof 11–66µm, or 25–50µm, respectively, for particle identification and energy es-timation. The experimental setup used for deuterium glow discharge Ti cathodebombardment, and for powerful picosecond laser irradiation of Ti and TiDx tar-gets, are described elsewhere. Power densities applied to the loaded/excited Pdor Ti samples (with respect to the total sample volume) during the electrolysisexperiment, in the glow discharge bombardment, and in laser irradiation, are es-timated as (2–5)×102, 105 to 106 and ∼1021 W/cm3, respectively. In a series ofexperiments with the glow discharge, detectors covered with 11–33µm Al foils wereplaced behind holes drilled in a Mo anode at the distance of 3.0 cm from the Ti
545
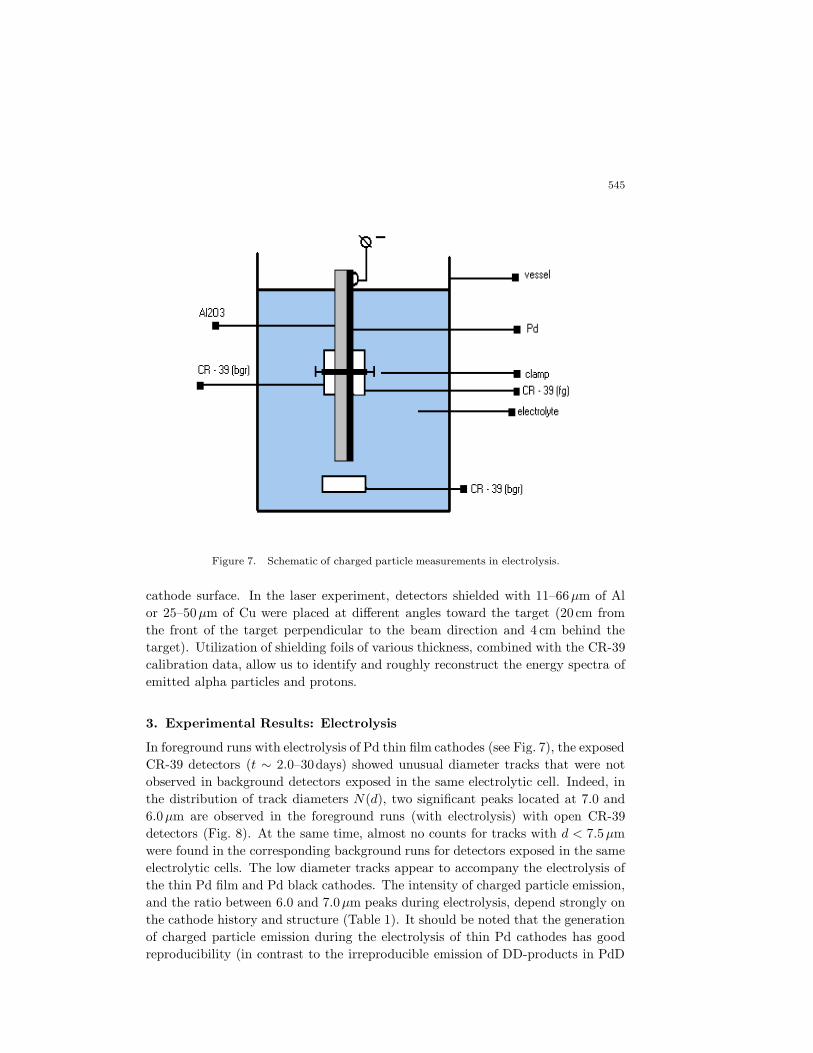
Figure 7. Schematic of charged particle measurements in electrolysis.
cathode surface. In the laser experiment, detectors shielded with 11–66µm of Alor 25–50µm of Cu were placed at different angles toward the target (20 cm fromthe front of the target perpendicular to the beam direction and 4 cm behind thetarget). Utilization of shielding foils of various thickness, combined with the CR-39calibration data, allow us to identify and roughly reconstruct the energy spectra ofemitted alpha particles and protons.
3. Experimental Results: Electrolysis
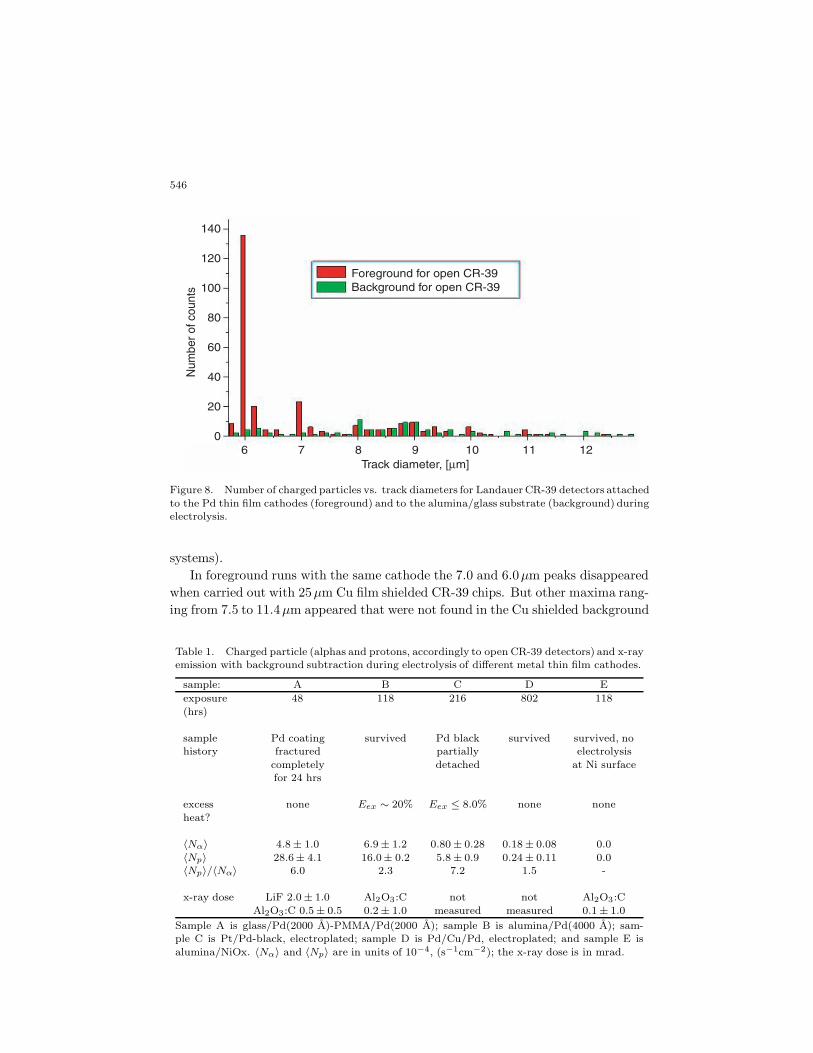
In foreground runs with electrolysis of Pd thin film cathodes (see Fig. 7), the exposedCR-39 detectors (t ∼ 2.0–30days) showed unusual diameter tracks that were notobserved in background detectors exposed in the same electrolytic cell. Indeed, inthe distribution of track diameters N(d), two significant peaks located at 7.0 and6.0µm are observed in the foreground runs (with electrolysis) with open CR-39detectors (Fig. 8). At the same time, almost no counts for tracks with d < 7.5µmwere found in the corresponding background runs for detectors exposed in the sameelectrolytic cells. The low diameter tracks appear to accompany the electrolysis ofthe thin Pd film and Pd black cathodes. The intensity of charged particle emission,and the ratio between 6.0 and 7.0µm peaks during electrolysis, depend strongly onthe cathode history and structure (Table 1). It should be noted that the generationof charged particle emission during the electrolysis of thin Pd cathodes has goodreproducibility (in contrast to the irreproducible emission of DD-products in PdD
546
Foreground for open CR-39Background for open CR-39
140
120
100
80
60
40
20
0
Num
ber
of c
ount
s
6 7 8 9 10 11 12Track diameter, [µm]
Figure 8. Number of charged particles vs. track diameters for Landauer CR-39 detectors attached
to the Pd thin film cathodes (foreground) and to the alumina/glass substrate (background) duringelectrolysis.
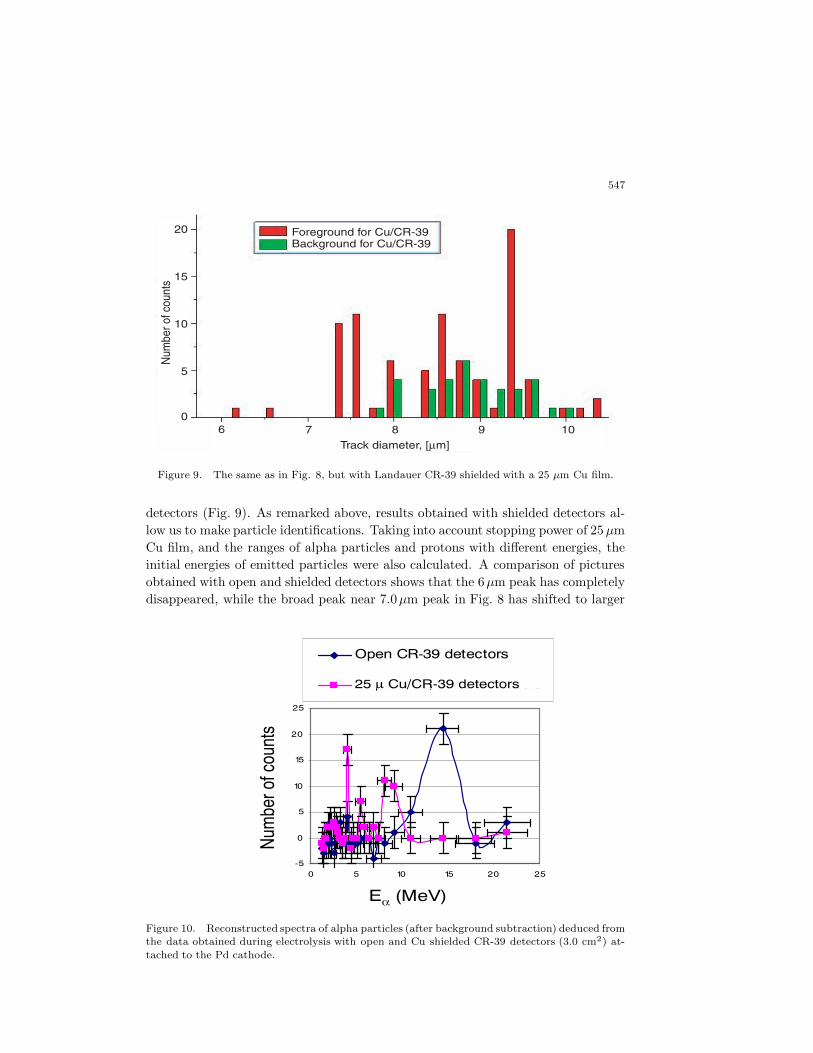
systems).In foreground runs with the same cathode the 7.0 and 6.0µm peaks disappeared
when carried out with 25µm Cu film shielded CR-39 chips. But other maxima rang-ing from 7.5 to 11.4µm appeared that were not found in the Cu shielded background
Table 1. Charged particle (alphas and protons, accordingly to open CR-39 detectors) and x-rayemission with background subtraction during electrolysis of different metal thin film cathodes.
sample: A B C D E
exposure 48 118 216 802 118
(hrs)
sample Pd coating survived Pd black survived survived, nohistory fractured partially electrolysis
completely detached at Ni surfacefor 24 hrs
excess none Eex ∼ 20% Eex ≤ 8.0% none none
heat?
〈Nα〉 4.8 ± 1.0 6.9 ± 1.2 0.80 ± 0.28 0.18 ± 0.08 0.0
〈Np〉 28.6± 4.1 16.0± 0.2 5.8 ± 0.9 0.24 ± 0.11 0.0〈Np〉/〈Nα〉 6.0 2.3 7.2 1.5 -
x-ray dose LiF 2.0 ± 1.0 Al2O3:C not not Al2O3:C
Al2O3:C 0.5 ± 0.5 0.2 ± 1.0 measured measured 0.1 ± 1.0
Sample A is glass/Pd(2000 A)-PMMA/Pd(2000 A); sample B is alumina/Pd(4000 A); sam-ple C is Pt/Pd-black, electroplated; sample D is Pd/Cu/Pd, electroplated; and sample E is
alumina/NiOx. 〈Nα〉 and 〈Np〉 are in units of 10−4, (s−1cm−2); the x-ray dose is in mrad.
547
Foreground for Cu/CR-39Background for Cu/CR-39
6 7 8 9 10
Track diameter, [µm]
20
15
10
5
0
Num
ber o
f cou
nts
Figure 9. The same as in Fig. 8, but with Landauer CR-39 shielded with a 25 µm Cu film.
detectors (Fig. 9). As remarked above, results obtained with shielded detectors al-low us to make particle identifications. Taking into account stopping power of 25 µmCu film, and the ranges of alpha particles and protons with different energies, theinitial energies of emitted particles were also calculated. A comparison of picturesobtained with open and shielded detectors shows that the 6µm peak has completelydisappeared, while the broad peak near 7.0µm peak in Fig. 8 has shifted to larger
-5
0
5
10
15
20
25
0 5 10 15 20 25
Open CR-39 detectors
25 mcmCu/CR39 detectors
Eα (MeV)
Num
ber o
f cou
nts
25 µ Cu/CR-39 detectors
Figure 10. Reconstructed spectra of alpha particles (after background subtraction) deduced fromthe data obtained during electrolysis with open and Cu shielded CR-39 detectors (3.0 cm2) at-
tached to the Pd cathode.
548
Ep (MeV)
Num
ber o
f cou
nts
39(S=3.0 cm2)
0
30
60
90
20
50
0.5 1 1.5 2 2.5
Open CR-39 Cu/CR-39
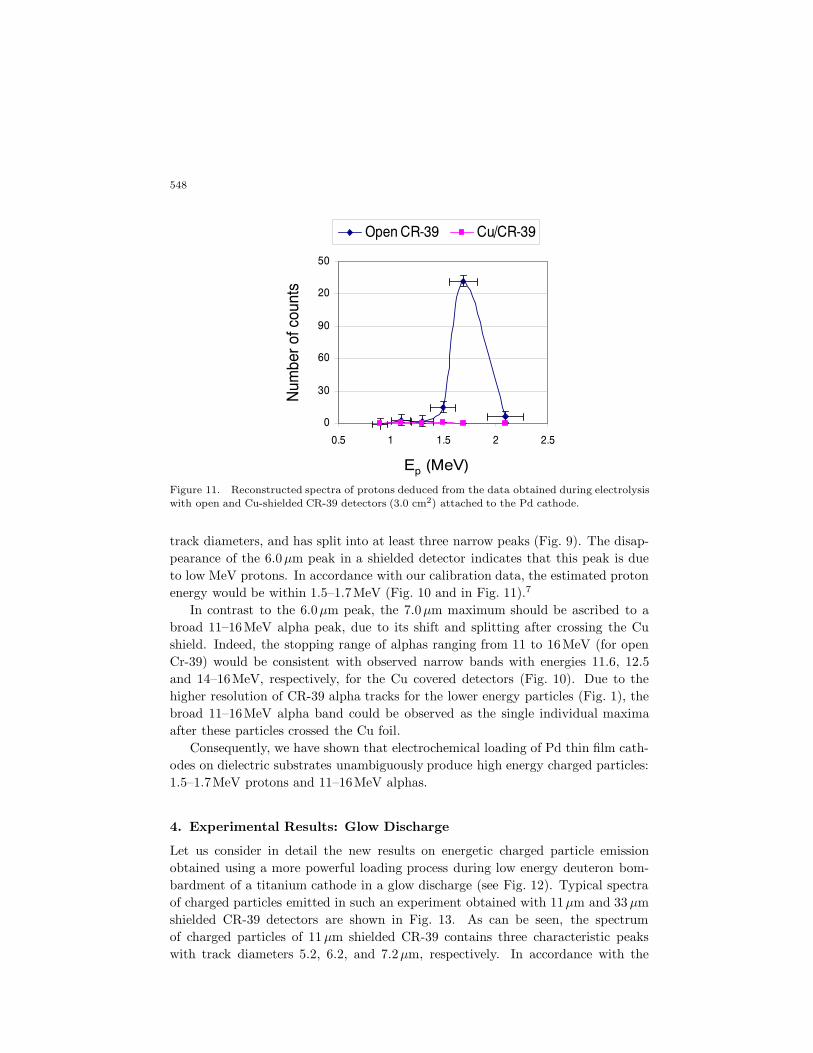
Figure 11. Reconstructed spectra of protons deduced from the data obtained during electrolysis
with open and Cu-shielded CR-39 detectors (3.0 cm2) attached to the Pd cathode.
track diameters, and has split into at least three narrow peaks (Fig. 9). The disap-pearance of the 6.0µm peak in a shielded detector indicates that this peak is dueto low MeV protons. In accordance with our calibration data, the estimated protonenergy would be within 1.5–1.7MeV (Fig. 10 and in Fig. 11).7
In contrast to the 6.0µm peak, the 7.0µm maximum should be ascribed to abroad 11–16MeV alpha peak, due to its shift and splitting after crossing the Cushield. Indeed, the stopping range of alphas ranging from 11 to 16MeV (for openCr-39) would be consistent with observed narrow bands with energies 11.6, 12.5and 14–16MeV, respectively, for the Cu covered detectors (Fig. 10). Due to thehigher resolution of CR-39 alpha tracks for the lower energy particles (Fig. 1), thebroad 11–16MeV alpha band could be observed as the single individual maximaafter these particles crossed the Cu foil.
Consequently, we have shown that electrochemical loading of Pd thin film cath-odes on dielectric substrates unambiguously produce high energy charged particles:1.5–1.7MeV protons and 11–16MeV alphas.
4. Experimental Results: Glow Discharge
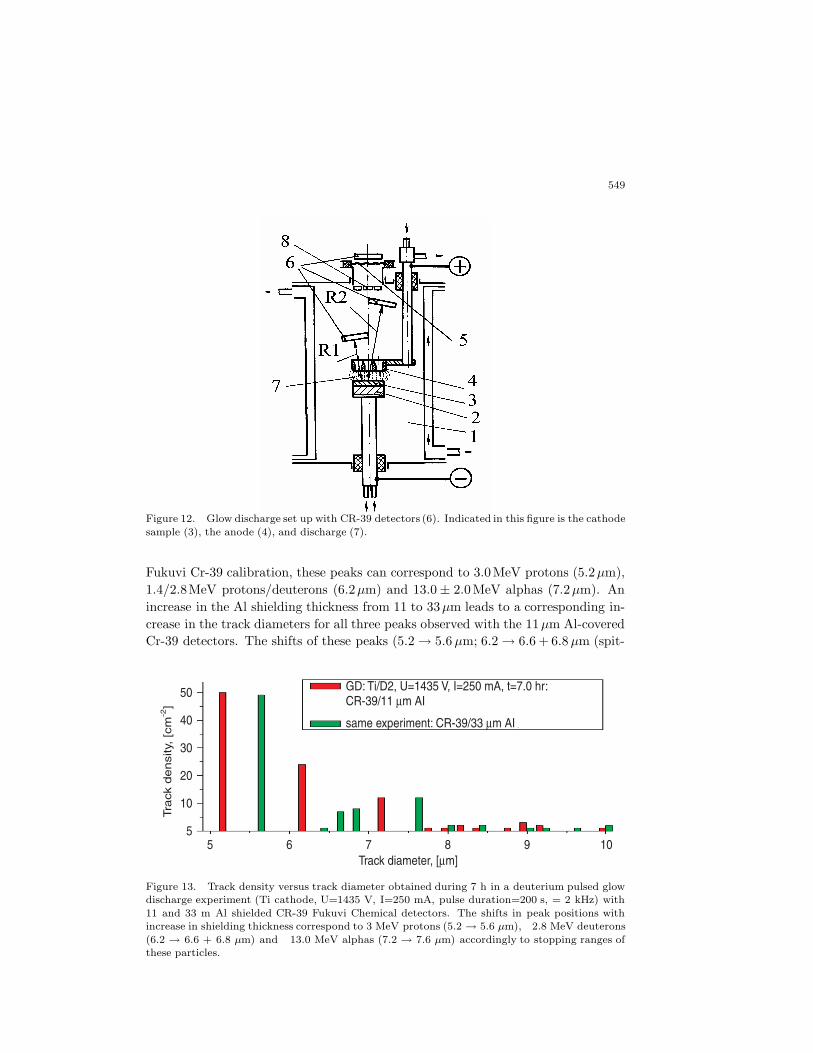
Let us consider in detail the new results on energetic charged particle emissionobtained using a more powerful loading process during low energy deuteron bom-bardment of a titanium cathode in a glow discharge (see Fig. 12). Typical spectraof charged particles emitted in such an experiment obtained with 11µm and 33 µmshielded CR-39 detectors are shown in Fig. 13. As can be seen, the spectrumof charged particles of 11 µm shielded CR-39 contains three characteristic peakswith track diameters 5.2, 6.2, and 7.2µm, respectively. In accordance with the
549
Figure 12. Glow discharge set up with CR-39 detectors (6). Indicated in this figure is the cathode
sample (3), the anode (4), and discharge (7).
Fukuvi Cr-39 calibration, these peaks can correspond to 3.0MeV protons (5.2µm),1.4/2.8MeV protons/deuterons (6.2µm) and 13.0 ± 2.0MeV alphas (7.2µm). Anincrease in the Al shielding thickness from 11 to 33µm leads to a corresponding in-crease in the track diameters for all three peaks observed with the 11µm Al-coveredCr-39 detectors. The shifts of these peaks (5.2 → 5.6 µm; 6.2 → 6.6 + 6.8 µm (spit-
GD: Ti/D2, U=1435 V, I=250 mA, t=7.0 hr: CR-39/11 µm AI
same experiment: CR-39/33 µm AI
50
40
30
20
10
55 6 7 8 9 10
Track diameter, [µm]
Track
density,
[cm
-2]
Figure 13. Track density versus track diameter obtained during 7 h in a deuterium pulsed glowdischarge experiment (Ti cathode, U=1435 V, I=250 mA, pulse duration=200 s, = 2 kHz) with
11 and 33 m Al shielded CR-39 Fukuvi Chemical detectors. The shifts in peak positions withincrease in shielding thickness correspond to 3 MeV protons (5.2 → 5.6 µm), 2.8 MeV deuterons
(6.2 → 6.6 + 6.8 µm) and 13.0 MeV alphas (7.2 → 7.6 µm) accordingly to stopping ranges ofthese particles.
550
Ti:D, GD, U=2175 V, I=250 mA, t=7.0 hrs(CR-39/11µm AI)Background in GD chamber, CR-39/11 µm AI[Ti:D - Background]
7 8 9 10 11
25
20
15
10
5
0
−5 Track diameter, [µm]
Trac
k de
nsity
, [cm
-2]
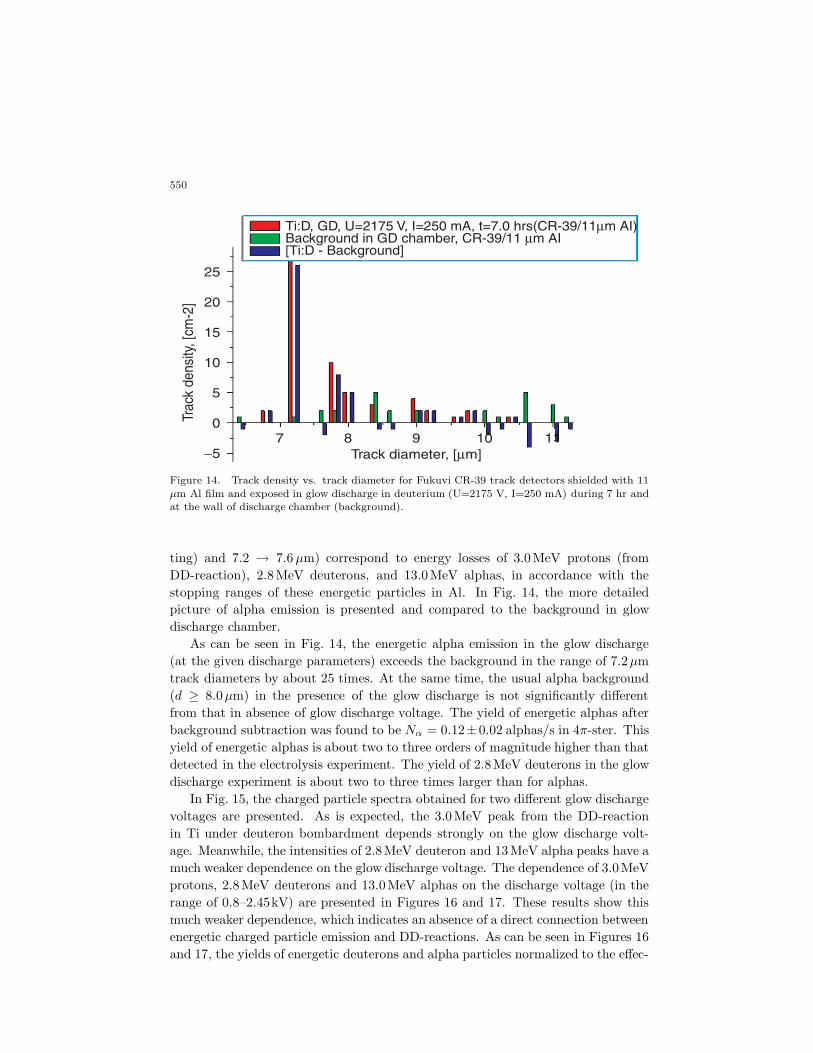
Figure 14. Track density vs. track diameter for Fukuvi CR-39 track detectors shielded with 11
µm Al film and exposed in glow discharge in deuterium (U=2175 V, I=250 mA) during 7 hr andat the wall of discharge chamber (background).
ting) and 7.2 → 7.6 µm) correspond to energy losses of 3.0MeV protons (fromDD-reaction), 2.8MeV deuterons, and 13.0MeV alphas, in accordance with thestopping ranges of these energetic particles in Al. In Fig. 14, the more detailedpicture of alpha emission is presented and compared to the background in glowdischarge chamber.
As can be seen in Fig. 14, the energetic alpha emission in the glow discharge(at the given discharge parameters) exceeds the background in the range of 7.2µmtrack diameters by about 25 times. At the same time, the usual alpha background(d ≥ 8.0µm) in the presence of the glow discharge is not significantly differentfrom that in absence of glow discharge voltage. The yield of energetic alphas afterbackground subtraction was found to be Nα = 0.12±0.02 alphas/s in 4π-ster. Thisyield of energetic alphas is about two to three orders of magnitude higher than thatdetected in the electrolysis experiment. The yield of 2.8MeV deuterons in the glowdischarge experiment is about two to three times larger than for alphas.
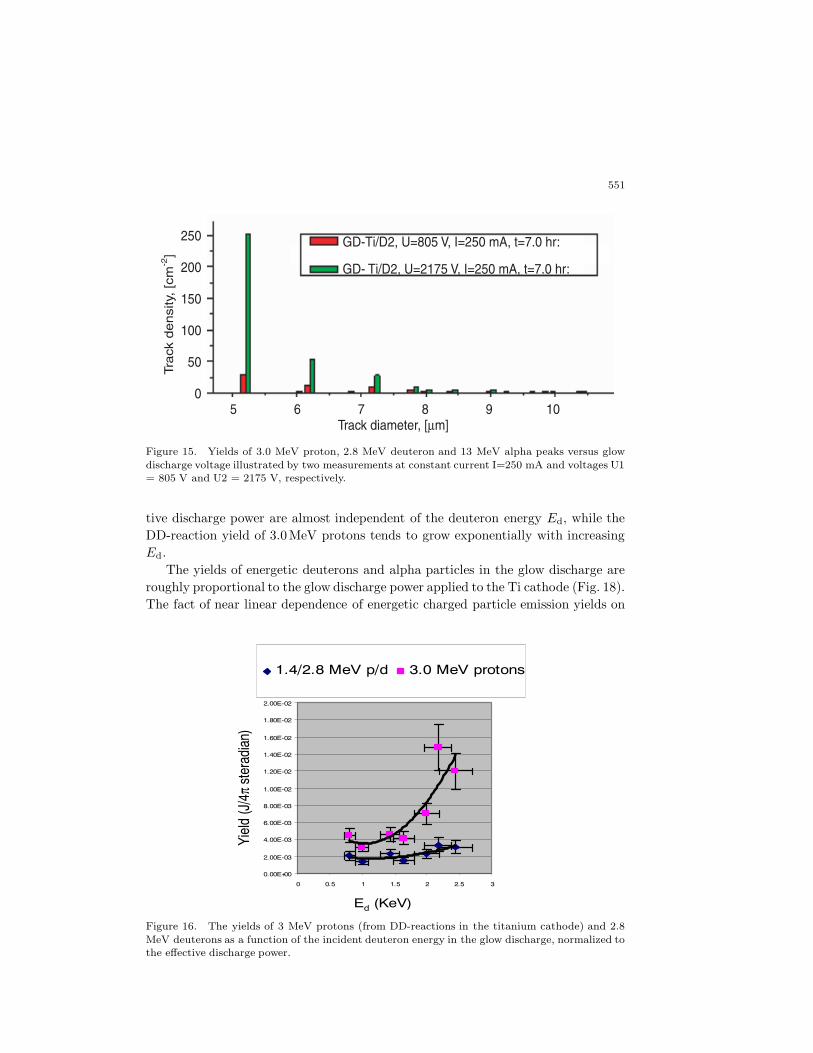
In Fig. 15, the charged particle spectra obtained for two different glow dischargevoltages are presented. As is expected, the 3.0MeV peak from the DD-reactionin Ti under deuteron bombardment depends strongly on the glow discharge volt-age. Meanwhile, the intensities of 2.8MeV deuteron and 13MeV alpha peaks have amuch weaker dependence on the glow discharge voltage. The dependence of 3.0MeVprotons, 2.8MeV deuterons and 13.0MeV alphas on the discharge voltage (in therange of 0.8–2.45kV) are presented in Figures 16 and 17. These results show thismuch weaker dependence, which indicates an absence of a direct connection betweenenergetic charged particle emission and DD-reactions. As can be seen in Figures 16and 17, the yields of energetic deuterons and alpha particles normalized to the effec-
551
GD- Ti/D2, U=2175 V, I=250 mA, t=7.0 hr:
GD-Ti/D2, U=805 V, I=250 mA, t=7.0 hr:
Track
densi
ty, [c
m-2
]
250
200
150
100
50
05 6 7 8 9 10
Track diameter, [µm]
Figure 15. Yields of 3.0 MeV proton, 2.8 MeV deuteron and 13 MeV alpha peaks versus glow
discharge voltage illustrated by two measurements at constant current I=250 mA and voltages U1= 805 V and U2 = 2175 V, respectively.
tive discharge power are almost independent of the deuteron energy Ed, while theDD-reaction yield of 3.0MeV protons tends to grow exponentially with increasingEd.
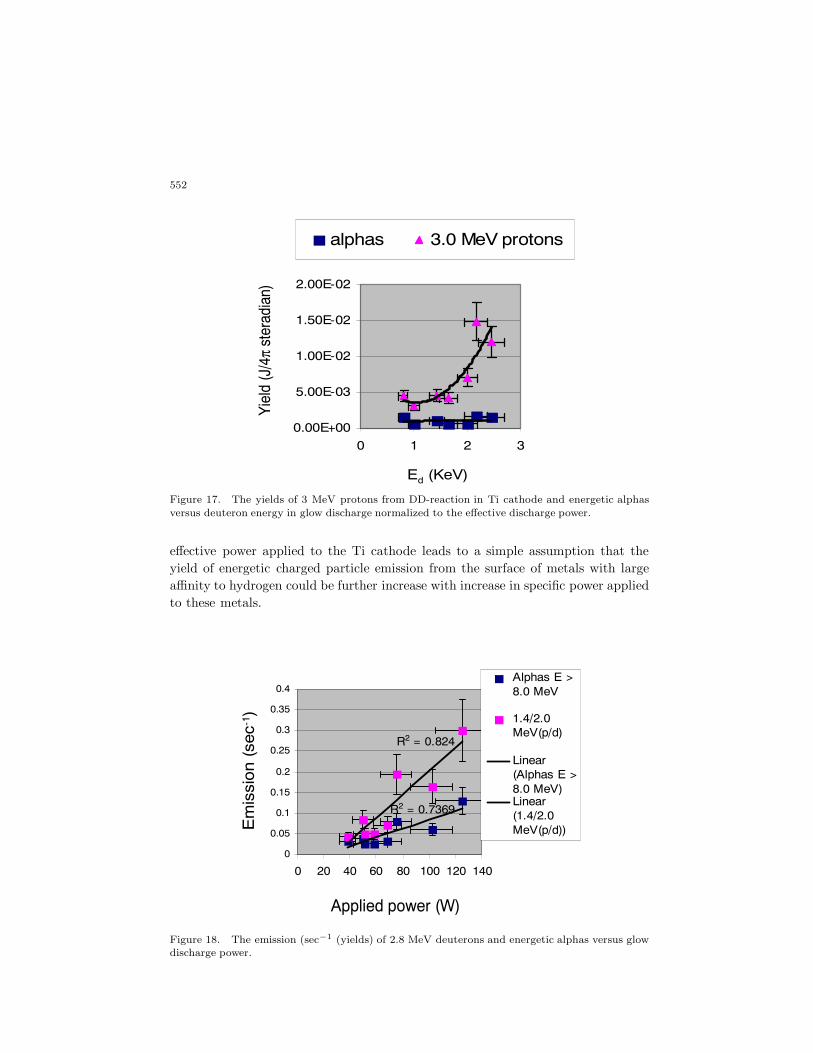
The yields of energetic deuterons and alpha particles in the glow discharge areroughly proportional to the glow discharge power applied to the Ti cathode (Fig. 18).The fact of near linear dependence of energetic charged particle emission yields on
Yi e l ds of 3 . 0 M e V pr ot ons a nd 1. 4 / 2 . 0 M e V
pr ot ons/ de ut e r ons nor ma l i z e d t o e f f e c t i v e powe r J
v s de ut e r on e ne r gy E d
0.00E+00
2.00E-03
4.00E-03
6.00E-03
8.00E-03
1.00E-02
1.20E-02
1.40E-02
1.60E-02
1.80E-02
2.00E-02
0 0.5 1 1.5 2 2.5 3
1.4/2.8 MeV p/d 3.0 MeV protons
Ed (KeV)
Yiel
d (J
/4π
ster
adia
n)
Figure 16. The yields of 3 MeV protons (from DD-reactions in the titanium cathode) and 2.8
MeV deuterons as a function of the incident deuteron energy in the glow discharge, normalized tothe effective discharge power.
552
Ed (KeV)
Yie
ld (J
/4π
ster
adia
n)
ydischarge power J vs. deuteron
energy Ed
0.00E+00
5.00E-03
1.00E-02
1.50E-02
2.00E-02
0 1 2 3
alphas 3.0 MeV protons
Figure 17. The yields of 3 MeV protons from DD-reaction in Ti cathode and energetic alphas
versus deuteron energy in glow discharge normalized to the effective discharge power.
effective power applied to the Ti cathode leads to a simple assumption that theyield of energetic charged particle emission from the surface of metals with largeaffinity to hydrogen could be further increase with increase in specific power appliedto these metals.
Em
issi
on (
sec-
1)
R2 = 0.7369
R2 = 0.824
0
0.05
0.1
0.15
0.2
0.25
0.3
0.35
0.4
0 20 40 60 80 100 120 140
Alphas E >8.0 MeV
1.4/2.0MeV(p/d)
Linear(Alphas E >8.0 MeV)Linear(1.4/2.0MeV(p/d))
Applied power (W)
Figure 18. The emission (sec−1 (yields) of 2.8 MeV deuterons and energetic alphas versus glowdischarge power.
553
0
2
4
6
8
10
12
7 8 9 10 11Track diameter (µm)
Ti-target: R=20 cm, 0-30 deg., CR-39/11 µm AI
PE-target, R=20 cm, 0-30 deg., CR-39/11 µm AI
Ti-target Background, R=50 cm, 90 deg, CR-39
Trac
k de
nsity
[cm
-2]
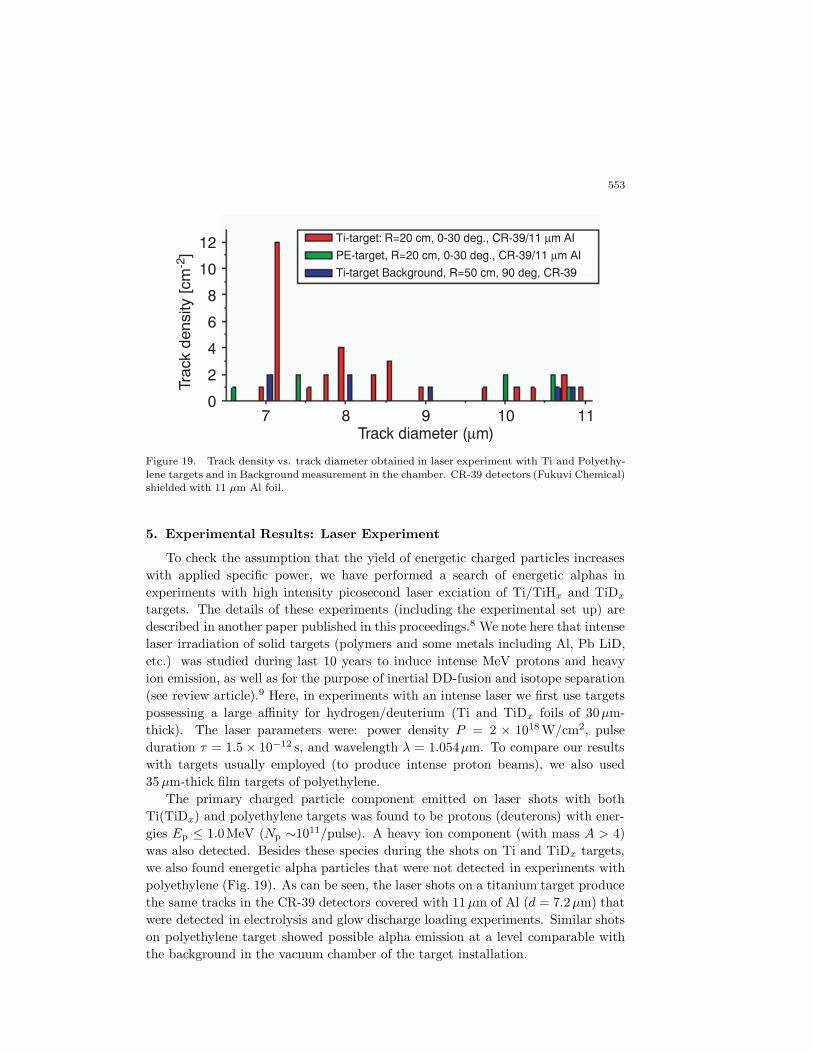
Figure 19. Track density vs. track diameter obtained in laser experiment with Ti and Polyethy-
lene targets and in Background measurement in the chamber. CR-39 detectors (Fukuvi Chemical)shielded with 11 µm Al foil.
5. Experimental Results: Laser Experiment
To check the assumption that the yield of energetic charged particles increaseswith applied specific power, we have performed a search of energetic alphas inexperiments with high intensity picosecond laser exciation of Ti/TiHx and TiDx
targets. The details of these experiments (including the experimental set up) aredescribed in another paper published in this proceedings.8 We note here that intenselaser irradiation of solid targets (polymers and some metals including Al, Pb LiD,etc.) was studied during last 10 years to induce intense MeV protons and heavyion emission, as well as for the purpose of inertial DD-fusion and isotope separation(see review article).9 Here, in experiments with an intense laser we first use targetspossessing a large affinity for hydrogen/deuterium (Ti and TiDx foils of 30µm-thick). The laser parameters were: power density P = 2 × 10¹⁸ W/cm2, pulseduration τ = 1.5 × 10⁻¹² s, and wavelength λ = 1.054µm. To compare our resultswith targets usually employed (to produce intense proton beams), we also used35 µm-thick film targets of polyethylene.
The primary charged particle component emitted on laser shots with bothTi(TiDx) and polyethylene targets was found to be protons (deuterons) with ener-gies Ep ≤ 1.0MeV (Np ∼1011/pulse). A heavy ion component (with mass A > 4)was also detected. Besides these species during the shots on Ti and TiDx targets,we also found energetic alpha particles that were not detected in experiments withpolyethylene (Fig. 19). As can be seen, the laser shots on a titanium target producethe same tracks in the CR-39 detectors covered with 11 µm of Al (d = 7.2µm) thatwere detected in electrolysis and glow discharge loading experiments. Similar shotson polyethylene target showed possible alpha emission at a level comparable withthe background in the vacuum chamber of the target installation.
554
TIDx, R-20cm, 0-30 deg., CR-39/33 µm AI d(peak)- 7.4 µm E - 11.5-15.5 MeVTIDx, R-20cm, 0-30 deg., CR-39/66 µm AI d(peak)- 9.6 µm E - 11.5-14.0 MeV
TIDx, R-20cm, 0-30 deg., CR-39/11 µm AI d(peak)- 7.2 mm E - 11.0-15.0 MeV
TIDx, R-20cm, 0-30 deg., CR-39/50 µm CI
14
12
10
8
6
4
2
0
Trac
k de
nsity
in o
ne s
hot,
[cm
-2]
6.5 7.0 7.5 8.0 8.5 9.0 9.5 10.0
Track Diameter, [µm]
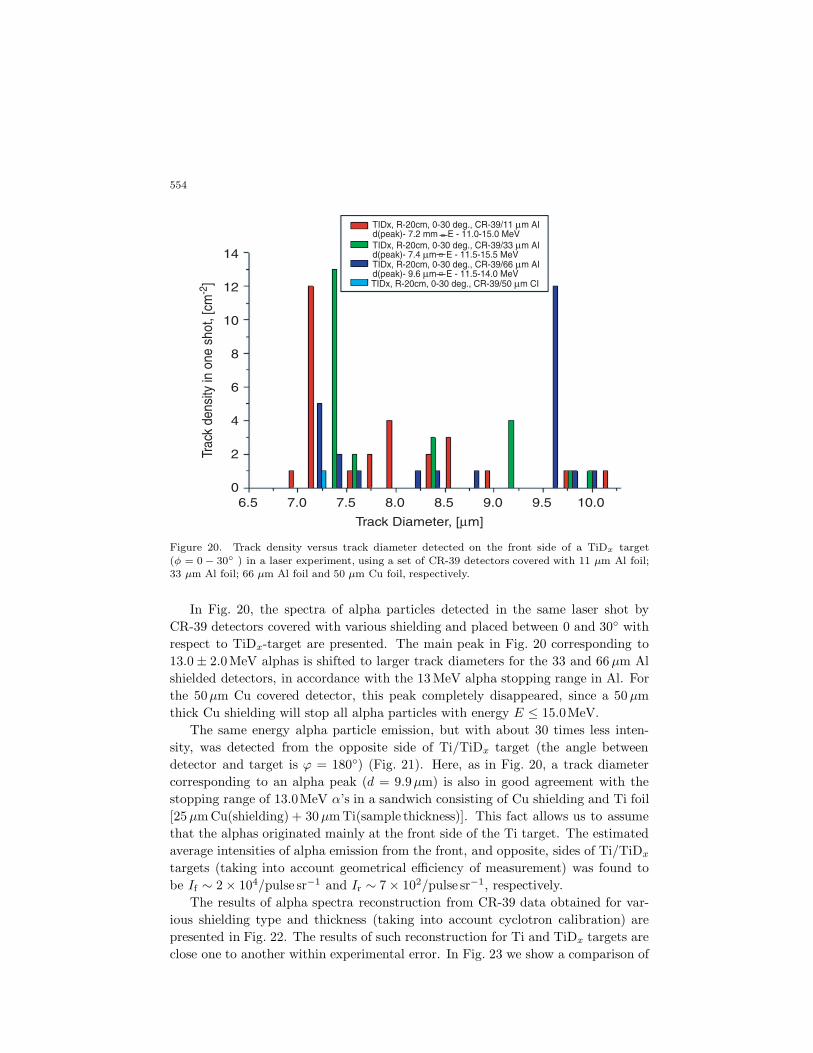
Figure 20. Track density versus track diameter detected on the front side of a TiDx target
(φ = 0 − 30◦ ) in a laser experiment, using a set of CR-39 detectors covered with 11 µm Al foil;33 µm Al foil; 66 µm Al foil and 50 µm Cu foil, respectively.
In Fig. 20, the spectra of alpha particles detected in the same laser shot byCR-39 detectors covered with various shielding and placed between 0 and 30◦ withrespect to TiDx-target are presented. The main peak in Fig. 20 corresponding to13.0 ± 2.0MeV alphas is shifted to larger track diameters for the 33 and 66 µm Alshielded detectors, in accordance with the 13 MeV alpha stopping range in Al. Forthe 50µm Cu covered detector, this peak completely disappeared, since a 50 µmthick Cu shielding will stop all alpha particles with energy E ≤ 15.0MeV.
The same energy alpha particle emission, but with about 30 times less inten-sity, was detected from the opposite side of Ti/TiDx target (the angle betweendetector and target is ϕ = 180◦) (Fig. 21). Here, as in Fig. 20, a track diametercorresponding to an alpha peak (d = 9.9µm) is also in good agreement with thestopping range of 13.0MeV α’s in a sandwich consisting of Cu shielding and Ti foil[25 µm Cu(shielding) + 30 µm Ti(sample thickness)]. This fact allows us to assumethat the alphas originated mainly at the front side of the Ti target. The estimatedaverage intensities of alpha emission from the front, and opposite, sides of Ti/TiDx
targets (taking into account geometrical efficiency of measurement) was found tobe If ∼ 2 × 10⁴/pulse sr−1 and Ir ∼ 7 × 10²/pulse sr−1, respectively.
The results of alpha spectra reconstruction from CR-39 data obtained for var-ious shielding type and thickness (taking into account cyclotron calibration) arepresented in Fig. 22. The results of such reconstruction for Ti and TiDx targets areclose one to another within experimental error. In Fig. 23 we show a comparison of

555
Ti: R=4.0 cm. 180 deg. CR-39/25 µm CuEα~ 12.0 -16.0 MeV
Ti: R=20 cm. 0-30 deg. CR-39/25 µm CuEα~ 11.5 -14.5 MeV
0
2
4
6
8
10
12
14
16
Trac
k de
nsity
in o
ne s
hot,
[cm
-2]
7 8 9 10 11Track Diameter, [µm]
Figure 21. Track density versus track diameter detected from the front, and opposite, sides of a
Ti target simultaneously in a laser experiment. The CR-39 track detectors were shielded with 25µm Cu foil.
alpha spectra obtained from a laser experiment with a titanium target, and fromelectrolysis with a Pd-glass sample. As seen in Fig. 23, the spectra of the laserexperiment and the electrolysis experiment look quite similar within the measure-ment error (determined by standard deviations of alpha calibrations and errors oftrack diameter measurements), and both exhibit a spread in the energy range of10–17MeV.
0
5
10
15
20
3 6 9 12 15 18 21
TiDxtargetTitarget
Eα (MeV)
Cou
nts
Figure 22. Reconstructed alpha spectra based on the data obtained with CR-39 track detectorsshielded by Al and Cu foils in laser experiments with Ti and TiDx targets.
556
Eα (MeV)
Num
ber
of
eve
nts
, arb
. units
0
5
10
15
20
25
5 10 15 20
Laser Ti-target
ElectrolysisPd/glass
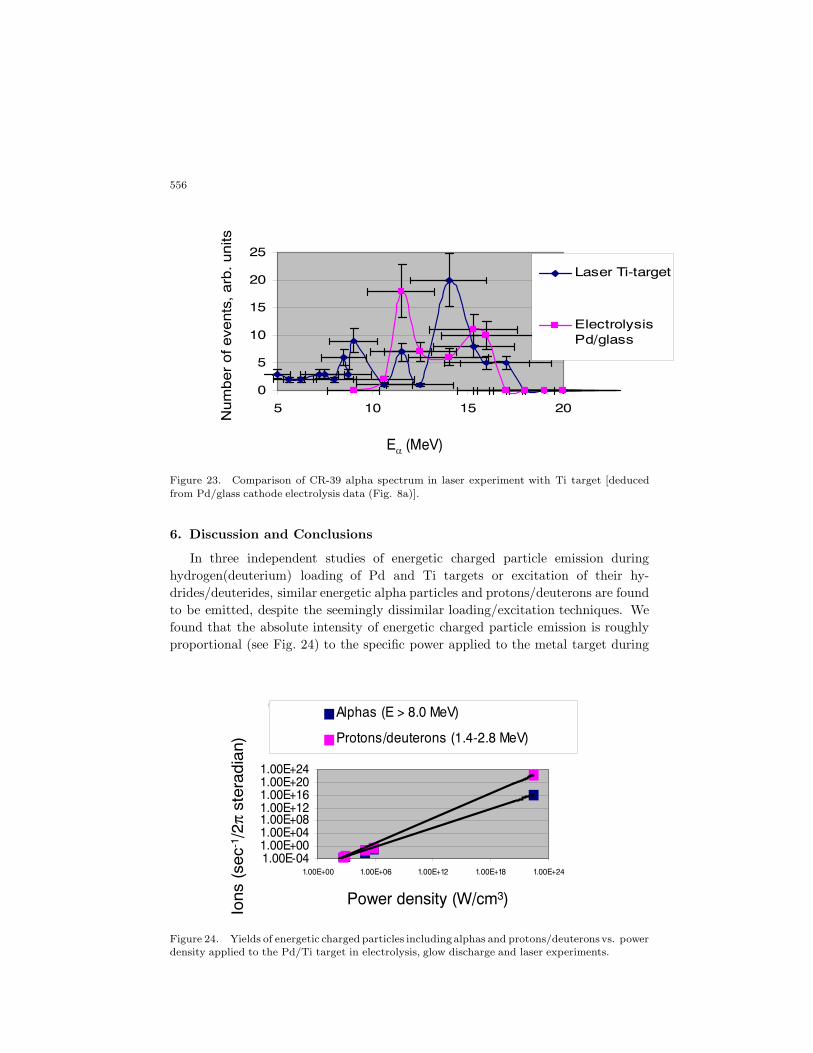
Figure 23. Comparison of CR-39 alpha spectrum in laser experiment with Ti target [deduced
from Pd/glass cathode electrolysis data (Fig. 8a)].
6. Discussion and Conclusions
In three independent studies of energetic charged particle emission duringhydrogen(deuterium) loading of Pd and Ti targets or excitation of their hy-drides/deuterides, similar energetic alpha particles and protons/deuterons are foundto be emitted, despite the seemingly dissimilar loading/excitation techniques. Wefound that the absolute intensity of energetic charged particle emission is roughlyproportional (see Fig. 24) to the specific power applied to the metal target during
Ions
(se
c-1/2π
ster
adia
n)
Power density applied in Electrolysis, Glow discharge and Laser experiments
1.00E-041.00E+001.00E+041.00E+081.00E+121.00E+161.00E+201.00E+24
1.00E+00 1.00E+06 1.00E+12 1.00E+18 1.00E+24
Alphas (E > 8.0 MeV)
Protons/deuterons (1.4-2.8 MeV)
Power density (W/cm3)
Figure 24. Yields of energetic charged particles including alphas and protons/deuteronsvs. powerdensity applied to the Pd/Ti target in electrolysis, glow discharge and laser experiments.
557
Speci
fic e
nerg
y[e
V/a
tom
Pd(T
i)]
05
1015202530
1.00E+00 1.00E+06 1.00E+12 1.00E+18 1.00E+21.00E+24
Power density (W/cm3)
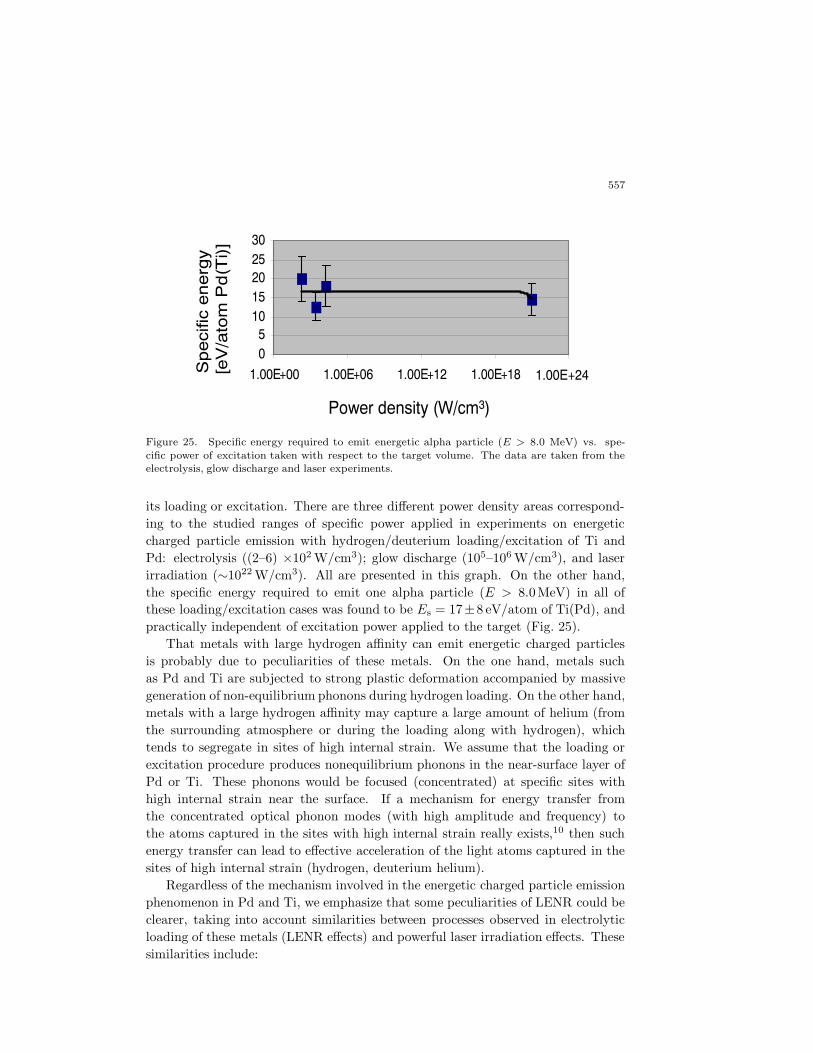
Figure 25. Specific energy required to emit energetic alpha particle (E > 8.0 MeV) vs. spe-
cific power of excitation taken with respect to the target volume. The data are taken from theelectrolysis, glow discharge and laser experiments.
its loading or excitation. There are three different power density areas correspond-ing to the studied ranges of specific power applied in experiments on energeticcharged particle emission with hydrogen/deuterium loading/excitation of Ti andPd: electrolysis ((2–6) ×102 W/cm3); glow discharge (105–106 W/cm3), and laserirradiation (∼1022 W/cm3). All are presented in this graph. On the other hand,the specific energy required to emit one alpha particle (E > 8.0MeV) in all ofthese loading/excitation cases was found to be Es = 17±8 eV/atom of Ti(Pd), andpractically independent of excitation power applied to the target (Fig. 25).
That metals with large hydrogen affinity can emit energetic charged particlesis probably due to peculiarities of these metals. On the one hand, metals suchas Pd and Ti are subjected to strong plastic deformation accompanied by massivegeneration of non-equilibrium phonons during hydrogen loading. On the other hand,metals with a large hydrogen affinity may capture a large amount of helium (fromthe surrounding atmosphere or during the loading along with hydrogen), whichtends to segregate in sites of high internal strain. We assume that the loading orexcitation procedure produces nonequilibrium phonons in the near-surface layer ofPd or Ti. These phonons would be focused (concentrated) at specific sites withhigh internal strain near the surface. If a mechanism for energy transfer fromthe concentrated optical phonon modes (with high amplitude and frequency) tothe atoms captured in the sites with high internal strain really exists,10 then suchenergy transfer can lead to effective acceleration of the light atoms captured in thesites of high internal strain (hydrogen, deuterium helium).
Regardless of the mechanism involved in the energetic charged particle emissionphenomenon in Pd and Ti, we emphasize that some peculiarities of LENR could beclearer, taking into account similarities between processes observed in electrolyticloading of these metals (LENR effects) and powerful laser irradiation effects. Thesesimilarities include:
558
• Neutron spectra for deuterated targets in laser and LENR experiments:besides the 2.45MeV peak, high energy neutrons up to 10 MeV [compareRefs.: P.A. Norreys et al., Plasma Phys. Control. Fusion 40, 175 (1998)and 5]. The high energy component of the neutron spectra in the laser caseis explained by the presence of MeV deuterons (there probably is a similareffect in LENR case).
• Charged particle emission, including energy ranges.
• Isotope separation and exotic transmutations.
• Production of craters at the target surface.
• Possible generation of isomeric states of nuclei in solids (subsequent emis-sion of gammas and x-rays).
References
1. F. E. Cecil, D. Ferg, H. Liu et al., Nucl. Phys. A 539, 75 (1992).2. R. Taniguchi, Trans. Fusion Tech. 26(4T), 186 (1994).3. J. Kasagi, T. Ohtsuki, K. Ishu and M. Hiraga, J. Phys. Soc. Jpn. 64, 777 (1995).4. A. Takahashi, K. Maruta, K. Ochiai and H. Miyamaru, Fusion Tech. 34, 256 (1998).5. A.G. Lipson, B.F. Lyakhov, A.S. Roussetski et al., Fusion Tech. 38, 238 (2000).6. A.G. Lipson, A.S. Roussetski, A. Takahashi and J. Kasagi, Bull. Lebedev Phys. Inst.
10, 22 (2001).7. A.G. Lipson, A.S. Roussetski and G.H. Miley, Trans. Am. Nucl. Soc. 88, 638 (2003).8. A.S. Roussetski et al., in this Proceedings.9. K.W. Ledingham, P. McKenna and R.P. Singhal, Science 300, 1107 (2003).
10. P.L. Hagelstein, in Proceedings of the ICCF-9 on Anomalies in Metal Deuterides,Beijing, May 2002.