Embed Size (px)
Citation preview
PhD summary F A C U L T Y O F S C I E N C E
U N I V E R S I T Y O F C O P E N H A G E N
PhD thesis
Mette Cristine Schou Frandsen
Ecohydrological investigations of a groundwater- lake system
- A cross disciplinary study in the interactions between biology, lake ecology and hydrology.
Academic advisor: Ole Pedersen
Peter Engesgaard
Bertel Nillson
Submitted: 31/10/14

PhD summary
PhD summary
Data Sheet
This PhD thesis has been submitted to the PhD school of the faculty of Science at University of
Copenhagen.
Name of department: Department of Biology
Author: Mette Cristine Schou Frandsen
Title / Subtitle: Ecohydrological investigations of a groundwater- lake system
- A cross disciplinary study in the interactions between biology, lake ecology
and hydrology.
Academic advisors: Ole Pedersen
Department of Biology
University of Copenhagen
Peter Engesgaard
Department of Geosciences and Natural resource Management
University of Copenhagen
Bertel Nilsson
Department of Hydrology
Geological Survey of Denmark and Greenland
Submission: Oct 31 2014

PhD summary
PhD summary
Preface
This thesis concludes a three years PhD program in collaboration between the Department of Biology (DB),
University of Copenhagen; the department of Geosciences and Natural Resource management (DGN),
University of Copenhagen; and Denmark and Greenland Geological Survey (GEUS).
The PhD project was founded by The Danish Council for Independent Research – Nature and Universe.
The study was supervised by Associate Professor Ole Pedersen (DB), Professor Peter Engesgaard (DGN)
and senior scientist Bertel Nilsson (GEUS). An external research stay of three month was spent at the
School of Earth and Environment, University of Western Australia, Crawly, WA, Australia under the
supervision of Professor Matthew R. Hipsey.
In accordance with the guidelines given by the faculty of Science, University of Copenhagen, this thesis
consists of a summary and the following 4 papers:
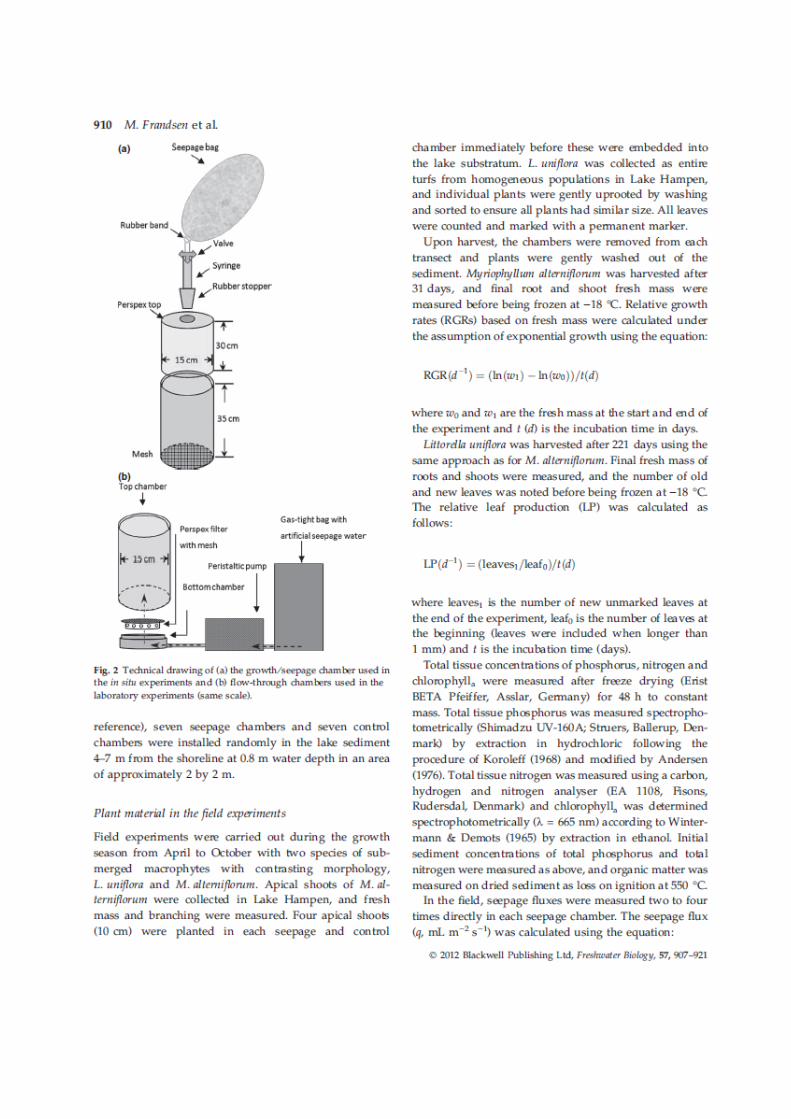
Paper I: Frandsen, M,. Nilsson, B., Engesgaard, P., Pedersen, O. 2012. Groundwater Seepage
stimulates the growth of aquatic macrophytes. Freshwater Biology. 57:907-921.
Paper II: Frandsen, M,. Engesgaard, P., Nilsson, B., Pedersen, O. Rooted underwater vegetation
locally reduces groundwater discharge in lakes.
Paper III
Frandsen, M,. Engesgaard, P., Nilsson, B., Pedersen, O. Tacking groundwater flow during a flow
reversal – nature’s own tracer experiment.
Paper IIII:
Frandsen, M,. Engesgaard, P., Nilsson, B., Pedersen, O. Using whole-system understanding to
evaluate long term development in alkalinity in a northern flow through lake.

PhD summary
PhD summary
Acknowledgements
First and foremost, a special thanks to my supervisors Peter, Bertel and Ole. To Peter Engessgaard, for always being there to help, no matter what the subject might be, for always giving me constructive feedback, for always offering his knowledge, for all the many, and often cold hours in the field, and all the good evenings at the field station playing ping pong. A special thanks to Bertel Nilsson for his kindness and his constructive feedback and for his valuable help on setting up the monitoring equipment during some very cold December days. A special thanks to Ole Pedersen, for his always constructive and detailed feedback, for taking care of many of the practicalities, and for making sure that I stayed on the right course. A big thanks to Heidi Barlebo. for her kind support, and for always seeing the positive side. A big thanks to Matthew R. Hipsey for his kind support during my stationing at University of Western Australia in Perth. I would also like to give a big thank to Carlos Duque Calvache and Mikkel Rene Andersen for their valuable help in the field. A big thank to Mitra Christin Hajati and Kristian Färkkilä Knudsen for contributing with data. I would also like to thank colleges and students at the Geological Survey of Denmark and Greenland, the Freshwater biological laboratory, department of Geosciences and Natural resource Management at the University of Copenhagen, and The University of Southern Denmark for their contributions. Per Jørgensen and Jens Bisgaard are thanked for their technical assistance. A warm and deep thank to my twin sister Marie Michelle Schou Frandsen, for always being there for me, no matter the cost. For helping me through the rough times with kindness and love, and for always believing in me. The biggest thanks go to Thomas Duus Henriksen, for being there for me, for believing in me, for keeping my spirit up, for supplying sweets and food in the late hours, for going all the way to Australia with me and for making the study possible. This project was founded by The Danish Council for Independent Research – Nature and Universe, who I would like to thank for granting me the opportunity to conduct this PhD study.

PhD summary
PhD summary
Preface
Acknowledgements
1 Introduction and objectives ....................................................................................................................... 5
1.1 Background .............................................................................................................................................. 5
1.2 Motivation and objectives ....................................................................................................................... 7
2 PhD Research ............................................................................................................................................ 8
2.1 Paper I ...................................................................................................................................................... 9
2.1.1 Introduction and objectives ................................................................................................................. 9
2.1.2 Main findings ........................................................................................................................................ 9
2.2 Paper 2 ................................................................................................................................................... 10
2.2.1 Introduction and objectives ............................................................................................................... 10
2.2.2 Main findings ...................................................................................................................................... 11
2.3. Paper 3 .................................................................................................................................................. 11
2.3.1 Introduction and objectives ............................................................................................................... 11
2.3.2 Main findings ...................................................................................................................................... 12
2.4. Paper 4 .................................................................................................................................................. 12
2.4.1 Introduction and objectives ............................................................................................................... 12
2.4.2 Main findings ...................................................................................................................................... 13
3 Conclusions and perspectives .................................................................................................................. 13
4 References .............................................................................................................................................. 15
Appendixes .................................................................................................................................................. 1
Paper 1 Groundwater Seepage stimulates the growth of aquatic macrophytes
Paper 2 Rooted underwater vegetation locally reduces groundwater discharge in lakes
Paper 3 Tacking groundwater flow during a flow reversal – nature’s own tracer experiment
Paper 4 Using whole-system understanding to evaluate long term development in
alkalinity in a northern flow through lake

PhD summary
PhD summary
1
Abstract
This PhD project is a cross-disciplinary study combining hydrological and biological methodology to better
describes the lake-catchment interaction seen in an ecological perspective.
The topics investigated were:
Does groundwater re- and discharge affect the growth of submerged vegetation? (Paper I).
Does dense bottom vegetation affect the small scale hydrology of the lake bed sediment? (Paper 2).
How can natural tracers (δ 18
O) be used to quantify the temporal variation in groundwater seepage dynamics? (Paper 3).
Is it possible to combine ecological data of surface water chemistry and data on groundwater chemistry to stoichiometrically describe changes in the lake in a historical time frame? (Paper 4).
The main conclusions from the study are:
When evaluating the ecology of a groundwater-lake system, both hydrological and biological parameters are needed to accurately describe the factors affecting the system.
The biology and ecology of the lake (i.e. submerged vegetation and surface water chemistry) are highly affected by groundwater seepage.
The hydrology at the surface-water-interface is highly affected by the biology (i.e. submerged vegetation).
Groundwater-lake systems are very dynamic systems on a spatial scale. Variability in meteorology can lead to variability in the hydrology, and in some cases ignite transient effects that are temporally distinct and difficult to capture.
To some extend the lakes acts as sentinel for all the in and out-puts to the system as well as the in-lake processes. By combining this ecological view with hydrology, it is possible to gain information on the historical development in the surface water chemistry.
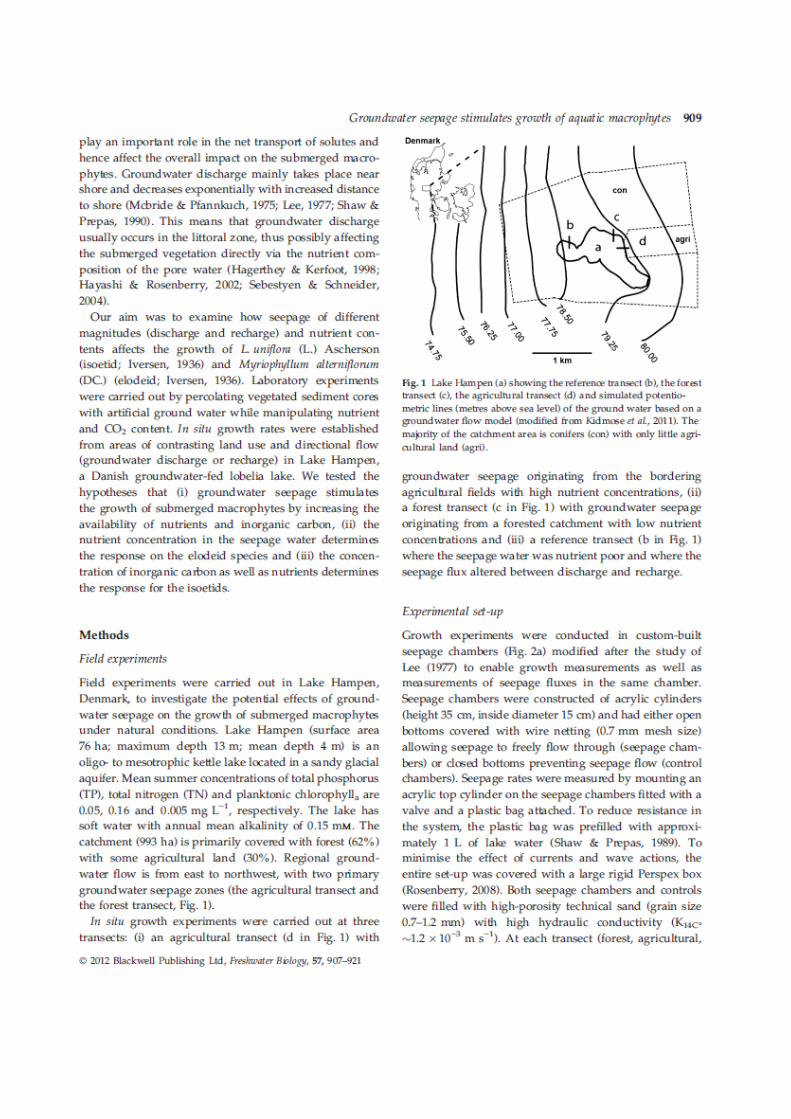
Lake Hampen is a Danish flow through lake receiving almost 2/3 of its water through groundwater discharge.
In this setting I investigated the interrelationship between hydrology and biology.
I found that groundwater seepage significantly affected the growth rates of submerged isoetids
(small rosette type plants) by providing them with a continuous supply of nutrients and inorganic carbon. The
seepage rates were strongly correlated to the growth responses and the plant mass was higher in treatments
where the plants were subjected to groundwater seepage compared to treatments with no groundwater
seepage.
I also found that the submerged vegetation conversely had a significant effect on the small scale hydrology
of the lake bed sediment. On densely vegetated areas (~9000 plants m-2
), the vertical hydraulic conductivity
was lower compared to non-vegetated sediment. Disturbing the top layer of the sediment lead to a significant
increase in hydraulic conductivity on the vegetated sediment, whereas the non-vegetated sediment was not
affected by this. The reasons for the lowered hydraulic conductivity seems to be an combination of the
organic content in the sediment (i.e. the roots of the plants) and a vegetation induced entrapment of fine
particles in the sediment.
Over the course of three years I followed the small scale variation in the natural tracer, δ18
O, and
nitrate in the main discharging area of the lake to follow an ongoing flow reversal in the system. By tracking
PhD summary
2
the groundwater – lake water signal using only the distribution of δ18
O it was clear that lake water had
penetrated the lake bed sediment down to at least 1.25 m during the flow reversal. This was also clear
looking at the nitrate data and during the flow reversal the nitrate concentrations in the sediment was
significantly lower than under normal flow conditions. All the nitrate was denitrified before reaching the lake
and the estimated denitrification rates were lower than the assumed capacity.
In Lake Hampen, the alkalinity suddenly started to increase during the mid-1970s. Using a simple
four step modeling approach, I found that denitrification of nitrate discharging to the lake, stoichiometrically
could explain the development in the alkalinity in the surface water. This method gave a surprisingly accurate
picture of the yearly development in surface water alkalinity despite the somewhat simplified approach used
to estimate the historical input of nitrate with the groundwater.
In conclusion I strongly encompass the notion that a cross-disciplinary approach greatly qualifies the
results of ecological studies.
PhD summary
3
Dansk résumé
Dette PhD projekt er et tværfagligt studie hvori metodik fra hydrologi og biologi er blevet brugt til at lave
tværfaglige økologiske undersøgelser. I projektet undersøges følgende emner:
Påvirker grundvandsindsivning i søer vandplanterne? (artikel 1).
Påvirker vandplanterne de hydrologiske forhold i søbunden? (artikel 2)
Kan man bruge naturlige tracers til at kvantificere den tidslige variation grundvandsdynamikken?
(artikel 3)
Kan man ved at kombinere økologiske data og hydrologiske data beskrive den historiske udvikling i
en sø?
Hovedkonklusionerne fra projektet er:
Når man skal evaluere økologien af et grundvand-søsystem, er der brug for både hydrologiske og
biologiske data hvis man vil vurdere de faktorer der påvirker systemet.
Vandplanterne er signifikant påvirket af grundvandsindsivningen.
Vandplanterne har en stor effekt på de hydrologiske forhold I søbunden, og påvirker derfor
grundvandsstrømningen til systemet.
Grundvand-søsystemer er meget dynamiske systemer bade spatialt og temporalt. Variabilitet i
meteorologi og hydrologi, kan i nogle tilfælde skabe midlertidige ændringer i grundvandet
strømningsmønster.
Overflade vandet i en sø indeholder informationer om alle til- og fraførsler af stoffer samt de interne
processer. Ved at kombinere hydrologiske og biologiske data kan man bruge overfladevandets
”hukommelse ” til at forklare den historiske udvikling i søkemien.
Hampen sø er en dansk grundvandspåvirket sø, som modtager næsten 2/3 af sit vand fra grundvandet. På
denne lokalitet undersøgte jeg koblingen mellem hydrologi og biologi.
Gennem studiet fandt jeg at grundvandsindsivning havde en signifikant indflydelse på vækstrater for
undervandsvegetation ved at forsyne denne med en vedvarende forsyning af næringsstoffer.
Vækstraterne var stærkt korrelerede til grundvandsraterne og planterne der blev udsat for grundvand
i forsøgene opnåede en større slutmasse end planter fra forsøg hvor grundvandtilførslen blev afskåret.
Undervandsvegetationen havde stor effekt på de hydrologiske forhold i søbunden. På tæt
bevoksede søsedimenter kan der vokse op til 9000 planter per kvadratmeter. Denne Undervandsvegetation
havde stor effekt på de hydrologiske forhold i søbunden. Ved at lave sammenlignende studier af henholdsvis
bevokset og ubevokset sediment, kunne man se at vegetationen skabte et lag af lav hydraulisk
ledningsevne. Årsagen til den sænkede hydrauliske ledningsevne syntes at stamme fra en kombination af
det organiske indhold i sedimentet (eksempelvis planterødderne), og en vegetationsskabt indfangning af
småpartikler i sedimentet.
PhD summary
4
I løbet af en treårig periode fulgte jeg δ18
O fordelingen i sedimentet i et forsøg på at undersøge en
retningsændring af grundvandet (et flowreversal). I et område hvor der normalt indstrømmer store mængder
nitrat med grundvandet, løb grundvandet i stedet ud af søen. Ved at undersøge fordelingen af δ18
O blev det
klart søvandet i løbet af dette flow-reversal havde trængt mindst 1,25 meter ned gennem
søbundssedimentet. Dette fremgik tilsvarende tydeligt af nitratkoncentrationerne i sedimentet. Under dette
flow-reversal var nitratkoncentrationerne i sedimentet væsentligt lavere end de var under normale
omstændigheder.
I Hampen Sø begyndte alkaliniteten at stige op gennem midten af 1970erne. Ved at anvende en
simpel, 4-trins modelleringstilgang fandt jeg at denitrifikationen af nitrat der tilstrømmer søen med
grundvandet støkiometrisk kunne forklare alkalinitetsudviklingen i overfladevandet. På trods af sin simple
tilgang gav denne metode et overraskende præcist billede af den historiske alkalinitetsudvikling i
overfladevandet og alakalinitetstigningerne i sen kan kobles til udledningen af nitrat fra et landbrug der tæt
ved søen.
I sin konklusion tilslutter projektet sig på det kraftigste ideen om at en tværdisciplinær tilgang ikke
kun kvalificerer økologiske studier, men også er en nødvendighed for at kunne tegne et realistiske billede af
de processer der styrer og påvirker søøkologien i grundvandspåvirkede søer.
PhD summary
5
1 Introduction and objectives
1.1 Background
Freshwater lakes are extremely important to us as they provide us with water for domestic, agricultural and
industrial use and in some regions act as drinking water reservoirs for both humans and animals (Brønmark
& Hansson 2002). They also play a key role in maintenance of the ecosystems and the species diversity of
plants and animals (Brønmark & Hansson 2002; Zalewski, 2000). The qualitie of the lakes are threatened by
numerous factors, the more important ones on the northern hemisphere being pollution and eutrophication
(Brønmark & Hansson 2002: Brinson & Malvarez 2002). Eutrophication caused by nitrate leaching from
agriculture and phosphorus leaching from populated areas represent one of the major anthropogenic threats
to freshwater lakes in Europe (EEA, 2005). In countries as Denmark and the Netherlands, nitrate leaching
from agriculture poses a major problem as more than 60% of the areal surface in these countries are
cultivated for agriculture (Schaap et al., 2011; Hansen et al., 2012). Hence, one of the main goals in water
management is to handle and find solutions for environmental problems in order to obtain and maintain
favorable ecological status in wetlands (i.e. lakes, streams).
The problems with Lake eutrophication became evident during the 1950s and 1960s where many
lakes in agricultural and urban areas experienced algal blooms, fish death kills and deterioration of
submerged vegetation (Brønmark & Hansson, 2002). In the 1960s, only few regulations regarding storage
and disposal of industrial wastes, fuels, chemicals and fertilization of cropped fields existed. Unregulated
amounts of harmful substances were released to the groundwater all over the industrialized part of the world
(Brønmark & Hansson, 2002). In 1974, Schindler conducted one of the first whole lake experiments directly
linking nutrient concentrations in the lakes to the observed problems (Schindler, 1974). Subsequently
numerous regulations have been posed trying to stop the pollution and eutrophication of our freshwater
systems, i.e. the Danish NPO-regulation and the European habitat directory (HD), the Natura-2000 plans and
finally the Water Framework Directory (WFD), which states that good ecological status must be achieved by
2015 in all water bodies (European Union 2000). These regulations have had a positive effect on especially
the nitrate leaching from agriculture which has been reduced by 50% between 1990 and 2003 (Blicher-
Mathiasen et al. 2013; Wiberg-Larsen 2013). However, despite these attempts to address the problem, many
of the freshwater environments are still deteriorating (Danish Nature Agency, 2014; Kundzewicz, 1999).
First of all, there are problems restoring already damaged wetlands. In the mid-1980s and the 1990s,
it was established that simply reducing the load of nutrients to a lake, was insufficient to restore it to good
conditions as biotic feedback mechanism captures the lake in poor condition (Timms & Moss 1984; Brock
and Starrett, 2003). In short, a lake can exist in two states under the same nutrient concentration. One is
dominated by phytoplankton resulting in turbid water, and one dominated by submerged plants, with clear
water (Timms & Moss 1984; Scheffer 1990). Even though changes in nutrient load can shift a lake from the
clear water state to the turbid state, the reversed process are more difficult due to the biotic buffer systems.
Restoring a lake in bad condition is very costly and the restoration methods are invasive and difficult to test.
PhD summary
6
However, this is a problem being addressed in the movement in Demark by a Centre of Excellency funded
by the Villum Foundation. In this program scientists from multiple disciplinary areas tests and evaluates the
different restoration methods (CLEAR, 2006).
Another great challenge in maintaining good conditions in our surface waters, is of more academic
character. Lake management and lake ecology are traditionally biological disciplines, while groundwater flow
and transport in the catchment sediment are traditionally geological and hydrological disciplines. Hence,
coupling hydrology and ecology crosses well established disciplinary borders, often resulting in studies
lacking either the hydrological inputs or the ecological response (Zalewski, 2002).
On a catchment scale the groundwater surface water systems are complexes of interrelated hydrological,
geological, biological, and chemical processes, and in order to understand the impact on a wetland from the
surrounding catchment the hydrological framework is needed and vice versa. While hydrologist seems to be
embracing the new discipline of ecohydrology, it has been suggested that biologist are less aware of this
new emerging discipline (Bond, 2003). Hannah et al. (2004) state in their bibliographical analysis of the
emergence of ecohydrology, that of the articles published from 1981-2004 using the word ecohydrology
(hydroecology, hydro ecology or eco hydrology) 71% appeared in physical journals whereas only 23%
appeared in biological journals. This does, however, only accounts for papers using those specific words.
Thus, their study likely underestimated the overall extend of the ecohydrological research, as they also state
themselves. Furthermore, even though it seems that hydrologists are more actively involved in the new field
of ecohydrology, a literature review showed that despite the use of the word ecohydrology in the hydrological
publications and the apparent focus on ecological implications in the systems they describe, they often lack
the biological data to support it (Hannh et al.2004).
For both hydrologist and biologist/ecologist, the search for solutions to practical problems has played
a central role in the development of these fields, and the advancements have been driven by innovation in
research techniques making it possible to address these problems (Kundzewicz, 2000; Groffman & Pace,
1998; Nuttle 2002). While this has led to a good mechanical understanding on how both the hydrological and
the ecological systems work, we still need to combine this knowledge into a more holistic understanding of
the ecosystems (Zalewski 2002). Zalewski states that the field of ecohydrology is the third fase in the
development of ecology. The development starts with a pure descriptive natural history (ie. Linné), followed
by an understanding of the processes within the system, which finally leads to an understanding that makes
it possible to control and manipulate the system to ensure and secure resource quality and availability
(Zalewski, 2002). The overall goal from my point of view is to develop a scientific framework enabling us to
develop the full set of skills necessary to implement sustainable management of natural resources. Here,
aquatic eco-sciences are important. In 1998, the World Science Report (UNESCO, 1998) stated that
protection of our water resources, in the face of increasing deterioration of the global environment, is one of
the priority goals for science. Water resources can be sustained, not only by reducing treads, but also by
regulation the system within the drainage basin. To do so, we need to integrate and combine methodology
and knowledge from both hydrology and ecology in ecohydrology (Zalewski et al., 1997, Zalewski, 2000).
In lake ecology focus has been on surface water chemistry and physical conditions within the lakes,
whereas the groundwater re- and discharging in these lakes to a large extend represent an understudied
PhD summary
7
field in lake ecology. Several studies show that groundwater seepage can contribute with up to 50% of the
annual nutrient load to a lake (Brock et al. 1982; Shaw and Prepas, 1989; Sebestyen and Schneider, 2004;
Cullmann et al., 2005). Ommen et al. (2012) showed the same for a Danish seepage lake where they
estimated groundwater seepage accounted for 67% of the total P input and 50% of the total N input. This will
undoubtedly affect the lake ecology and with this project, I aim to address some of the interactions between
hydrology and ecology in a seepage lake.
1.2 Motivation and objectives
During the past 100 years agricultural production in Denmark has increased significantly (Hansen et al.,
2012). Following World War II, the international trade with fertilizers and feed boomed, and in Denmark the
import of both virtually exploded during the sixties to eighties (Hansen et al,. 2012). This was reflected in the
nitrate concentrations in the Danish groundwater and a clear increasing trend was observed following the
increased use of fertilizers (Hansen et al., 2012). Despite the significant reduction in the use of fertilizers
following the regulations described above, the environmental goals to meet the requirements of the Water
Framework Directive for the majority of the Danish lakes are not yet reached (Danish Nature Agency, 2014).
In order to effectively address the above problem, there is a need for better understanding of how
the individual water systems are impacted. In Denmark 80 restoration attempts have been done within the
past 20 years. In many cases the effect of the restoration decrease after just a few years. This is often
attributed to either internal loading of phosphorous in the system or poor control of nutrient input from drains
and surface inlets (Bramm and Christensen, 2006). Surprisingly, it seems that in many of the cases, no
attempts to quantify nutrient input through diffuse sources such as groundwater discharge have been
considered (Søndergaard et al,. 1999; Liboriussen et al., 2007). This is, however a very plausible explanation
for why some of the lakes have returned to the bad condition it was in before the restoration initiative.
In this PhD study a groundwater/lake system that is largely impacted by terrestrial inputs from both
agriculture and forested land (Kidmose et al., 2011; Ommen et al., 2012, Karan et al 2014) is investigated
from an ecohydrological perspective. Using small scale experimentally derived data it is investigated how
groundwater affects the biology, and conversely how the biology affects the hydrological properties of the
sediments and the groundwater chemistry at the surface water interface (SWI). On a larger scale it is
attempted to incorporate these small scale hydrological, chemical and biological processes in a whole-lake-
response model.
The main objectives were to 1) evaluate how the groundwater seepage affected the growth of
different types of submerged plants. 2) Investigate how the submerged vegetation affects the small scale
hydrology in the lake bed sediments. 3) Investigate the small scale flow patterns and transport of nitrate
through the groundwater by using natural tracers. 4) Use data on different temporal and spatial scales, to
evaluate a historical ecological effect of the nitrate leaching to the lake.
Addressing these objectives has resulted in four papers:
PhD summary
8
Paper I, “Groundwater Seepage stimulates the growth of aquatic macrophytes” addresses objective 1 and is
published in Freshwater Biology.
Paper II, “Rooted underwater vegetation locally reduces groundwater discharge in lakes” addresses
objective 2.
Paper III “Tacking groundwater flow during a flow reversal – nature’s own tracer experiment” addresses
objective 3.
Paper IIII “Using whole-system understanding to evaluate long term development in alkalinity in a northern
flow through lake” addresses objective 4.
2 PhD Research
All experiments were conducted in Lake Hampen, Denmark. Lake Hampen is a well investigated lake
(Moeslund, 2000; Kidmose et al. 2011, Ommen et al., 2012; Karan et al. 2014) which allows the results from
this study to be compared with previous findings and gives access to historical data on the lake surface
water chemistry. Lake Hampen is characterized as a flow-through-lake and approximately 2/3 of the water is
received from ground water seepage discharge at the north-eastern side of the lake and approximately 3/4
leaves the lake through groundwater seepage recharge at its westerns side (Ommen et al., 2012). These
settings are ideal for studying the interactions between hydrology and lake ecology.
Paper 1 addresses the effects of groundwater seepage discharge on two species of submerged
plants with contrasting morphological adaptation for nutrient and carbon uptake. Paper 2 addresses how the
carpet like structures of isoetids can affect the small scale hydrology by forming a layer of low hydraulic
conductivity. Paper 3 uses a natural tracer (δ18O) to follow movement of groundwater and nitrate to and
from the lake during a flow reversal where the directional flow of the groundwater changed. Under normal
conditions, groundwater discharges large amounts of nitrate to the lake, but during the flow reversal, lake
water penetrated the sediment down to at least 1.25 m. Paper 4 addresses the historical effects of
groundwater seepage discharge on the lake ecology by investigating how the groundwater input of nitrate
may have affected the historical development in alkalinity of the lake water
PhD summary
9
2.1 Paper I
Title: “Groundwater seepage stimulates the growth of aquatic macrophytes”
2.1.1 Introduction and objectives
Submerged aquatic plants are a diverse group of organism competing for the same resources (Carignan &
Kalff, 1980; Rattray et al., 2991). Whereas most plants can utilize the inorganic carbon and nutrient from the
water column, only specially adapted plants are able to use the sediment as a source of these substances
(Sand-Jensen & Prahl, 1982; Madsen et al., 2002). In northern temperate lakes, the availability of inorganic
carbon and nutrient have considerable seasonal variation with low concentration in the growth season where
nutrients are bound in living biomass, and much higher concentrations during winter when mineralization
processes dominate (Guilford & Hecky, 2000). Plants that are able to exploit the nutrients in interstitial water
in the sediment have a competitive advantage during the growth season (Madsen et al. 2002).
The availability of inorganic carbon and nutrients are normally evaluated by measuring the
concentrations in the surface water and the interstitial water. The groundwater represents a largely
overlooked source of both nutrients and inorganic carbon. Groundwater contains high concentrations of
inorganic carbon due to subsurface respiration processes and it is often relatively nutrient rich due to
accumulation in the catchment (Brock et al. 1982; Shaw & Prepas, 1989; Hagerthey and Kerfoot, 1998). In
seepage discharge zones, there is a continuous supply, and this could have large effects on the vegetation
benefiting from this source. How this groundwater affects the submerged vegetation is poorly understood.
Some studies suggest that it might have an effect, but to my knowledge no studies examines this directly.
Actual growth experiments have been carried out on algae by Hagarthy and Kerfoot (1998) and they find a
significant effect of groundwater seepage on the growth rates of the algae.
The objectives of this study was to 1) Examine the effects of re- and discharge from catchments with
different land use on the growth rates of submerged plants. 2) Examine the in situ and in vitro effect of
groundwater seepage on plants of contrasting morphological adaptions to nutrient and carbon uptake. 3)
Examine the relative importance of groundwater seepage discharge as a nutrient source, a source of
inorganic carbon, or both.
2.1.2 Main findings
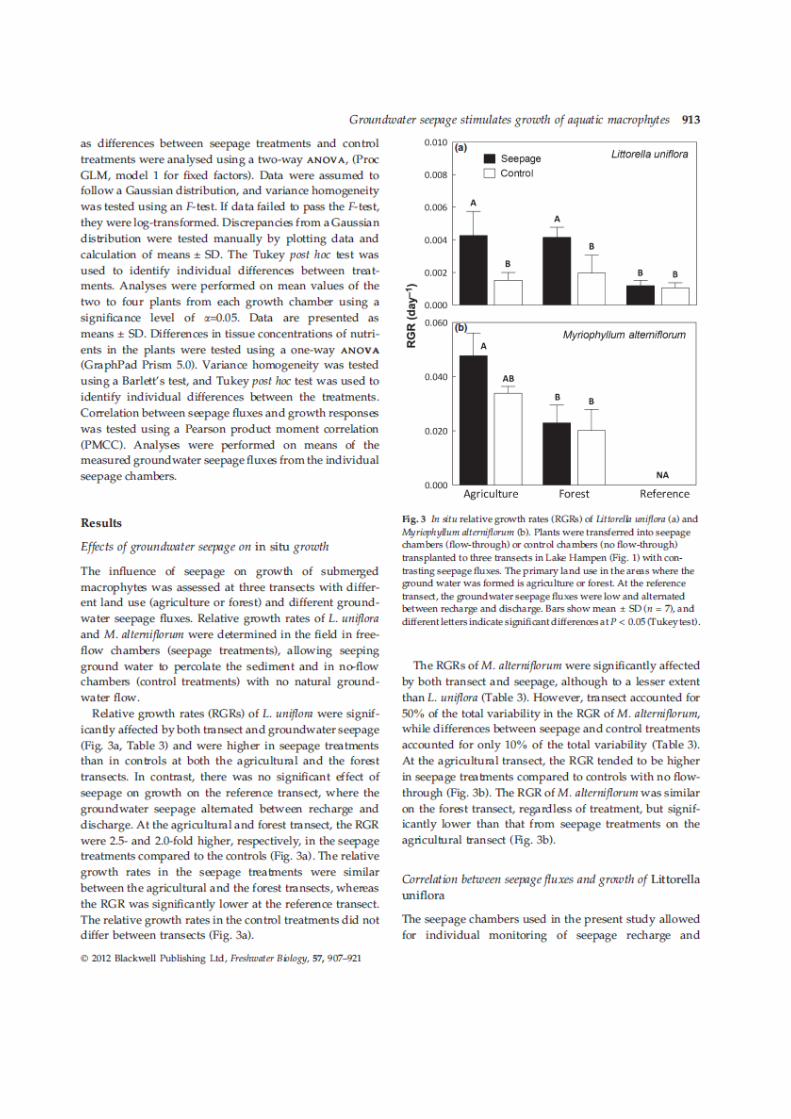
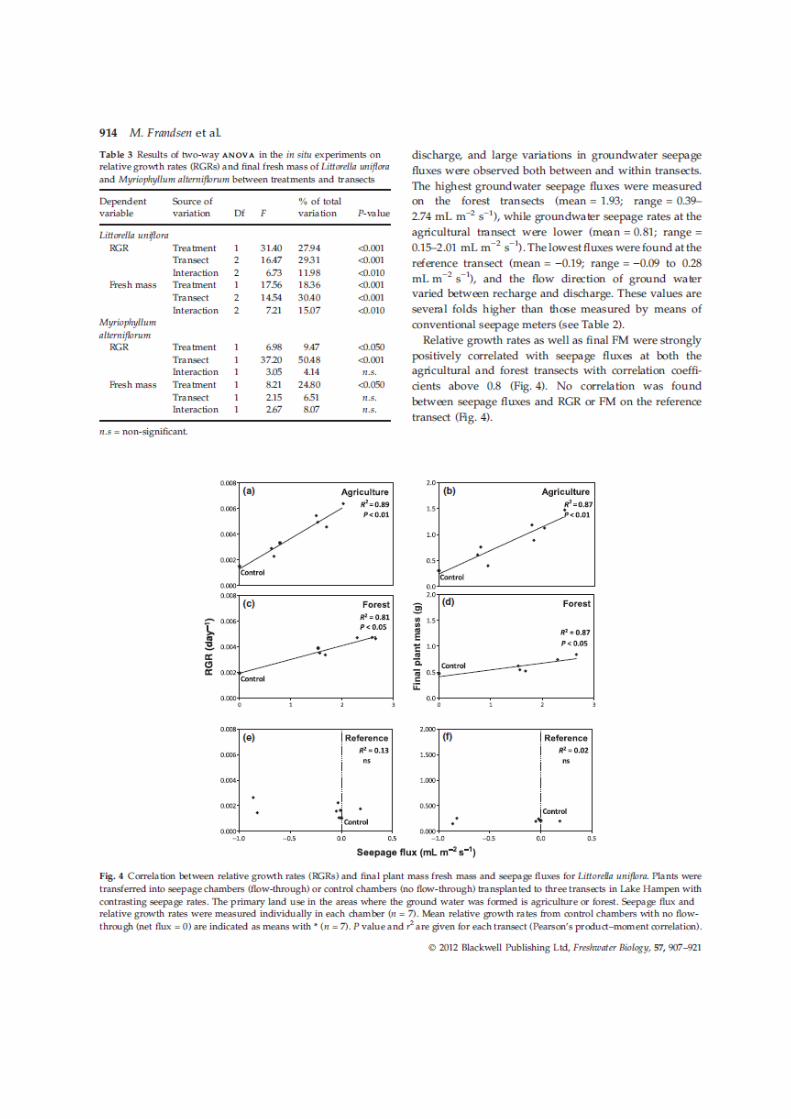
We found that groundwater discharge had a significant, positive effect on the in situ growth rates of Littorella
uniflora. This was evident on both an area where the groundwater originated from a forested catchment and
from an area where the groundwater originated an agricultural catchment. The plants benefited both from the
inorganic carbon and the nutrients (nitrate of phosphorous), but the results indicated that mainly the
increased availability of inorganic carbon resulted in the enhanced growth. The final plant mass was up to
70% higher in plants that were subjected to seepage discharge when compared to the control plants who
received no groundwater.
We found a strong positive correlation between seepage discharge rates and the growth rates and
final plant mass. This was evident on both the areas where the discharge water originated from a forested
PhD summary
10
catchment and the area where the discharge water originated from an agricultural catchment, but not on
plants grown in an area of groundwater recharge.
2.2 Paper 2
Title: “Rooted underwater vegetation locally reduces groundwater discharge in lakes”
2.2.1 Introduction and objectives
It is generally accepted that groundwater discharge in homogeneous systems mainly takes place near the
shore and decreases exponentially with distance to shore (McBride & Phannkuck, 1975; Lee, 1977; Shaw &
Prepas. 1990). The groundwater discharging to the lake percolates the littoral zone in the near shore areas.
Here the water must surpass the roots of the submerged vegetation, before entering the lake surface water.
Some species of submerged plants called isoetids form carpet like structure holding ~9.000 individual plants
m-2
(Christensen and Sørensen, 1986). These plants have special morphological adaptations that give them
an effective nutrient uptake through their roots that often comprise up to 50% of the total plant mass
(Hutchinson, 1975). Due to their large root systems, the isoetids may effectively alter the hydraulic properties
of the near shore sediment.
The roots can have a direct effect on the hydraulic conductivity, simply by filling up pore spaces or by
altering the overall porosity of the sediment. They can also indirectly affect the hydraulic conductivity by
promoting intrusion of fine particles in the sediment (Lehman 1975, Hilton 1985). The canopy of submerged
vegetation attenuates the energy associated with waves and currents herby creating a low energy
environment that allows entrapment of fine particles (Hilton, 1985; Blais & Kalff, 1995). The intrusion of fine
particles (≤ 63µm) reduces the sediment porosity, herby lowering the hydraulic conductivity (Lehman, 1975;
Hilton, 1985). This phenomenon is well studied in stream settings (Brunke & Gonser, 1997; Huettel et. al.,
1996; Huettel & Gust, 1992), but has not been addressed for lake settings.
However some studies suggest the existence of a vegetation induced lowering of the hydraulic
conductivity. Frandsen et al. (2012) and Hargerthey & Kerfoot (1998) both found an interesting increase the
seepage discharge after installing similar growth chambers in lake bed sediments. In both studies, it is
speculated whether a layer of low hydraulic conductivity is punctured during the installation of the growth
chambers. A layer of low hydraulic conductivity caused by vegetation was also suggested of Karan et al.
(2014). They found evidence of lowered hydraulic conductivity in the littoral zone, and identified an off-shore
discharge peak of groundwater, which could only be explained by including a lower permeable lake bed in
the near shore area in their model. They speculate if the vegetation might divert the groundwater flow, herby
explaining the off-shore groundwater discharge peak.
The objectives of this study were to examine the relationship between hydraulic conductivity and
small-scale sedimentary conditions caused by the presence of vegetation by comparing results from both a
vegetated and a non-vegetated area of a lake bed in a groundwater-fed lake.
PhD summary
11
2.2.2 Main findings
We found evidence for a strong vegetation induced effect on the hydraulic conductivity in the lake sediment.
Based on my results, this was caused by a combined effect of organic content in the sediment and the mass
of fine particles (<63µm).
We conducted simple disturbance experiment on both vegetated and non-vegetated sediment. On the
vegetated sediment, the disturbance had a strong effect and the hydraulic conductivity increased
significantly. In comparison, the hydraulic conductivity was not affected significantly on the bare sediment.
The relative mass of fine particles (<63µm) was significantly higher on the vegetated area, compared
to the non-vegetated area. The lowest hydraulic conductivity was found in the same depth normally identified
with the highest root density. We found a strong correlation between organic matter and mass of fine
particles in the sediment, and we speculate that the roots might trap and hold the fine particles in the
sediment.
2.3. Paper 3
Title: “Tracking groundwater flow during a flow reversal – nature’s own tracer experiment”
2.3.1 Introduction and objectives
The interaction between groundwater and surface water is complex and difficult to accurately quantify. The
spatial variation makes it costly and time consuming to map the in- and outputs correctly, and it is often not
possible. On a large scale, the groundwater systems are controlled by recharge from precipitation, drainage
through discharge to surface water, evaporation, and evapotranspiration. The groundwater flow pattern is
mainly controlled by topography (gravity) and flows from high to low elevations (Winter, 1999). On a smaller
scale, the flow pattern is affected by sedimentary heterogeneity, which causes differences in hydraulic
conductivity. Furthermore, the temporal variation in the groundwater flow pattern can vary from hours to
decades, which makes the system very dynamic in both time and space.
Locally, the flow system associated with surface water bodies results in more complex flow patterns,
regardless of topography. Seasonal changes in lake stage, transpiration, evaporation and precipitation might
change the head differences between the lake and the groundwater and have substantial effect on the
groundwater – lake interactions. The sensitivity of the groundwater-surface water flow systems gives rise to a
number of transient effects (Cheng and Anderson, 1994, Anderson and Cheng, 1993). Of the more important
transient effects is the flow reversal. Flow reversal alters the directional flow of ground water, sometimes
changing recharge areas to discharge areas. In ground water - lake systems where the groundwater
transport large amount of nutrients to the lakes, this may affect the ecology of the lake (Sacks et al. 1992)
The objectives of this study were to quantify the duration of an ongoing flow reversal at Lake Hampen by
using data on the natural δ 18
O isotope, and at the same time examine the effect of the flow reversal on the
nitrate transport to the lake during the reversal.
PhD summary
12
2.3.2 Main findings
During this study the back seeping groundwater after a flow reversal in Lake Hampen was captured. During
the flow reversal, lake water penetrated the lake sediment down to a depth of more than 1.25 m and during
2011 – 2013 the groundwater gradually returned. The results suggest that the flow reversal has been in
effect from at least 2010 to ~2012-2013.
The flow reversal was probably caused by meteorological factors. The lake stage and groundwater head
were low in 2010 and 2011. The total precipitation decreased from 913 mm in 2007 and 875 mm in 2008 to a
mere 754 and 704 in 2009 and 2010 respectively. This could have affected both the lake stage directly, but
also the groundwater head, due to lower infiltration (Downing and Peterka, 1978; Sacks et al., 1992;
Rosenberry et al., 1997). At the same time, the air temperature during the winter dropped in 2009 and 2010,
causing a larger proportion of the precipitation in those years to fall as snow, possibly causing a lower
infiltration rate.
It is speculated that none of the meteorological data is very extreme seen in a historical time frame, and if
these factors leads to a groundwater reversal in Lake Hampen, it should be assumed that the lake most
likely has undergone several groundwater reversals historically.
2.4. Paper 4
Title: “Using whole-system understanding to evaluate long term development in alkalinity in a northern flow
through lake”
2.4.1 Introduction and objectives
The alkalinity in Lake Hampen has increased from the mid-1970s until the mid-1990s. The reason for this is
unknown, but some studies suggest that denitrification of nitrate seeping to the lake, from an agriculture area
on the North-East shoreline, might be a possible source of alkalinity (Karan et al. 2014). The in-lake alkalinity
production is driven by, on the one hand primary production, and on the other hand reduction of the major
anions such as sulfate and nitrate (Schindler 1986; Rudd et al. 1988). Studies show that these processes
can play a significant role in the regulation of the acid-base system, especially in soft water lakes (Davidson,
1986). In the past ~80 years, the nutrient load to lakes has increased and as a consequence a general trend
of increased alkalinity has been observed in many of the lakes (Sutcliffe et al., 1982).
Nitrogen discharge in the form of nitrate can be especially harmful to the lakes. The anaerobic denitrifiers
need nitrogen in the form of NO3- and this is often supplied from the aerobic nitrifying processes where
NH4+ (ammonium) is oxidized to NO2-/NO3- (Appelo & Postma, 2005). However, if the nitrogen is readily
supplied in the form of nitrate, the denitrifiers only need a sufficient electron donor (i.e. carbon, pyrite or
´Fe2+) to drive denitrification.
The objective of this study was to examine if agriculturally derived nitrate discharging to the lake form the
agriculture could explain the changes in alkalinity from the mid-1970s till today. In the absence of historical
data on the nitrate concentration in the groundwater, a four step mass balance approach is used to
investigate this. Information on the surface water concentrations of nitrate, EC and alkalinity and a correlation
PhD summary
13
between nitrate and EC in the groundwater was used to estimate the historical input of nitrate. I then tried to
denitrify the excess nitrate given by the mass balance model to see if this would give rise to alkalinity
changes as the ones we observe in the lake.
2.4.2 Main findings
Using long time series of data on surface water chemistry dating back to the 1970s and a simple mass
balance approach I show that denitrification of nitrate-polluted groundwater coming from the agricultural part
of the catchment could be an explanation for the observed increase in alkalinity in the lake during the 1980s
and 1990s.
Using a simple mass balance approach, it was possible to predict the alkalinity changes in Lake Hampen in a
historical time frame surprisingly accurate. Given the assumptions used, denitrification of nitrate discharging
into the lake from the agriculture could stoichiometrically account for the observed changes in alkalinity. The
denitrification rates used are in good agreement with what other studies have found in the lake.
3 Conclusions and perspectives
The discipline of ecohydrology is called a new and emerging discipline (Hannah et al., 2004). It is difficult to
conduct true cross-disciplinary studies, as scientists are normally only trained thoroughly in their own main
discipline. Still, given the number of challenges standing before us in regard to maintaining our freshwater
systems, the need for cross-disciplinarity has never been more urgent. The underlying objective of this study
was to examine if cross-disciplinary methods would strengthen the way we describe and investigate our
freshwater lake systems as either biologist or hydrologist. I have tried to include the hydrological
methodology in the traditional ways we do biological studies and vice versa.
In the first paper, I show how the groundwater discharging into the lake through the lake bed sediment have
a significant effect on the growth rates of the submerged plants (Frandsen et al., 2012). This is a significant
finding. Looking at the literature, it seems that seepage discharge of nutrients to the submerged plants is
almost completely overlooked. In example Barko et al. (1991) review the interactions between sediment and
submerged plants. They evaluate the sources of particular nutrients for uptake by submerged plants without
mentioning groundwater seepage discharge as a possible source. Few studies include this source of
nutrients (Frandsen et al., 2012; Carpenter and Lodge, 1986; Sebestyen and Schneider, 2004). In lakes
where groundwater discharges, the plant communities have a continuous supply of nutrients and carbon
from the groundwater, and this might be a significant factor driving growth and possibly also distribution. This
should be included in future in situ studies of submerged plant growth and distribution.
Furthermore, as the groundwater seepage has a positive effect on the growth rates of the
submerged isoetids, it also means that the isoetids filters the water from nutrient and carbon before it enters
the surface water. This is also interesting as the thick carpet like structures of isoetids might play a key role
in preventing eutrophication in some systems. Ommen et al. (2012) have estimated that the isoetids in Lake
Hampen might take up as much as 1.7 ton N year-1
that would otherwise have ended up in the surface water.
PhD summary
14
Paper two addresses how the isoetids vegetation affects the small scale hydrology of the lake bed
sediment by lowering the hydraulic conductivity. This is also an interesting finding. First of all, it could lead to
an increased discharge further away from the shore to off-shore areas with no effective plant cover to filter
the water (Karan et al. 2014). From a lake management perspective, diverted groundwater seepage could
represent an undetected source of nutrients as these off-shore discharge zones can be difficult to detect.
Hence, these findings from paper 1 and paper 2 give new examples on the often high degree of uncertainty
up-scaling point observations to whole system analysis often are succumbed to. If the nutrient content in the
pore water is used to conclude the overall nutrient availability in the lake, it will be greatly underestimated in
lakes where the groundwater seepage transports large amount of nutrient to the system. Even when this is
taken into account, off shore peaks in groundwater seepage, could be overlooked.
The problem of up-scaling point observations to whole system analysis can, however, be overcome.
To estimate the overall effect of groundwater on a lake, knowledge is needed on both the exchange of water
and the exchange of solutes through groundwater re- and discharge. However, it is not possible to do a
complete mapping of either as both the spatial and temporal variations are too complex. A different approach
could be to use the lake itself as a sentinel for all the processes taking place in and around the lake.
Changes in the surface water solutes can be seen as an integrated response to both catchment specific in-
and out-puts as well as in-lake processes (Krabbenhoft and Webster, 1995; Gurrieri and Furniss 2004;
Rimmer et al., 2006). Using this approach would still call for a somewhat precise estimation of the overall in-
and out-puts of water, but part of the evaluation of the accuracy of the results could be done by simply
studying the surface water. This approach is used in paper 3, and using this method, it was possible to
accurately describe the historical development in alkalinity in the lake over a period of ~40 years.
Even if it was possible to do a truly adequate spatial mapping and quantification of the movement of
water and nutrients in the system, the problems arising from temporal variation would still complicate the
quality of the results. Especially transient effects can be difficult to capture as it is speculated is the case for
Lake Hampen in paper 4. Based on previous studies on the lake (Kidmose et al., 2011; Ommen et al., 2012;
karan et al., 2014) a 200 m2 discharge area was expected to be present at the north-eastern side of the lake.
Instead, this area turned out to be an area recharging the aquifer due to an on-going flow reversal.
Flow reversals are interesting from a hydrological perspective, but also from an ecohydrological
perspective. In lakes where the groundwater normally discharges nutrients to the lake system, a flow
reversal can have significant effect on the system. In the littoral zone, where most of the groundwater under
normal circumstances discharges (McBride and Pfannkuch, 1975; Lee, 1977; Shaw and Prepas, 1990), the
biota benefits from the groundwater supply of nutrients and inorganic carbon (Hargerthey and Kerfoot, 1998;
Frandsen et al., 2012). In lakes with low surface water nutrient concentrations, a flow reversal can cause loss
of an important nutrient source for the vegetation. In lake management, samples of pore water collected
during a flow reversal can be faulty and give rise to wrong estimates of the catchment specific input of
nutrients to the lake. Hence, it is important to be able to both locate and quantify flow reversals.
Groundwater and lake system are connected with each other in a complex manner both temporally,
spatially and disciplinary. It is impossible to accurately describe the hydrology, without taking the biology into
account (i.e. paper 2). On the other hand, it is also impossible to accurately describe the parameters
PhD summary
15
controlling growth of the biota without taking the hydrology into account (Frandsen et al., 2012). By
combining methodology from biology/ecology and hydrology, it is possible to produce more accurate
descriptions of the systems, and it often calls for less dense instrumentation of the site of interest. This study
strongly encompasses the idea of ecohydrology as an important new discipline within water management
and sciences.
We live in a world with an ever increasing human population, need for food production, for drinking
water, need for urbanization of our land, and this have wide-ranging consequences for our ecosystems,
including the fresh waters (Moss, 1999). In Demark, we can directly correlate the pollution of our drinking
water with the agricultural use of fertilizers (Hansen et al., 2012), and in countries without regulation of this,
the situation is even worse (Adams, 2001). The need for cross-disciplinarity has never been more urgent.
Furthermore, the idea of cross-disciplinarity might be important on an even higher level than simple
collaboration between different areas of natural sciences. Ultimately, science cannot by itself govern water
management as stated by Nuttle (2002). Public institutions, law, policies and regulation comprise the
material for fashioning sustainable management. At this point however, it can be argued that decision
making e.g. from a cost benefit approach, investment and policy strategies are still not based on a holistic
framework for integrating hydrology and ecology (Zalewski, 2000).
Future decisions concerning our environment are not going to be decided by natural scientists, but
by politicians and economists, consequently natural scientists need to build and strengthen the connection
and collaboration with these and to disseminate the knowledge needed to make the right decisions. As
natural scientists, we must be able to pin-point the challenges posed to our environment, not only within our
own discipline, but between all the disciplines concerning the ecology that we try to protect. We need to
come to a consensus of the actions needed on the political arena and we need to be able to work together
with these people if we hope to have an impact on the decisions made about our ecosystems.
4 References
Adams, W M. 2001. Green development. Environment and sustainability in the third world. Routledge,
London. ISBN (e-Reader format): 0-203-74913-8
Anderson, M. P., Cheng, X. 1993. Long- and short-term transience in a groundwater/lake system in
Wisconsin, USA. Journal of Hydrology. 145(1-2): 1-18
Appelo, C.A. J. & Posta, D. Geochemistry, Groundwater and pollution. 2005. A.A. Balkema publishers. 458-
462
Barko, J. W., Gunnison, D., Carpenter, S. R. 1991. Sediment interactions with submerged macrophyte
growth and community dynamics. Aquatic botany. 41: 41-65
Blais, J. M., Kalff, J. 1995. The influence of lake morphometry on sediment focusing patterns. Limnology and
Oceanography. 40: 582-588
PhD summary
16
Blicher-Mathiasen, G., Rasmussen, A., Grant, R., Jensen, P. G., Hansen, B., Thorling, L. 2013.
Landovervågningsoplande 2012. NOVANA. (Danish Agricultural monitoring catchments). University
of Aarhus. Danish Centre for Environment and Energy, DCE.
Bram, M., Christensen, I. 2006. Management og restaurering af søer i Danmark (management and
restoration og lakes in Denmark). Nordjyllands Amt. Only Danish.
http://naturstyrelsen.dk/media/nst/72307/Management%20og%20restaurering%20af%20s%C3%B8e
r%20i%20Danmark_2006.pdf
Brinson, M. M., Malvarez, A. I. 2002. Temperate freshwater wetlands: types, status, and threats.
Environmental Conservation. 29/2: 115-133
Brock, T.D., Lee, D.R., Janes, D. J. & Winek, D. 1982. Groundwater seepage as a nutrient source to a
drainage lake, Lake Medota, Wisconsin. Water research. 16: 1255-1263
Brock, W. A., Starrett, D. 2003. Managing systems with non-convex positive feedback. Environmental and
Resource Economics. 26: 575-602
Brunke, M. 1999. Colmation and depth filtration within streambeds: retention of particles in hyperheic
interstices. International Review of hydrobiology. Hydrobiology. 84: 99-117
Brunke, M., Gonser, T. 1997. The ecological significance of exchange processes between rivers and ground-
water. Freshwater Biology. 37: 1-33
Brønmark, C., Hansson, L. 2002. Environmental issues in lakes and ponds. Current state and perspectives.
Environmental Conservation. 29/3: 290-306
Carignan, P., Kalff, J.1980. Phosphorus as a source for aquatic weeds: water or sediment. Science. 207:
987-989
Carpenter, S. R., Lodge, D, M. 1986. Effects of submerged macrophytes on ecosystem processes. Aquatic
botany. 26: 341-370
Cheng, X., Anderson, M. P. 1994. Simulating the influence of lake position on groundwater fluxes. Water
Resources Research. 30(7): 2041-2049
Christinsen, P. B., Sørensen, J. 1986. Temporal variation of denitrification activity in plant-covered littoral
sediment from Lake Hampen, Denmark. Applied Environmental Microbiology. 1174-1179
CLEAR –Centre for Lake Restoration. 2006. http://www.lake-restoration.net/english/index_UK.html
Cullmann, J., Junk, W. J., Weber, G., Schmitz, G. H. W. 2005. The impact of seepage influx on cation
content of a central Amazonian floodplain. Jounal of Hydrology. 328: 297-305
Danish Nature Angency. 2014. Basisanalyse for vandområdeplaner 2015-2031 (basis analysis for water area
plans 2015-2031). Danish Nature Agency, Danish ministry of Environment. Available at:
http://naturstyrelsen.dk/media/nst/89701/bilag%201%20basisanalyse%2019-2.pdf
Davison, W. 1986 Internal element cycles affecting the long-term alkalinity status of lakes: implications for
lake restoration. Scheiz. Z. Hydrol. 49/2: 186-201
EEA, 2005. Source apportionment off nitrogen and phosphorus input into the aquatic environment. European
Environmental Agency, EEA, report no.7
Frandsen, M., Nilsson, B., Engesgaard, P., Pedersen, O. 2012. Groundwater seepage stimulates the growth
of aquatic macrophytes. Freshwater Biology. 57/5: 907-92
PhD summary
17
Groffmann, P. M., Pace, M. L. 1998. Synthesis: what kind of a discipline is this anyhow? Successes,
Limintation, and Frontiers in Ecosystem Science. Springer, New York, USA. 473-481
Guildford, J. S. & Hecky, R. E. 2000. Total nitrogen, total phosphorus, and nutrient limitation in lakes and
oceans: Is there a common relationship? Limnology and Oceanography. 45: 1213 – 1223
Gurrieri, J. T., Furniss, G. 2004. Estimation of groundwater exchange in alpine lakes using non-steady mass-
balance methods. Journal of Hydrology. 297: 187-208
Hagerthey, S. E. & Kerfoot, W. C. 1998. Groundwater flow influences the biomass and nutrient ratios of
epibenthic algae in a north temperate seepage lake. Limnology and Oceanography. 43,´: 1227-1242
Hannah, D, M., Wood, P. J., Sadler, J. S. 2004. Ecohydrology and hydroecology: A “new paradigm”?. Hydrol.
Process. 18: 3439-3445
Hansen, B., Thorling, L., Sørensen, B., Dalgaard, T., Erlandsen, M. 2012. Nitrattrends I dansk grundvand.
Vand & Jord. 19 (1): 37-40. Only Danish
Hilton, J. 1985. A conceptual framework for predicting the occurrence of sediment focusing and sediment
redistribution in small lakes. Limnology and Oceanography. 30: 1131-1143
Huettel, M., Gust, G. 1992. Solute release mechanisms from confined sediment cores in stired benthic
chambers and flume flows. Marine Ecology Progress series. 82: 187-197
Huettel, M., Ziebis, W., Forster, S. 1996. Flow-induced uptake of particulate matter in permeable sediments.
Limnology and Oceanography. 41/2: 309-322
Hutchinson G. E. (1975). A treatise on limnology. Limnological botany. John Wiley & son.
Karan, S., Kidmose, J., Engesgaard, P., Nilsson, B., Frandsen, M., Omen, D. A .O., Flint, M. R., Andersen,
F. Ø., Pedersen, O. 2014. Role of a groundwater-Lake interface in Controling seepage of water and
Nitrate. Journal of Hydrology. 517: 791-802
Kidmose, J., Engesgaard, P., Nilsson, B., Laier, T. and Looms, M. C. 2011. Spatial distribution of seepage at
a flow-through lake: Lake Hampen, eastern Denmark. Vadose Zone Journal. 10/1: 110-124
Krabenhoft, D. P., Anderson, M. P., Bowser, C. J. 1990. Estimating groundwater exchange with lakes, 2.
Calibration of a three- dimensional solute transport model to a stable isotope plume. Water
Resources research. 26: 2455 – 2462
Kundzewicz, Z. W. 2002. Ecohydrology – seeking consensus on interpretation of the notion. Hydrological
Sciences journal. 47(5), 799-804
Lee, D. R. 1977. A device for measuring seepage flux in lakes and estuaries. Limnology and Oceanography.
22: 140-147
Lehman, J. T. 1975. Reconstructing the rate of accumulation of lake sediment: The effect of sediment
focusing. Quaternary Research. 5: 541-550
Liboriussen, L., Søndergaard, M., Jeppesen, E. 1999. Sørestaurering i Danmark (lake restoration in
Denmark). Danmark miljøundersøgelse, University of Århus. http://www2.dmu.dk/pub/fr636_del2.pdf
Madsen, T. V., Olesen, B. & Bagger, J. 2002. Carbon acquisition and carbon dynamics by aquatic isoetids.
Aquatic Botany. 73: 371-361
McBride, M.S., Pfannkuch, H. O. 1975. The distribution of seepage within lakebeds. J. Res. USGS. 3: 505-
512
PhD summary
18
Moss, B. 1999. Ecological challenges for lake management. Hydrobiologia. 395(396): 3-11
Nuttle, W. 2002. Is ecohydrology one idea or many? Hydrological sciences journal. 47(5): 805-807
Omen. D. A. O., Kidmose, J., Karan, S., Flint, M. R., Engesgaard, p., Nilsson, B. and Andersen, F. Ø. 2012.
Importance of groundwater and macrophytes for the nutrient balance at oligotrophic Lake Hampen,
Danmark. Ecohydrology. 5/3: 286-296
Rattray, M. R., Howard-Williams, C. & Brown, J.M.A. 1991. Sediment and water as sources of nitrogen and
phosphorus for submerged rooted aquatic macrophytes. Aquatic Botany. 40: 225-237
Rimmer, A., Boger, M., Aota, Y., Kumagai, M. 2006. A lake as a natural integrator of linear processes:
Application to lake Kinneret (Israel) and lake Biwa (Japan). Jounal of Hydrology. 319: 163-175
Rodriguez-Iturbe. 2000. Ecohydrology: A hydrologic perspective of climate-soil-vegetation dynamics. Water
resources research. 36(1): 3-9
Rudd, J. W. M., Kelly, C. A. and Schindler, D. W. 1988. Comment on “Dynamic model of in-lake alkalinity
generation” by L. A. Baker and P.L Brezonik. Water resources research. 24/10: 1825-1827
Sacks, L. A., Herman, J. S., Konikow, L. F., Vela, A. L. 1992. Seasonal dynamics of groundwater lake
interactions at Donãna National Park, Spain. Journal of Hydrology. 135 (1-4): 123-154
Sand-Jensen, K., Prahl, C. 1982. Oxygen exchange with the lacunae and across leaves and roots of the
submerged vascular macrophyte, Lobelia dortmanna L. New Phytologist. 91: 103-120
Schaab, B. F:, Blom-Zandstra, M., Hermans, M. L., Meerburg, B. G., Verhagen, J. 2011. Impact changes of
climatic exstremes on arable farming in the north of the Netherlands. Reg. Environ Change. 11: 731-
741
Sebestyen, S. D., Schneider, R. L. 2004. Seepage patterns porewater, and aquatic plants: hydrological and
biochemical relationships in lakes. Biochemistry. 68: 383-409
Scheffer, M., Hosper, S. H., Meijer, M. L., Moss, B., Jeppesen, E. Alternative equlibria in shallow lakes. Tree.
8 (8): 275-279
Schindler, D. W. 1974. Eutrophication and recovery in experimental lakes: Implications for lake management.
Science. 184: 897-898
Schindler, D. W., Turner, M. A., Staiton, M. P. and Linsey, G. A. 1986. Natural sources of acid neutralizing
capacity in low alkalinity lakes of the Precambrian Shield. Science. 232: 844-847
Shaw, R. D. & Prepas, E. E. 1989. Anomalous, short-term Influx of water into seepage meters. Limnology
and Oceanography. 34: 1343-1351
Sutcliffe, D. W., Carrick, T. R., Heron, J., Rigg, E., Talling, J. F., Woof, C., Lund, J. W G. 1982. Long-term
and seasonal changes in the chemical composition of precipitation and surface waters of lakes and
tarns in the English Lake District. Freshwater Biology. 12(5): 451-506
Søndergaard, M., Jeppesen, E,. Jensen, J. P. 1999. Danske søer og deres restaurering. Miljø og
Energiministeriet. Danmark miljø undersøgelse. Only in danish
Timms, R. M., Moss, B. 1984. Prevention of growth of potentially dense phytoplankton populations by
zooplankton grazing, in the presence of zooplanktivorous fish, in a shallow wetland ecosystem.
Limnology and Oceanography. 29 (3): 472-486
PhD summary
19
Wiberg-Larsen, P., Windolf, J., Bøgestrand, J., Baastrup-Pedersen, A., Kristensen, E. A., Larsen, S. E.,
Thodsen, H., Ovesen, N. B., Bjerring, R., Kronevang, B., Kjeldgaard, A. 2013. Vandløb 2012,
NOVANA (Streams 2012, NOVANA). University of Aarhus. Danish Centre for Environment and
Energy, DCE. http://dce2.au.dk/pub/SR75.pdf
Winter, T. C. 1999. Relation of stream, lakes, and wetlands to groundwater flow systems. Hydrogeology
journal. 7(1): 28-45
Zalewki, M. 2000. Ecohydrology – the scientific background to use ecosystem properties as management
tools toward sustainability of water resources. Ecological engineering. 16: 1-8
Zalewski, M. 2002. Ecohydrology – the use of ecological and hydrological processes for sustainable
management of water resources. Hydrological Sciences. 47(5): 823 – 832
Zalewski, M., Janauer, G. A., Jolankai, G. 1997. Ecohydrology: A new paradigm for the susteineble use of
aquatic resources. UNESCO, Paris. Available at:
http://unesdoc.unesco.org/images/0010/001062/106296E.pdf

PhD summary
20

Appendixes

Paper 1
Groundwater Seepage stimulates the growth of
aquatic macrophytes
Mette Cristine Schou Frandsen, Bertel Nilsson, Peter Engesgaard, Ole Pedersen
Published in Freswater biology 2012

Paper 2
Rooted underwater vegetation locally reduces
groundwater discharge in lakes
Mette Cristine Schou Frandsen, Peter Engesgaard, Bertel Nilsson, Ole Pedersen

Paper 2
1
Rooted underwater vegetation locally reduces groundwater
discharge in lakes
Mette Frandsen*, ^
, Peter Engesgaard+, Bertel Nilsson
^ Ole Pedersen
*
*The Freshwater Biological Laboratory, Department of Biology, University of Copenhagen, Copenhagen,
Denmark
^The Geological Survey of Denmark and Greenland, Copenhagen, Denmark
+Department of Geosciences and Natural Resource Management, University of Copenhagen, Denmark
Abstract
A comparative study of the effect of dense stands of Littorella uniflora on the hydraulic properties of the
sediment in Lake Hampen, Denmark was examined on two neighboring areas; one densely vegetated and
one bare. Both areas were located on a groundwater discharge site.
By measuring bulk hydraulic conductivity (Kslichter), vertical hydraulic conductivity (VHC), and doing
analysis of the organic content of the sediment, we found evidence for a strong vegetation induced effect on
the hydraulic conductivity in the lake sediment.
We found an overall negative correlation between Kslichter and the organic content in the sediment
(P<0.001, R2
= 0.47) and a positive correlation between organic content and mass of fine particles (≤63µm)
(P<0.05, R2=0.36). Both Kslichter and VHC was significantly lower on the vegetated sediment compared to the
non-vegetated sediment (P<0.05). On the vegetated area, there was a strong negative correlation between
Kslichter and the mass of fine (P<0.05, R2=0.89) and a strong positive correlation between the mass of fine
particles and the organic content (P<0.05, R=0.89). On the bare sediment the hydraulic conductivity was
relatively uniform with depth compared to the vegetated sediment and there was no correlation between fine
particles, and hydraulic conductivity.
VHC was measured before and after simple disturbance. On the vegetated sediment, the
disturbance had a strong effect in most of the standpipes increasing the VHC significantly (P<0.05). On the
bare sediment the disturbance had little or no effect on VHC.
Introduction
Understanding the exchange of nutrients between groundwater and lakes are important in catchment and
surface water management. Groundwater can accumulate and discharge large amounts nutrients and land
derived pollutants from catchments to lakes. In some catchments, the groundwater discharge represents a
Paper 2
2
main transportation route of solutes from the terrestrial to the aquatic environment. In turn, the exchange of
solutes through groundwater discharge can lead to severe impacts on the trophic status of the surface water
(Hagerthey & Kerfoot, 1998; Sebestyen & Scneider, 2004; Hayashi & Rosenberry, 2005; Kidmose et al.,
2013; Ommen et al., 2012; Meinikmann et al., 2013). How groundwater impacts the ecology of lakes varies
from catchment to catchment and depends on the chemical composition of the groundwater and how
important groundwater is to the surface water and chemical budgets.
For groundwater-dominated lakes it is important to understand how the littoral zone of a vegetated
lake bed affects nutrient input and retention (Karan et al., 2014). In the last decades only few studies on lake
ecology includes small to large-scale hydrodynamics of the groundwater-lake interface (Cherkauer & Nader,
1989; Kishel & Gerla, 2002; Rosenberry et al., 2010; Genereux & Bandopadhyay, 2001) with a few studies
including non-reactive tracers such as Chloride and water stable isotopes (e.g. Schuster et al., 2003) and
reactive tracers (e.g. Schafran & Driscoll, 1993). However, direct measurements of the impact of submerged
macrophytes on groundwater seepage have not been carried out although a few studies have indicated a
relationship between presence of macrophytes and groundwater discharge/recharge (Petticrew & Kalff,
1991; Sebestyen & Sneider, 2004; Hayashi & Rosenberry, 2005; Frandsen et. al., 2012; Ommen et al.,
2012; Karan et al., 2014).
It is generally accepted that groundwater discharge in homogeneous aquifers mainly takes place
near the shore and decreases exponentially with distance to shore (McBride & Pfannkuch, 1975; Lee, 1977;
Shaw & Prepas, 1990). In many cases, however, sediment-dependent deviations from this exponentially
decreasing pattern have been observed. In non-homogeneous aquifers the local discharge patterns strongly
depends on small scale (cm to meters) hydraulic properties of the lake bed sediments. For example, Kishel &
Gerla (2002) and Sebok et al. (2013) found small-scale irregular discharge patterns controlled by the
heterogeneity of the lake bed and aquifer. Thus, an interesting question is what controls the hydraulic
properties of lake beds? Some of the more well-known parameters are those that are of strictly
physical/geological (Benoy & Kalff, 1999; Rosenberry et al. 2010) or chemical nature (Schälchli, 1992;
Bouwer 2002; Förstner et al. 2008), whereas biological effects have been less studied (Schälchli, 1992;
Brunke, 1999; Marmonier et al., 2004). Physical effects can be very local. For example, Rosenberry et al.
(2010) used seepage meters to examine recharge (surface water lost to groundwater) before and after
simple disturbance of the top sediment (here by just walking on the sediment) and found a 2-7 fold increase
in seepage rates after disturbing the top layer. They attributed this to the existence of a veneer layer on the
lake bed.
An important, but overlooked biological effect is the one caused by the roots of submerged plants.
The roots provide habitat for sediment biota (i.e. microbes and invertebrates) hereby having a direct physical
effect on the sediment. The direct biological/physical effect may in turn have an indirect chemical effect by
affecting the oxygen penetration depth (Forster & Graf, 1995; Michaud et al. 2005). Furthermore, the
presence of the roots themselves also affects the porosity of the sediment (Palmer et al., 2000) but it is
unknown how this works in lake settings. Moreover, important inter-dependent interactions between physical
and biological processes are the presence of a canopy above the sediment (i.e. the leaves). For example,
physical colmation primarily happens in the littoral zone that supports large stands of submerged
Paper 2
3
macrophytes. Here, submerged plants attenuate the energy associated with waves and currents creating a
low energy environment that allows entrapment of finer sediments (Hilton, 1985; Blais & Kalff, 1995). The
intrusion of fine particles (≤63 µm) (Lehman, 1975; Hilton, 1985) reduces sediment porosity and may cause a
significant decrease in hydraulic conductivity. This is a well-known phenomenon in streams (Brunke &
Gonser, 1997; Huettel et. al., 1996; Huettel & Gust, 1992), but has not been examined thoroughly for lake
settings.
Lakes represent low energy environments compared to streams. However, over longer time scales
the physical and plant related processes in the littoral zones may act in the same way as in flowing streams
by stabilizing the near shore areas from corrosion by attenuating the energy from current and waves. In
areas of high plant abundance these processes may effectively decrease the porosity and permeability of the
lake bed covered with plants.
Groundwater discharging near the lake shore percolates the littoral sediments where it surpasses
the 10- to 15-cm thick rhizosphere before entering the lake. Rooted aquatic plants such as isoetids (Robe &
Griffiths, 1998; Andersen & Andersen, 2006; Pedersen et al., 1995; Sand-Jensen et al., 2005) as well as
other biota associated with the sediment-water interface (SWI) filter nutrients (Loeb & Hackley, 1988; Wetzel
1990; Hagerthy & Kerfot, 1998; Frandsen et al. 2012) and inorganic carbon (Sand-Jensen et al., 1982,
Madsen et al., 2002; Winkel & Borum, 2009) carried with the groundwater explaining why only a fraction of
the nutrients present in groundwater ever enters the lake (Ommen et al. 2012). Groundwater not surpassing
this littoral filter, but discharging at greater depth beyond the littoral zone, may enter the lake relatively
unfiltered compared to the discharge in the littoral zone.
The filtering capacity of the submerged macrophytes varies between species. Isoetids such as
Littorella uniflora have a very efficient root uptake as their roots often comprise up to 50% of the total plant
mass. In contrast the elodeids have very small roots compared to the shoots and lack the internal lacunae for
effective internal transport of nutrients. Accordingly, these species react differently to groundwater seepage.
This was demonstrated by Frandsen et al. (2012) who showed that the input of nutrients and inorganic
carbon with the groundwater seepage significantly affected the growth of the L. uniflora, whereas the elodeid
Myriophyllum alternifolium showed little to no response.
What also makes the isoetids more interesting when it comes to evaluating the interaction between
aquatic macrophytes, seepage, and nutrient conditions in lake beds is the community structure. Some
species of isoetids tend to form carpet-like turfs holding up to 9.000 macrophytes per m2 (Christensen &
Sørensen, 1986). With the large root systems of isoetids, this may effectively alter the hydraulic properties in
the root zone of the sediment.
The existence of a vegetation-induced lowering of the hydraulic conductivity in lake bed settings
have been suggested a couple of times in the literature. Karan et al. (2014) found evidence of lowered
hydraulic conductivity in the littoral zone, but based on a modelling approach. They identified an off-shore
discharge peak, after the near-shore vegetation cover, and could only explain this by including a lower-
permeable lake bed near the shore forcing the model to simulate groundwater to discharge further off-shore.
This, however, was only indirectly linked to the vegetation cover. Hargerthey & Kerfoot (1998) found a
several fold increase in discharge when installing custom-made seepage growth chambers consisting in the
Paper 2
4
lake bed. Similar observations were done by Frandsen et al. (2012) who found a several fold increase in
discharge after installing similar growth chambers. They speculate if the installation of the growth chambers
might have punctured a layer of low hydraulic conductivity.
The existence of a vegetation-induced lowering of the hydraulic conductivity is interesting in many
ways. First of all, it would lead to an increased discharge further away from the shore to off-shore areas with
no effective plant cover filtering the water. From a lake management point of view diverted groundwater
seepage could represent an undetected source of nutrients. Also, when modelling groundwater-lake
interactions, this could be an important factor. While some studies (e.g. Kidmose et al., 2011, 2013) have
included lower-permeability areas in the off-shore regions caused by the presence of sedimentary organic
material, it could be assumed that plant covers in the littoral zone could have an equally important effect.
In this study we examine the relationship between hydraulic conductivity and small-scale
sedimentary conditions caused by the presence of vegetation by comparing results from both a vegetated
and a non-vegetated area of a lake bed in a groundwater-fed lake. We hypothesize that the hydraulic
conductivity is affected by the vegetation, leading to a reduced hydraulic conductivity in area with dense
plant cover. We further hypothesize that this is an effect of colmation of fine particles in the vegetated
sediment.
Materials and methods
Study site
Lake Hampen (surface area 76 ha; maximum depth 13 m; mean depth 4 m) is a Northern temperate lake,
located in the western part of Denmark just east of the last glacial advance (Figure 1A).
The lake is situated in a 15-25 m deep layer of coarse melt water sands and gravel. The lake is
characterized as a flow-through lake, with the groundwater flowing in a North-East, East and South-East to
West direction. Approximately 2/3 of the water is received from groundwater discharge and 3/4 of the water
leaves the lake through groundwater recharge at the western shore line. There are no major in- or outlets.
Precipitation and evaporation account for the remaining in and out fluxes (Ommen et al., 2012; Kidmose et
al. 2011). Lake Hampen is an oligo- to mesotrophic softwater lake with an annual mean alkalinity of 0.15
mM. The mean summer concentrations of total Phosphorous (TP), total Nitrogen (TN) and planktonic
chlorophylla are 0.05, 0.16, and 0.005 mg L-1
, respectively (mean summer values 1971 to 1999, Moeslund,
2000). The lake catchment (993 ha) is primarily covered with forest (62%) and agricultural land (30%). The
agricultural land is located near the North-Eastern shoreline, near the main discharge area which is the main
focal point of the present study (Figure 1B).
To test the hypothesis that rooted submerged vegetation could affect the hydraulic properties of
lake beds, we performed an in situ comparative study between two areas established on the North-Eastern
shoreline; one with a dense plant cover of Littorella uniflora (vegetated area) and one without vegetation
(non-vegetated area) (Figure 1B). The vegetated area was right next to the farmland and the non-vegetated
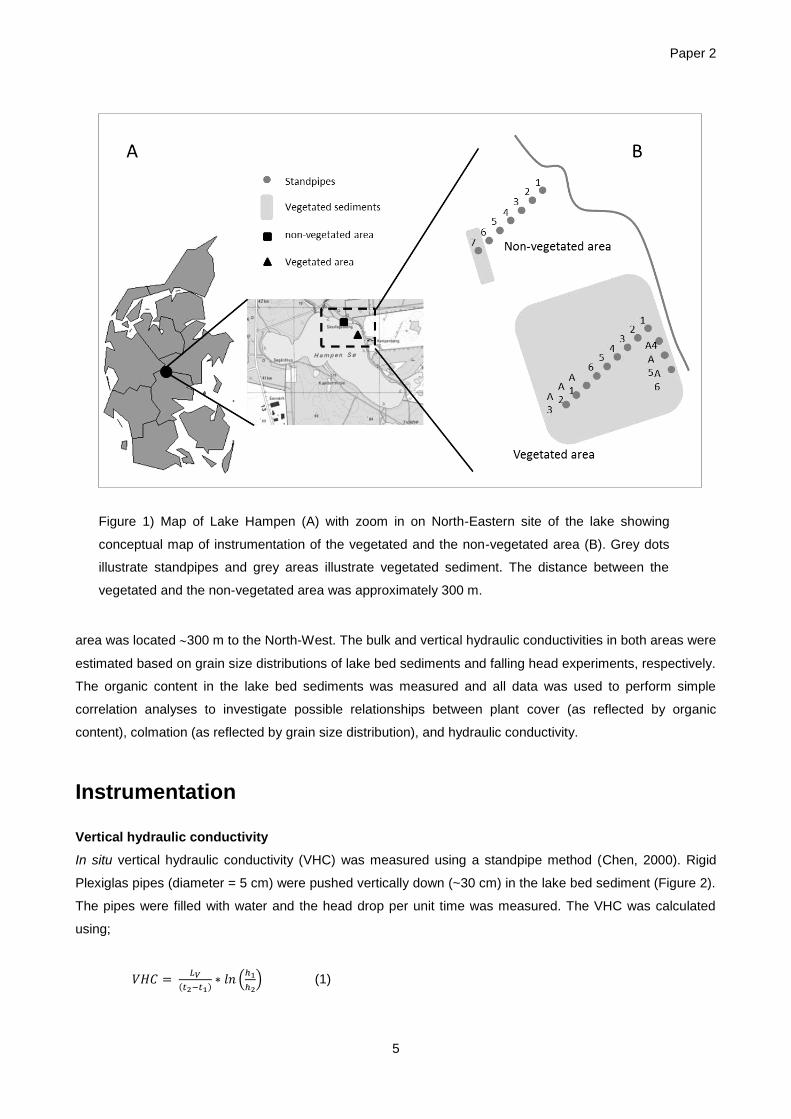
Paper 2
5
area was located 300 m to the North-West. The bulk and vertical hydraulic conductivities in both areas were
estimated based on grain size distributions of lake bed sediments and falling head experiments, respectively.
The organic content in the lake bed sediments was measured and all data was used to perform simple
correlation analyses to investigate possible relationships between plant cover (as reflected by organic
content), colmation (as reflected by grain size distribution), and hydraulic conductivity.
Instrumentation
Vertical hydraulic conductivity
In situ vertical hydraulic conductivity (VHC) was measured using a standpipe method (Chen, 2000). Rigid
Plexiglas pipes (diameter = 5 cm) were pushed vertically down (~30 cm) in the lake bed sediment (Figure 2).
The pipes were filled with water and the head drop per unit time was measured. The VHC was calculated
using;
( ) (
) (1)
Figure 1) Map of Lake Hampen (A) with zoom in on North-Eastern site of the lake showing
conceptual map of instrumentation of the vegetated and the non-vegetated area (B). Grey dots
illustrate standpipes and grey areas illustrate vegetated sediment. The distance between the
vegetated and the non-vegetated area was approximately 300 m.
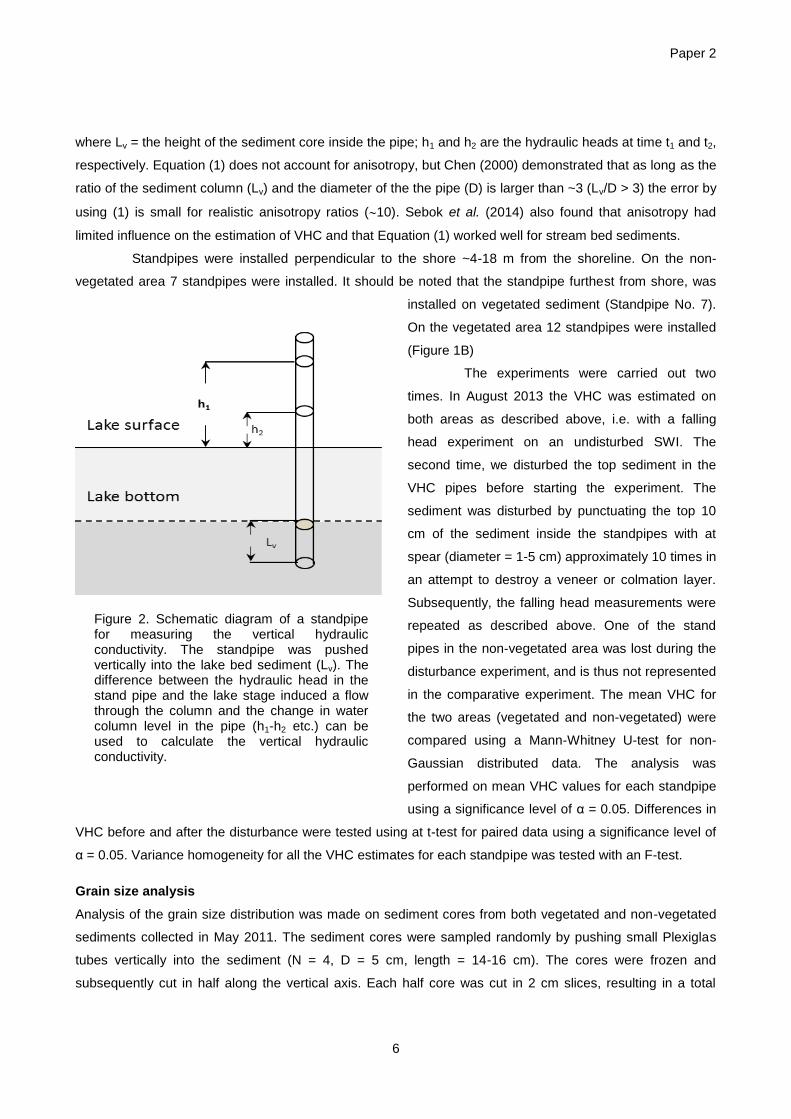
Paper 2
6
where Lv = the height of the sediment core inside the pipe; h1 and h2 are the hydraulic heads at time t1 and t2,
respectively. Equation (1) does not account for anisotropy, but Chen (2000) demonstrated that as long as the
ratio of the sediment column (Lv) and the diameter of the the pipe (D) is larger than ~3 (Lv/D > 3) the error by
using (1) is small for realistic anisotropy ratios (10). Sebok et al. (2014) also found that anisotropy had
limited influence on the estimation of VHC and that Equation (1) worked well for stream bed sediments.
Standpipes were installed perpendicular to the shore ~4-18 m from the shoreline. On the non-
vegetated area 7 standpipes were installed. It should be noted that the standpipe furthest from shore, was
installed on vegetated sediment (Standpipe No. 7).
On the vegetated area 12 standpipes were installed
(Figure 1B)
The experiments were carried out two
times. In August 2013 the VHC was estimated on
both areas as described above, i.e. with a falling
head experiment on an undisturbed SWI. The
second time, we disturbed the top sediment in the
VHC pipes before starting the experiment. The
sediment was disturbed by punctuating the top 10
cm of the sediment inside the standpipes with at
spear (diameter = 1-5 cm) approximately 10 times in
an attempt to destroy a veneer or colmation layer.
Subsequently, the falling head measurements were
repeated as described above. One of the stand
pipes in the non-vegetated area was lost during the
disturbance experiment, and is thus not represented
in the comparative experiment. The mean VHC for
the two areas (vegetated and non-vegetated) were
compared using a Mann-Whitney U-test for non-
Gaussian distributed data. The analysis was
performed on mean VHC values for each standpipe
using a significance level of α = 0.05. Differences in
VHC before and after the disturbance were tested using at t-test for paired data using a significance level of
α = 0.05. Variance homogeneity for all the VHC estimates for each standpipe was tested with an F-test.
Grain size analysis
Analysis of the grain size distribution was made on sediment cores from both vegetated and non-vegetated
sediments collected in May 2011. The sediment cores were sampled randomly by pushing small Plexiglas
tubes vertically into the sediment (N = 4, D = 5 cm, length = 14-16 cm). The cores were frozen and
subsequently cut in half along the vertical axis. Each half core was cut in 2 cm slices, resulting in a total
Figure 2. Schematic diagram of a standpipe for measuring the vertical hydraulic conductivity. The standpipe was pushed vertically into the lake bed sediment (Lv). The difference between the hydraulic head in the stand pipe and the lake stage induced a flow through the column and the change in water column level in the pipe (h1-h2 etc.) can be used to calculate the vertical hydraulic conductivity.
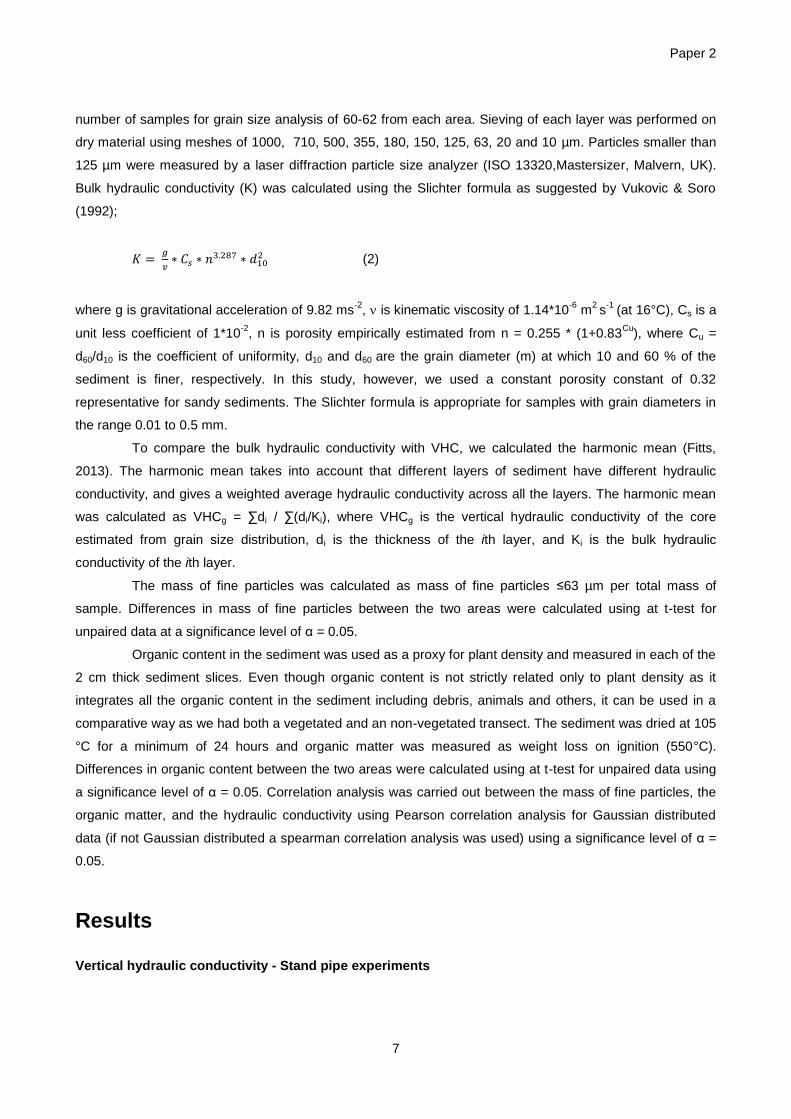
Paper 2
7
number of samples for grain size analysis of 60-62 from each area. Sieving of each layer was performed on
dry material using meshes of 1000, 710, 500, 355, 180, 150, 125, 63, 20 and 10 µm. Particles smaller than
125 µm were measured by a laser diffraction particle size analyzer (ISO 13320,Mastersizer, Malvern, UK).
Bulk hydraulic conductivity (K) was calculated using the Slichter formula as suggested by Vukovic & Soro
(1992);
(2)
where g is gravitational acceleration of 9.82 ms-2
, is kinematic viscosity of 1.14*10-6
m2 s
-1 (at 16°C), Cs is a
unit less coefficient of 1*10-2
, n is porosity empirically estimated from n = 0.255 * (1+0.83Cu
), where Cu =
d60/d10 is the coefficient of uniformity, d10 and d60 are the grain diameter (m) at which 10 and 60 % of the
sediment is finer, respectively. In this study, however, we used a constant porosity constant of 0.32
representative for sandy sediments. The Slichter formula is appropriate for samples with grain diameters in
the range 0.01 to 0.5 mm.
To compare the bulk hydraulic conductivity with VHC, we calculated the harmonic mean (Fitts,
2013). The harmonic mean takes into account that different layers of sediment have different hydraulic
conductivity, and gives a weighted average hydraulic conductivity across all the layers. The harmonic mean
was calculated as VHCg = ∑di / ∑(di/Ki), where VHCg is the vertical hydraulic conductivity of the core
estimated from grain size distribution, di is the thickness of the ith layer, and Ki is the bulk hydraulic
conductivity of the ith layer.
The mass of fine particles was calculated as mass of fine particles ≤63 µm per total mass of
sample. Differences in mass of fine particles between the two areas were calculated using at t-test for
unpaired data at a significance level of α = 0.05.
Organic content in the sediment was used as a proxy for plant density and measured in each of the
2 cm thick sediment slices. Even though organic content is not strictly related only to plant density as it
integrates all the organic content in the sediment including debris, animals and others, it can be used in a
comparative way as we had both a vegetated and an non-vegetated transect. The sediment was dried at 105
°C for a minimum of 24 hours and organic matter was measured as weight loss on ignition (550°C).
Differences in organic content between the two areas were calculated using at t-test for unpaired data using
a significance level of α = 0.05. Correlation analysis was carried out between the mass of fine particles, the
organic matter, and the hydraulic conductivity using Pearson correlation analysis for Gaussian distributed
data (if not Gaussian distributed a spearman correlation analysis was used) using a significance level of α =
0.05.
Results
Vertical hydraulic conductivity - Stand pipe experiments
Paper 2
8
There were significant differences in VHC between the two areas in the first set of experiments (no
disturbance). The VHC on the vegetated area was significantly lower compared to the non-vegetated area (P
< 0.05) (Figure 3). The mean VHC of the non-vegetated area (5.4 md-1
, N= 7) is almost four times higher
compared to the vegetated area (1.0 m d-1
, N= 12).
When comparing the overall average (all standpipes within an area) before and after the
disturbance experiment, no significant differences were found on either of the areas (P > 0.05). However, by
inspecting the VHC before and after the disturbance in the individual stand pipes, the reason for this is clear.
On the vegetated area, the VHC was significantly higher after disturbance compared to before disturbance in
9 of the 12 standpipes, whereas the remaining 3 standpipes exhibited the opposite behaviour (Figure 4). In 4
of these 9 stand pipes (a1, a2 , a5 ,a7) the VHC was not detectable in the experiment before disturbance.
After disturbance, VHC in these four standpipes was measured to approximately 1.8, 0.9, 0.8, 0.9 m d-1
,
respectively, which is close to the overall average VHC after disturbance of 1.1 m d-1
. On the non-vegetated
sediment, the differences in VHC before and after the disturbance were only significant in 2 of the 7
standpipes (P < 0.05) (standpipe 1 and 6, Figure 5). Here, VHC increased from 2.9 to 3.9 m d-1
(standpipe 1)
and from 1.5 to 3.1 m d-1
(standpipe 6).
Bulk hydraulic conductivity and organic matter
There were significant differences in the distribution of bulk hydraulic conductivity (based on grain-size
distribution) between the two areas (P < 0.05). The hydraulic conductivity was more than 5-fold higher in the
non-vegetated areas (mean ± sd = 8.8 ± 1.7 m d-1
, number of cores N = 4, number of samples n = 62)
compared to the vegetated sediment (mean = 1.6 ± 1.0 m d-1
; N= 4, n = 62) (Figure 6). On the vegetated
area the hydraulic conductivity decreased from 4 to
8 cm depth, followed again by an increase below
this point. The lowest hydraulic conductivity was
found at depths 6 to 8 cm ( 0.5 m d-1
). The highest
hydraulic conductivity ( 4 m d-1
) was at 14 cm depth
(Figure 7). The above pattern was not seen on the
non-vegetated area. Here, the hydraulic conductivity
decreased from 12 m d-1
to 6 m d-1
from the top of
the sediment and down to 8 cm depth. Below 8 cm
depth, the hydraulic conductivity was nearly
constant (Figure 7).
There were significant differences between
the mass of fine particles in the sediments of the two
areas (P < 0.05, Figure 8), and two different
distributions patterns occurred with depth on the two
areas (Figure 9). On the vegetated area, the mass
of fine particles followed an increasing pattern from
the top of the sediment and down to 8 cm. This was
Figure 3. Box-whiskers plot showing the difference in vertical hydraulic conductivity (VHC) on the vegetated area and the non-vegetated area. The plot shows median (horizontal line), upper and lower quartiles (boundary of the box) and the whiskers show minimum and maximum values. The difference in vertical hydraulic conductivity between the two areas was significant (P < 0.001; Mann Whitney test).
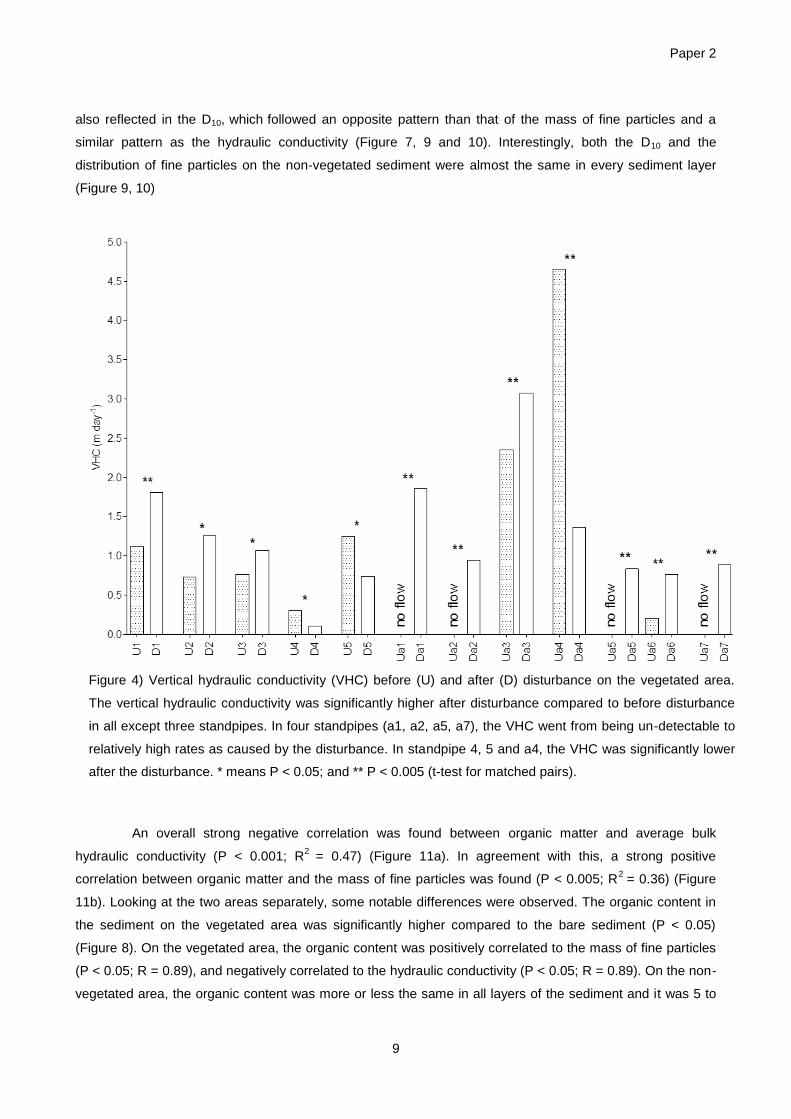
Paper 2
9
also reflected in the D10, which followed an opposite pattern than that of the mass of fine particles and a
similar pattern as the hydraulic conductivity (Figure 7, 9 and 10). Interestingly, both the D10 and the
distribution of fine particles on the non-vegetated sediment were almost the same in every sediment layer
(Figure 9, 10)
An overall strong negative correlation was found between organic matter and average bulk
hydraulic conductivity (P < 0.001; R2
= 0.47) (Figure 11a). In agreement with this, a strong positive
correlation between organic matter and the mass of fine particles was found (P < 0.005; R2
= 0.36) (Figure
11b). Looking at the two areas separately, some notable differences were observed. The organic content in
the sediment on the vegetated area was significantly higher compared to the bare sediment (P < 0.05)
(Figure 8). On the vegetated area, the organic content was positively correlated to the mass of fine particles
(P < 0.05; R = 0.89), and negatively correlated to the hydraulic conductivity (P < 0.05; R = 0.89). On the non-
vegetated area, the organic content was more or less the same in all layers of the sediment and it was 5 to
Figure 4) Vertical hydraulic conductivity (VHC) before (U) and after (D) disturbance on the vegetated area.
The vertical hydraulic conductivity was significantly higher after disturbance compared to before disturbance
in all except three standpipes. In four standpipes (a1, a2, a5, a7), the VHC went from being un-detectable to
relatively high rates as caused by the disturbance. In standpipe 4, 5 and a4, the VHC was significantly lower
after the disturbance. * means P < 0.05; and ** P < 0.005 (t-test for matched pairs).
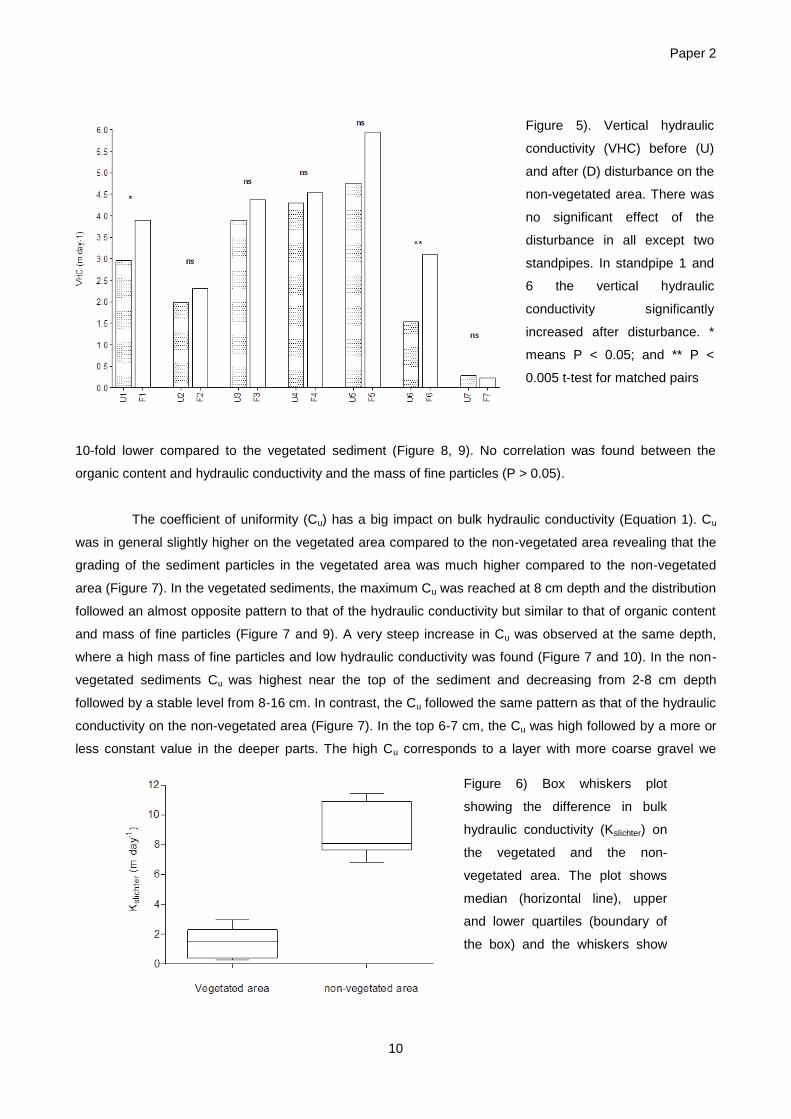
Paper 2
10
10-fold lower compared to the vegetated sediment (Figure 8, 9). No correlation was found between the
organic content and hydraulic conductivity and the mass of fine particles (P > 0.05).
The coefficient of uniformity (Cu) has a big impact on bulk hydraulic conductivity (Equation 1). Cu
was in general slightly higher on the vegetated area compared to the non-vegetated area revealing that the
grading of the sediment particles in the vegetated area was much higher compared to the non-vegetated
area (Figure 7). In the vegetated sediments, the maximum Cu was reached at 8 cm depth and the distribution
followed an almost opposite pattern to that of the hydraulic conductivity but similar to that of organic content
and mass of fine particles (Figure 7 and 9). A very steep increase in Cu was observed at the same depth,
where a high mass of fine particles and low hydraulic conductivity was found (Figure 7 and 10). In the non-
vegetated sediments Cu was highest near the top of the sediment and decreasing from 2-8 cm depth
followed by a stable level from 8-16 cm. In contrast, the Cu followed the same pattern as that of the hydraulic
conductivity on the non-vegetated area (Figure 7). In the top 6-7 cm, the Cu was high followed by a more or
less constant value in the deeper parts. The high Cu corresponds to a layer with more coarse gravel we
Figure 5). Vertical hydraulic
conductivity (VHC) before (U)
and after (D) disturbance on the
non-vegetated area. There was
no significant effect of the
disturbance in all except two
standpipes. In standpipe 1 and
6 the vertical hydraulic
conductivity significantly
increased after disturbance. *
means P < 0.05; and ** P <
0.005 t-test for matched pairs
Figure 6) Box whiskers plot
showing the difference in bulk
hydraulic conductivity (Kslichter) on
the vegetated and the non-
vegetated area. The plot shows
median (horizontal line), upper
and lower quartiles (boundary of
the box) and the whiskers show
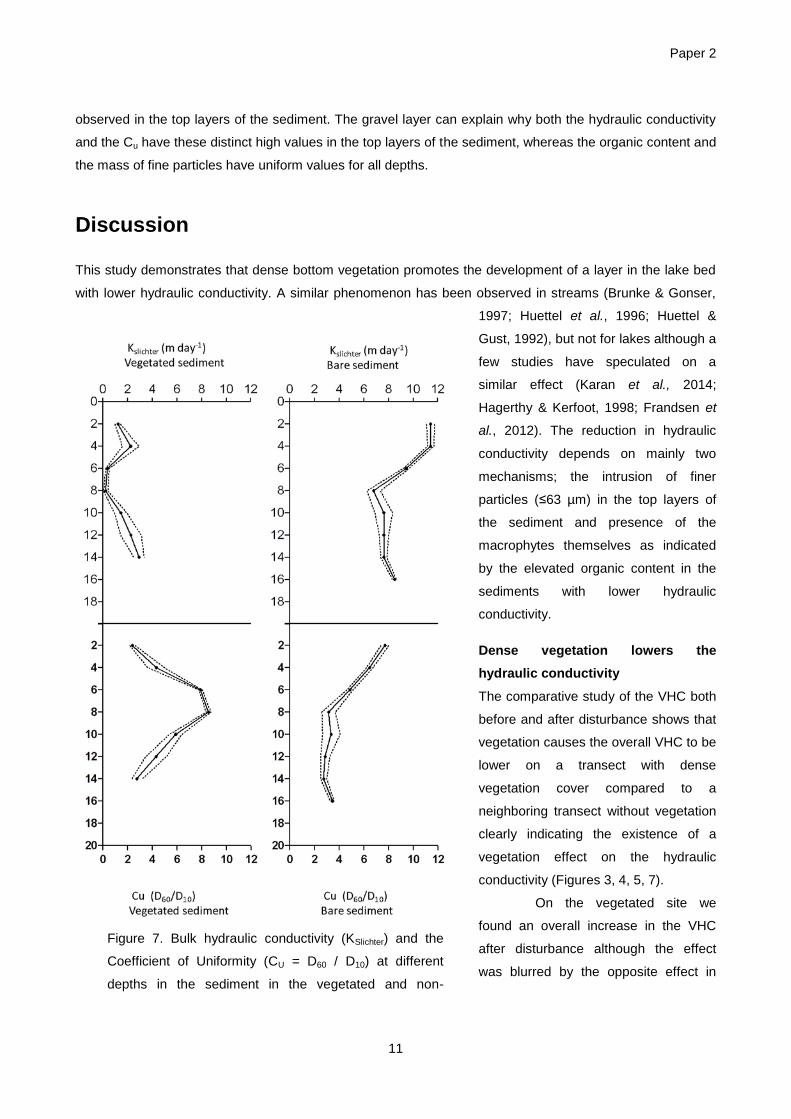
Paper 2
11
observed in the top layers of the sediment. The gravel layer can explain why both the hydraulic conductivity
and the Cu have these distinct high values in the top layers of the sediment, whereas the organic content and
the mass of fine particles have uniform values for all depths.
Discussion
This study demonstrates that dense bottom vegetation promotes the development of a layer in the lake bed
with lower hydraulic conductivity. A similar phenomenon has been observed in streams (Brunke & Gonser,
1997; Huettel et al., 1996; Huettel &
Gust, 1992), but not for lakes although a
few studies have speculated on a
similar effect (Karan et al., 2014;
Hagerthy & Kerfoot, 1998; Frandsen et
al., 2012). The reduction in hydraulic
conductivity depends on mainly two
mechanisms; the intrusion of finer
particles (≤63 µm) in the top layers of
the sediment and presence of the
macrophytes themselves as indicated
by the elevated organic content in the
sediments with lower hydraulic
conductivity.
Dense vegetation lowers the
hydraulic conductivity
The comparative study of the VHC both
before and after disturbance shows that
vegetation causes the overall VHC to be
lower on a transect with dense
vegetation cover compared to a
neighboring transect without vegetation
clearly indicating the existence of a
vegetation effect on the hydraulic
conductivity (Figures 3, 4, 5, 7).
On the vegetated site we
found an overall increase in the VHC
after disturbance although the effect
was blurred by the opposite effect in
Figure 7. Bulk hydraulic conductivity (KSlichter) and the
Coefficient of Uniformity (CU = D60 / D10) at different
depths in the sediment in the vegetated and non-
vegetated area. Graphs show mean (solid line) ± SE
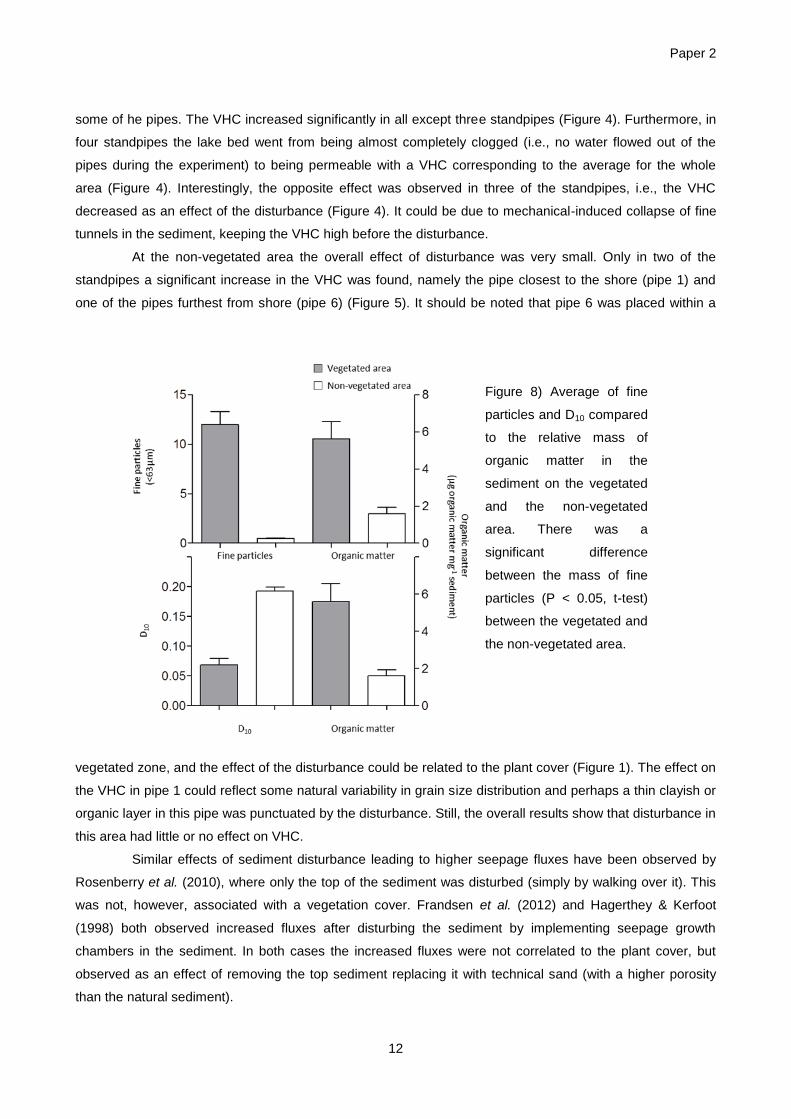
Paper 2
12
some of he pipes. The VHC increased significantly in all except three standpipes (Figure 4). Furthermore, in
four standpipes the lake bed went from being almost completely clogged (i.e., no water flowed out of the
pipes during the experiment) to being permeable with a VHC corresponding to the average for the whole
area (Figure 4). Interestingly, the opposite effect was observed in three of the standpipes, i.e., the VHC
decreased as an effect of the disturbance (Figure 4). It could be due to mechanical-induced collapse of fine
tunnels in the sediment, keeping the VHC high before the disturbance.
At the non-vegetated area the overall effect of disturbance was very small. Only in two of the
standpipes a significant increase in the VHC was found, namely the pipe closest to the shore (pipe 1) and
one of the pipes furthest from shore (pipe 6) (Figure 5). It should be noted that pipe 6 was placed within a
vegetated zone, and the effect of the disturbance could be related to the plant cover (Figure 1). The effect on
the VHC in pipe 1 could reflect some natural variability in grain size distribution and perhaps a thin clayish or
organic layer in this pipe was punctuated by the disturbance. Still, the overall results show that disturbance in
this area had little or no effect on VHC.
Similar effects of sediment disturbance leading to higher seepage fluxes have been observed by
Rosenberry et al. (2010), where only the top of the sediment was disturbed (simply by walking over it). This
was not, however, associated with a vegetation cover. Frandsen et al. (2012) and Hagerthey & Kerfoot
(1998) both observed increased fluxes after disturbing the sediment by implementing seepage growth
chambers in the sediment. In both cases the increased fluxes were not correlated to the plant cover, but
observed as an effect of removing the top sediment replacing it with technical sand (with a higher porosity
than the natural sediment).
Figure 8) Average of fine
particles and D10 compared
to the relative mass of
organic matter in the
sediment on the vegetated
and the non-vegetated
area. There was a
significant difference
between the mass of fine
particles (P < 0.05, t-test)
between the vegetated and
the non-vegetated area.
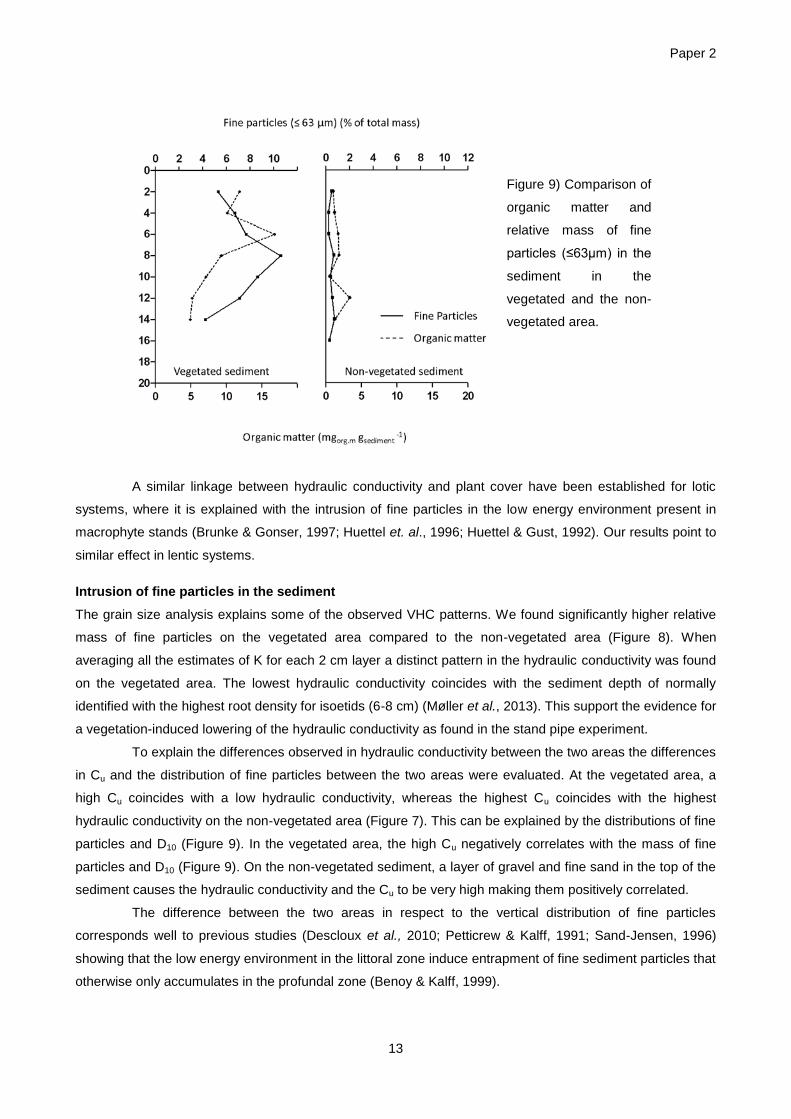
Paper 2
13
A similar linkage between hydraulic conductivity and plant cover have been established for lotic
systems, where it is explained with the intrusion of fine particles in the low energy environment present in
macrophyte stands (Brunke & Gonser, 1997; Huettel et. al., 1996; Huettel & Gust, 1992). Our results point to
similar effect in lentic systems.
Intrusion of fine particles in the sediment
The grain size analysis explains some of the observed VHC patterns. We found significantly higher relative
mass of fine particles on the vegetated area compared to the non-vegetated area (Figure 8). When
averaging all the estimates of K for each 2 cm layer a distinct pattern in the hydraulic conductivity was found
on the vegetated area. The lowest hydraulic conductivity coincides with the sediment depth of normally
identified with the highest root density for isoetids (6-8 cm) (Møller et al., 2013). This support the evidence for
a vegetation-induced lowering of the hydraulic conductivity as found in the stand pipe experiment.
To explain the differences observed in hydraulic conductivity between the two areas the differences
in Cu and the distribution of fine particles between the two areas were evaluated. At the vegetated area, a
high Cu coincides with a low hydraulic conductivity, whereas the highest Cu coincides with the highest
hydraulic conductivity on the non-vegetated area (Figure 7). This can be explained by the distributions of fine
particles and D10 (Figure 9). In the vegetated area, the high Cu negatively correlates with the mass of fine
particles and D10 (Figure 9). On the non-vegetated sediment, a layer of gravel and fine sand in the top of the
sediment causes the hydraulic conductivity and the Cu to be very high making them positively correlated.
The difference between the two areas in respect to the vertical distribution of fine particles
corresponds well to previous studies (Descloux et al., 2010; Petticrew & Kalff, 1991; Sand-Jensen, 1996)
showing that the low energy environment in the littoral zone induce entrapment of fine sediment particles that
otherwise only accumulates in the profundal zone (Benoy & Kalff, 1999).
Figure 9) Comparison of
organic matter and
relative mass of fine
particles (≤63µm) in the
sediment in the
vegetated and the non-
vegetated area.
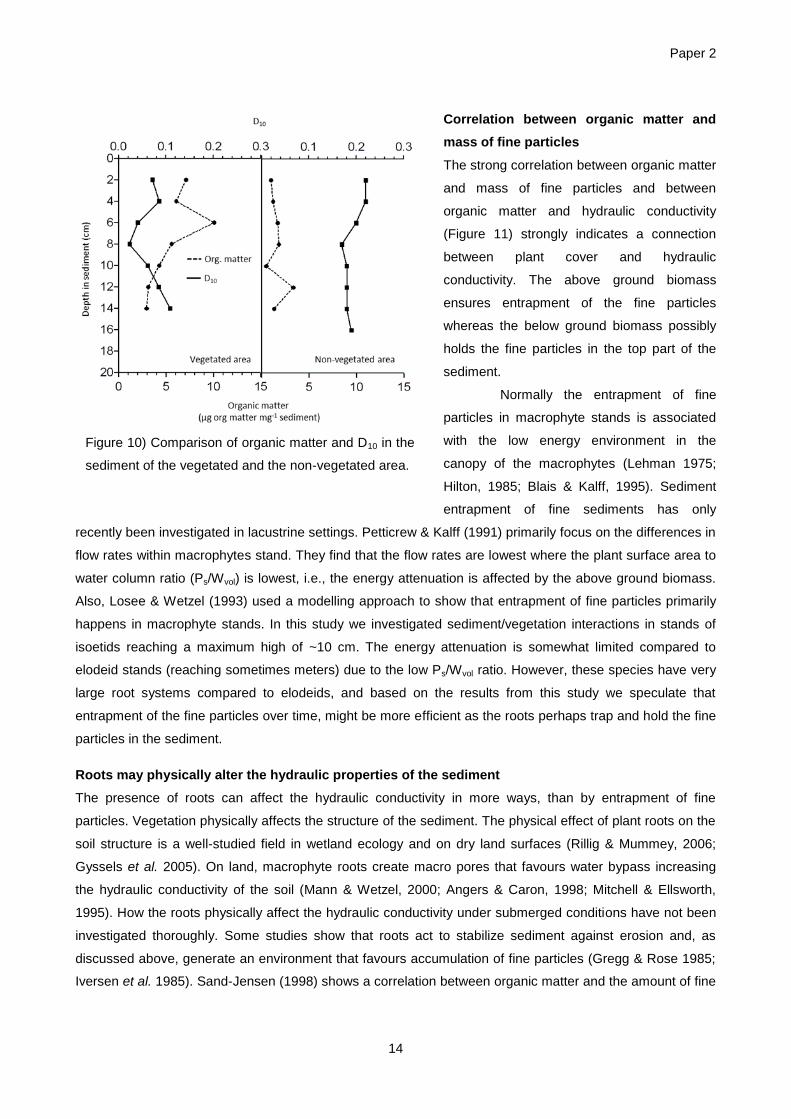
Paper 2
14
Correlation between organic matter and
mass of fine particles
The strong correlation between organic matter
and mass of fine particles and between
organic matter and hydraulic conductivity
(Figure 11) strongly indicates a connection
between plant cover and hydraulic
conductivity. The above ground biomass
ensures entrapment of the fine particles
whereas the below ground biomass possibly
holds the fine particles in the top part of the
sediment.
Normally the entrapment of fine
particles in macrophyte stands is associated
with the low energy environment in the
canopy of the macrophytes (Lehman 1975;
Hilton, 1985; Blais & Kalff, 1995). Sediment
entrapment of fine sediments has only
recently been investigated in lacustrine settings. Petticrew & Kalff (1991) primarily focus on the differences in
flow rates within macrophytes stand. They find that the flow rates are lowest where the plant surface area to
water column ratio (Ps/Wvol) is lowest, i.e., the energy attenuation is affected by the above ground biomass.
Also, Losee & Wetzel (1993) used a modelling approach to show that entrapment of fine particles primarily
happens in macrophyte stands. In this study we investigated sediment/vegetation interactions in stands of
isoetids reaching a maximum high of ~10 cm. The energy attenuation is somewhat limited compared to
elodeid stands (reaching sometimes meters) due to the low Ps/Wvol ratio. However, these species have very
large root systems compared to elodeids, and based on the results from this study we speculate that
entrapment of the fine particles over time, might be more efficient as the roots perhaps trap and hold the fine
particles in the sediment.
Roots may physically alter the hydraulic properties of the sediment
The presence of roots can affect the hydraulic conductivity in more ways, than by entrapment of fine
particles. Vegetation physically affects the structure of the sediment. The physical effect of plant roots on the
soil structure is a well-studied field in wetland ecology and on dry land surfaces (Rillig & Mummey, 2006;
Gyssels et al. 2005). On land, macrophyte roots create macro pores that favours water bypass increasing
the hydraulic conductivity of the soil (Mann & Wetzel, 2000; Angers & Caron, 1998; Mitchell & Ellsworth,
1995). How the roots physically affect the hydraulic conductivity under submerged conditions have not been
investigated thoroughly. Some studies show that roots act to stabilize sediment against erosion and, as
discussed above, generate an environment that favours accumulation of fine particles (Gregg & Rose 1985;
Iversen et al. 1985). Sand-Jensen (1998) shows a correlation between organic matter and the amount of fine
Figure 10) Comparison of organic matter and D10 in the
sediment of the vegetated and the non-vegetated area.
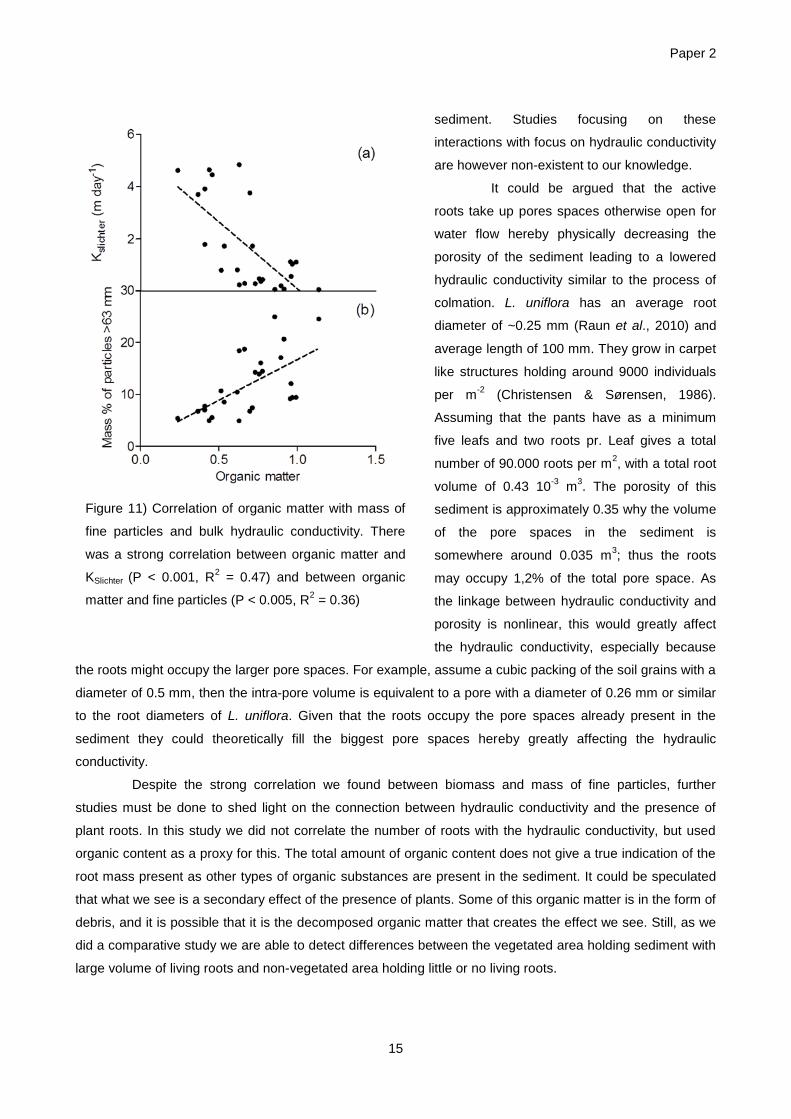
Paper 2
15
sediment. Studies focusing on these
interactions with focus on hydraulic conductivity
are however non-existent to our knowledge.
It could be argued that the active
roots take up pores spaces otherwise open for
water flow hereby physically decreasing the
porosity of the sediment leading to a lowered
hydraulic conductivity similar to the process of
colmation. L. uniflora has an average root
diameter of ~0.25 mm (Raun et al., 2010) and
average length of 100 mm. They grow in carpet
like structures holding around 9000 individuals
per m-2
(Christensen & Sørensen, 1986).
Assuming that the pants have as a minimum
five leafs and two roots pr. Leaf gives a total
number of 90.000 roots per m2, with a total root
volume of 0.43 10-3
m3. The porosity of this
sediment is approximately 0.35 why the volume
of the pore spaces in the sediment is
somewhere around 0.035 m3; thus the roots
may occupy 1,2% of the total pore space. As
the linkage between hydraulic conductivity and
porosity is nonlinear, this would greatly affect
the hydraulic conductivity, especially because
the roots might occupy the larger pore spaces. For example, assume a cubic packing of the soil grains with a
diameter of 0.5 mm, then the intra-pore volume is equivalent to a pore with a diameter of 0.26 mm or similar
to the root diameters of L. uniflora. Given that the roots occupy the pore spaces already present in the
sediment they could theoretically fill the biggest pore spaces hereby greatly affecting the hydraulic
conductivity.
Despite the strong correlation we found between biomass and mass of fine particles, further
studies must be done to shed light on the connection between hydraulic conductivity and the presence of
plant roots. In this study we did not correlate the number of roots with the hydraulic conductivity, but used
organic content as a proxy for this. The total amount of organic content does not give a true indication of the
root mass present as other types of organic substances are present in the sediment. It could be speculated
that what we see is a secondary effect of the presence of plants. Some of this organic matter is in the form of
debris, and it is possible that it is the decomposed organic matter that creates the effect we see. Still, as we
did a comparative study we are able to detect differences between the vegetated area holding sediment with
large volume of living roots and non-vegetated area holding little or no living roots.
Figure 11) Correlation of organic matter with mass of
fine particles and bulk hydraulic conductivity. There
was a strong correlation between organic matter and
KSlichter (P < 0.001, R2 = 0.47) and between organic
matter and fine particles (P < 0.005, R2 = 0.36)
Paper 2
16
We used two methods to examine the hydraulic conductivity, namely standpipe experiments giving
the in situ vertical hydraulic conductivity (VHC) and grain size analysis giving the bulk hydraulic conductivity
of a disturbed sample (Kslichter). The VHC estimations are lower compared to the Kslichter on both the vegetated
and the non-vegetated area. This is in agreement with Song et al. (2009) who explain the differences by
especially the disturbance of the samples used for grain-size analysis. By doing so the vertical anisotropy is
somewhat removed. Under in situ conditions the sediment will have interbedded layers of coarse and fine
grained layers. The normal sedimentary structure of streambed sediment will have a higher horizontal
hydraulic conductivity than a vertical hydraulic conductivity. This is probably part of the reason for some of
the observed differences between VHS and K observed in this study.
Landon (2001) found that hydraulic conductivity estimated from empirical grain size formulas are
generally lower than those determined from field scale hydraulic tests. This is attributed to differences in
spatial scale in thecompared In situ tests. Landon (2001) further suggest that the hydraulic conductivity
calculated using the grain size distribution may be smaller because K is a complex function of packing,
sediment structure, heterogeneity and other factors not accounted for in the empirical grain size method
(Tayler et al. 1990, Landon et al. 2001). Song et al. (2009) suggest that the Landon findings are due to the
different depth used to measure vertical and bulk hydraulic conductivity respectively. I.e., Landon measured
vertical hydraulic conductivity in deeper sediments than the sediment used to conduct gran-size analysis. In
the same study they found a decreasing vertical hydraulic conductivity with depth using slug test. Song et al.
(2009) also points to the use of the empirical coefficient in the Hazen formula as part of a possible
explanation
Another explanation is given by Sebok et al. 2014 who also suggest that even small amount of
organic matter in the sediment can skew the in situ measurements of hydraulic conductivity compared to bulk
measurements where the organic content is not taken into account. This is in good agreement with our
study. Furthermore using equation (1) a small underestimation of VHC is likely as described by Chen (2000).
Comparing our results to other studies conducted at Lake Hampen there are some differences.
Karan et al. (2014) found the horizontal hydraulic conductivity (Kh) in the aquifer near the vegetated area
using slug tests and grain size analysis. They estimated the Kh to 30 m day-1
and calibrated an anisotropy of
50 in order to fit the observed discharge distribution at the same site as the vegetated area examined in this
study. The calibrated vertical hydraulic conductivity of the aquifer sediments therefore equals 0.6 m day-1
.
The vertical hydraulic conductivity in the aquifer is similar although a factor of about 2-3 lower than the VHC
we estimated for the vegetated area (undisturbed). To compare this with the hydraulic conductivity based on
grain size, the harmonic mean is calculated (Fitts, 2013). The harmonic mean gives a vertical hydraulic
conductivity VHCg = 1.0 m day-1
at the vegetated area. This value is similar to that used in the modelling
study of Karan et al. (2014). However, to better match simulated and observed discharge Karan et al. (2014)
also tested the inclusion of a top 15-cm-thick plant zone with a much lower horizontal hydraulic conductivity
of 0.025 m/d in the first 22 m of the littoral zone. The anisotropy of this zone was also given as 50 implying
that the vertical hydraulic conductivity is as low as 0.0005 m/day. This is much lower than what we measure
using the stand pipes or grain size. This could be caused by several things. First of all, the study by Karan et
al. (2014) is a modelling-based study and as they argue they were not able to find a unique parameter set.
Paper 2
17
For example, they show that the vertical hydraulic conductivity of the plant zone may be as high as 0.025
m/day and still match observations satisfactorily. However, this is still much lower than what we measure.
Secondly, the lake bed in Lake Hampen is very heterogeneous, why a single stand pipe represent perhaps
numerous different layers with different hydraulic conductivity and it is possible that with the 12 stand pipes in
the vegetated area do not capture the true variability in hydraulic conductivity of the vegetated zone. Here it
is worth noting that actually 30% of the stand pipes allowed no flow to begin with (Figure 4). This is a rather
large proportion of the lake bed. Installation of the standpipes can generate boundary effects along the sides
of the standpipe, for example in the form of small rubbles generating preferential flow paths near the walls of
the pipe. When pushing the standpipe down through the sediment, the sediment is perhaps compressed in
other areas. These things would for the most part lead to artificial high fluxes within the standpipes. However,
as we used the same method at both areas and mainly look at the relative differences between the two
transect, this should not affect the overall results when comparing a vegetated and a non-vegetated area.
This can cause problems when comparing the relative magnitude with those obtained by other methods.
It seems likely, that the carpet like structures of L. uniflora plays a complex role in the lake ecology.
In this study we find evidence that dense carpet structures of L. uniflora affects the groundwater seepage
discharge by lowering the hydraulic conductivity in the top layer of the sediment hereby diverting the
subsurface groundwater flow to discharge further off shore where the vegetation is sparse. As we have
shown previously groundwater seepage discharge positively affect vegetation growth (Frandsen et al., 2012).
The vegetation represent a filtering layer of the incoming groundwater, why a diverted flow leading to
discharge of water in non-vegetated zones, could impact the surface water ecology as well. Finally, at Lake
Hampen the groundwater discharge zone coincides with a nearby agricultural farmland and large amount of
nitrate enters the lake through the groundwater (Ommen et al., 2012). This groundwater contains nitrate
concentration reaching 150mg L-1
. If the groundwater enters the lake beyond the vegetated zone this could
enter the lake relatively unfiltered. It could be an interesting study to examine how important the vegetation of
isoetids are for protecting lakes like Lake Hampen from nutrient enrichment through groundwater discharge.
Acknowledgement
We would like to give a special thanks to Jens Bisgaard (GEUS) for creative and technical
assistance. A warm thank to Mikkel René Andersen for valuable help in the field. We acknowledge the kind
support of the Centre for Lake Restoration, a Villum Kann Rasmussen Centre of Excellence and the
scholarship to Mette Frandsen from the Danish Research council for independent research.
References
Andersen, T., Andersen, F. Ø. 2006. Effects of CO2 concentration on growth of filamentous algae and
Littorella uniflora in a Danish softwater lake. Aquatic Botany. 84(3): 267-271
Paper 2
18
Angers, D. A., Caron. 1998. Plant induced changes in soil structure: Processes and feedbacks. Development
in Biogeochemistry. 4: 55-72
Benoy, G. A., Kalff, J. 1999. Sediment accumulation and Pb burdens in submerged macrophyte beds.
Limnology and Oceanography. 44/4: 1081-1090
Blais, J. M., Kalff, J. 1995. The influence of lake morphometry on sediment focusing patterns. Limnology and
Oceanography. 40: 582-588
Bouwer, H. 2002. Artificial recharge of groundwater – hydrogeology and engineering. Hydrogeology Journal.
10: 121 – 142
Brunke, M. 1999. Colmation and depth filtration within streambeds: retention of particles in hyporheic
interstices. International Review of hydrobiology. Hydrobiology. 84: 99-117
Brunke, M., Gonser, T. 1997. The ecological significance of exchange processes between rivers and ground-
water. Freshwater Biology. 37: 1-33
Chambers, P. R., Kalff, J. 1987. Light and nutrient in the control of aquatic plant community structure I. In situ
experiments. The Journal of Ecology. 75: 611-619
Chen, X. 2000. Measurement of streambed hydraulic conductivity and its anisotropy. Environmental
Geology. 39(12): 1317-1324
Cherkauer D.S., Nader D.C. 1989. Distribution of groundwater seepage to large surface-water bodies - the
effect of hydraulic heterogeneities. Journal of Hydrology. 109: 151-165
Christensen, P. B., Sørensen, J. 1986. Temporal variation of denitrification activity in plant-covered littoral
sediment from Lake Hampen, Denmark. Applied environmental Microbiology. 1174-1179
Descloux, S., Datry, 0T., Philippe, M., Marmonier, P. 2010. Comparison of different techniques to asses
surface and subsurface streambed colmation with fine sediments. International review of
Hydrobiology. 95(6): 520-540
Fitts, C. R. 2013. Groundwater science. Oxford: Academic press Elsevier. 2nd.ed 63-68
Forster, S., Graf, G. 1995. Impact of irrigation on oxygen flux into the sediment: intermittent pumping by
Callianassa subterrranea and “piston-pumping” by Lanice conchilega. Marine biology. 123: 335-346
Frandsen, M., Nilsson, B., Engesgaard, P., Pedersen, O. 2012. Groundwater seepage stimulates the growth
of aquatic macrophytes. Freshwater Biology. 57(5): 907-921
Förstner, W. C., Conradt, K. Jaksch, H., Schimkus, C., Schoer, J. 2008. Chemical speciation of heavy metals
in solid waste materials (sewage sludge, mining wastes, dredged materials, polluted sediments) by
sequential extraction. Universitätsbibliothek der Technischen Universität, Hamburg
Genereux, D., Bandopadhyay. 2001. Numerical investigation of lake seepage patterns: effects of porous
medium and lake bed properties. Journal of Hydrology. 241: 286-303
Gregg, W. W., Rose, F. L. 1985. Influence of aquatic macrophytes on invertebrate community structure, guild
structure, and microdistribution in streams. Hydrobiologia. 128: 45-56
Gyssels, G., Poesen, J., Bochet, E., Li, Y. 2005. Impact of plant roots on the resistance of soils to erosion by
water: a review. Progress in Physical Geography. 29 (2): 189-217
Paper 2
19
Hagerthey, S. E., Kerfoot, W. C. 1998. Groundwater flow influences the biomass and nutrient ratios of
epibenthic algae in a north temperate seepage lake. Limnology and Oceanography. 43(6): 1227-
1242
Hayashi, M., Rosenberry, D. O. 2005. Effects of groundwater exchange on the hydrology and ecology of
surface water. Groundwater. 40(3): 309-316
Hilton, J. 1985. A conceptual framework for predicting the occurrence of sediment focusing and sediment
redistribution in small lakes. Limnology and Oceanography. 30: 1131-1143
Huettel, M., Gust, G. 1992. Solute release mechanisms from confined sediment cores in stirred benthic
chambers and flume flows. Marine Ecology Progress series. 82: 187-197
Huettel, M., Ziebis, W., Forster, S. 1996. Flow-induced uptake of particulate matter in permeable sediments.
Limnology and Oceanography. 41(2): 309-322
Hutchinson, G. E. 1957. Concluding remarks. Cold Spring Habor Symposium. Quatitative Biology. 22: 415-
427
Iversen, J. 1936. Biologische Pflazentypen als hilfsmittel in der vegatationsforschung. Levin and Munksgaard
Iversen, T. M., Thorup, J., Hansen, T., Lodal, J., Olsen, J. 1985. Quantitative estimates and community
structure of invertebrates in macrophyte rich streams. Archiv fur Hydrobiologie. 102: 291-301
Karan, S., Kidmose, J., Engesgaard, P., Nilsson, B., Frandsen, M., Ommen, D. A .O., Flint, M. R., Andersen,
F. Ø., Pedersen, O. (2014). Role of a groundwater-Lake interface in controlling seepage of water
and nitrate. Journal of Hydrology. 517: 791-802
Kidmose, J., Engesgaard, P., Nilsson, B., Lair, T., Looms, M. C. 2011. Spatial distribution of seepage at a
flow-through lake: Lake Hampen, Western Denmark. Vadose Zone Journal. 10(1): 110-124
Kidmose, J,. Nilsson, B., Engesgaard, P., Frandsen, M., Karan, S., Landkildehus, F., Søndergaard, M.,
Jeppesen, E. 2013. Focused groundwater discharge of phosphorus to a eutrophic seepage lake
(Lake Væng, Denmark): implications for lake ecological state and restoration. Hydrogeology Journal.
21: 1787-1802. DOI 10.1007/s10040-013-1043-7
Kishel, H. F., Gerla, P.J. 2002. Characteristics of preferential flow and groundwater discharge to Shingobee
Lake, Minnesota, USA. Hydrological Processes. 16: 1921–1934
Landon, M. K., Rus, D. L., Harvey, F.E. 2001. Comparison of in-stream methods for measuring hydraulic
conductivity in sandy streambed attributes. Journal of Hydrology. 355: 164-180.
doi:10.1016/j.jhydrol.2008.03.018
Lee, D. R. 1977. A device for measuring seepage flux in lakes and estuaries. Limnology and Oceanography.
22: 140-147
Lehman, J. T. 1975. Reconstructing the rate of accumulation of lake sediment: The effect of sediment
focusing. Quaternary Research. 5: 541-550
Loeb, S. L., Hackley, S. H. 1988. The distribution of submerged macrophytes in Lake Tahoe, California and
Nevada, and the possible influence of groundwater seepage. Internationale Vereinigung fur
theoretische und angewante Limnologie, verhandlungen. 23: 1927 – 1933
Losee, W., Wetzel, R. G. 1993. Littoral flow rates within and around submerged macrophyte communities.
Freshwater Biology. 29: 7-17
Paper 2
20
Madsen, T. V., Cedergreen, N. 2002. Sources of nutrients to rooted submerged macrophytes growing in a
nutrient rich stream. Freshwater Biology. 47(2): 283-291
Mann, C. J., Wetzel, R. G. 2000. Hydrology of an impounded lotic wetland – subsurface hydrology.
Wetlands. 20(1): 33-47
Marmonier, P., Deletre, P. Y., Lefebvre, S., Guyon, J., Buolton, A. J. 2004. A simple technique using wooden
stakes to estimate vertical patterns of interstitial oxygenation in the bed of rivers. Archive Fur
Hydrobiologie. 160: 133-143
McBride, M.S., Pfannkuch, H. O. 1975. The distribution of seepage within lakebeds. J. Res. USGS. 3: 505-
512
Meinikmann, K., Lewandowski, J., Nutzmann, G. 2013. Lacustrine groundwater discharge: Combined
determination of volumes and spatial patterns. Journal of Hydrology. 502; 202-211
Michaud, E., Desrosiers, G., Mermillod-Blondin, F. Sundby, B., Stora, G. 2005. The functional group
approach to bioturbation: The effects of biodiffusers and gallery-diffusers of the Macoma balthica
community on sediment oxygen uptake. Journal of Experimental Marine Biology and Ecology.
326(1): 77-88
Mitchell, A. R., Ellsworth, T. R., Meek, B. D. 1995. Effects of root systems on preferential flow in swelling soil.
Communication in Soil Science and Plant Analyses. 26: 2655-2666
Moeslund, B. 2000. Hampen sø – Environmental status 1971 – 1999. Vejle County (In Danish)
Møller, C. L., Kjøller, R., Sand-Jensen, K. 2013. Organic enrichment of sediments reduces arbuscular
mycorrhizal fungi in oligotrophic lake macrophytes. Freshwater Biology. 58: 769-779
Ommen, D.A., Kidmose, J., Karan S., Flindt, M. R., Engesgaard, P., Nilsson, B., Andersen, F.Ø. 2012.
Importance of groundwater and macrophytes for the nutrient balance at oligotrophic Lake Hampen,
Denmark. Ecohydrology, 5(3): 286-296
Palmer, M. A., Civich, A. P., Lake, S., Biro, P., Brooks, J. C., Dahm, C., Gibert, J., Goedkoop. W., Martens,
K., Verhoeven, J., Van De Bund, W. 2000. Linkage between aquatic sediment biota and life above
sediments as drivers of biological and ecological processes. Oxford journals. BioScience. 50(12):
1062-1075
Pedersen, O., Sand-Jensen, K., Revsbech, N. P. 1995. Diel pulses of O2 and CO2 in sandy lake sediments
inhabited by Lobelia dortmanna. Ecology. 76(5): 1536-1545
Petticrew, E. L., Kalff, J. 1991. Predictions of surficial sediment composition in the littoral zone of lakes.
Limnology and Oceanography. 36(2): 384-392
Raun, A. L., Borum, J., Sand-Jensen, K. 2010. Influence of sediment organic enrichment and water alkalinity
on growth of aquatic isoetid and elodeid macrophytes. Freshwater Biology. 55: 1891-1904
Rillig, M. C., Mummey, D. L. 2006. Mycorrhizas and soil structure. New Phytologist. 171: 41-53
Robe, W. E., Griffiths, H. 1998. Adaption for an amphibious life: changes in leaf morphology, growth rate,
carbon and nitrogen investment, and reproduction during adjustment to emersion by freshwater
macrophyte Littorella uniflora. New Phytologist. 140: 9-23
Roelofs, J. G.M., Schuurkes, J. A. A. R., Smits, A. J. M. 1984. Impact of acidification and eutrophication on
macrophyte communities in softwaters. II Experimental studies. Aquatic botany. 18: 389-411
Paper 2
21
Rosenberry, D.O., Toran, L., Nyquist, J.E. 2010. Effect of surficial disturbance on exchange between
groundwater and surface water in near shore margins, Water Recourses Research. 46(6): doi:
10.1029/2009WR008755
Sand-Jensen, K. 1998. Influence of submerged macrophytes on sediment composition and near-bed flow in
lowland streams. Freshwater Biology. 39: 663-679
Sand-Jensen, K., Borum, J., Binzer, T. 2005. Oxygen stress and reduced growth of Lobelia dortmanna in
sandy lake sediments subject to organic enrichment. Freshwater Biology. 50: 1034-1048
Sand-Jensen, K., Mebus, J. R. 1996. Fine-scale patterns of water velocity within marcrophyte patches in
streams. Oikos. 76(1): 169-180
Sand-Jensen, K., Prahl, C., Stokholm, H. 1982. Oxygen release from roots of submerged macrophytes.
Oikos. 38: 349-354
Schafran, G.C., Driscoll, C.T., 1993. Flow path-composition relationships for groundwater entering an acidic
lake. Water Resour. Res. 29, 145
Schuster, P.F., Reddy M.F., LaBaugh J.W., Parkhurst R. S., Rosenberry D.O., Winter T.C., Antweiler R.C,
Dean W.E. 2003. Characterization of surface water and groundwater movement in the littoral zone of
Williams Lake, a closed-basin lake in north central Minnesota. Hydrological Processes. 17: 823-838
Sebestyen, S. D., Schneider, R. L. 2004. Seepage patterns pore water and aquatic macrophytes:
hydrological and biogeochemical relationship in lakes. Biogeochemistry. 68: 383-409
Sebok, E., C. Duque, J. Kazmierczak, P. Engesgaard, B. Nilsson, S. Karan, and M. Frandsen (2013), High-
resolution distributed temperature sensing to detect seasonal groundwater discharge into Lake
Væng, Denmark, Water Resour. Res., 49, doi:10.1002/wrcr.20436
Sebok, E., C. Duque, P. Engesgaard, and E. Boegh, (2014). Spatial variability in streambed hydraulic
conductivity of contrasting stream morphologies: channel bend and straight channel, Hydrol.
Process. DOI: 10.1002/hyp.10170
Shaw, R. D., Prepas, E. E. 1990. Groundwater-lake interactions II. Nearshore seepage patterns and the
contribution of groundwater to lakes in central Alberta. Journal of Hydrology. 119: 121-136
Schälchli, U. 1992. The clogging of coarse gravel river beds by fine sediments, Hydrobiologia. 235(236):
189-197
Song, J., Chen, Xunhong., Cheng, C., Wang, D., Lackley, S., Xu, Z. 2009. Feasibility of grain-size analysis
methods for determination of vertical hydraulic conductivity of streambeds
Taylor, K., Wheatcraft, S., Hess, J., Hayworth, J., Molz, F. 1990. Evaluation of methods of determining the
vertical distribution of hydraulic conductivity. Groundwater. 37 (1): 88-98
Vestergaard, O., Sand-Jensen, K. 2000. Alkalinity and trophic state regulate aquatic plant distribution in
Danish lakes. Aquatic Botany. 67: 85-107
Vukovic M., Soro A. 1992. Determination of hydraulic conductivity of porous media from grain-size
composition, Water Resources Publication, Colorado, USA
Wetzel, R. G. 1990. Detritus, macrophytes and nutrient cycling in lakes. Scientific Perspectives in Theoretical
and Applied Limnology. 47: 233-249

Paper 2
22
Winkel, A., Borum, J. 2009. Use of CO2 by submerged rooted macrophytes. Annals of Botany. 103(7): 1015-
1023
Paper 3
Tacking groundwater flow during a flow reversal – nature’s
own tracer experiment
Mette Cristine Schou Frandsen, Peter Engesgaard, Bertel Nilsson, Ole Pedersen

Paper 3
1
Tracking groundwater flow during a flow reversal – nature’s
own tracer experiment.
Mette Frandsen*, ^
, Peter Engesgaard+, Bertel Nilsson
^ Ole Pedersen
*
*The freshwater Biological Laboratory, Department of Biology, University of Copenhagen, Hillerød, Denmark
^The Geological Survey of Denmark and Greenland, Copenhagen, Denmark
+Department of Geography and Geology, University of Copenhagen, Denmark
Abstract
Transient effects such as flow reversals are difficult to detect, but can have significant impact on lake
ecology. In this study we use a natural tracer, 18
O, to track the groundwater movement in the sediment of
Lake Hampen during and after a flow reversal, and on the same time estimating the effect on the nitrate
transport and denitrification.
Form our results we estimate that the flow reversal have been in effect from 2010 to 2012 – 2013.
The reason for the flow reversal was possibly a combined effect of reduced precipitation leading to lower
hydraulic heads in the catchment relative to lake stage. The precipitation decreased gradually from 913 mm
in 2007 to 704 mm in 2012. At the same time there was a drop in air temperature in 2009-20012 resulting in
precipitation as snow rather that rain leading to a lower infiltrating rate in the catchment.
During the flow reversal, lake water penetrated/seeped down through the sediment reaching a
depth of minimum 1.25 m below the lake bed. This was in an area normally discharging large amounts of
nitrate to the lake. During the flow reversal we found much lower than expected nitrate concentrations in the
sediment as the lake bed was saturated with lake water. As the flow reversal stopped and the directional flow
of groundwater reversed again, the nitrate concentrations increased again.
We examined the denitrification rates needed to reach the observed nitrate concentrations in 0.10
m depth. The denitrification rates required were 31 µmol N m-2
hour-1
which is in the lower end of what other
studies found for the same area.
When the experimental period was over, the lake had not fully recovered as indicated by δ18
O and
nitrate concentrations in the sediment. We speculate that the system possible have undergone several flow
reversals in historical time, as the causes for this flow reversal were relative small.
Paper 3
2
Introduction
Lakes are integral parts of larger groundwater flow systems and must be considered open systems reacting
to and affecting the groundwater through exchange of water over the sediment water interface (SWI) (Sear et
al., 1999; Hancock et al., 2005). The discharging groundwater supplies the lake with often high
concentrations of solutes and inorganic carbon accumulated in the catchments. This can benefit the biota in
the discharge zones (Frandsen et al., 2012; Hagerthy & Kerfoot, 1989), but can also have a substantial
impact on the trophic status of the lake (Sebestyen & Schneider, 2004; Hayashi & Rosenberry, 2002;
Hagerthey & Kerfoot, 1998). In some cases, groundwater input of nutrients accounts to up to 50% of the
annual nutrient load to a lake (Brock et al., 1982; Shaw & Prepas, 1989). This makes the understanding of
groundwater flow in lake settings an important component in order to understand the ecology of the system.
The groundwater systems are overall controlled by recharge from precipitation, evapotranspiration,
and exchange of water with lakes. On this scale the directional subsurface flow of groundwater is mainly
controlled by topography (gravity) and geology. The groundwater will flow from high elevations to low
elevations, driven by differences in potential energy. On a smaller scale the flow pattern is affected by
sedimentary heterogeneity, causing differences in hydraulic conductivity, hereby affecting the groundwater
flow.
In perfectly homogeneous, isotropic and steady state systems the groundwater discharging to a
lake will often decrease exponentially with the distance from the lake shore (McBride & Pfannkuch, 1975;
Pfannkuch & Winter, 1984; Lee, 1980). Deviations from this flow pattern will typically be due to the aquifer-
lake geometry (Winter, 1999), anisotropy in the sediments (Pfannkuch & Winter, 1984), geological
heterogeneity (Tóth, 1999) and seasonal changes in precipitation and drainage patterns (Downing &
Peterka, 1978; Rosenberry & Winter, 1997). The sensitivity of the groundwater surface water flow systems to
these factors, gives rise to a number of transient effects (Cheng & Anderson, 1994). Of the more important
effects are flow reversals. During a flow reversal, the directional flow of the groundwater will change either
locally or in the whole groundwater – lake system. In the extreme case this can change a discharge site, to a
recharge site (Ala-aho et al., 2013).
Flow reversals are typically caused by the creation of groundwater mounds or simply as a result of
changes in the regional and local in- and output of water to the system (LaBaugh et al., 1987; Rosenberry &
Winter, 1997). Even though many studies neglect transient effects (Winter, 1978; Cherkauer & Hensel, 1986;
Krabbenhoft et al., 1990) many studies point to the importance of these effects in altering the groundwater
flow pattern (Anderson & Cheng, 1994; LaBaugh et al., 1987).
Meyboom (1967) was one of the first to describe the importance of transient effects on the
groundwater flow patterns around lakes by showing that the groundwater flow was seasonally determined
with long periods of directionally diverted flow. Later it was described how the formations of groundwater
mounds could create stagnation points for groundwater (Anderson & Munter, 1981; Winter, 1983) and how
the creation of groundwater mounds could be seasonal (Cherkauer & Zager, 1989; Winter, 1986). Downing &
Peterka (1978) showed that groundwater discharge increased with increased rainfall, Rosenberry & Winter
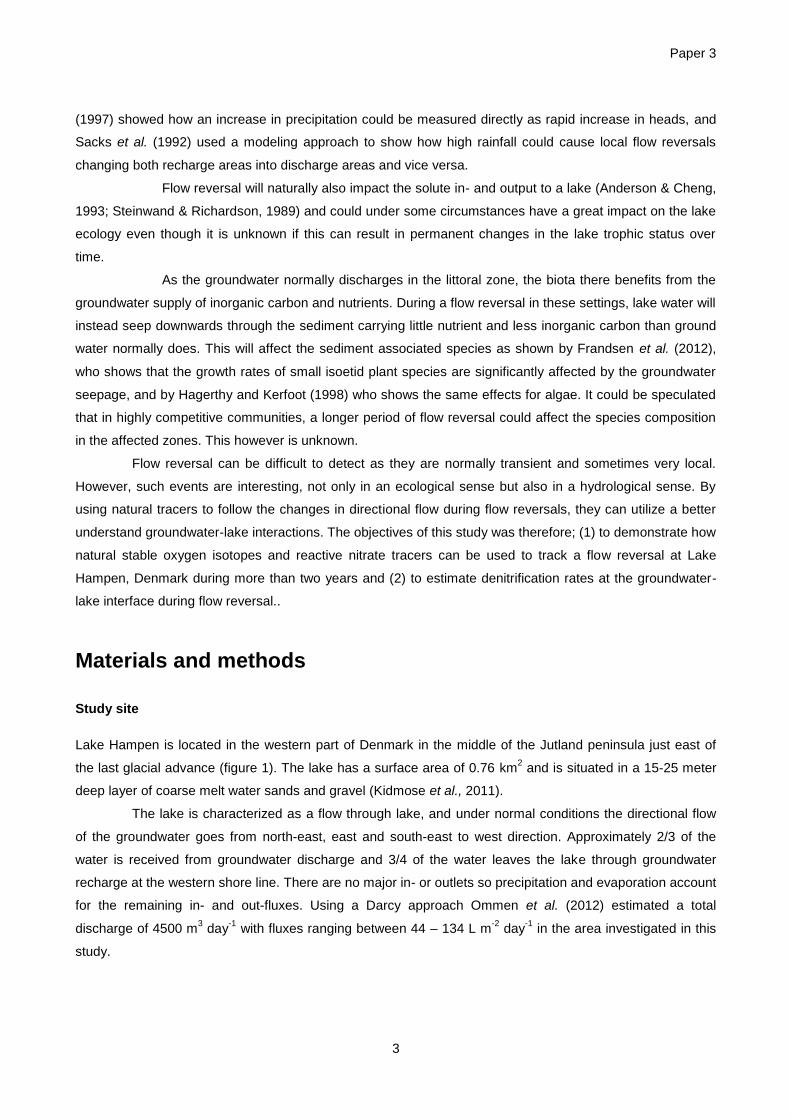
Paper 3
3
(1997) showed how an increase in precipitation could be measured directly as rapid increase in heads, and
Sacks et al. (1992) used a modeling approach to show how high rainfall could cause local flow reversals
changing both recharge areas into discharge areas and vice versa.
Flow reversal will naturally also impact the solute in- and output to a lake (Anderson & Cheng,
1993; Steinwand & Richardson, 1989) and could under some circumstances have a great impact on the lake
ecology even though it is unknown if this can result in permanent changes in the lake trophic status over
time.
As the groundwater normally discharges in the littoral zone, the biota there benefits from the
groundwater supply of inorganic carbon and nutrients. During a flow reversal in these settings, lake water will
instead seep downwards through the sediment carrying little nutrient and less inorganic carbon than ground
water normally does. This will affect the sediment associated species as shown by Frandsen et al. (2012),
who shows that the growth rates of small isoetid plant species are significantly affected by the groundwater
seepage, and by Hagerthy and Kerfoot (1998) who shows the same effects for algae. It could be speculated
that in highly competitive communities, a longer period of flow reversal could affect the species composition
in the affected zones. This however is unknown.
Flow reversal can be difficult to detect as they are normally transient and sometimes very local.
However, such events are interesting, not only in an ecological sense but also in a hydrological sense. By
using natural tracers to follow the changes in directional flow during flow reversals, they can utilize a better
understand groundwater-lake interactions. The objectives of this study was therefore; (1) to demonstrate how
natural stable oxygen isotopes and reactive nitrate tracers can be used to track a flow reversal at Lake
Hampen, Denmark during more than two years and (2) to estimate denitrification rates at the groundwater-
lake interface during flow reversal..
Materials and methods
Study site
Lake Hampen is located in the western part of Denmark in the middle of the Jutland peninsula just east of
the last glacial advance (figure 1). The lake has a surface area of 0.76 km2 and is situated in a 15-25 meter
deep layer of coarse melt water sands and gravel (Kidmose et al., 2011).
The lake is characterized as a flow through lake, and under normal conditions the directional flow
of the groundwater goes from north-east, east and south-east to west direction. Approximately 2/3 of the
water is received from groundwater discharge and 3/4 of the water leaves the lake through groundwater
recharge at the western shore line. There are no major in- or outlets so precipitation and evaporation account
for the remaining in- and out-fluxes. Using a Darcy approach Ommen et al. (2012) estimated a total
discharge of 4500 m3 day
-1 with fluxes ranging between 44 – 134 L m
-2 day
-1 in the area investigated in this
study.
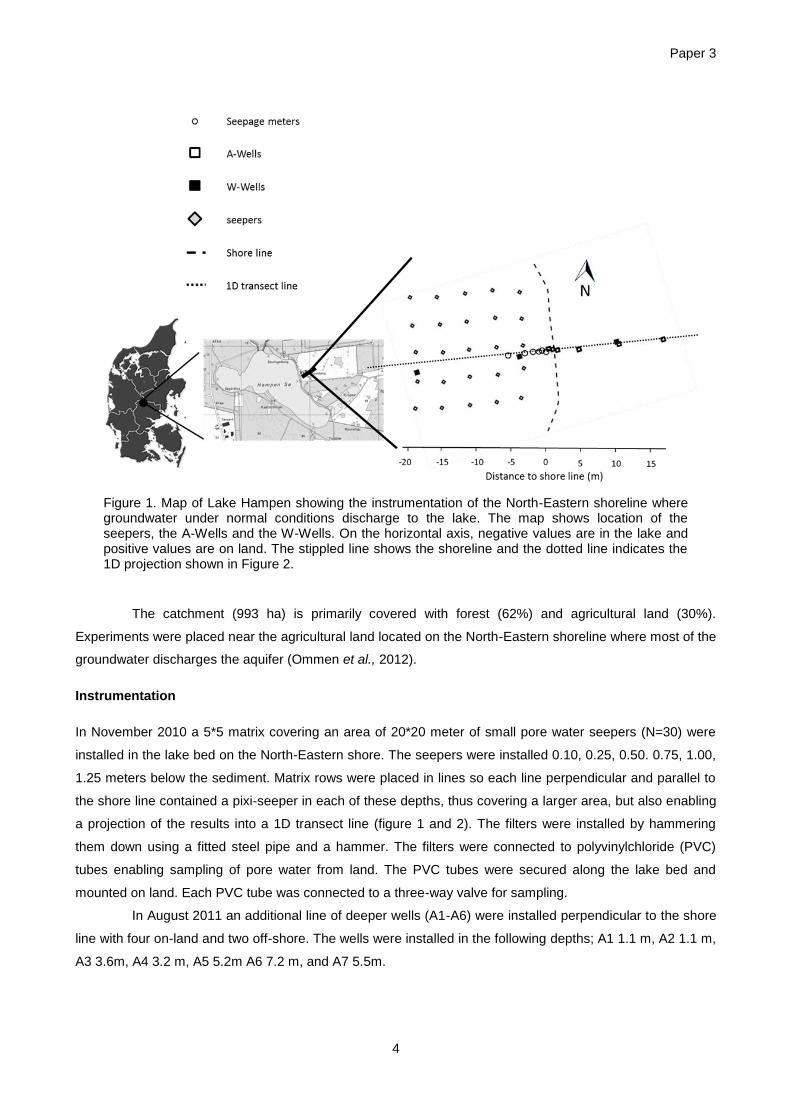
Paper 3
4
The catchment (993 ha) is primarily covered with forest (62%) and agricultural land (30%).
Experiments were placed near the agricultural land located on the North-Eastern shoreline where most of the
groundwater discharges the aquifer (Ommen et al., 2012).
Instrumentation
In November 2010 a 5*5 matrix covering an area of 20*20 meter of small pore water seepers (N=30) were
installed in the lake bed on the North-Eastern shore. The seepers were installed 0.10, 0.25, 0.50. 0.75, 1.00,
1.25 meters below the sediment. Matrix rows were placed in lines so each line perpendicular and parallel to
the shore line contained a pixi-seeper in each of these depths, thus covering a larger area, but also enabling
a projection of the results into a 1D transect line (figure 1 and 2). The filters were installed by hammering
them down using a fitted steel pipe and a hammer. The filters were connected to polyvinylchloride (PVC)
tubes enabling sampling of pore water from land. The PVC tubes were secured along the lake bed and
mounted on land. Each PVC tube was connected to a three-way valve for sampling.
In August 2011 an additional line of deeper wells (A1-A6) were installed perpendicular to the shore
line with four on-land and two off-shore. The wells were installed in the following depths; A1 1.1 m, A2 1.1 m,
A3 3.6m, A4 3.2 m, A5 5.2m A6 7.2 m, and A7 5.5m.
Figure 1. Map of Lake Hampen showing the instrumentation of the North-Eastern shoreline where groundwater under normal conditions discharge to the lake. The map shows location of the seepers, the A-Wells and the W-Wells. On the horizontal axis, negative values are in the lake and positive values are on land. The stippled line shows the shoreline and the dotted line indicates the 1D projection shown in Figure 2.
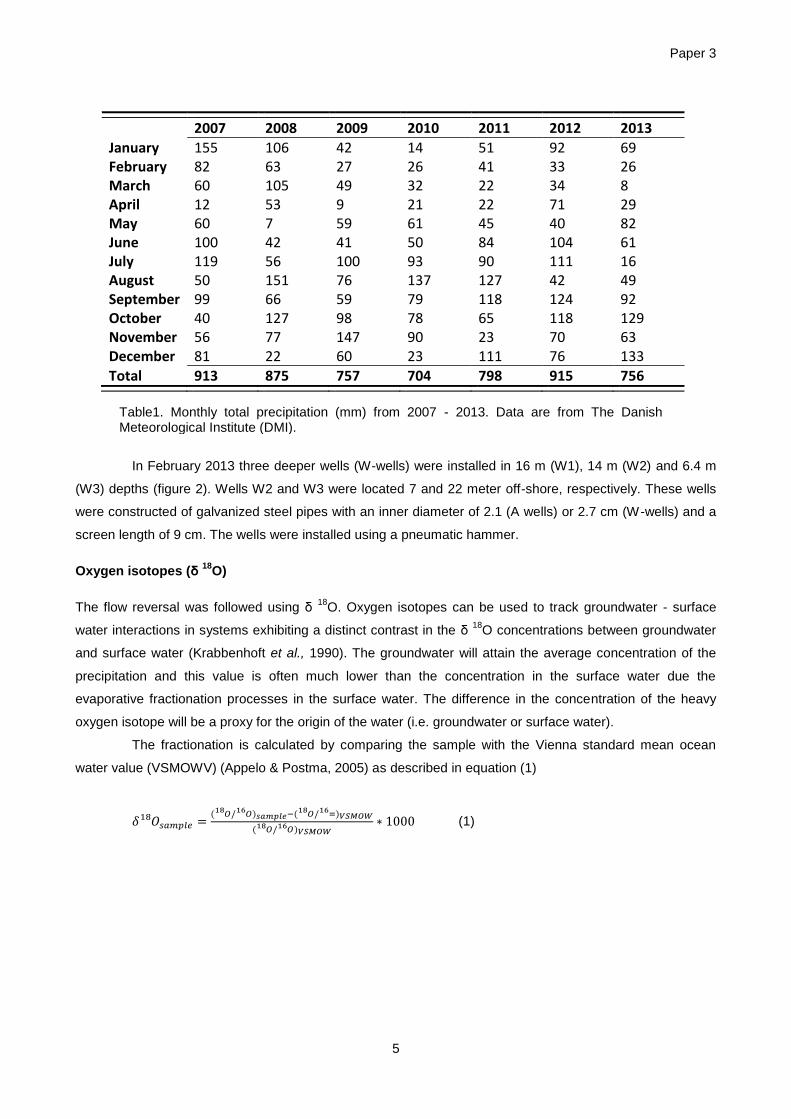
Paper 3
5
In February 2013 three deeper wells (W-wells) were installed in 16 m (W1), 14 m (W2) and 6.4 m
(W3) depths (figure 2). Wells W2 and W3 were located 7 and 22 meter off-shore, respectively. These wells
were constructed of galvanized steel pipes with an inner diameter of 2.1 (A wells) or 2.7 cm (W-wells) and a
screen length of 9 cm. The wells were installed using a pneumatic hammer.
Oxygen isotopes (δ 18
O)
The flow reversal was followed using δ 18
O. Oxygen isotopes can be used to track groundwater - surface
water interactions in systems exhibiting a distinct contrast in the δ 18
O concentrations between groundwater
and surface water (Krabbenhoft et al., 1990). The groundwater will attain the average concentration of the
precipitation and this value is often much lower than the concentration in the surface water due the
evaporative fractionation processes in the surface water. The difference in the concentration of the heavy
oxygen isotope will be a proxy for the origin of the water (i.e. groundwater or surface water).
The fractionation is calculated by comparing the sample with the Vienna standard mean ocean
water value (VSMOWV) (Appelo & Postma, 2005) as described in equation (1)
( ) ( )
( ) (1)
2007 2008 2009 2010 2011 2012 2013
January 155 106 42 14 51 92 69 February 82 63 27 26 41 33 26 March 60 105 49 32 22 34 8 April 12 53 9 21 22 71 29 May 60 7 59 61 45 40 82 June 100 42 41 50 84 104 61 July 119 56 100 93 90 111 16 August 50 151 76 137 127 42 49 September 99 66 59 79 118 124 92 October 40 127 98 78 65 118 129 November 56 77 147 90 23 70 63 December 81 22 60 23 111 76 133
Total 913 875 757 704 798 915 756
Table1. Monthly total precipitation (mm) from 2007 - 2013. Data are from The Danish Meteorological Institute (DMI).
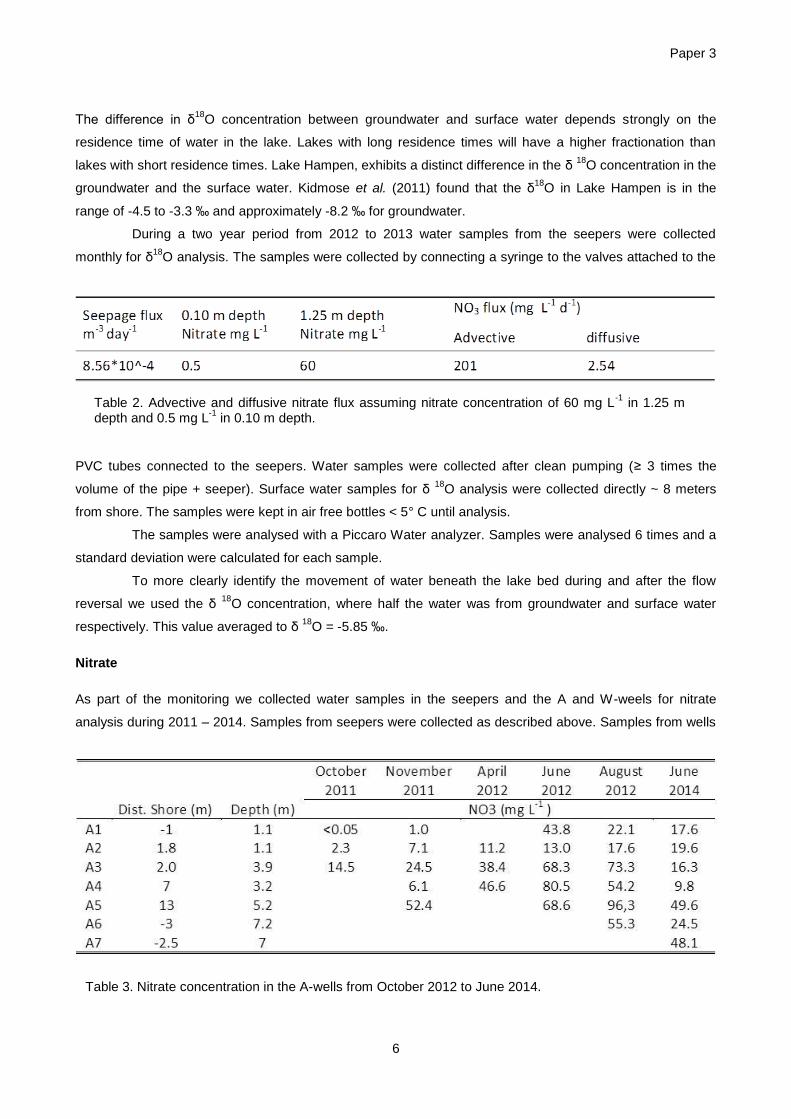
Paper 3
6
The difference in δ18
O concentration between groundwater and surface water depends strongly on the
residence time of water in the lake. Lakes with long residence times will have a higher fractionation than
lakes with short residence times. Lake Hampen, exhibits a distinct difference in the δ 18
O concentration in the
groundwater and the surface water. Kidmose et al. (2011) found that the δ18
O in Lake Hampen is in the
range of -4.5 to -3.3 ‰ and approximately -8.2 ‰ for groundwater.
During a two year period from 2012 to 2013 water samples from the seepers were collected
monthly for δ18
O analysis. The samples were collected by connecting a syringe to the valves attached to the
PVC tubes connected to the seepers. Water samples were collected after clean pumping (≥ 3 times the
volume of the pipe + seeper). Surface water samples for δ 18
O analysis were collected directly ~ 8 meters
from shore. The samples were kept in air free bottles < 5° C until analysis.
The samples were analysed with a Piccaro Water analyzer. Samples were analysed 6 times and a
standard deviation were calculated for each sample.
To more clearly identify the movement of water beneath the lake bed during and after the flow
reversal we used the δ 18
O concentration, where half the water was from groundwater and surface water
respectively. This value averaged to δ 18
O = -5.85 ‰.
Nitrate
As part of the monitoring we collected water samples in the seepers and the A and W-weels for nitrate
analysis during 2011 – 2014. Samples from seepers were collected as described above. Samples from wells
Table 2. Advective and diffusive nitrate flux assuming nitrate concentration of 60 mg L-1
in 1.25 m depth and 0.5 mg L
-1 in 0.10 m depth.
Table 3. Nitrate concentration in the A-wells from October 2012 to June 2014.
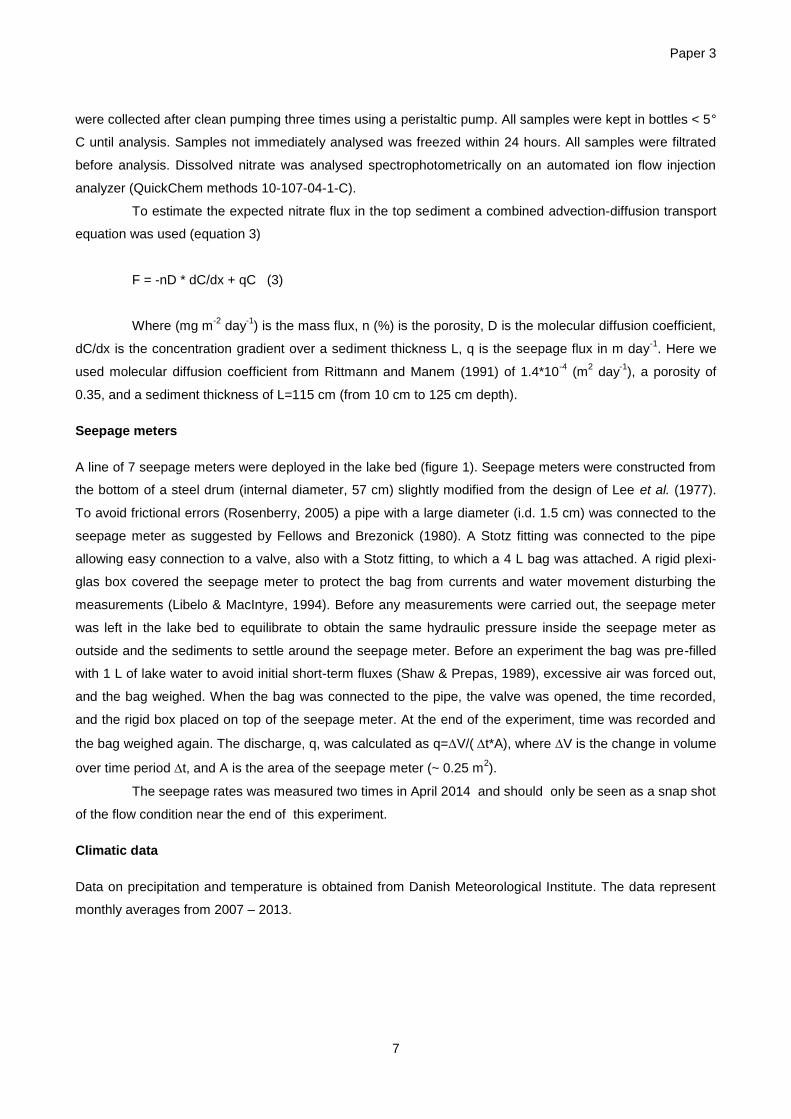
Paper 3
7
were collected after clean pumping three times using a peristaltic pump. All samples were kept in bottles < 5°
C until analysis. Samples not immediately analysed was freezed within 24 hours. All samples were filtrated
before analysis. Dissolved nitrate was analysed spectrophotometrically on an automated ion flow injection
analyzer (QuickChem methods 10-107-04-1-C).
To estimate the expected nitrate flux in the top sediment a combined advection-diffusion transport
equation was used (equation 3)
F = -nD * dC/dx + qC (3)
Where (mg m-2
day-1
) is the mass flux, n (%) is the porosity, D is the molecular diffusion coefficient,
dC/dx is the concentration gradient over a sediment thickness L, q is the seepage flux in m day-1
. Here we
used molecular diffusion coefficient from Rittmann and Manem (1991) of 1.4*10-4
(m2 day
-1), a porosity of
0.35, and a sediment thickness of L=115 cm (from 10 cm to 125 cm depth).
Seepage meters
A line of 7 seepage meters were deployed in the lake bed (figure 1). Seepage meters were constructed from
the bottom of a steel drum (internal diameter, 57 cm) slightly modified from the design of Lee et al. (1977).
To avoid frictional errors (Rosenberry, 2005) a pipe with a large diameter (i.d. 1.5 cm) was connected to the
seepage meter as suggested by Fellows and Brezonick (1980). A Stotz fitting was connected to the pipe
allowing easy connection to a valve, also with a Stotz fitting, to which a 4 L bag was attached. A rigid plexi-
glas box covered the seepage meter to protect the bag from currents and water movement disturbing the
measurements (Libelo & MacIntyre, 1994). Before any measurements were carried out, the seepage meter
was left in the lake bed to equilibrate to obtain the same hydraulic pressure inside the seepage meter as
outside and the sediments to settle around the seepage meter. Before an experiment the bag was pre-filled
with 1 L of lake water to avoid initial short-term fluxes (Shaw & Prepas, 1989), excessive air was forced out,
and the bag weighed. When the bag was connected to the pipe, the valve was opened, the time recorded,
and the rigid box placed on top of the seepage meter. At the end of the experiment, time was recorded and
the bag weighed again. The discharge, q, was calculated as q=V/(t*A), where V is the change in volume
over time period t, and A is the area of the seepage meter (~ 0.25 m2).
The seepage rates was measured two times in April 2014 and should only be seen as a snap shot
of the flow condition near the end of this experiment.
Climatic data
Data on precipitation and temperature is obtained from Danish Meteorological Institute. The data represent
monthly averages from 2007 – 2013.
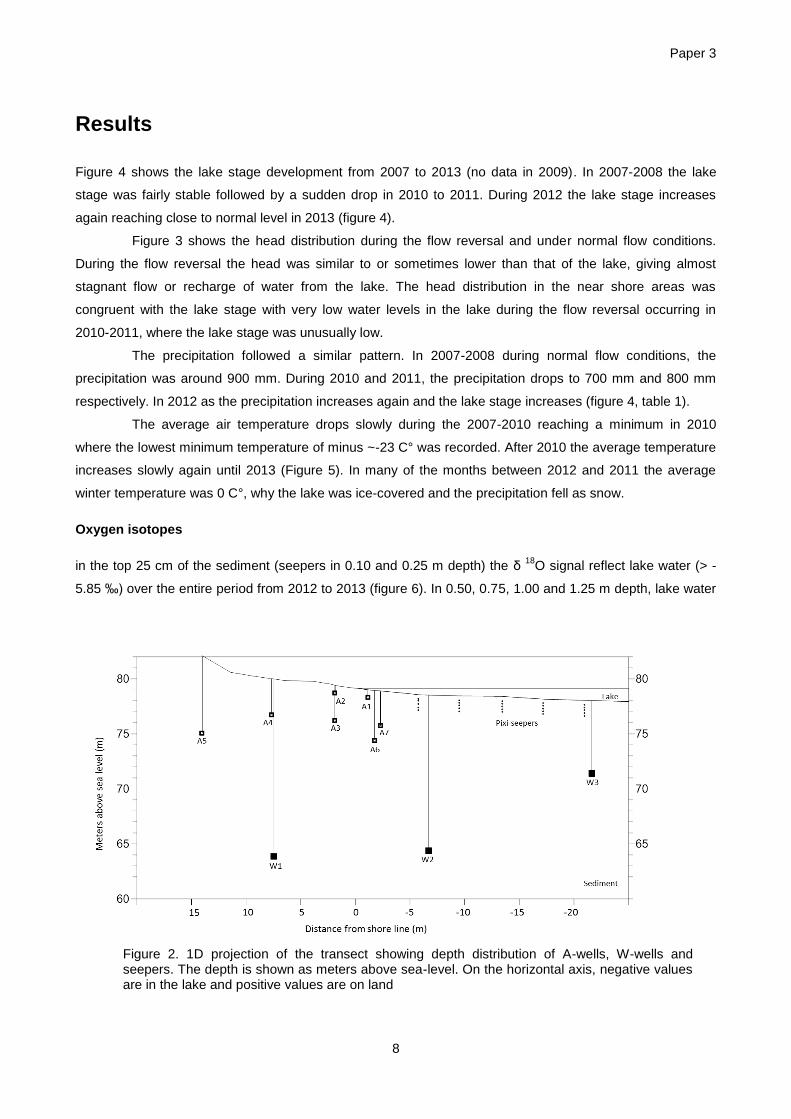
Paper 3
8
Results
Figure 4 shows the lake stage development from 2007 to 2013 (no data in 2009). In 2007-2008 the lake
stage was fairly stable followed by a sudden drop in 2010 to 2011. During 2012 the lake stage increases
again reaching close to normal level in 2013 (figure 4).
Figure 3 shows the head distribution during the flow reversal and under normal flow conditions.
During the flow reversal the head was similar to or sometimes lower than that of the lake, giving almost
stagnant flow or recharge of water from the lake. The head distribution in the near shore areas was
congruent with the lake stage with very low water levels in the lake during the flow reversal occurring in
2010-2011, where the lake stage was unusually low.
The precipitation followed a similar pattern. In 2007-2008 during normal flow conditions, the
precipitation was around 900 mm. During 2010 and 2011, the precipitation drops to 700 mm and 800 mm
respectively. In 2012 as the precipitation increases again and the lake stage increases (figure 4, table 1).
The average air temperature drops slowly during the 2007-2010 reaching a minimum in 2010
where the lowest minimum temperature of minus ~-23 C° was recorded. After 2010 the average temperature
increases slowly again until 2013 (Figure 5). In many of the months between 2012 and 2011 the average
winter temperature was 0 C°, why the lake was ice-covered and the precipitation fell as snow.
Oxygen isotopes
in the top 25 cm of the sediment (seepers in 0.10 and 0.25 m depth) the δ 18
O signal reflect lake water (> -
5.85 ‰) over the entire period from 2012 to 2013 (figure 6). In 0.50, 0.75, 1.00 and 1.25 m depth, lake water
Figure 2. 1D projection of the transect showing depth distribution of A-wells, W-wells and seepers. The depth is shown as meters above sea-level. On the horizontal axis, negative values are in the lake and positive values are on land
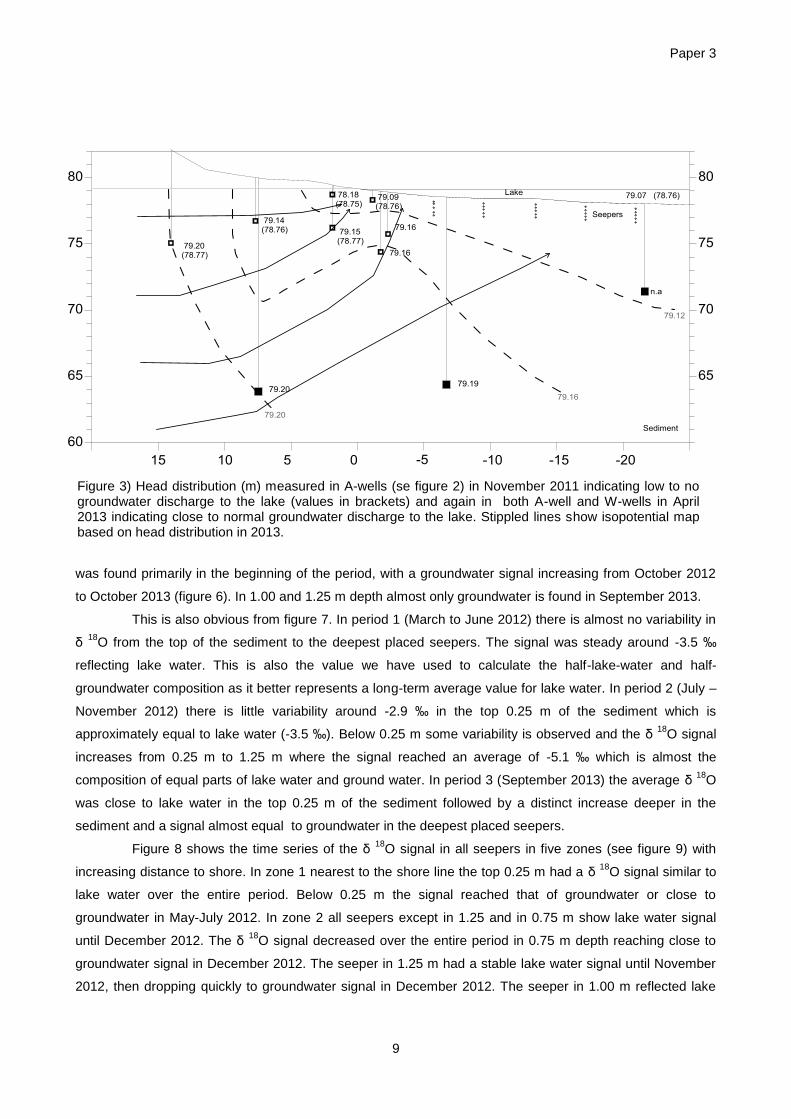
Paper 3
9
was found primarily in the beginning of the period, with a groundwater signal increasing from October 2012
to October 2013 (figure 6). In 1.00 and 1.25 m depth almost only groundwater is found in September 2013.
This is also obvious from figure 7. In period 1 (March to June 2012) there is almost no variability in
δ 18
O from the top of the sediment to the deepest placed seepers. The signal was steady around -3.5 ‰
reflecting lake water. This is also the value we have used to calculate the half-lake-water and half-
groundwater composition as it better represents a long-term average value for lake water. In period 2 (July –
November 2012) there is little variability around -2.9 ‰ in the top 0.25 m of the sediment which is
approximately equal to lake water (-3.5 ‰). Below 0.25 m some variability is observed and the δ 18
O signal
increases from 0.25 m to 1.25 m where the signal reached an average of -5.1 ‰ which is almost the
composition of equal parts of lake water and ground water. In period 3 (September 2013) the average δ 18
O
was close to lake water in the top 0.25 m of the sediment followed by a distinct increase deeper in the
sediment and a signal almost equal to groundwater in the deepest placed seepers.
Figure 8 shows the time series of the δ 18
O signal in all seepers in five zones (see figure 9) with
increasing distance to shore. In zone 1 nearest to the shore line the top 0.25 m had a δ 18
O signal similar to
lake water over the entire period. Below 0.25 m the signal reached that of groundwater or close to
groundwater in May-July 2012. In zone 2 all seepers except in 1.25 and in 0.75 m show lake water signal
until December 2012. The δ 18
O signal decreased over the entire period in 0.75 m depth reaching close to
groundwater signal in December 2012. The seeper in 1.25 m had a stable lake water signal until November
2012, then dropping quickly to groundwater signal in December 2012. The seeper in 1.00 m reflected lake
Figure 3) Head distribution (m) measured in A-wells (se figure 2) in November 2011 indicating low to no groundwater discharge to the lake (values in brackets) and again in both A-well and W-wells in April 2013 indicating close to normal groundwater discharge to the lake. Stippled lines show isopotential map based on head distribution in 2013.
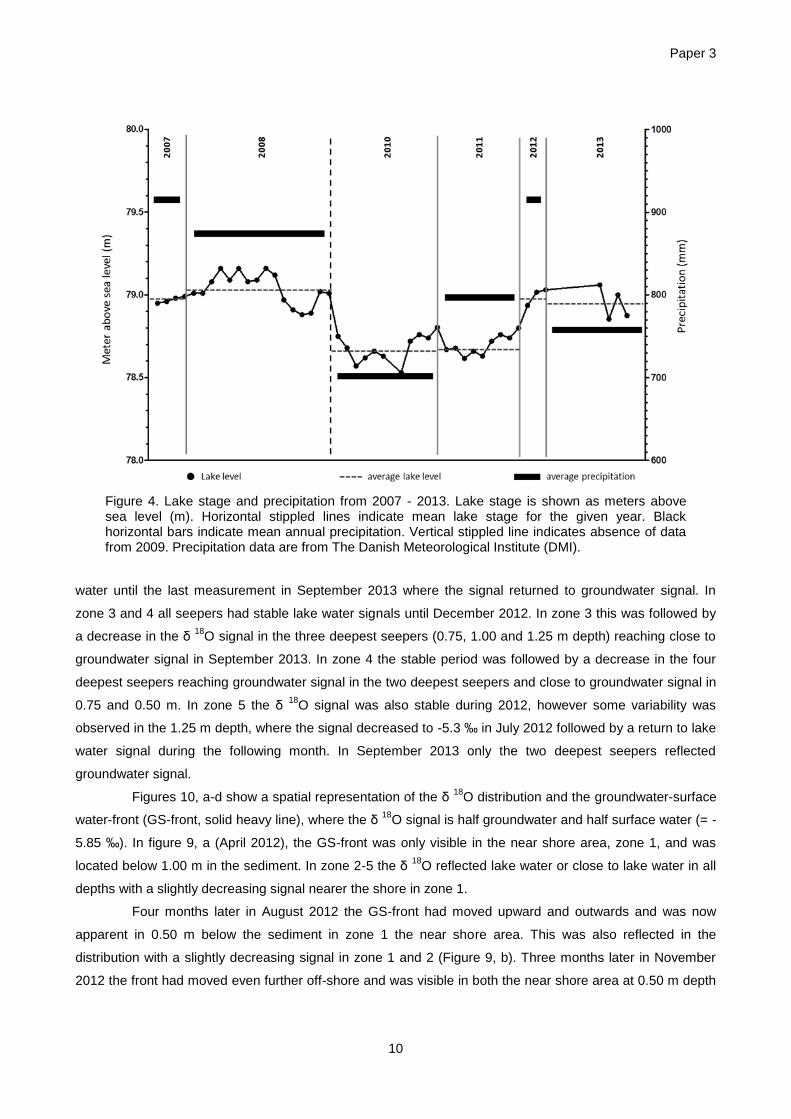
Paper 3
10
water until the last measurement in September 2013 where the signal returned to groundwater signal. In
zone 3 and 4 all seepers had stable lake water signals until December 2012. In zone 3 this was followed by
a decrease in the δ 18
O signal in the three deepest seepers (0.75, 1.00 and 1.25 m depth) reaching close to
groundwater signal in September 2013. In zone 4 the stable period was followed by a decrease in the four
deepest seepers reaching groundwater signal in the two deepest seepers and close to groundwater signal in
0.75 and 0.50 m. In zone 5 the δ 18
O signal was also stable during 2012, however some variability was
observed in the 1.25 m depth, where the signal decreased to -5.3 ‰ in July 2012 followed by a return to lake
water signal during the following month. In September 2013 only the two deepest seepers reflected
groundwater signal.
Figures 10, a-d show a spatial representation of the δ 18
O distribution and the groundwater-surface
water-front (GS-front, solid heavy line), where the δ 18
O signal is half groundwater and half surface water (= -
5.85 ‰). In figure 9, a (April 2012), the GS-front was only visible in the near shore area, zone 1, and was
located below 1.00 m in the sediment. In zone 2-5 the δ 18
O reflected lake water or close to lake water in all
depths with a slightly decreasing signal nearer the shore in zone 1.
Four months later in August 2012 the GS-front had moved upward and outwards and was now
apparent in 0.50 m below the sediment in zone 1 the near shore area. This was also reflected in the
distribution with a slightly decreasing signal in zone 1 and 2 (Figure 9, b). Three months later in November
2012 the front had moved even further off-shore and was visible in both the near shore area at 0.50 m depth
Figure 4. Lake stage and precipitation from 2007 - 2013. Lake stage is shown as meters above sea level (m). Horizontal stippled lines indicate mean lake stage for the given year. Black horizontal bars indicate mean annual precipitation. Vertical stippled line indicates absence of data from 2009. Precipitation data are from The Danish Meteorological Institute (DMI).
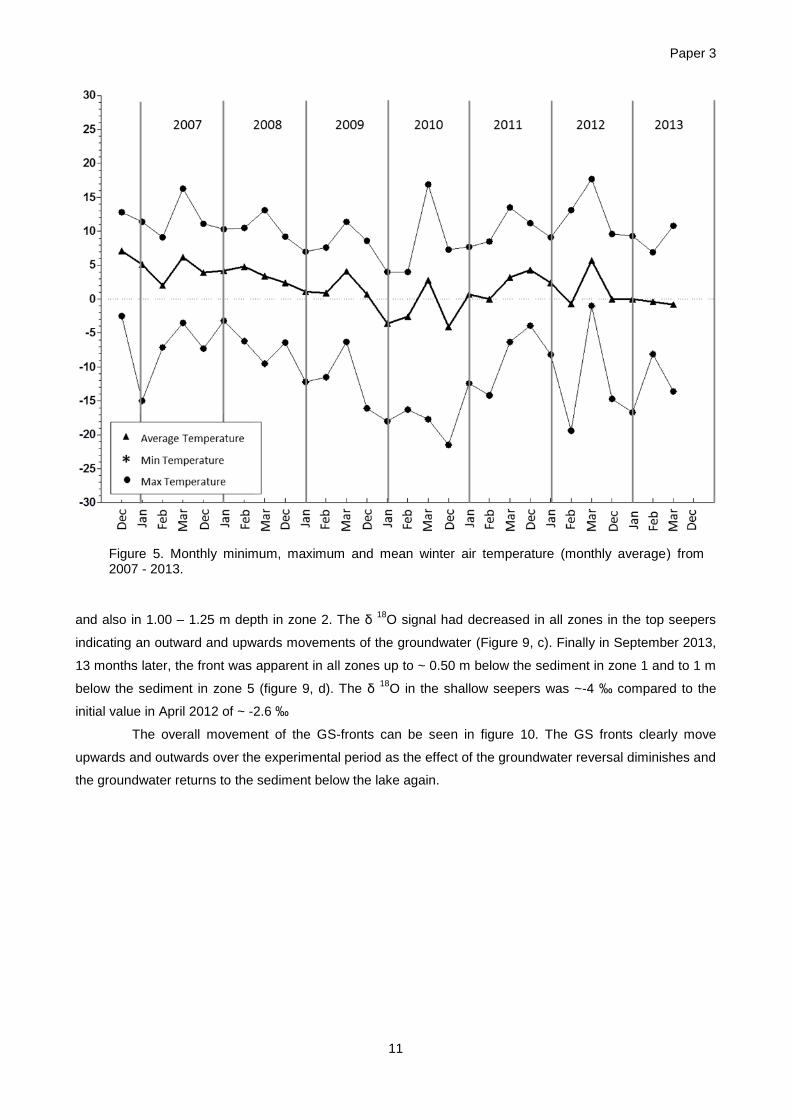
Paper 3
11
and also in 1.00 – 1.25 m depth in zone 2. The δ 18
O signal had decreased in all zones in the top seepers
indicating an outward and upwards movements of the groundwater (Figure 9, c). Finally in September 2013,
13 months later, the front was apparent in all zones up to ~ 0.50 m below the sediment in zone 1 and to 1 m
below the sediment in zone 5 (figure 9, d). The δ 18
O in the shallow seepers was ~-4 ‰ compared to the
initial value in April 2012 of ~ -2.6 ‰
The overall movement of the GS-fronts can be seen in figure 10. The GS fronts clearly move
upwards and outwards over the experimental period as the effect of the groundwater reversal diminishes and
the groundwater returns to the sediment below the lake again.
Figure 5. Monthly minimum, maximum and mean winter air temperature (monthly average) from 2007 - 2013.
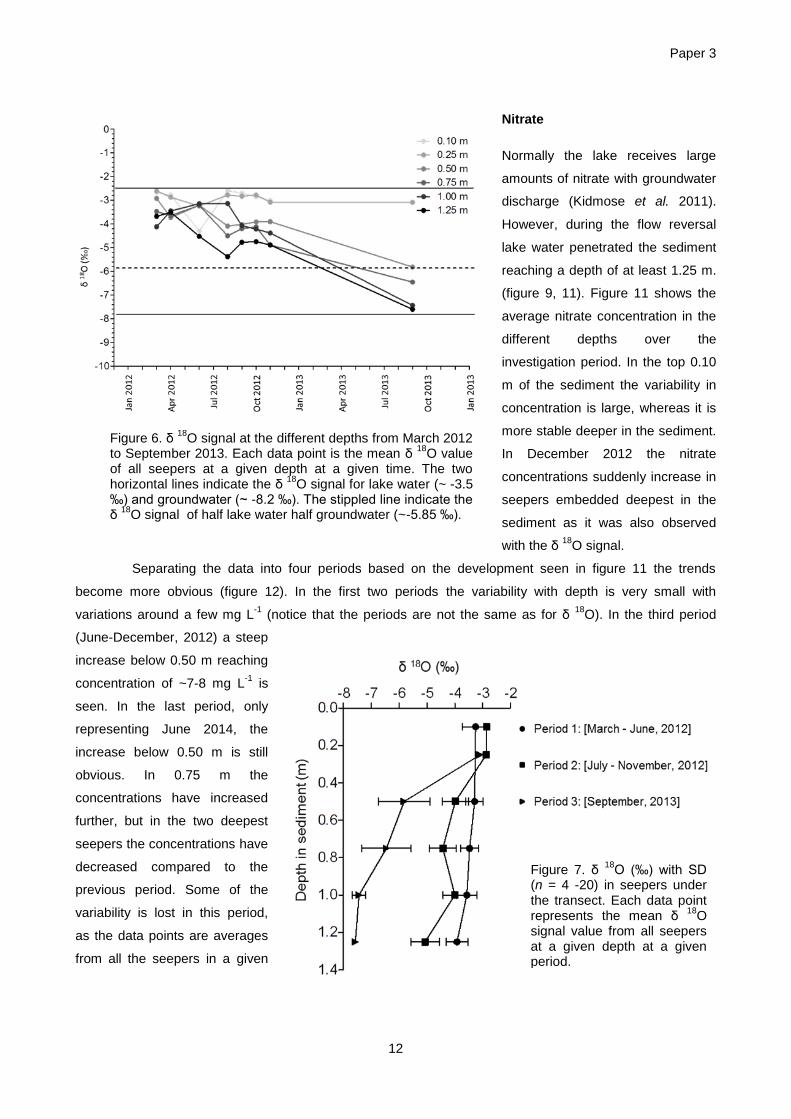
Paper 3
12
Nitrate
Normally the lake receives large
amounts of nitrate with groundwater
discharge (Kidmose et al. 2011).
However, during the flow reversal
lake water penetrated the sediment
reaching a depth of at least 1.25 m.
(figure 9, 11). Figure 11 shows the
average nitrate concentration in the
different depths over the
investigation period. In the top 0.10
m of the sediment the variability in
concentration is large, whereas it is
more stable deeper in the sediment.
In December 2012 the nitrate
concentrations suddenly increase in
seepers embedded deepest in the
sediment as it was also observed
with the δ 18
O signal.
Separating the data into four periods based on the development seen in figure 11 the trends
become more obvious (figure 12). In the first two periods the variability with depth is very small with
variations around a few mg L-1
(notice that the periods are not the same as for δ 18
O). In the third period
(June-December, 2012) a steep
increase below 0.50 m reaching
concentration of ~7-8 mg L-1
is
seen. In the last period, only
representing June 2014, the
increase below 0.50 m is still
obvious. In 0.75 m the
concentrations have increased
further, but in the two deepest
seepers the concentrations have
decreased compared to the
previous period. Some of the
variability is lost in this period,
as the data points are averages
from all the seepers in a given
Figure 6. δ 18
O signal at the different depths from March 2012 to September 2013. Each data point is the mean δ
18O value
of all seepers at a given depth at a given time. The two horizontal lines indicate the δ
18O signal for lake water (~ -3.5
‰) and groundwater (~ -8.2 ‰). The stippled line indicate the δ
18O signal of half lake water half groundwater (~-5.85 ‰).
Figure 7. δ 18
O (‰) with SD (n = 4 -20) in seepers under the transect. Each data point represents the mean δ
18O
signal value from all seepers at a given depth at a given period.
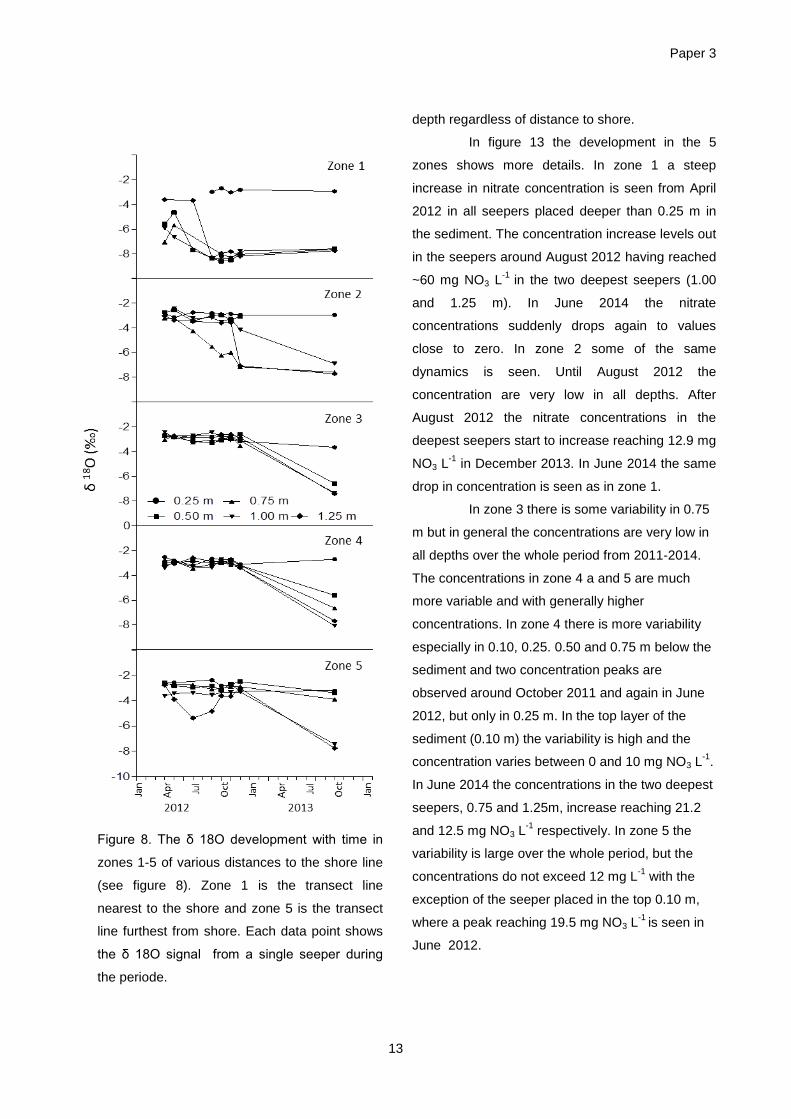
Paper 3
13
depth regardless of distance to shore.
In figure 13 the development in the 5
zones shows more details. In zone 1 a steep
increase in nitrate concentration is seen from April
2012 in all seepers placed deeper than 0.25 m in
the sediment. The concentration increase levels out
in the seepers around August 2012 having reached
~60 mg NO3 L-1
in the two deepest seepers (1.00
and 1.25 m). In June 2014 the nitrate
concentrations suddenly drops again to values
close to zero. In zone 2 some of the same
dynamics is seen. Until August 2012 the
concentration are very low in all depths. After
August 2012 the nitrate concentrations in the
deepest seepers start to increase reaching 12.9 mg
NO3 L-1
in December 2013. In June 2014 the same
drop in concentration is seen as in zone 1.
In zone 3 there is some variability in 0.75
m but in general the concentrations are very low in
all depths over the whole period from 2011-2014.
The concentrations in zone 4 a and 5 are much
more variable and with generally higher
concentrations. In zone 4 there is more variability
especially in 0.10, 0.25. 0.50 and 0.75 m below the
sediment and two concentration peaks are
observed around October 2011 and again in June
2012, but only in 0.25 m. In the top layer of the
sediment (0.10 m) the variability is high and the
concentration varies between 0 and 10 mg NO3 L-1
.
In June 2014 the concentrations in the two deepest
seepers, 0.75 and 1.25m, increase reaching 21.2
and 12.5 mg NO3 L-1
respectively. In zone 5 the
variability is large over the whole period, but the
concentrations do not exceed 12 mg L-1
with the
exception of the seeper placed in the top 0.10 m,
where a peak reaching 19.5 mg NO3 L-1
is seen in
June 2012.
Figure 8. The δ 18O development with time in
zones 1-5 of various distances to the shore line
(see figure 8). Zone 1 is the transect line
nearest to the shore and zone 5 is the transect
line furthest from shore. Each data point shows
the δ 18O signal from a single seeper during
the periode.
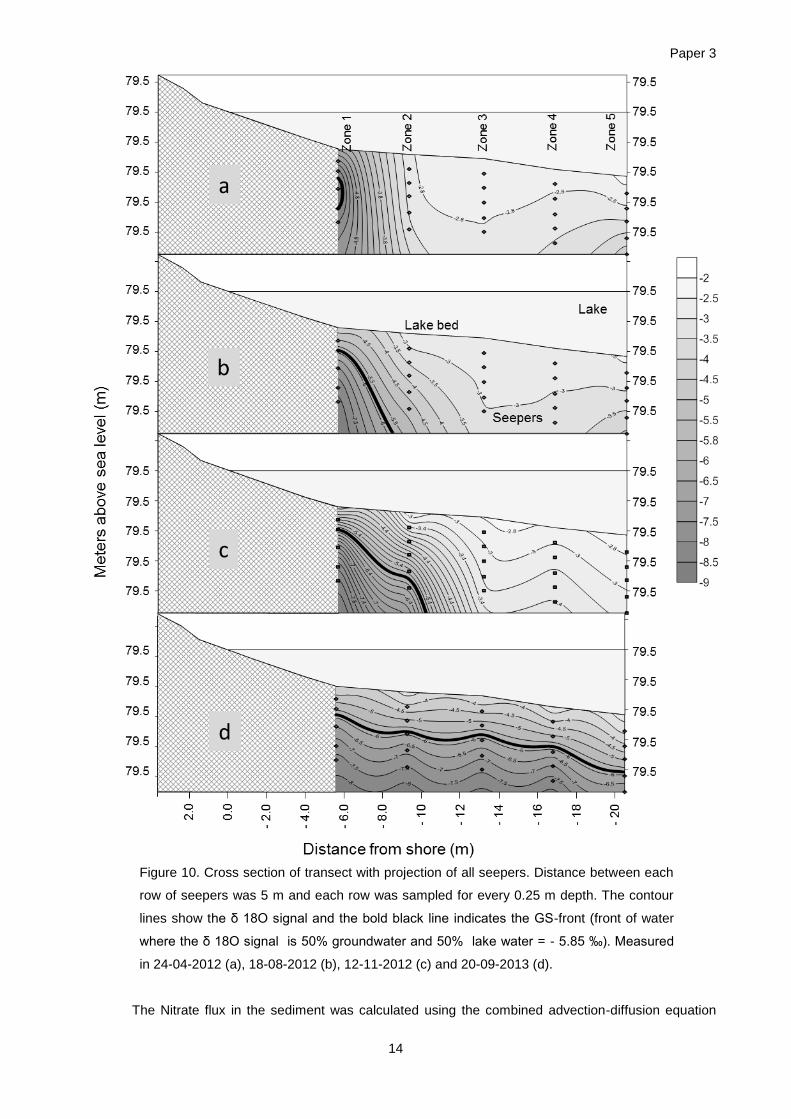
Paper 3
14
The Nitrate flux in the sediment was calculated using the combined advection-diffusion equation
Figure 10. Cross section of transect with projection of all seepers. Distance between each
row of seepers was 5 m and each row was sampled for every 0.25 m depth. The contour
lines show the δ 18O signal and the bold black line indicates the GS-front (front of water
where the δ 18O signal is 50% groundwater and 50% lake water = - 5.85 ‰). Measured
in 24-04-2012 (a), 18-08-2012 (b), 12-11-2012 (c) and 20-09-2013 (d).
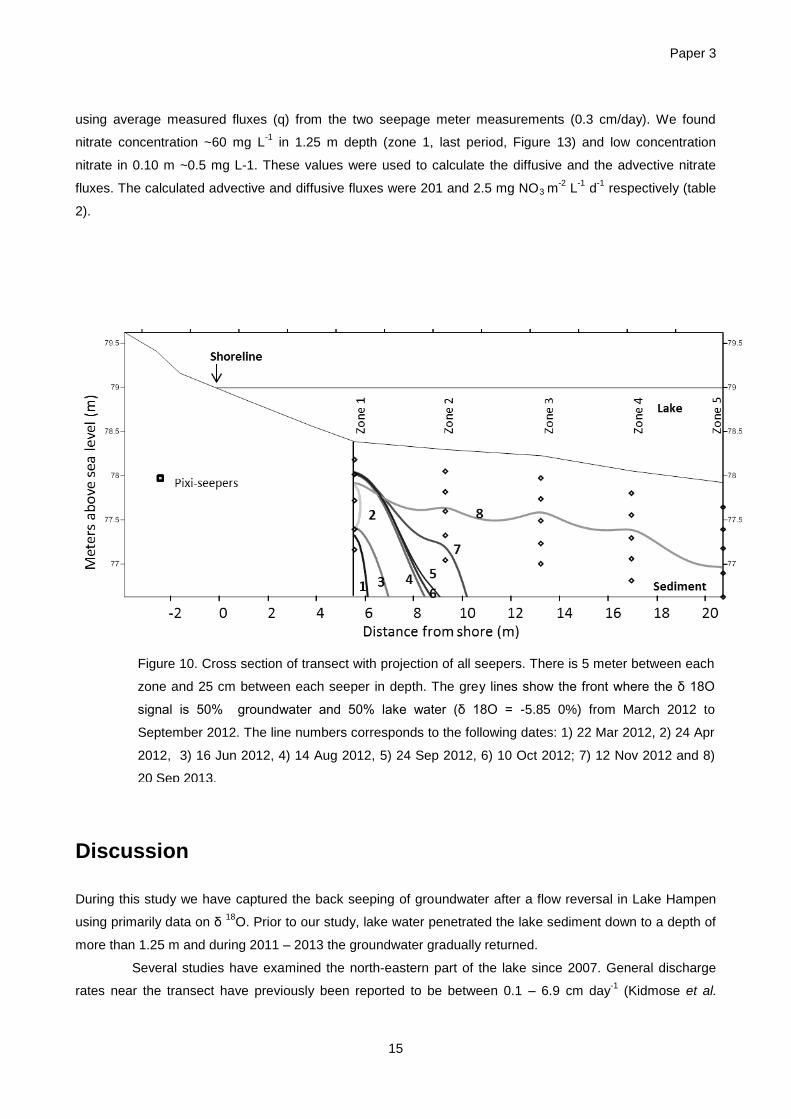
Paper 3
15
using average measured fluxes (q) from the two seepage meter measurements (0.3 cm/day). We found
nitrate concentration ~60 mg L-1
in 1.25 m depth (zone 1, last period, Figure 13) and low concentration
nitrate in 0.10 m ~0.5 mg L-1. These values were used to calculate the diffusive and the advective nitrate
fluxes. The calculated advective and diffusive fluxes were 201 and 2.5 mg NO3 m-2
L-1
d-1
respectively (table
2).
Discussion
During this study we have captured the back seeping of groundwater after a flow reversal in Lake Hampen
using primarily data on δ 18
O. Prior to our study, lake water penetrated the lake sediment down to a depth of
more than 1.25 m and during 2011 – 2013 the groundwater gradually returned.
Several studies have examined the north-eastern part of the lake since 2007. General discharge
rates near the transect have previously been reported to be between 0.1 – 6.9 cm day-1
(Kidmose et al.
Figure 10. Cross section of transect with projection of all seepers. There is 5 meter between each
zone and 25 cm between each seeper in depth. The grey lines show the front where the δ 18O
signal is 50% groundwater and 50% lake water (δ 18O = -5.85 0%) from March 2012 to
September 2012. The line numbers corresponds to the following dates: 1) 22 Mar 2012, 2) 24 Apr
2012, 3) 16 Jun 2012, 4) 14 Aug 2012, 5) 24 Sep 2012, 6) 10 Oct 2012; 7) 12 Nov 2012 and 8)
20 Sep 2013.
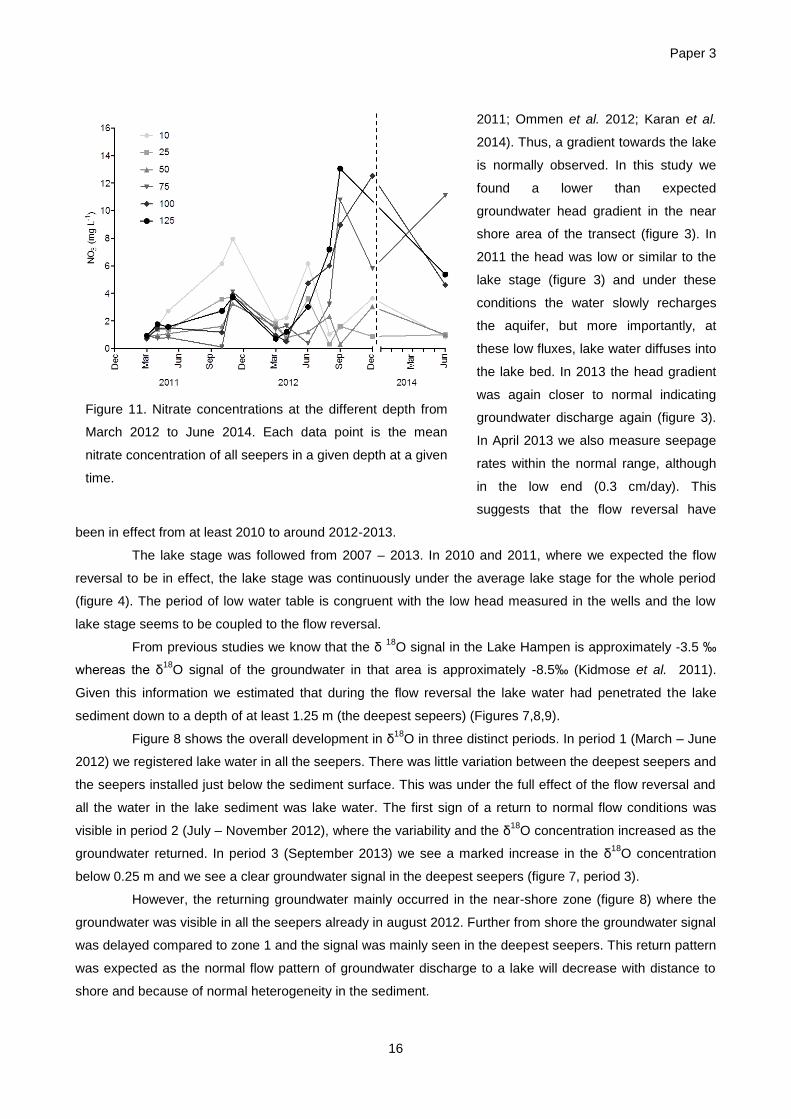
Paper 3
16
2011; Ommen et al. 2012; Karan et al.
2014). Thus, a gradient towards the lake
is normally observed. In this study we
found a lower than expected
groundwater head gradient in the near
shore area of the transect (figure 3). In
2011 the head was low or similar to the
lake stage (figure 3) and under these
conditions the water slowly recharges
the aquifer, but more importantly, at
these low fluxes, lake water diffuses into
the lake bed. In 2013 the head gradient
was again closer to normal indicating
groundwater discharge again (figure 3).
In April 2013 we also measure seepage
rates within the normal range, although
in the low end (0.3 cm/day). This
suggests that the flow reversal have
been in effect from at least 2010 to around 2012-2013.
The lake stage was followed from 2007 – 2013. In 2010 and 2011, where we expected the flow
reversal to be in effect, the lake stage was continuously under the average lake stage for the whole period
(figure 4). The period of low water table is congruent with the low head measured in the wells and the low
lake stage seems to be coupled to the flow reversal.
From previous studies we know that the δ 18
O signal in the Lake Hampen is approximately -3.5 ‰
whereas the δ18
O signal of the groundwater in that area is approximately -8.5‰ (Kidmose et al. 2011).
Given this information we estimated that during the flow reversal the lake water had penetrated the lake
sediment down to a depth of at least 1.25 m (the deepest sepeers) (Figures 7,8,9).
Figure 8 shows the overall development in δ18
O in three distinct periods. In period 1 (March – June
2012) we registered lake water in all the seepers. There was little variation between the deepest seepers and
the seepers installed just below the sediment surface. This was under the full effect of the flow reversal and
all the water in the lake sediment was lake water. The first sign of a return to normal flow conditions was
visible in period 2 (July – November 2012), where the variability and the δ18
O concentration increased as the
groundwater returned. In period 3 (September 2013) we see a marked increase in the δ18
O concentration
below 0.25 m and we see a clear groundwater signal in the deepest seepers (figure 7, period 3).
However, the returning groundwater mainly occurred in the near-shore zone (figure 8) where the
groundwater was visible in all the seepers already in august 2012. Further from shore the groundwater signal
was delayed compared to zone 1 and the signal was mainly seen in the deepest seepers. This return pattern
was expected as the normal flow pattern of groundwater discharge to a lake will decrease with distance to
shore and because of normal heterogeneity in the sediment.
Figure 11. Nitrate concentrations at the different depth from
March 2012 to June 2014. Each data point is the mean
nitrate concentration of all seepers in a given depth at a given
time.
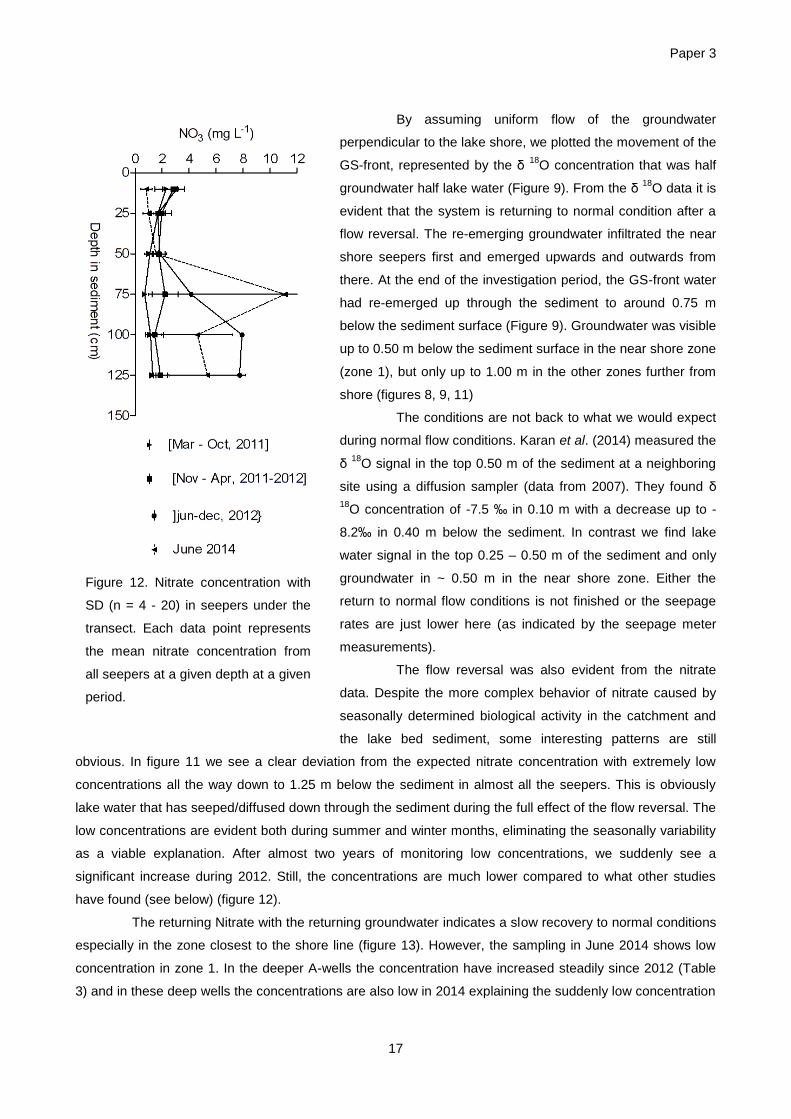
Paper 3
17
By assuming uniform flow of the groundwater
perpendicular to the lake shore, we plotted the movement of the
GS-front, represented by the δ 18
O concentration that was half
groundwater half lake water (Figure 9). From the δ 18
O data it is
evident that the system is returning to normal condition after a
flow reversal. The re-emerging groundwater infiltrated the near
shore seepers first and emerged upwards and outwards from
there. At the end of the investigation period, the GS-front water
had re-emerged up through the sediment to around 0.75 m
below the sediment surface (Figure 9). Groundwater was visible
up to 0.50 m below the sediment surface in the near shore zone
(zone 1), but only up to 1.00 m in the other zones further from
shore (figures 8, 9, 11)
The conditions are not back to what we would expect
during normal flow conditions. Karan et al. (2014) measured the
δ 18
O signal in the top 0.50 m of the sediment at a neighboring
site using a diffusion sampler (data from 2007). They found δ
18O concentration of -7.5 ‰ in 0.10 m with a decrease up to -
8.2‰ in 0.40 m below the sediment. In contrast we find lake
water signal in the top 0.25 – 0.50 m of the sediment and only
groundwater in ~ 0.50 m in the near shore zone. Either the
return to normal flow conditions is not finished or the seepage
rates are just lower here (as indicated by the seepage meter
measurements).
The flow reversal was also evident from the nitrate
data. Despite the more complex behavior of nitrate caused by
seasonally determined biological activity in the catchment and
the lake bed sediment, some interesting patterns are still
obvious. In figure 11 we see a clear deviation from the expected nitrate concentration with extremely low
concentrations all the way down to 1.25 m below the sediment in almost all the seepers. This is obviously
lake water that has seeped/diffused down through the sediment during the full effect of the flow reversal. The
low concentrations are evident both during summer and winter months, eliminating the seasonally variability
as a viable explanation. After almost two years of monitoring low concentrations, we suddenly see a
significant increase during 2012. Still, the concentrations are much lower compared to what other studies
have found (see below) (figure 12).
The returning Nitrate with the returning groundwater indicates a slow recovery to normal conditions
especially in the zone closest to the shore line (figure 13). However, the sampling in June 2014 shows low
concentration in zone 1. In the deeper A-wells the concentration have increased steadily since 2012 (Table
3) and in these deep wells the concentrations are also low in 2014 explaining the suddenly low concentration
Figure 12. Nitrate concentration with
SD (n = 4 - 20) in seepers under the
transect. Each data point represents
the mean nitrate concentration from
all seepers at a given depth at a given
period.
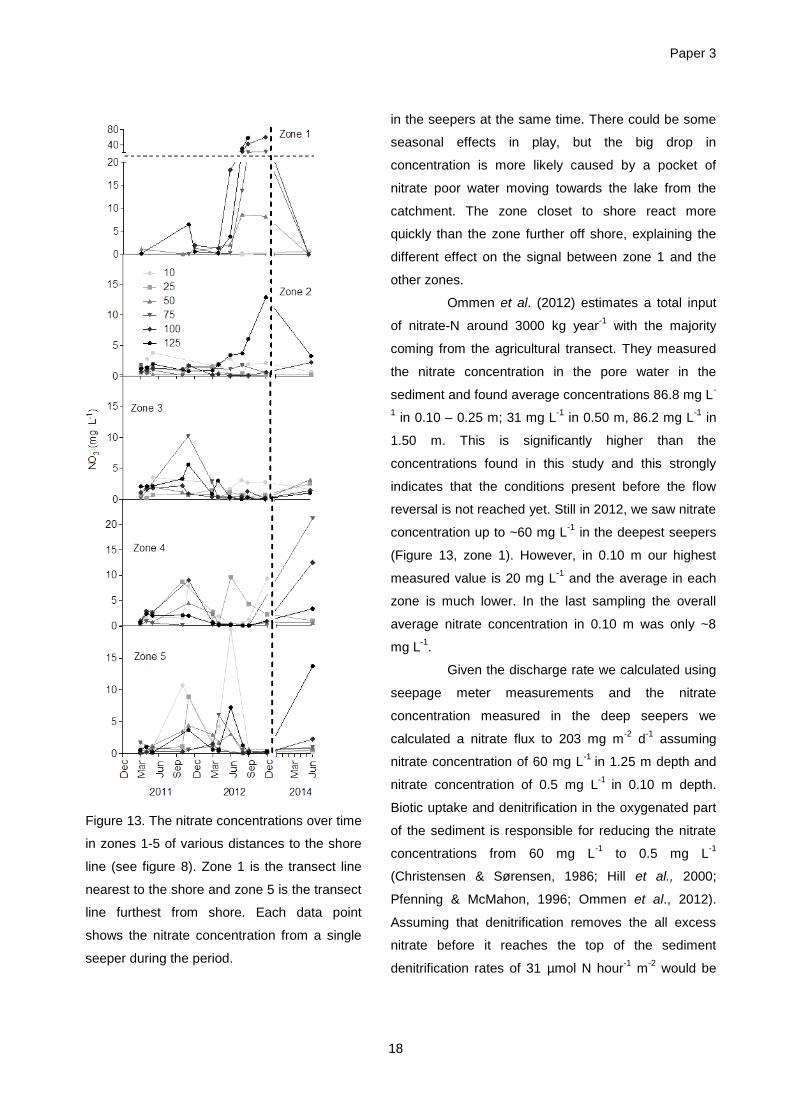
Paper 3
18
in the seepers at the same time. There could be some
seasonal effects in play, but the big drop in
concentration is more likely caused by a pocket of
nitrate poor water moving towards the lake from the
catchment. The zone closet to shore react more
quickly than the zone further off shore, explaining the
different effect on the signal between zone 1 and the
other zones.
Ommen et al. (2012) estimates a total input
of nitrate-N around 3000 kg year-1
with the majority
coming from the agricultural transect. They measured
the nitrate concentration in the pore water in the
sediment and found average concentrations 86.8 mg L-
1 in 0.10 – 0.25 m; 31 mg L
-1 in 0.50 m, 86.2 mg L
-1 in
1.50 m. This is significantly higher than the
concentrations found in this study and this strongly
indicates that the conditions present before the flow
reversal is not reached yet. Still in 2012, we saw nitrate
concentration up to ~60 mg L-1
in the deepest seepers
(Figure 13, zone 1). However, in 0.10 m our highest
measured value is 20 mg L-1
and the average in each
zone is much lower. In the last sampling the overall
average nitrate concentration in 0.10 m was only ~8
mg L-1
.
Given the discharge rate we calculated using
seepage meter measurements and the nitrate
concentration measured in the deep seepers we
calculated a nitrate flux to 203 mg m-2
d-1
assuming
nitrate concentration of 60 mg L-1
in 1.25 m depth and
nitrate concentration of 0.5 mg L-1
in 0.10 m depth.
Biotic uptake and denitrification in the oxygenated part
of the sediment is responsible for reducing the nitrate
concentrations from 60 mg L-1
to 0.5 mg L-1
(Christensen & Sørensen, 1986; Hill et al., 2000;
Pfenning & McMahon, 1996; Ommen et al., 2012).
Assuming that denitrification removes the all excess
nitrate before it reaches the top of the sediment
denitrification rates of 31 µmol N hour-1
m-2
would be
Figure 13. The nitrate concentrations over time
in zones 1-5 of various distances to the shore
line (see figure 8). Zone 1 is the transect line
nearest to the shore and zone 5 is the transect
line furthest from shore. Each data point
shows the nitrate concentration from a single
seeper during the period.
Paper 3
19
needed. In comparison Christensen and Sørensen (1986) found denitrification rates in Lake Hampen ~50
µmol N hour-1
m-2
for a system with low nitrate concentrations. However, when supplying nitrate, they saw a
7-fold increase in denitrification activity reaching rates of 225 – 350 µmol N h-1
m-2
. Given this, our
denitrification rates are low and they will possibly increase as the nitrate returns to the system.
In this study we have a long term flow reversal probably caused by meteorological factors.
First of all we observe a falling lake stage and groundwater head in the near shore areas in 2010
and 2011. The total precipitation decreased from 913 mm in 2007 and 875 mm in 2008 to 754 and 704 mm
in 2009 and 2010, respectively. This could affect both the lake stage directly but also the groundwater head,
due to lower infiltration (Downing and Peterka, 1978; Sacks et al., 1992; Rosenberry & Winter, 1997). At the
same time, the air temperature in the winter period dropped in 2009 and 2010 why a larger proportion of the
precipitation in those years fell as snow, with a following lower infiltration rate.
However, none of the meteorological data are very extreme seen in a historical time frame, and if
these factors lead to a groundwater reversal in Lake Hampen, it should be anticipated that the lake possibly
have undergone several groundwater reversals back in time.
When we refer to the normal flow conditions in the lake by inspecting the results from the more
extensive monitoring of the lake that started in 2007 with Kidmose et al. (2011), Ommen et al. (2012) and
Karan et al. (2014), we might be mistaken. During this period the climate was relatively wet and warm. The
head gradient in this period was higher. Hence, the findings from this period could give a skewed idea of the
normal flow conditions at the lake. Given all these findings we must conclude that the hydrology in and
around Lake Hampen are more complex than we previously expected. Temporal and spatial variation in the
in- and outputs are quite significant and to fully understand the system, data on a historical time scale as well
as on different spatial scales are needed.
A flow reversal can have an impact on the ecology of the system. In freshwater lakes the chemistry
in the surface water can be seen as an integrated response to all the catchment specific in- and outputs as
well as the in-lake processes (Krabbenhoft & Webster 1995; Gurrieri & Furniss 2004; Rimmer et al., 2006).
Groundwater seepage discharge can have a significant effect on the plant community associated with the
local discharge zones as shown by Frandsen et al. (2012). During a flow reversal plants benefiting from the
groundwater supply of nutrients will be affected. On a larger scale prolonged flow reversal might affect the
ion-balance of the entire system, especially in systems where the in- and outputs mainly takes place through
groundwater seepage hereby affecting not only the littoral communities associated with the sedimentary
conditions but also the planktonic species in the surface water.
Acknowledgements
This project was founded by The Danish Council for Independent Research – Nature and Universe. We like
to thank Mithra Christin Hajati and Kristian Färkkilä Knudsen and Carlos Duque Calvache for valuable help.
Paper 3
20
References
Ala-Aho, P., P.M. Rossi, and B. Kløve, 2013, Interaction of esker groundwater with headwater lakes and
streams, Journal of hydrology. 500: 144-156
Appelo, C.A. J. & Postma, D. Geochemistry, Groundwater and pollution. 2005. A.A. Balkema publishers.
458-462
Anderson, M. P., Cheng, X. 1993. Long. And short-term transience in a groundwater/lake system in
Wisconsin, USA. Journal of Hydrology. 145: 1-18
Anderson, M. P., Munter, J. A. 1981. Seasonal reversals of groundwater flow around lakes and the relevance
to stagnation points and lake budgets. Water. Resour. Res. 17. 1139-1150
Brock, T. V., Lee, D. R., Janes, D. J., Winek, D. 1982. Ground water seepage as a nutrient source to a
drainage lake, Lake Medota, Wisconsin. Water research. 16: 1255-1263
Cheng, X., Anderson, M. P. 1994. Simulating the influence of lake position on groundwater fluxes. Water
Resources Research. 30(7): 2041-2049
Cherkauer, D. S. and Hensel, B. R. 1986. Groundwater flow into Lake Michigan from Wisconsin. Journal of
hydrology. 84: 261-271
Cherkauer, D. S. Zager, J. P. 1989. Groundwater interactions with a kettle-hole lake: relation of observation
to digital simulations. Journal of Hydrology. 109: 167-184.
Christensen, P. B. Sørensen, J. 1986. Temporal variation of denitrification activity in plant-covered, littoral
sediment from lake Hampen, Denmark. Applied and Environmental Microbiology. 51(6): 1174 – 1179
Downing, J. A., Peterka, J. J. 1978. Relationship of rainfall and lake groundwater seepage. Limnology and
Oceanography. 23(4): 821-825
Fellows, C. R. Brezonik, P. L. 1980. Seepage flow into Florida lakes. Water Resources Bulletin. 16(4): 635-
641
Frandsen, M., Nilsson, B., Engesgaard, P., Pedersen, O. 2012. Groundwater seepage stimulates the growth
of aquatic macrophytes. Freshwater Biology. 57(5): 907-921
Gurrieri, J. T., Furniss, G. 2004. Estimation of groundwater exchange in alpine lakes using non-steady mass-
balance methods. Journal of hydrology. 297(1/4):187-208
Hagerthey, S. E., Kerfoot, W. C. 1998. Groundwater flow influences the biomass and nutrient ratios of
epibenthic algae in a north temperate seepage lake. Limnology and Oceanography. 43(6): 1227-1242
Hayashi, M., Rosenberry, D. O. 2002. Effects of ground water exchange on the hydrology and ecology of
surface water. Groundwater. 40(3): 309-316
Hancock, P. J., Bouton, A. J., Humphreus, W. F. 2005. Aquifers and hyporheic zones: Towards an ecological
understanding of groundwater. Hydrogeol. J. 13: 98-111
Hill, A. R., Devito, K. J., Campagnolo, S. Sanmugadas, K. 2000. Subsurface denitrification in a forest riparian
zone: interactions between hydrology and supplies of nitrate and organic carbon. Biogeochemistry. 51:
193-223
Paper 3
21
Karan, S., Kidmose, J., Engesgaard, P., Nilsson, B., Frandsen, M., Omen, D. A .O., Flint, M. R., Andersen,
F. Ø., Pedersen, O. 2014. Role of a groundwater-Lake interface in controlling seepage of water and
nitrate. Journal of Hydrology. 517: 791-802
Kidmose J., Engesgaard P., Nilsson B., Laier T., Looms M.C. 2011. Spatial distribution of seepage to a flow
through lake: Lake Hampen, Western Denmark. Vadose Zone. Special HOBE issue. 10:110-124
Krabenhoft, D. P., Anderson, M. P., Bowser, C. J. 1990. Estimating groundwater exchange with lakes, 2.
Calibration of a three- dimensional solute transport model to a stable isotope plume. Water Resources
research. 26: 2455 – 2462
Krabenhoft, D. P., Webster, K. E. 1995. Transient hydrogeological controls on the chemistry of a seepage
lake. Water Resources Research. 31(9): 2295-2305
LaBaugh, J. W., Winter, T. C., Adomaitis, V. A., Swanson, G. A. 1987. Hydrology and chemistry of selected
prairie wetlands in the Cottonwood lake area, Stutsman County, North Dakota, 1979-1982. Us
Geological Survey. Prof.Pap., 1431, 26
Lee, D. R. 1977. A Device for measuring seepage flux in lakes and estuaris. Limnology and Oceanography.
22(1): 140-147
Lee, D.R., Cherry J.A., Pickens, J.F. 1980. Groundwater transport of a salt tracer through a sandy lakebed.
Limnol.Oceanogr. 25:45-61
Libelo, E. L. MacIntyre, W. G. 1994. Effects of surface-water movement on seepage-meter measurements of
flow through the sediment-water interface. Hydrogeology Journal. 2(4): 49-54
McBride, M.S., Pfannkuch, H. O. 1975. The distribution of seepage within lakebeds. J. Res. USGS. 3: 505-
512
Meyboom, P. 1967. Mass transfer studies to determine the groundwater regime of permanent lakes in
hummocky moraine of western Canada. Journal of Hydrology. 5: 117-142
Ommen, D.A., Kidmose, J., Karan S., Flindt, M. R., Engesgaard, P., Nilsson, B., Andersen, F.Ø. 2012.
Importance of groundwater and macrophytes for the nutrient balance at oligotrophic Lake Hampen,
Denmark. Ecohydrology, 5(3): 286-296
Pfannkuch, H.O. ,Winter T.C. 1984. Effect of anisotropy and groundwater system geometry on seepage
through lakebeds. Journal of hydrology. 75: 213-237
Pfenning, K.S., McMahon, P. B. 1996. Effect of nitrate, organic carbon, and temperature on potential
denitrification rates in nitrate-rich riverbed sediments. Journal of Hydrology. 187: 283-295
Rimmer, A., Boger, M., Aota, Y., Kumagai, M. 2006. A lake as a natural integrator of linear processes:
Application to Lake Kinnert (Israel) and Lake Biwa (Japan). Journal of hydrology. 319(1-4): 163-175
Rittmann, B.E., Manem, J. A. 1991. Development and experimental evaluation of a steady-state,
multispecies biofilm model. Biotechnology and bioengineering. 39: 914-922
Rosenberry, D.O. (2005). Integrating seepage heterogeneity with the use of ganged seepage meters.
Limnol. Oceanogr. Methods. 3: 131-142
Rosenberry, D. O. LaBaugh, J. W. 2008. Field techniques for estimating water fluxes between surface water
and groundwater. USGS. Techniques and methods. 4-2D: 64
Paper 3
22
Rosenberry, D. O., Winter, T. C. 1997. Dynamics of water-table fluctuations in an upland between two
prairie-pothole wetlands in North Dakota. Journal of Hydrology. 191: 226-289
Sacks, L. A., Herman, J. S., Konikow, L. F., Vela, A. L. 1992. Seasonal dynamics of groundwater-lake
interactions at doñana National Park, Spain. Journal of Hydrologi. 136: 123-154
Scharling, M. 1999. Klimagrid – Danmark, Nedbør, lufttemperatur og potential fordampning 20*20 og 40*40
km. Danish Meteorological Institute. Technical report. 99-12
Sear, D. A., Armitage, P. D., Dawson, F. H. 1999. Groundwater dominated rivers. Hydrological processes.
13: 255-276
Sebestyen, S. D., Schneider, R. L. 2004. Seepage patterns pore water and aquatic macrophytes:
hydrological and biogeochemical relationship in lakes. Biogeochemistry. 68: 383-409
Shaw, R. D., Prepas, E. E. 1989. Anomalous, short-term influx of water into seepage meters. Limnology and
oceanography. 34(7):1343-1351
Shaw, R. D., Prepas, E. E. 1990. Groundwater-lake interactions II. Nearshore seepage patterns and the
contribution of ground water to lakes in central Alberta. Journal of Hydrology. 119: 121-136
Steinwand, A. L., Richardson. L. 1989. Gypsum occurrence in soils on the margin of semipermanent prairie
pothole wetlands. J. Soil. Sci. Soc. Am. 53(3): 836-842
Tóth, J. 1999. Groundwater as a geologic agent: An overview of the causes, processes, and manifestations.
Hydrogeology Jounal. 7: 1-14
Winter, T.C. 1978. Numerical simulation of steady state three-dimensional groundwater flow near lakes,
Water Resour. Res. 14: 245-254
Winter , T. C. 1983. The interaction of lakes with variability saturated porous media. Water Resour. Res. 19:
1203-1218
Winter, T. C. 1986. Effect of groundwater recharge on configuration of water table beneath sand dunes and
on seepage in lakes in the sandhills of Nebraska. Journal of Hydrology. 86: 221-237
Winter, T. C. 1999. Relation of streams, lakes, and wetlands to groundwater flow systems. Hydrogeology
Journal.7(1): 2

Paper 3
23

Paper 3
24
1
Paper 4
Using whole-system understanding to evaluate long
term development in alkalinity in a northern flow
through lake
Mette Cristine Schou Frandsen, Peter Engesgaard, Bertel Nilsson, Ole Pedersen

2
Paper 4
1
Using whole-system understanding to evaluate long term
development in alkalinity in a northern flow through lake
Mette Frandsen*, ^, Peter Engesgaard+, Bertel Nilsson^ Ole Pedersen*
*The freshwater Biological Laboratory, Department of Biology, University of Copenhagen, Hillerød, Denmark
^The Geological Survey of Denmark and Greenland, Copenhagen, Denmark
+Department of Geography and Geology, University of Copenhagen, Denmark
Abstract
The alkalinity in Lake Hampen, Denmark has increased from the mid-1970s until the mid-1990s. The lake
receives large amounts of nitrate from a bordering agricultural area. In this study it was examined if
denitrification of nitrate discharging to the lake from an agriculture located just north-East of the lake was of a
magnitude large enough to stoichiometrically explain the observed alkalinity development in the lake. Using
historical data on alkalinity, electrical conductivity (EC) and nitrate in the surface water and a simple mass
balance equation we estimated the historical input of nitrate to the lake. By using historical data on the EC in
the surface water we were able to use the mass balance equation to estimate the historical input of EC from
the groundwater. Nitrate is the dominant ion in the area and EC and nitrate are strongly correlated in the
ground water. Calculating the historical EC in the groundwater we could use the correlation to estimate the
historical nitrate in the groundwater and hence the historical input of nitrate via the groundwater. By
assuming the excess nitrate was denitrified, we calculated the corresponding alkalinity production.
By using this simple approach we were able to relatively accurately model the historical changes in
alkalinity. The denitrification rates we estimated are in good agreement with what other studies have found in
the lake. In conclusion, our study strongly suggests that the changes in alkalinity in Lake Hampen are mainly
caused by denitrification of nitrate discharging in large amounts to the lake from the agricultural area.
Introduction
One of the main goals in water management is to handle and find solutions in relation to obtaining and
maintaining favorable ecological status in wetlands (i.e. lakes, streams). Numerous factors threaten these
ecosystems; the more important ones on the northern hemisphere being pollution and eutrophication
(Brønmark & Hansson 2002; Brinson & Malvarez 2002). Part of the land-derived pollutants or nutrients
enters lakes and streams through groundwater seepage and understanding the interactions between
Paper 4
2
groundwater and surface water are becoming increasingly relevant in order to solve many of the challenges
posed by the Habitat and Water Framework directive (HD and WFD).
At catchment scale groundwater-surface water systems are complex united water bodies of
interrelated hydrological, biological, and chemical processes. In order to understand the impact on surface
water from the surrounding catchment, data on different scales and related to different disciplines are
required (Zalewski, 2002). These interrelationships are complex and the lack of sufficient spatial and
temporal data to estimate the total in- and outputs are often not available and, if available, they often
represent point scale measurements (Moss, 1999; Rodriguez-Iturbe, 2000). Up-scaling point observations to
whole system analysis are often succumbed to high uncertainty, and tend to be unique to the given system
they describe. Hence, one of the major challenges in water management is one of scale in space and time
and data availability.
One way to overcome these challenges is to use historical data and try to explore temporal trends
and couple these trends to the overall in- and outputs of the whole system. In freshwater lakes, the changes
in water quality can be seen as an integrated response to all the catchment specific in- and outputs as well
as the in-lake processes (Krabbenhoft & Webster, 1995; Gurrieri & Furniss, 2004; Rimmer et al., 2006).
Hereby, the lakes acts as a sentinel, tracking changes in the catchment (Williamson et al. 2009) and they are
able to retain a solute influx memory storing information about the lake-watershed-climate relationship in the
past (Rimmer et al. 2006). This memory is available in the form of chemical surface water data containing
more information about the overall in- and outputs of a system, than point scale measurements. In the
surface water, seasonal mixing ensures an overall representative measure for the net effect of all in- and
outputs. In groundwater, little mixing occurs and extrapolation of data collected from point measurements
can be highly uncertain. If the hydrology of the system is understood with the in- and outputs of water known
for a given system, then time series of solute concentrations in the surface water can be used as proxy for
estimating the net loading of solutes to the surface water (Rimmer et al. 2006).
Both an increase in nutrient addition to a lake and the following increase in primary production will
affect the alkalinity of the system (Davison 1986). Eutrophication and internal alkalinity production is
interlinked (Sigg et al., 1991; Davidson, 1986; Schindler et al. 1986) as the alkalinity production is driven by
reduction of the major anions such as sulfate and nitrate (Schindler 1986; Rudd et al. 1986). In soft water
lakes these processes can be significant factors in regulating the acid-base system (Davidson, 1986). As a
consequence, the alkalinity in many soft water lakes has increased as an effect of increased nutrient loading
during the past 50 years (Sutcliffe et al. 1982).
When investigations of alkalinity changes of freshwater lakes started in the early 1930s, it was
predominantly assumed that alkalinity production primarily derived from ion exchange and weathering of
terrestrial soils and rocks (Schindler, 1986). From the late 1970s, in-lake processes such as sulfate reduction
(Hongve, 1878; Schindler et al. 1980; Cook et al. 1986), biological productivity (Kelly et al. 1987), and
denitrification (Davidson 1986, Schindler, 1986) were included. In 1986, Schindler et al. found that in-lake
alkalinity was higher than in the inflowing streams, pointing towards the importance of internal sources of
alkalinity. They showed that more than half of the in-lake alkalinity production was biological rather than
Paper 4
3
geochemical. The major alkalinity generating processes were the reduction of SO42-
, exchange of H+ for Ca
2+
in sediments and biological reduction of NO3- (denitrification).
More recently it has been acknowledged that when investigating alkalinity changes over long time
scales, historical factors may be important. With the introduction of the combustion engine and the electrical
power generation in the 1900th century, acid rain from oxidation of fossil fuels, increased in most parts of
Europe (Schindler 1988). In Denmark, sulfate concentration in precipitation increased by 50% from the late
1950s to the early 1970s (Rohde & Rood, 1984) having a significant effect on the alkalinity of some inland
lakes (i.e. sulfate reduction).
Lakes connected to cultivated land through groundwater flow can be subjected to large amounts of
nitrate input. The anaerobic denitrifiers need nitrogen in the form of NO3-(nitrate) and this is often supplied
from the aerobic nitrifying processes where NH4+ (ammonium) is oxidized to NO2
-/NO3
- (Appelo & Postma,
2005). However, if the nitrogen is readily supplied in the form of nitrate, the denitrifiers only need a sufficient
electron donor (i.e. carbon, pyrite or Fe2+
) to drive denitrification. Hence, in lakes with cultivated catchments,
the alkalinity generation through denitrification can play a significant role in the alkalinity generation in a lake.
Alkalinity generation coupled to denitrification primarily takes place at the sediment-water-interface
(SWI) under anoxic conditions (Appelo & Postma 2005).
6NO3- + 5 CH3OH 3N2 + 5CO2 + 7H2O + 6OH
-
It follows that one mole of alkalinity is produced, when one mole of nitrate is removed. As long as there is a
sufficient pool of inorganic carbon the denitrification rates are coupled to the accessibility to nitrate. This
process can be very distinct in space. Hill et al. (2000) show that denitrification hotspots occur in terrestrial
areas where nitrogen in the form of nitrate is available through groundwater. The same can be the case near
lakes, where nitrate from surrounding cultivated land is transported to the SWI. Hence, in lakes that receive
large amounts of nitrate-rich water, the alkalinity of the system can be greatly affected.
In this study we examined if historical nitrate input to Lake Hampen, Denmark, can explain the
observed increase in alkalinity from the early 1970s until the mid-1990s by using a simple mass balance
approach and data on end members of water entering the lake. Previous studies have found that the
agricultural input of nitrate accounts for up to 67% of the total nitrogen input to the lake, even though it only
account for 23% of the groundwater discharge to the system (Kidmose et al. 2014).
As a result it is shown that changes in nitrate input can lead to changes in the denitrification
processes at the SWI, and that the magnitude of these changes can account for the alkalinity increase
observed in the system.
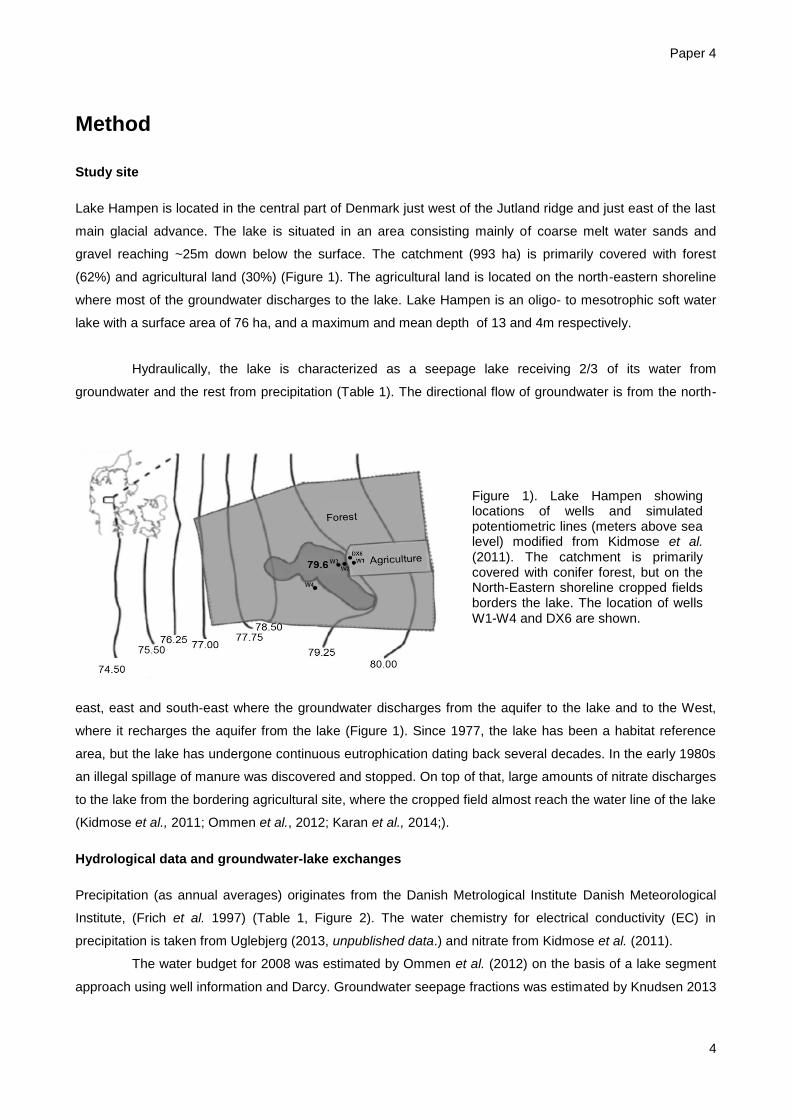
Paper 4
4
Method
Study site
Lake Hampen is located in the central part of Denmark just west of the Jutland ridge and just east of the last
main glacial advance. The lake is situated in an area consisting mainly of coarse melt water sands and
gravel reaching ~25m down below the surface. The catchment (993 ha) is primarily covered with forest
(62%) and agricultural land (30%) (Figure 1). The agricultural land is located on the north-eastern shoreline
where most of the groundwater discharges to the lake. Lake Hampen is an oligo- to mesotrophic soft water
lake with a surface area of 76 ha, and a maximum and mean depth of 13 and 4m respectively.
Hydraulically, the lake is characterized as a seepage lake receiving 2/3 of its water from
groundwater and the rest from precipitation (Table 1). The directional flow of groundwater is from the north-
east, east and south-east where the groundwater discharges from the aquifer to the lake and to the West,
where it recharges the aquifer from the lake (Figure 1). Since 1977, the lake has been a habitat reference
area, but the lake has undergone continuous eutrophication dating back several decades. In the early 1980s
an illegal spillage of manure was discovered and stopped. On top of that, large amounts of nitrate discharges
to the lake from the bordering agricultural site, where the cropped field almost reach the water line of the lake
(Kidmose et al., 2011; Ommen et al., 2012; Karan et al., 2014;).
Hydrological data and groundwater-lake exchanges
Precipitation (as annual averages) originates from the Danish Metrological Institute Danish Meteorological
Institute, (Frich et al. 1997) (Table 1, Figure 2). The water chemistry for electrical conductivity (EC) in
precipitation is taken from Uglebjerg (2013, unpublished data.) and nitrate from Kidmose et al. (2011).
The water budget for 2008 was estimated by Ommen et al. (2012) on the basis of a lake segment
approach using well information and Darcy. Groundwater seepage fractions was estimated by Knudsen 2013
Figure 1). Lake Hampen showing locations of wells and simulated potentiometric lines (meters above sea level) modified from Kidmose et al. (2011). The catchment is primarily covered with conifer forest, but on the North-Eastern shoreline cropped fields borders the lake. The location of wells W1-W4 and DX6 are shown.
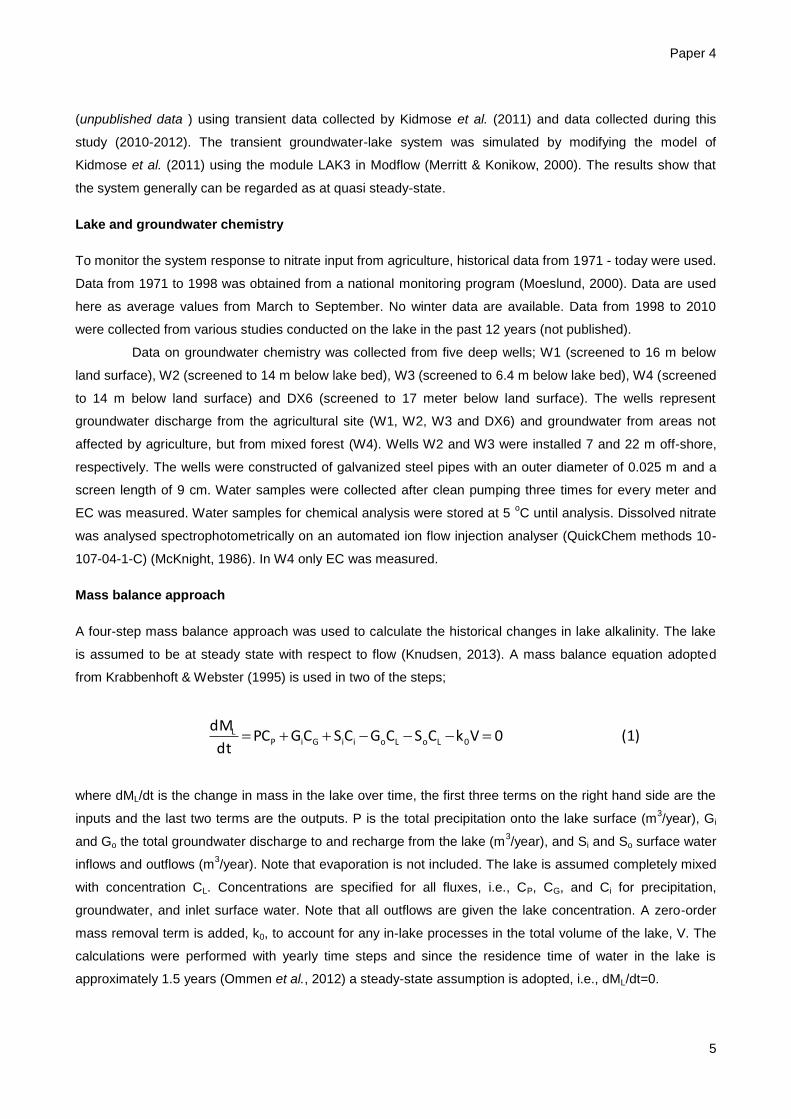
Paper 4
5
(unpublished data ) using transient data collected by Kidmose et al. (2011) and data collected during this
study (2010-2012). The transient groundwater-lake system was simulated by modifying the model of
Kidmose et al. (2011) using the module LAK3 in Modflow (Merritt & Konikow, 2000). The results show that
the system generally can be regarded as at quasi steady-state.
Lake and groundwater chemistry
To monitor the system response to nitrate input from agriculture, historical data from 1971 - today were used.
Data from 1971 to 1998 was obtained from a national monitoring program (Moeslund, 2000). Data are used
here as average values from March to September. No winter data are available. Data from 1998 to 2010
were collected from various studies conducted on the lake in the past 12 years (not published).
Data on groundwater chemistry was collected from five deep wells; W1 (screened to 16 m below
land surface), W2 (screened to 14 m below lake bed), W3 (screened to 6.4 m below lake bed), W4 (screened
to 14 m below land surface) and DX6 (screened to 17 meter below land surface). The wells represent
groundwater discharge from the agricultural site (W1, W2, W3 and DX6) and groundwater from areas not
affected by agriculture, but from mixed forest (W4). Wells W2 and W3 were installed 7 and 22 m off-shore,
respectively. The wells were constructed of galvanized steel pipes with an outer diameter of 0.025 m and a
screen length of 9 cm. Water samples were collected after clean pumping three times for every meter and
EC was measured. Water samples for chemical analysis were stored at 5 oC until analysis. Dissolved nitrate
was analysed spectrophotometrically on an automated ion flow injection analyser (QuickChem methods 10-
107-04-1-C) (McKnight, 1986). In W4 only EC was measured.
Mass balance approach
A four-step mass balance approach was used to calculate the historical changes in lake alkalinity. The lake
is assumed to be at steady state with respect to flow (Knudsen, 2013). A mass balance equation adopted
from Krabbenhoft & Webster (1995) is used in two of the steps;
(1)0VkCSCGCSCGPCdt
dM0LoLoiiGiP
L
where dML/dt is the change in mass in the lake over time, the first three terms on the right hand side are the
inputs and the last two terms are the outputs. P is the total precipitation onto the lake surface (m3/year), Gi
and Go the total groundwater discharge to and recharge from the lake (m3/year), and Si and So surface water
inflows and outflows (m3/year). Note that evaporation is not included. The lake is assumed completely mixed
with concentration CL. Concentrations are specified for all fluxes, i.e., CP, CG, and Ci for precipitation,
groundwater, and inlet surface water. Note that all outflows are given the lake concentration. A zero-order
mass removal term is added, k0, to account for any in-lake processes in the total volume of the lake, V. The
calculations were performed with yearly time steps and since the residence time of water in the lake is
approximately 1.5 years (Ommen et al., 2012) a steady-state assumption is adopted, i.e., dML/dt=0.
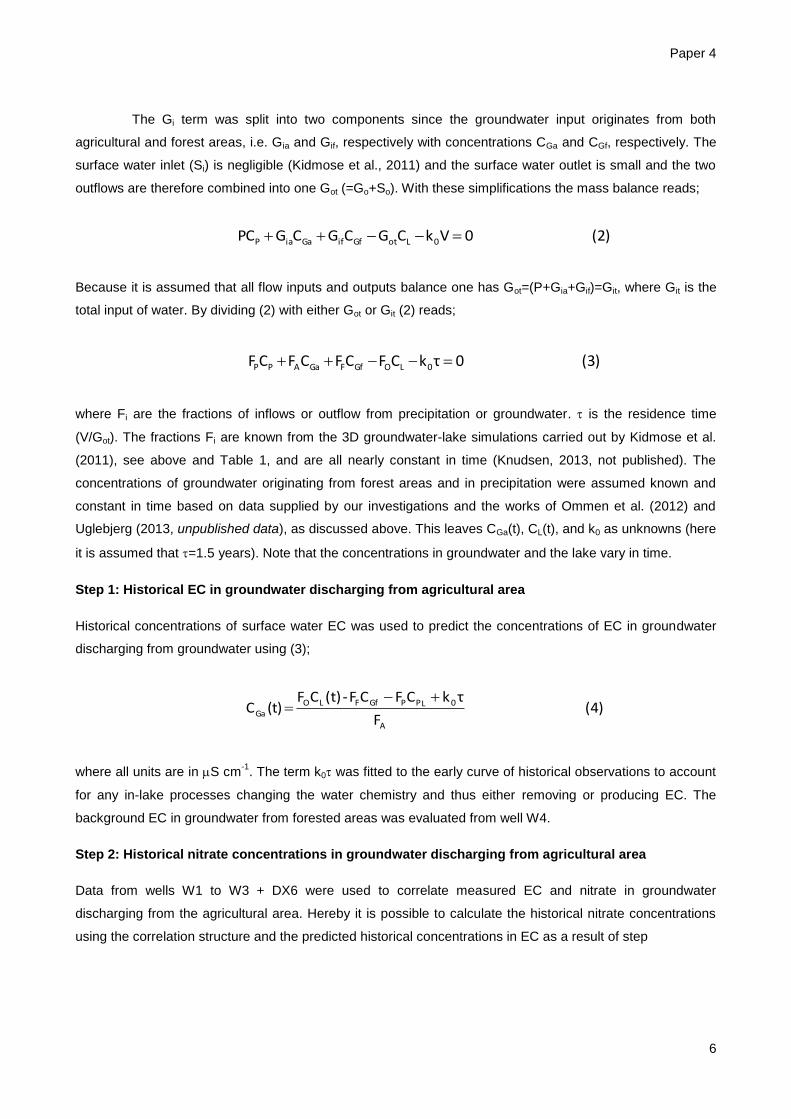
Paper 4
6
The Gi term was split into two components since the groundwater input originates from both
agricultural and forest areas, i.e. Gia and Gif, respectively with concentrations CGa and CGf, respectively. The
surface water inlet (Si) is negligible (Kidmose et al., 2011) and the surface water outlet is small and the two
outflows are therefore combined into one Got (=Go+So). With these simplifications the mass balance reads;
(2)0VkCGCGCGPC 0LotGfifGaiaP
Because it is assumed that all flow inputs and outputs balance one has Got=(P+Gia+Gif)=Git, where Git is the
total input of water. By dividing (2) with either Got or Git (2) reads;
(3)0τkCFCFCFCF 0LOGfFGaAPP
where Fi are the fractions of inflows or outflow from precipitation or groundwater. is the residence time
(V/Got). The fractions Fi are known from the 3D groundwater-lake simulations carried out by Kidmose et al.
(2011), see above and Table 1, and are all nearly constant in time (Knudsen, 2013, not published). The
concentrations of groundwater originating from forest areas and in precipitation were assumed known and
constant in time based on data supplied by our investigations and the works of Ommen et al. (2012) and
Uglebjerg (2013, unpublished data), as discussed above. This leaves CGa(t), CL(t), and k0 as unknowns (here
it is assumed that =1.5 years). Note that the concentrations in groundwater and the lake vary in time.
Step 1: Historical EC in groundwater discharging from agricultural area
Historical concentrations of surface water EC was used to predict the concentrations of EC in groundwater
discharging from groundwater using (3);
(4)F
τkCFCF -(t)CF)t(C
A
0LPPGfFLOGa
where all units are in S cm-1
. The term k0 was fitted to the early curve of historical observations to account
for any in-lake processes changing the water chemistry and thus either removing or producing EC. The
background EC in groundwater from forested areas was evaluated from well W4.
Step 2: Historical nitrate concentrations in groundwater discharging from agricultural area
Data from wells W1 to W3 + DX6 were used to correlate measured EC and nitrate in groundwater
discharging from the agricultural area. Hereby it is possible to calculate the historical nitrate concentrations
using the correlation structure and the predicted historical concentrations in EC as a result of step
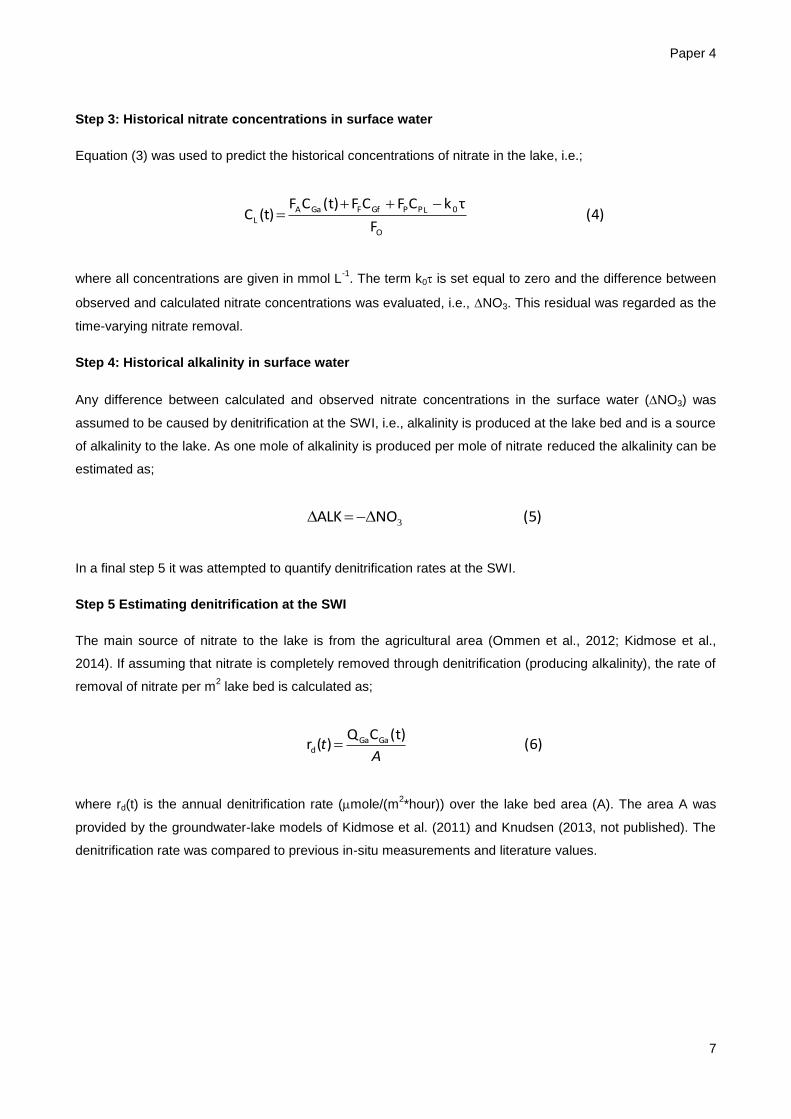
Paper 4
7
Step 3: Historical nitrate concentrations in surface water
Equation (3) was used to predict the historical concentrations of nitrate in the lake, i.e.;
(4)F
τkCFCF (t)CF)t(C
O
0LPPGfFGaAL
where all concentrations are given in mmol L-1
. The term k0 is set equal to zero and the difference between
observed and calculated nitrate concentrations was evaluated, i.e., NO3. This residual was regarded as the
time-varying nitrate removal.
Step 4: Historical alkalinity in surface water
Any difference between calculated and observed nitrate concentrations in the surface water (NO3) was
assumed to be caused by denitrification at the SWI, i.e., alkalinity is produced at the lake bed and is a source
of alkalinity to the lake. As one mole of alkalinity is produced per mole of nitrate reduced the alkalinity can be
estimated as;
(5)NOALK 3
In a final step 5 it was attempted to quantify denitrification rates at the SWI.
Step 5 Estimating denitrification at the SWI
The main source of nitrate to the lake is from the agricultural area (Ommen et al., 2012; Kidmose et al.,
2014). If assuming that nitrate is completely removed through denitrification (producing alkalinity), the rate of
removal of nitrate per m2 lake bed is calculated as;
(6)(t)CQ
)(r GaGad
At
where rd(t) is the annual denitrification rate (mole/(m2*hour)) over the lake bed area (A). The area A was
provided by the groundwater-lake models of Kidmose et al. (2011) and Knudsen (2013, not published). The
denitrification rate was compared to previous in-situ measurements and literature values.
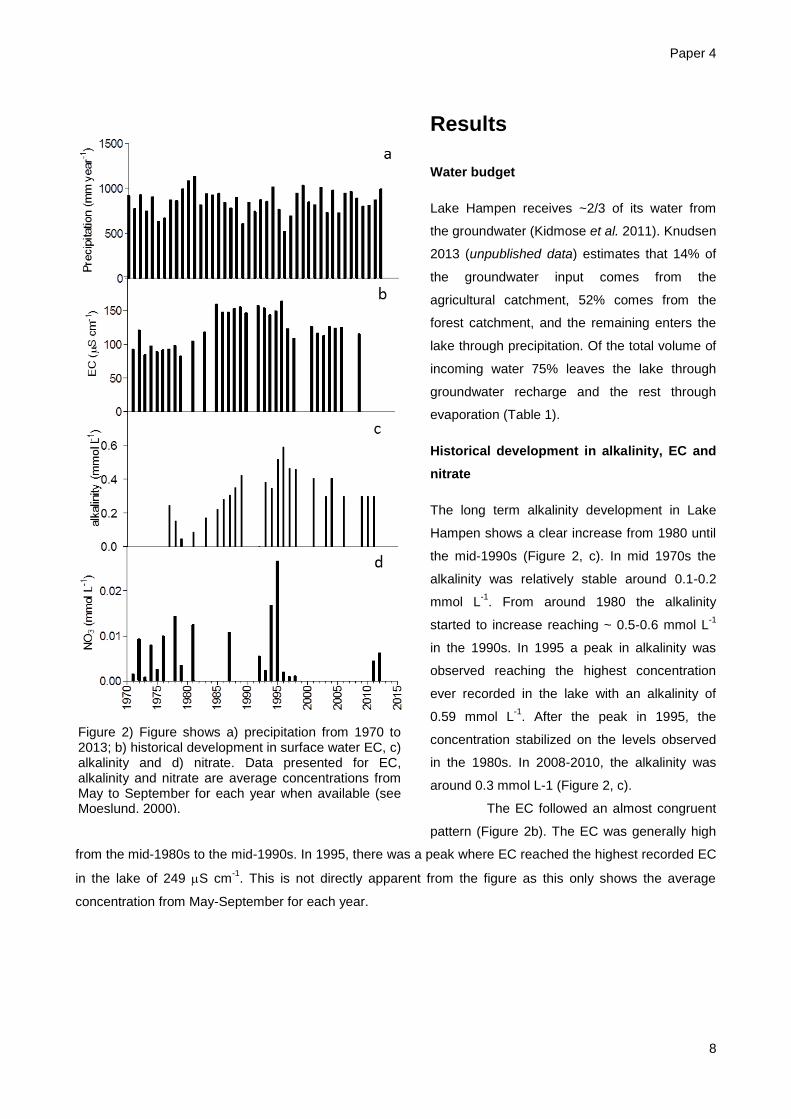
Paper 4
8
Results
Water budget
Lake Hampen receives ~2/3 of its water from
the groundwater (Kidmose et al. 2011). Knudsen
2013 (unpublished data) estimates that 14% of
the groundwater input comes from the
agricultural catchment, 52% comes from the
forest catchment, and the remaining enters the
lake through precipitation. Of the total volume of
incoming water 75% leaves the lake through
groundwater recharge and the rest through
evaporation (Table 1).
Historical development in alkalinity, EC and
nitrate
The long term alkalinity development in Lake
Hampen shows a clear increase from 1980 until
the mid-1990s (Figure 2, c). In mid 1970s the
alkalinity was relatively stable around 0.1-0.2
mmol L-1
. From around 1980 the alkalinity
started to increase reaching ~ 0.5-0.6 mmol L-1
in the 1990s. In 1995 a peak in alkalinity was
observed reaching the highest concentration
ever recorded in the lake with an alkalinity of
0.59 mmol L-1
. After the peak in 1995, the
concentration stabilized on the levels observed
in the 1980s. In 2008-2010, the alkalinity was
around 0.3 mmol L-1 (Figure 2, c).
The EC followed an almost congruent
pattern (Figure 2b). The EC was generally high
from the mid-1980s to the mid-1990s. In 1995, there was a peak where EC reached the highest recorded EC
in the lake of 249 S cm-1
. This is not directly apparent from the figure as this only shows the average
concentration from May-September for each year.
Figure 2) Figure shows a) precipitation from 1970 to 2013; b) historical development in surface water EC, c) alkalinity and d) nitrate. Data presented for EC, alkalinity and nitrate are average concentrations from May to September for each year when available (see Moeslund, 2000).
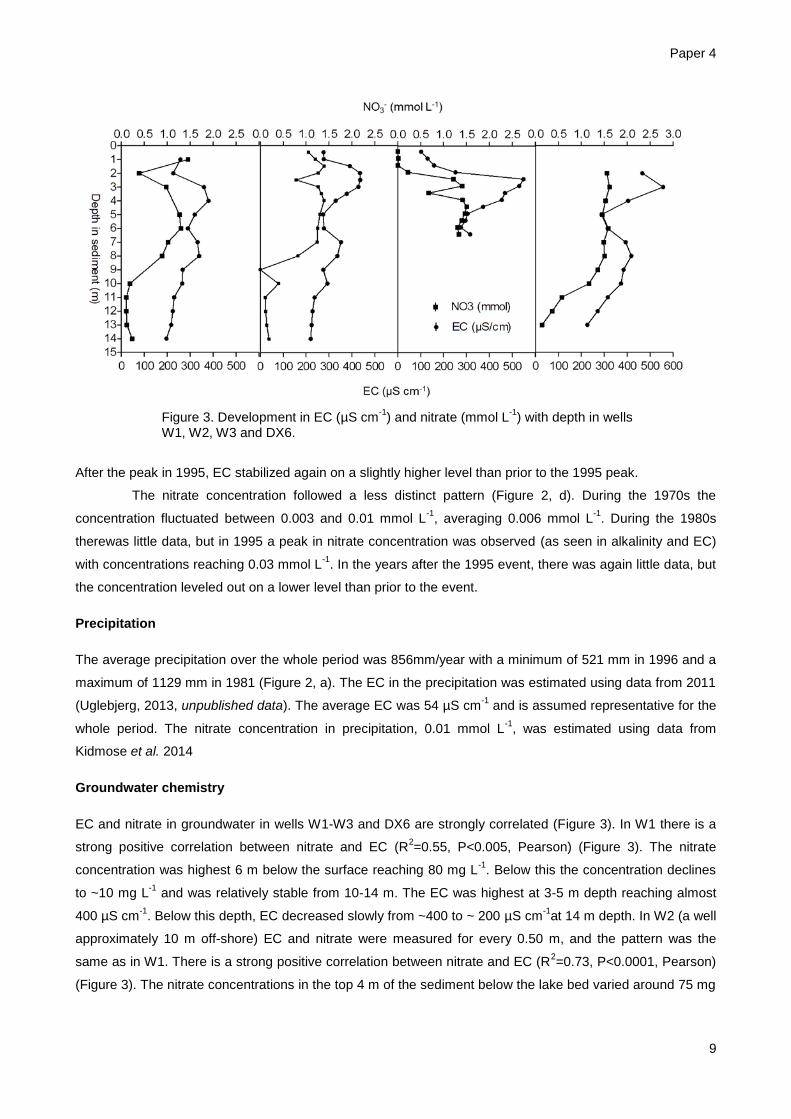
Paper 4
9
After the peak in 1995, EC stabilized again on a slightly higher level than prior to the 1995 peak.
The nitrate concentration followed a less distinct pattern (Figure 2, d). During the 1970s the
concentration fluctuated between 0.003 and 0.01 mmol L-1
, averaging 0.006 mmol L-1
. During the 1980s
therewas little data, but in 1995 a peak in nitrate concentration was observed (as seen in alkalinity and EC)
with concentrations reaching 0.03 mmol L-1
. In the years after the 1995 event, there was again little data, but
the concentration leveled out on a lower level than prior to the event.
Precipitation
The average precipitation over the whole period was 856mm/year with a minimum of 521 mm in 1996 and a
maximum of 1129 mm in 1981 (Figure 2, a). The EC in the precipitation was estimated using data from 2011
(Uglebjerg, 2013, unpublished data). The average EC was 54 µS cm-1
and is assumed representative for the
whole period. The nitrate concentration in precipitation, 0.01 mmol L-1
, was estimated using data from
Kidmose et al. 2014
Groundwater chemistry
EC and nitrate in groundwater in wells W1-W3 and DX6 are strongly correlated (Figure 3). In W1 there is a
strong positive correlation between nitrate and EC (R2=0.55, P<0.005, Pearson) (Figure 3). The nitrate
concentration was highest 6 m below the surface reaching 80 mg L-1
. Below this the concentration declines
to ~10 mg L-1
and was relatively stable from 10-14 m. The EC was highest at 3-5 m depth reaching almost
400 µS cm-1
. Below this depth, EC decreased slowly from ~400 to ~ 200 µS cm-1
at 14 m depth. In W2 (a well
approximately 10 m off-shore) EC and nitrate were measured for every 0.50 m, and the pattern was the
same as in W1. There is a strong positive correlation between nitrate and EC (R2=0.73, P<0.0001, Pearson)
(Figure 3). The nitrate concentrations in the top 4 m of the sediment below the lake bed varied around 75 mg
Figure 3. Development in EC (µS cm-1
) and nitrate (mmol L-1
) with depth in wells W1, W2, W3 and DX6.
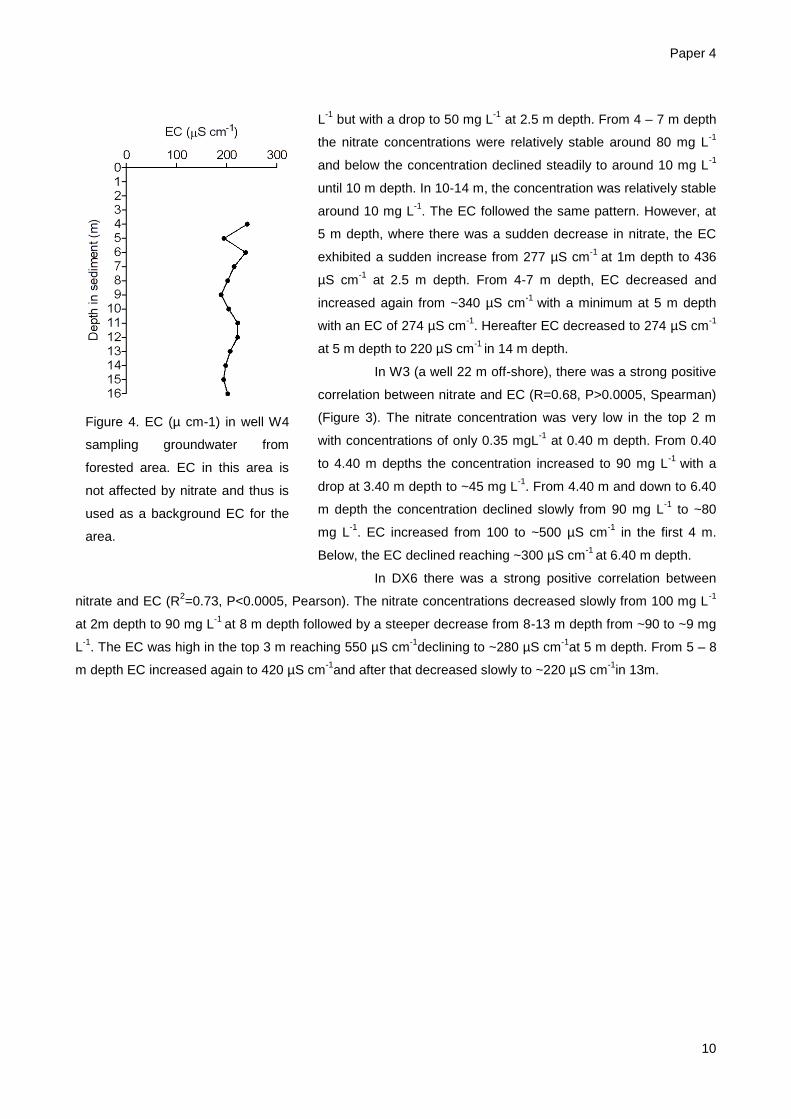
Paper 4
10
L-1
but with a drop to 50 mg L-1
at 2.5 m depth. From 4 – 7 m depth
the nitrate concentrations were relatively stable around 80 mg L-1
and below the concentration declined steadily to around 10 mg L-1
until 10 m depth. In 10-14 m, the concentration was relatively stable
around 10 mg L-1
. The EC followed the same pattern. However, at
5 m depth, where there was a sudden decrease in nitrate, the EC
exhibited a sudden increase from 277 µS cm-1
at 1m depth to 436
µS cm-1
at 2.5 m depth. From 4-7 m depth, EC decreased and
increased again from ~340 µS cm-1
with a minimum at 5 m depth
with an EC of 274 µS cm-1
. Hereafter EC decreased to 274 µS cm-1
at 5 m depth to 220 µS cm-1
in 14 m depth.
In W3 (a well 22 m off-shore), there was a strong positive
correlation between nitrate and EC (R=0.68, P>0.0005, Spearman)
(Figure 3). The nitrate concentration was very low in the top 2 m
with concentrations of only 0.35 mgL-1
at 0.40 m depth. From 0.40
to 4.40 m depths the concentration increased to 90 mg L-1
with a
drop at 3.40 m depth to ~45 mg L-1
. From 4.40 m and down to 6.40
m depth the concentration declined slowly from 90 mg L-1
to ~80
mg L-1
. EC increased from 100 to ~500 µS cm-1
in the first 4 m.
Below, the EC declined reaching ~300 µS cm-1
at 6.40 m depth.
In DX6 there was a strong positive correlation between
nitrate and EC (R2=0.73, P<0.0005, Pearson). The nitrate concentrations decreased slowly from 100 mg L
-1
at 2m depth to 90 mg L-1
at 8 m depth followed by a steeper decrease from 8-13 m depth from ~90 to ~9 mg
L-1
. The EC was high in the top 3 m reaching 550 µS cm-1
declining to ~280 µS cm-1
at 5 m depth. From 5 – 8
m depth EC increased again to 420 µS cm-1
and after that decreased slowly to ~220 µS cm-1
in 13m.
Figure 4. EC (µ cm-1) in well W4
sampling groundwater from
forested area. EC in this area is
not affected by nitrate and thus is
used as a background EC for the
area.
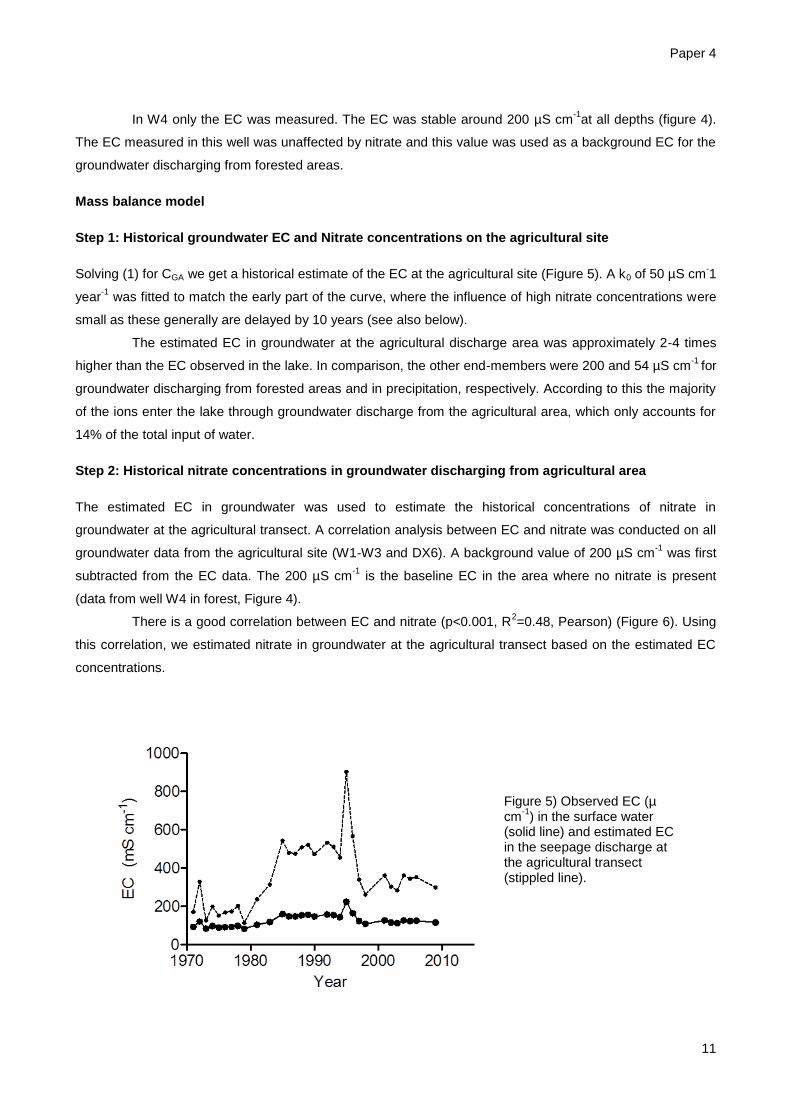
Paper 4
11
In W4 only the EC was measured. The EC was stable around 200 µS cm-1
at all depths (figure 4).
The EC measured in this well was unaffected by nitrate and this value was used as a background EC for the
groundwater discharging from forested areas.
Mass balance model
Step 1: Historical groundwater EC and Nitrate concentrations on the agricultural site
Solving (1) for CGA we get a historical estimate of the EC at the agricultural site (Figure 5). A k0 of 50 µS cm-1
year-1
was fitted to match the early part of the curve, where the influence of high nitrate concentrations were
small as these generally are delayed by 10 years (see also below).
The estimated EC in groundwater at the agricultural discharge area was approximately 2-4 times
higher than the EC observed in the lake. In comparison, the other end-members were 200 and 54 µS cm-1
for
groundwater discharging from forested areas and in precipitation, respectively. According to this the majority
of the ions enter the lake through groundwater discharge from the agricultural area, which only accounts for
14% of the total input of water.
Step 2: Historical nitrate concentrations in groundwater discharging from agricultural area
The estimated EC in groundwater was used to estimate the historical concentrations of nitrate in
groundwater at the agricultural transect. A correlation analysis between EC and nitrate was conducted on all
groundwater data from the agricultural site (W1-W3 and DX6). A background value of 200 µS cm-1
was first
subtracted from the EC data. The 200 µS cm-1
is the baseline EC in the area where no nitrate is present
(data from well W4 in forest, Figure 4).
There is a good correlation between EC and nitrate (p<0.001, R2=0.48, Pearson) (Figure 6). Using
this correlation, we estimated nitrate in groundwater at the agricultural transect based on the estimated EC
concentrations.
Figure 5) Observed EC (µ cm
-1) in the surface water
(solid line) and estimated EC in the seepage discharge at the agricultural transect (stippled line).
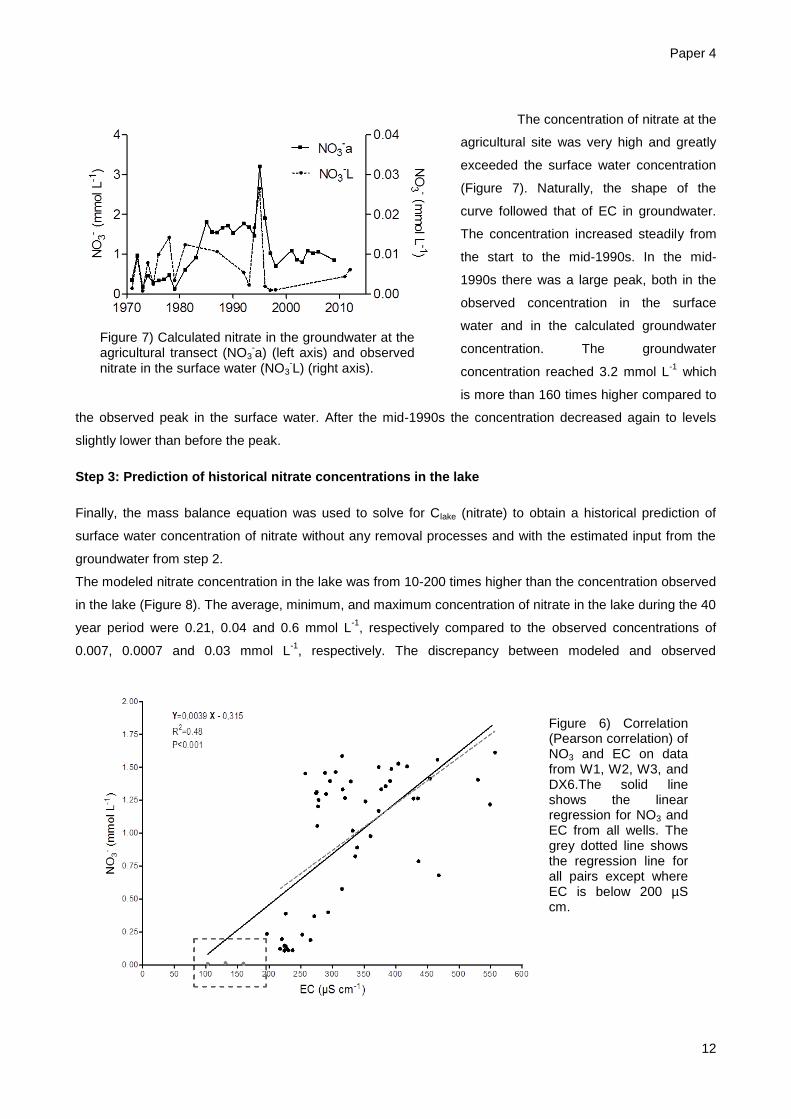
Paper 4
12
The concentration of nitrate at the
agricultural site was very high and greatly
exceeded the surface water concentration
(Figure 7). Naturally, the shape of the
curve followed that of EC in groundwater.
The concentration increased steadily from
the start to the mid-1990s. In the mid-
1990s there was a large peak, both in the
observed concentration in the surface
water and in the calculated groundwater
concentration. The groundwater
concentration reached 3.2 mmol L-1
which
is more than 160 times higher compared to
the observed peak in the surface water. After the mid-1990s the concentration decreased again to levels
slightly lower than before the peak.
Step 3: Prediction of historical nitrate concentrations in the lake
Finally, the mass balance equation was used to solve for Clake (nitrate) to obtain a historical prediction of
surface water concentration of nitrate without any removal processes and with the estimated input from the
groundwater from step 2.
The modeled nitrate concentration in the lake was from 10-200 times higher than the concentration observed
in the lake (Figure 8). The average, minimum, and maximum concentration of nitrate in the lake during the 40
year period were 0.21, 0.04 and 0.6 mmol L-1
, respectively compared to the observed concentrations of
0.007, 0.0007 and 0.03 mmol L-1
, respectively. The discrepancy between modeled and observed
Figure 6) Correlation (Pearson correlation) of NO3 and EC on data from W1, W2, W3, and DX6.The solid line shows the linear regression for NO3 and EC from all wells. The grey dotted line shows the regression line for all pairs except where EC is below 200 µS cm.
Figure 7) Calculated nitrate in the groundwater at the agricultural transect (NO3
-a) (left axis) and observed
nitrate in the surface water (NO3-L) (right axis).
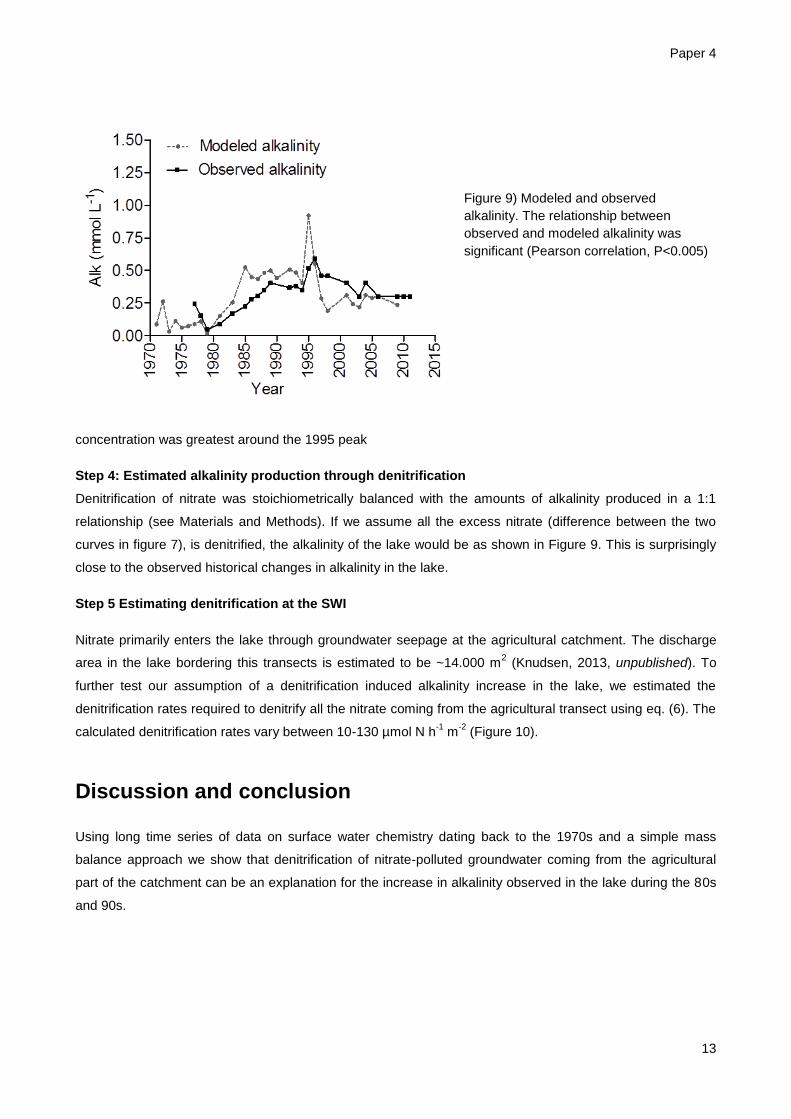
Paper 4
13
concentration was greatest around the 1995 peak
Step 4: Estimated alkalinity production through denitrification
Denitrification of nitrate was stoichiometrically balanced with the amounts of alkalinity produced in a 1:1
relationship (see Materials and Methods). If we assume all the excess nitrate (difference between the two
curves in figure 7), is denitrified, the alkalinity of the lake would be as shown in Figure 9. This is surprisingly
close to the observed historical changes in alkalinity in the lake.
Step 5 Estimating denitrification at the SWI
Nitrate primarily enters the lake through groundwater seepage at the agricultural catchment. The discharge
area in the lake bordering this transects is estimated to be ~14.000 m2 (Knudsen, 2013, unpublished). To
further test our assumption of a denitrification induced alkalinity increase in the lake, we estimated the
denitrification rates required to denitrify all the nitrate coming from the agricultural transect using eq. (6). The
calculated denitrification rates vary between 10-130 µmol N h-1
m-2
(Figure 10).
Discussion and conclusion
Using long time series of data on surface water chemistry dating back to the 1970s and a simple mass
balance approach we show that denitrification of nitrate-polluted groundwater coming from the agricultural
part of the catchment can be an explanation for the increase in alkalinity observed in the lake during the 80s
and 90s.
Figure 9) Modeled and observed
alkalinity. The relationship between
observed and modeled alkalinity was
significant (Pearson correlation, P<0.005)
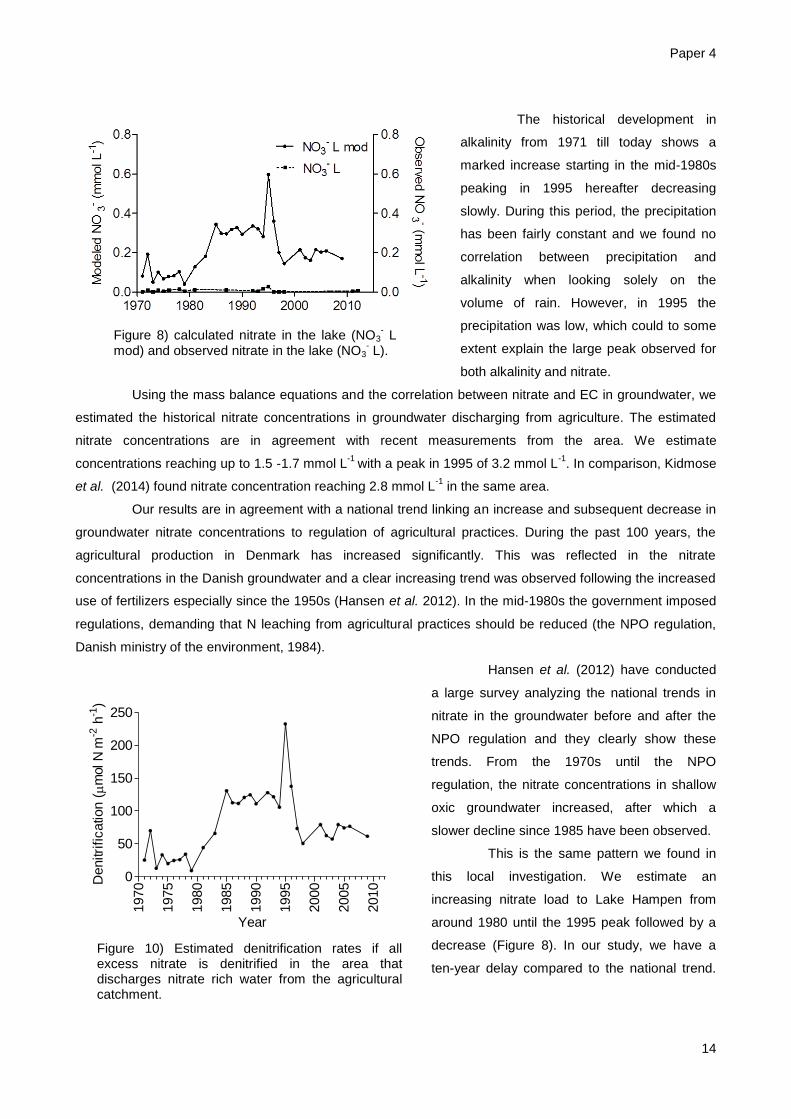
Paper 4
14
The historical development in
alkalinity from 1971 till today shows a
marked increase starting in the mid-1980s
peaking in 1995 hereafter decreasing
slowly. During this period, the precipitation
has been fairly constant and we found no
correlation between precipitation and
alkalinity when looking solely on the
volume of rain. However, in 1995 the
precipitation was low, which could to some
extent explain the large peak observed for
both alkalinity and nitrate.
Using the mass balance equations and the correlation between nitrate and EC in groundwater, we
estimated the historical nitrate concentrations in groundwater discharging from agriculture. The estimated
nitrate concentrations are in agreement with recent measurements from the area. We estimate
concentrations reaching up to 1.5 -1.7 mmol L-1
with a peak in 1995 of 3.2 mmol L-1
. In comparison, Kidmose
et al. (2014) found nitrate concentration reaching 2.8 mmol L-1
in the same area.
Our results are in agreement with a national trend linking an increase and subsequent decrease in
groundwater nitrate concentrations to regulation of agricultural practices. During the past 100 years, the
agricultural production in Denmark has increased significantly. This was reflected in the nitrate
concentrations in the Danish groundwater and a clear increasing trend was observed following the increased
use of fertilizers especially since the 1950s (Hansen et al. 2012). In the mid-1980s the government imposed
regulations, demanding that N leaching from agricultural practices should be reduced (the NPO regulation,
Danish ministry of the environment, 1984).
Hansen et al. (2012) have conducted
a large survey analyzing the national trends in
nitrate in the groundwater before and after the
NPO regulation and they clearly show these
trends. From the 1970s until the NPO
regulation, the nitrate concentrations in shallow
oxic groundwater increased, after which a
slower decline since 1985 have been observed.
This is the same pattern we found in
this local investigation. We estimate an
increasing nitrate load to Lake Hampen from
around 1980 until the 1995 peak followed by a
decrease (Figure 8). In our study, we have a
ten-year delay compared to the national trend.
Figure 8) calculated nitrate in the lake (NO3- L
mod) and observed nitrate in the lake (NO3- L).
1970
1975
1980
1985
1990
1995
2000
2005
2010
0
50
100
150
200
250
Year
Denitri
fication (m
ol N
m-2
h-1
)
Figure 10) Estimated denitrification rates if all excess nitrate is denitrified in the area that discharges nitrate rich water from the agricultural catchment.
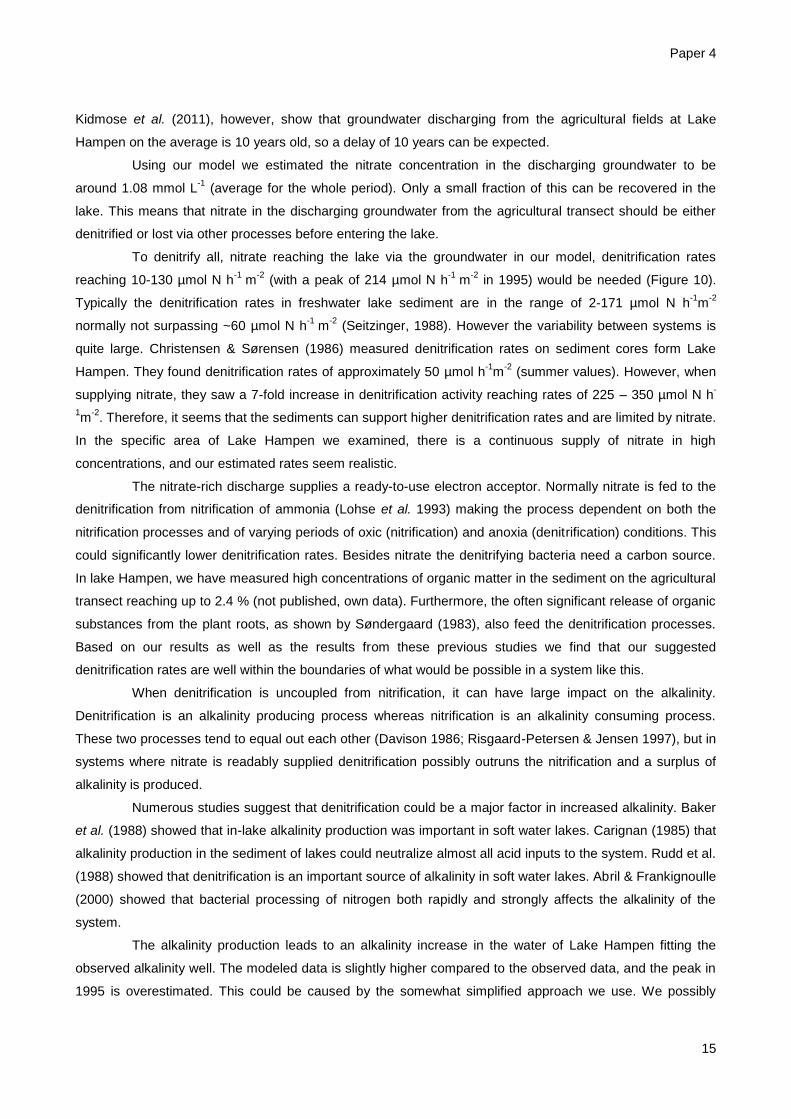
Paper 4
15
Kidmose et al. (2011), however, show that groundwater discharging from the agricultural fields at Lake
Hampen on the average is 10 years old, so a delay of 10 years can be expected.
Using our model we estimated the nitrate concentration in the discharging groundwater to be
around 1.08 mmol L-1
(average for the whole period). Only a small fraction of this can be recovered in the
lake. This means that nitrate in the discharging groundwater from the agricultural transect should be either
denitrified or lost via other processes before entering the lake.
To denitrify all, nitrate reaching the lake via the groundwater in our model, denitrification rates
reaching 10-130 µmol N h-1
m-2
(with a peak of 214 µmol N h-1
m-2
in 1995) would be needed (Figure 10).
Typically the denitrification rates in freshwater lake sediment are in the range of 2-171 µmol N h-1
m-2
normally not surpassing ~60 µmol N h-1
m-2
(Seitzinger, 1988). However the variability between systems is
quite large. Christensen & Sørensen (1986) measured denitrification rates on sediment cores form Lake
Hampen. They found denitrification rates of approximately 50 µmol h-1
m-2
(summer values). However, when
supplying nitrate, they saw a 7-fold increase in denitrification activity reaching rates of 225 – 350 µmol N h-
1m
-2. Therefore, it seems that the sediments can support higher denitrification rates and are limited by nitrate.
In the specific area of Lake Hampen we examined, there is a continuous supply of nitrate in high
concentrations, and our estimated rates seem realistic.
The nitrate-rich discharge supplies a ready-to-use electron acceptor. Normally nitrate is fed to the
denitrification from nitrification of ammonia (Lohse et al. 1993) making the process dependent on both the
nitrification processes and of varying periods of oxic (nitrification) and anoxia (denitrification) conditions. This
could significantly lower denitrification rates. Besides nitrate the denitrifying bacteria need a carbon source.
In lake Hampen, we have measured high concentrations of organic matter in the sediment on the agricultural
transect reaching up to 2.4 % (not published, own data). Furthermore, the often significant release of organic
substances from the plant roots, as shown by Søndergaard (1983), also feed the denitrification processes.
Based on our results as well as the results from these previous studies we find that our suggested
denitrification rates are well within the boundaries of what would be possible in a system like this.
When denitrification is uncoupled from nitrification, it can have large impact on the alkalinity.
Denitrification is an alkalinity producing process whereas nitrification is an alkalinity consuming process.
These two processes tend to equal out each other (Davison 1986; Risgaard-Petersen & Jensen 1997), but in
systems where nitrate is readably supplied denitrification possibly outruns the nitrification and a surplus of
alkalinity is produced.
Numerous studies suggest that denitrification could be a major factor in increased alkalinity. Baker
et al. (1988) showed that in-lake alkalinity production was important in soft water lakes. Carignan (1985) that
alkalinity production in the sediment of lakes could neutralize almost all acid inputs to the system. Rudd et al.
(1988) showed that denitrification is an important source of alkalinity in soft water lakes. Abril & Frankignoulle
(2000) showed that bacterial processing of nitrogen both rapidly and strongly affects the alkalinity of the
system.
The alkalinity production leads to an alkalinity increase in the water of Lake Hampen fitting the
observed alkalinity well. The modeled data is slightly higher compared to the observed data, and the peak in
1995 is overestimated. This could be caused by the somewhat simplified approach we use. We possibly
Paper 4
16
overestimate the EC in the groundwater from the agriculture and this leads to an overestimation of nitrate
from the agriculture followed by and overestimation of alkalinity production. The EC in the groundwater is
posibly overestimated in the mid-1990s because we use the lake concentration of EC to calculate the input
from the different sources. In the mid-1990s we see the lowest precipitation in the whole period. This would
lead to higher surface water EC as the lake stage, the seepage rates and the water renewal times would all
be lower (Schindler, 1986). Hence, in our model this high EC leads to an overestimation of EC in the
groundwater even though this is not the case in the real situation.
We also assumed that the EC in the rain and from the groundwater discharging from the
forest areas have been constant over the considered period. It could be speculated that the lake have been
subject to acidification from precipitation and that the alkalinity increase is a recovery from this atmospheric
acidification. We have no way of testing this, but, on the other hand, the alkalinity increase follows nicely the
national development in nitrate concentrations in groundwater. Furthermore, the 1995 event cannot be
explained with a slow recovery from an atmospheric input but points more towards our theory of a
denitrification-induced alkalinity production.
Alkalinity increase can have substantial impact on the ecosystem and the distribution and
community composition of the submerged vegetation (Marberly & Spence 1983). Vestergaard & Sand-
Jensen (2000) showed that alkalinity is a main factor responsible for species distribution of submerged plants
in Danish soft water lakes and represents a threat to unique isoetid communities. In low alkaline waters,
availability of inorganic carbon can be very limiting for growth. Here slow growing isoetids species dominate
as they are morphologically adapted to access the pool of inorganic carbon in the sediment (Sand-Jensen &
Prahl, 1982; Madsen et al. 2002). The isoetids are poor competitors to the fast growing elodeid species, but
their adaption to sediments scavenging for both nutrients and inorganic carbon enable them to thrive in water
not suitable for the elodeids (Maberly & Madsen, 2002). With increased alkalinity the availability of inorganic
carbon, especially in the form of HCO3- increases. This favors the elodeids, and increases the competition
with the isoetids.
With this study we show that leaching of nitrate from agriculture can have a substantial impact
on the lake chemistry. Not only does the nitrate affect the lake directly by adding nutrients, but also indirectly
by supplying nitrate for the denitrification processes that ultimately leads to increased alkalinity in the lake. In
a historical time frame, we were able to stoichiometrically link the denitrification of nitrate with the overall
alkalinity development in the lake hereby stressing the importance of both in-lake processes as well as the
groundwater dependent input to the lake. By using a simple mass balance equation we were able to fit the
modeled alkalinity production with the observed alkalinity development in the lake over a period exceeding
30 years. Long term measurements of surface water quality are therefore important to track changes in land
use and hydrology in the catchment.
Acknowledgements
This project was founded by The Danish Council for Independent Research – Nature and Universe.
Paper 4
17
References
Abril, G. and Frankignoulle, M. 2000. Nitrogen-alkalinity interactions in the highly polluted Scheldt basin
(Belgium). Water resources. 35(3): 844-850
Appelo, C.A. J. & Postma, D. Geochemistry, Groundwater and pollution. 2005. A.A. Balkema publishers.
458-462.
Baker, L. A and Brezonik, P. L. 1988. Dynamic model of in-lake alkalinity generation. Water Resources
research. 24(1): 65-74
Brinson, M. M., Malvarez, A. I. 2002. Temperate freshwater wetlands: types, status, and threats.
Environmental Conservation. 29(2): 115-133.
Brønmark, C., Hansson, L. 2002. Environmental issues in lakes and ponds. current state and perspectives.
Environmental Conservation. 29(3): 290-306
Carignan, R. 1985. Quantitative importance of alkalinity flux from the sediment of acid lakes. Nature. 31: 158
– 160
Christensen, P. B., Sørensen, J. 1986. Temporal variation of denitrification activity in plant-covered, littoral
sediment from Lake Hampen, Denmark. Applied and environmental microbiology. 51(6): 1174 - 1179
Cook, C. A., Schindler, D. W. and Turner, M. A. 1986. Mechanisms of hydrogen ion neutralization in an
experimentally acidified lake. Limnology and Oceanography. 31(1): 134-148.
Davison, W. 1986 Internal element cycles affecting the long-term alkalinity status of lakes: implications for
lake restoration. Scheiz. Z. Hydrol. 49(2): 186-201
Frich, P., Rosenørn, S., Madsen, H. and Jensen, J.J. 1997. Observed precipitation in Denmark, 1961-90.
Technical Report 97-8. Danish Meteorological Institute.
Gurrieri, J. T., Furniss, G. 2004. Estimation of groundwater exchange in alpine lakes using non-steady mass-
balance methods. Journal of Hydrology. 297: 187-208.
Hansen, B., Dalgaard, T., Thorling L., Sørensen, B., Erlandersen M. 2012. Regional analysis of groundwater
nitrate concentrations and trends in Denmark in regard to agricultural influence. Biogeosciences, 9,
3277-3286
Hill, A. R., Devito, K, J., Campagnolo, S. & Sanmugadas, K. 2000. Subsurface denitrification in a forest
riparian zone: Interactions between hydrology and supplies of nitrate and organic carbon.
Biogeochemistry. 51: 193-22
Hongve, D. 1978. Buffering of acid lakes by sediments. Verh. Int. Ver. Limnol. 20: 743-748.
Karan, S., Kidmose, J., Engesgaard, P., Nilsson, B., Frandsen, M., Omen, D. A .O., Flint, M. R., Andersen,
F. Ø., Pedersen, O. 2014. Role of a groundwater-Lake interface in Controlling seepage of water and
Nitrate. Journal of Hydrology. 517: 791-802
Kelly, C. A. Hesslein, R. H., Shindler, D. W., Dillon, P.J., Driscoll, C.T., Gherini, S.A. and Hecky, R.E. 1987.
Prediction of biological acid neutralization in acid-sensitive lakes. Biogeochemistry. 3: 129-140
Kidmose, J., Engesgaard, P., Nilsson, B., Laier, T. and Looms, M. C. 2011. Spatial distribution of seepage at
a flow-through lake: Lake Hampen, eastern Denmark. Vadose Zone Journal. 10(1): 110-124
Paper 4
18
Kidmose, J., Engesgaard, P., Ommen, D. A., Nilsson, B., Flindt, M. R., Andersen, F. Ø. 2014. The role of
groundwater for lake-water quality and quantification of N seepage. Groundwater.
DOI10.1111/gwat.12281
Knudsen, K. F. 2013. Effect of climate on groundwater exchange to and from Lake Hampen – a 3D
groundwater lake simulation study. Master thesis. Department of Geosciences and Natural Resource
Management. University of Copenhagen.
Krabbenhoft, D. P., Webster, K. E. 1995. Transient hydrological controls on the chemistry of a seepage lake.
Water Resources research. 31(9): 2295-2305
Lohse, L., Malschaert, J. F.P., Slomp, C. P., Helder, W. and Raahorst, W. V. 1993. Nitrogen cycling in North
sea sediments: interaction of denitrification and nitrification in offshore and coastal areas. Marine
ecology progress series. 101: 283-296
Marberly, S.C. and Madsen, T.V. 2002. Freshwater angiosperm carbon concentration mechanisms:
processes and patterns. Functional Plant Biology. 29: 393-405
Marberly, S.C. and Spence, D.H.N. 1983. Photosynthetic inorganic carbon use by freshwater plants. Jounal
of Ecology. 71: 705-724
McKnight, R. 1986. Quichem method No. 10-107.04-1-c. Lachat Chemicals inc. Mequon.
Madsen, T.V., Olesen B. and Bagger, J. 2002. Carbon acquisition and carbon dynamics by aquatic isoetids.
Aquatic Botany. 73: 351-371
Merritt, M. L. & Konikov, L. F. 2000. Documentation of a computer program to simulate lake-aquifer
interaction using the MODFLOW ground-water-flow model and the MOC3D solute-transport model,
USGS. Water-resources investigation report. Series number 2000-4167
Moeslund, B. 2000. Lake Hampen: Environmental status 1971-1999. Vejle County (in Danish)
Moss, B. 1999. Ecological challenges for lake management. Hydrobiologia. 395(396): 3-11
Niswonger, R.G. & Prudic, D. E. 2005. Documentation of the streamflow-routing (SFR2) package to include
unsaturated flow beneath streams – a modification to SFR1. USGS techniques and methods. 6/A13: 50
Ommen. D. A. O., Kidmose, J., Karan, S., Flint, M. R., Engesgaard, p., Nilsson, B. and Andersen, F. Ø.
2012. Importance og groundwater and macrophytes for the nutrient balance at oligotrophic Lake
Hampen, Danmark. Ecohydrology. 5(3): 286-296
Rimmer, A., Boger, M., Aota, Y., Kumagai, M. 2006. A lake as a natural integrator of linear processes:
Application to Lake Kinneret (Israel) and lake Biwa (Japan). Journal of Hydrology. 319: 163-175
Risgaard-Petersen, N. and Jensen, K. 1997. Nitrification and denitrification in the rhizosphere of the aquatic
macrophyte Lobilia dortmanna L. Limnology and Oceanography. 42(3): 529-537
Rodriguez, I. 2000. Ecohydrology: A hydrologic perspective of climate-soil-vegetation dynamics. Water
resources research. 36(1): 3-9
Rohde, H. & Rood, M.J. 1984. An evaluation of sulfate in European precipitation 1955-1982. Atmospheric
environment. 18: 2627-2639
Rudd, J. W. M., Kelly, C. A. and Schindler, D. W. 1988. Comment on “Dynamic model of in-lake alkalinity
generation” by L. A. Baker and P.L Brezonik. Water resources research. 24(10): 1825-1827
Paper 4
19
Rudd, J. W. M., Kelly, C. A. St. Louis, V., Hesslein, R. H., Furutani, A. and Holoka, M. H. 1986. Microbial
consumption of nitric and sulfuric acids in acidified north temperate lakes1. Limnology and
Oceanography. 31(6): 1267-1280
Sand-Jensen, K. and Prahl, C. 1982. Oxygen-exchange with the lacunae and across leaves and roots of the
submerged vascular macrophyte, Lobelia dortmanna L. New Phytologist. 91: 103-120
Scharling, M. 1999. Klimagrid – Danmark, Nedbør, lufttemperatur og potential fordampning 20*20 og 40*40
km. Danish Meteorological Institute. Technical report. 99-12
Schindler, D. W. 1988. Effects of acid rain on freshwater ecosystems. Science. 239: 149-157
Schindler, D. W., Turner, M. A., Staiton, M. P. and Linsey, G. A. 1986. Natural sources of acid neutralizing
capacity in low alkalinity lakes of the Precambrian Shield. Science. 232: 844-847
Schindler, D. W., Wagemann, R., Cook, R. B., Ruszzczynski, T., Prokopowich, J. 1980. Experimental
acidification of Lake 223, experimental lakes area: Background data and the first three years of
acidification. Canadian journal of fisheries and aquatic sciences. 37(3): 342-354
Seitzinger, S. P. 1988. Denitrification in freshwater and coastal marine ecosystems: Ecological and
geochemical significance. Limnology and Oceanography, 22(4/3): 702-724
Sigg, L., Johnson, A. and Kuhn, A. 1991. Redox conditions and alkalinity generation in a seasonally anoxic
lake (Lake Greifen). Marine Chemistry. 36: 9-26
Sutcliffe, D. W., Carrick, T. R., Heron, J., Rigg, E., Talling, J. F., Woof, C., Lund, J. W G. 1982. Long-term
and seasonal changes in the chemical composition of precipitation and surface waters of lakes and
tarns in the English Lake District. Freshwater Biology. 12(5): 451-506
Søndergaard, M. 1983. Heterotrophic utilization and decomposition of exstracellular carbon released by the
aquatic angiosperm Littorella uniflora (L.) ascers. Aquatic botany. 16(1): 59-73
Vestergaard. O. and Sand-Jensen, K. 2000. Aquatic macrophyte richness in Danish lakes in relation to
alkalinity, transparency, and lake area. Canadian Journal of Fisheries and Aquatic Sciences. 57: 2022-
2031
Williamson, C. E., Saros, J. E., Vincent, W. F., Smold, J. P. 2009. Lakes as reservoirs as sentinels,
integrators, and regulators of climate change. Limnology and Oceanography. 54(6/2): 2273-2282
Zalewski, M. 2002. Ecohydrology – the use of ecological and hydrological processes for sustainable
management of water resources. Hydrological Sciences. 47(5): 823 – 832