Embed Size (px)
Citation preview
Hydrogen production from biomaterials by the extreme thermophile
Caldicellulosiruptor saccharolyticus
Ph.D. Thesis
Written by:
Galina V. Ivanova
Supervisor:
Prof. Kornél L. Kovács
Department of Biotechnology, University of Szeged
Szeged, Hungary
2008
2
Contents
CONTENTS .................................................................................................................................. 1
ABBREVIATIONS ......................................................................................................................... 4
1. OVERVIEW OF THE LITERATURE ........................................................................................ 5
1.1. HYDROGEN BIOTECHNOLOGY ............................................................................................ 5 1.1.1 General use and production of hydrogen...........................................................................5 1.1.2 Biohydrogen and the role of hydrogenases in H2 metabolism...........................................6
1.2. HYDROGEN PRODUCTION FROM BIOMASS ........................................................................ 13 1.2.1. Biomass composition and methods for H2 production from biomass..............................13 1.2.2. Mechanism of microbial conversion of biomass to hydrogen.........................................15 1.2.3. Energy crops and their by-products as a substrate for fuels ............................................17
1.2.3.1. Biofuel production from wheat and maize residues ..................................................................19 1.2.3.2. Biofuel production from sweet sorghum and its derivatives bagasse and sweet sorghum juice20
1.3. THE EXTREME THERMOPHILE CALDICELLULOSIRUPTOR SACCHAROLYTICUS.................. 24 1.3.1. Characteristics of the extreme thermophiles (extremophiles) .........................................24 1.3.2. Properties of C. saccharolyticus ......................................................................................28
1.4. RATIONALE OF WHOLE CELLS IMMOBILIZATION AND ITS APPLICATION IN
BIOTECHNOLOGY .............................................................................................................. 31 1.4.1. Methods for immobilization of whole cells and their application in biotechnology .......31 1.4.2. Immobilization of whole cells by adsorption ..................................................................37
2. AIMS OF THE STUDY .......................................................................................................... 38
3. MATERIALS AND METHODS ............................................................................................... 39 3.1. Microorganism, medium and culture conditions .............................................................39 3.2. Cell growth, viable cell counts and cell biomass.............................................................39 3.3. Analysis of hydrogen production.....................................................................................40 3.4. Characterization of support matrices...............................................................................40 3.5. Cell immobilization, storage and analysis of stored cells................................................41 3.6. Protein measurement .......................................................................................................41 3.7. One-dimensional SDS PAGE analysis of proteins..........................................................42 3.8. Total organic carbon analysis ..........................................................................................42 3.9. Total solids analysis.........................................................................................................42 3.10. Determinatin of glucose concentration............................................................................43
4. RESULTS AND DISCUSSION................................................................................................ 44
4.1. UTILIZATION OF POLYMERIC SUBSTANCES BY C. SACCHAROLYTICUS ............................. 44 4.1.1. Agarose and alginic acid as a source for H2 production by C. saccharolyticus...............44 4.1.2. Anaerobic storage of C. saccharolyticus and H2 production by stored cells...................47 4.1.3. Immobilization studies ....................................................................................................53 4.1.4. Agarose-induced changes in the protein pattern..............................................................55
4.2. UTILIZATION OF ENERGY PLANTS FOR H2 PRODUCTION BY C. SACCHAROLYTICUS ........ 56 4.2.1. Wheat straw as carbon source for H2 production ............................................................58 4.2.2. Sweet sorghum plant and its extracts as carbon source for H2 production......................59

3
4.2.3. Maize leaves as carbon source for H2 production............................................................63 4.2.4. Sugarcane bagasse and silphium as carbon source for H2 production.............................65 4.2.5. Changes in TC, TOC and reducing sugar concentration .................................................67
5. SUMMARY .......................................................................................................................... 70
6. PUBLICATIONS ................................................................................................................... 72
7. AKNOWLEDGEMENTS ........................................................................................................ 73
8. SUMMARY IN HUNGARIAN ................................................................................................ 74
9. REFERENCES..................................................................................................................... 75
4
Abbreviations:
AA: alginic acid
BGS: sugarcane bagasse
CB: cellobiose
CFU: colony forming unit
GAC: granular activated carbon
LC: liquid (suspended) culture
LMA: low melting point agarose
NADH: nicotinamide adenine dinucleotide phosphate
PER: perlite
PBS: phosphate-buffered saline (20 mM K-phosphate buffer, 160 mM NaCl, pH 7.0)
PML: pretreated maize leaves
PWS: pine wood shavings
SSC: sweet sorghum concentrate 65 oBx
STR: Silphium tripholiatum
SDS-PAGE: sodium dodecylsulfate polyacrylamide gel electrophoresis
SSJ: sweet sorghum juice
SSP: sweet sorghum plant
TC: total carbon
TOC: total organic carbon UML: untreated maize leaves
WST: wheat straw
YE: yeast extract
5
1. Overview of literature
1.1. Hydrogen biotechnology
1.1.1. General use and production of hydrogen
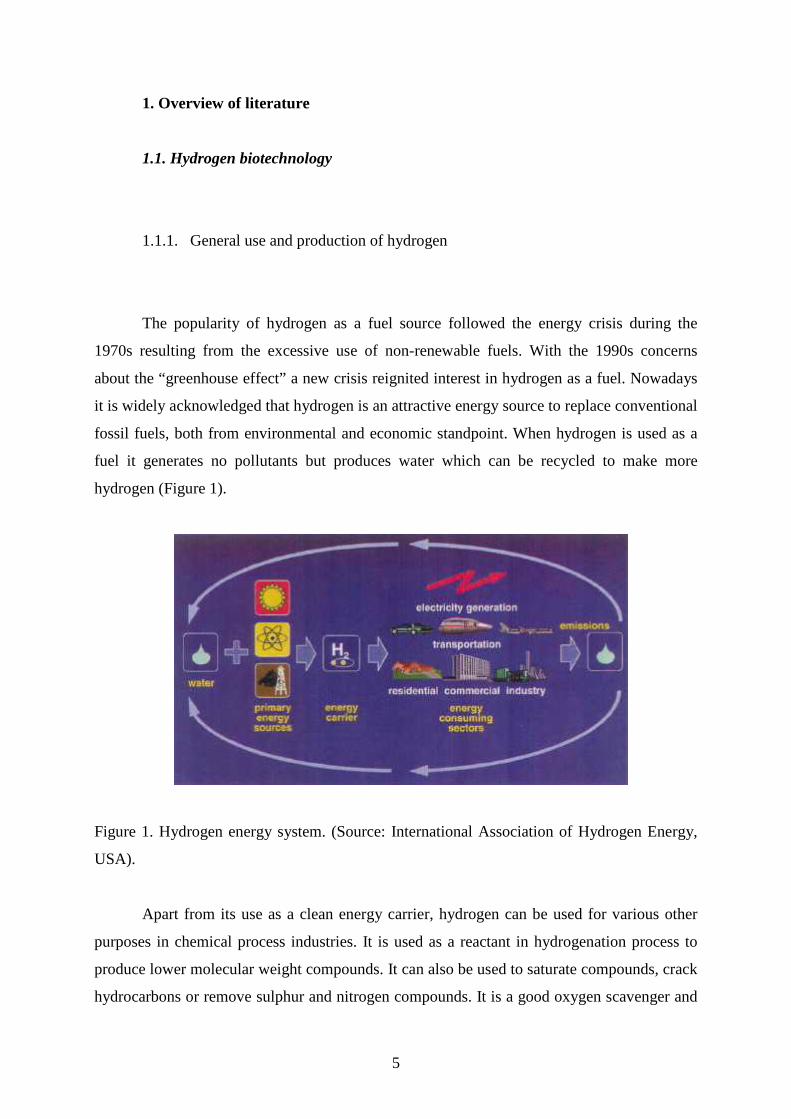
The popularity of hydrogen as a fuel source followed the energy crisis during the
1970s resulting from the excessive use of non-renewable fuels. With the 1990s concerns
about the “greenhouse effect” a new crisis reignited interest in hydrogen as a fuel. Nowadays
it is widely acknowledged that hydrogen is an attractive energy source to replace conventional
fossil fuels, both from environmental and economic standpoint. When hydrogen is used as a
fuel it generates no pollutants but produces water which can be recycled to make more
hydrogen (Figure 1).
Figure 1. Hydrogen energy system. (Source: International Association of Hydrogen Energy,
USA).
Apart from its use as a clean energy carrier, hydrogen can be used for various other
purposes in chemical process industries. It is used as a reactant in hydrogenation process to
produce lower molecular weight compounds. It can also be used to saturate compounds, crack
hydrocarbons or remove sulphur and nitrogen compounds. It is a good oxygen scavenger and
6
can therefore be used to remove traces of oxygen to prevent oxidative corrosion in the
presence of a catalyst. In the manufacturing of ammonia, methanol and synthesis gas, the use
of hydrogen is well known. The future widespread use of hydrogen is likely to be in the
transportation sector, where it will help reduce pollution. Vehicles can be powered with
hydrogen fuel cells, which are three times more efficient than a gasoline-powered engine. As
of today, all these areas of hydrogen utilization are equivalent to 3% of the energy
consumption, but it is expected to grow significantly in the years to come (Nath and Das
2003).
The currently commercially used hydrogen is extracted mostly from natural gas.
Nearly 90% of hydrogen is obtained by steam reformation of naphtha or natural gas.
Gasification of coal and electrolysis of water are the other industrial methods for hydrogen
production (Tanisho et al. 1983). However, these processes are highly energy intensive and
not always environment-friendly. Moreover, the fossil-fuel (mainly petroleum) reserves of the
world are depleting at an alarming rate. Given the economic uncertainties and environmental
hazards of fossil fuels, working out the technical and economic feasibility of hydrogen
production is becoming a major priority in the 21st century. Biotechnology, in that aspect, is
uniquely poised to make a significant contribution to that effort.
1.1.2. Biohydrogen generation and the role of hydrogenases in H2 metabolism
Molecular hydrogen produced from renewable sources (biomass, water, organic
wastes) either biologically or photobiologically is called “biohydrogen”. It can be achieved by
the use of two main types microorganisms, photosynthetic (photoautotrophic and
photoheterotrophic) and fermentative. Reports on microbial H2 productions have been
periodically reviewed by various scientists (Pakes and Jollyman 1901; Harden 1901; Zajic et
al. 1978; Adams et al. 1981; Roychowdhury et al. 1988; Sasikala et al. 1993; Wu and
Mandrand 1993). The production of H2 by different microorganisms is intimately linked to
their respective energy metabolism. In aerobic microorganisms, released electrons from
substrate oxidation is transferred to oxygen as the ultimate oxidant, while in anaerobic
microorganisms electrons released from anaerobic catabolism use many terminal oxidants
such as nitrate, sulphate, or organic compounds derived from carbohydrates as carbon source.
7
Hydrogen metabolism in microorganisms is carried out by metalloenzymes, namely
nitrogenases and hydrogenases. Nitrogenases release H2 as a byproduct during nitrogen
fixation. Hydrogenases catalyze the simplest chemical reaction: 2H+ + 2e- ↔ H2. The reaction
is reversible, and its direction depends on the redox potential of the components able to
interact with the enzyme. In the presence of H2 and an electron acceptor, it will act as a H2
uptake enzyme; in the presence of an electron donor of low potential, it may use the protons
from water as electron acceptors and release H2. The production of H2 is one of the specific
mechanisms to dispose excess electrons through the activity of hydrogenases present in H2
producing microorganisms. Hydrogenase activity can be measured in vitro, using artificial or
natural electron carriers. The in vivo function of the hydrogenases depends on the current
redox status of the cell.
Hydrogenases have various physiological roles. They have a different localization as
well as a different subunit composition in the cell. The first classification of these enzymes
was based on the identity of specific electron donors and acceptors, namely, NAD. Until
2004, hydrogenases were classified according to the metals at their active sites. Three main
classes were recognized: iron-only ([FeFe] hydrogenases), nickel-iron ([NiFe] hydrogenases),
and "metal-free" hydrogenases. In 2004, Lyon et al. showed that the metal-free hydrogenases
in fact contain iron. Thus, those enzymes previously called "metal-free" are now named "iron-
sulfur-cluster-free" hydrogenases, since they contain no inorganic sulfide in contrast to the
Fe-only enzymes. In some [NiFe] hydrogenases, one of the Ni-bound cysteine residues is
replaced by selenocysteine. On the basis of sequence similarity, however, the [NiFe] and
[NiFeSe] hydrogenases belong to the same superfamily.
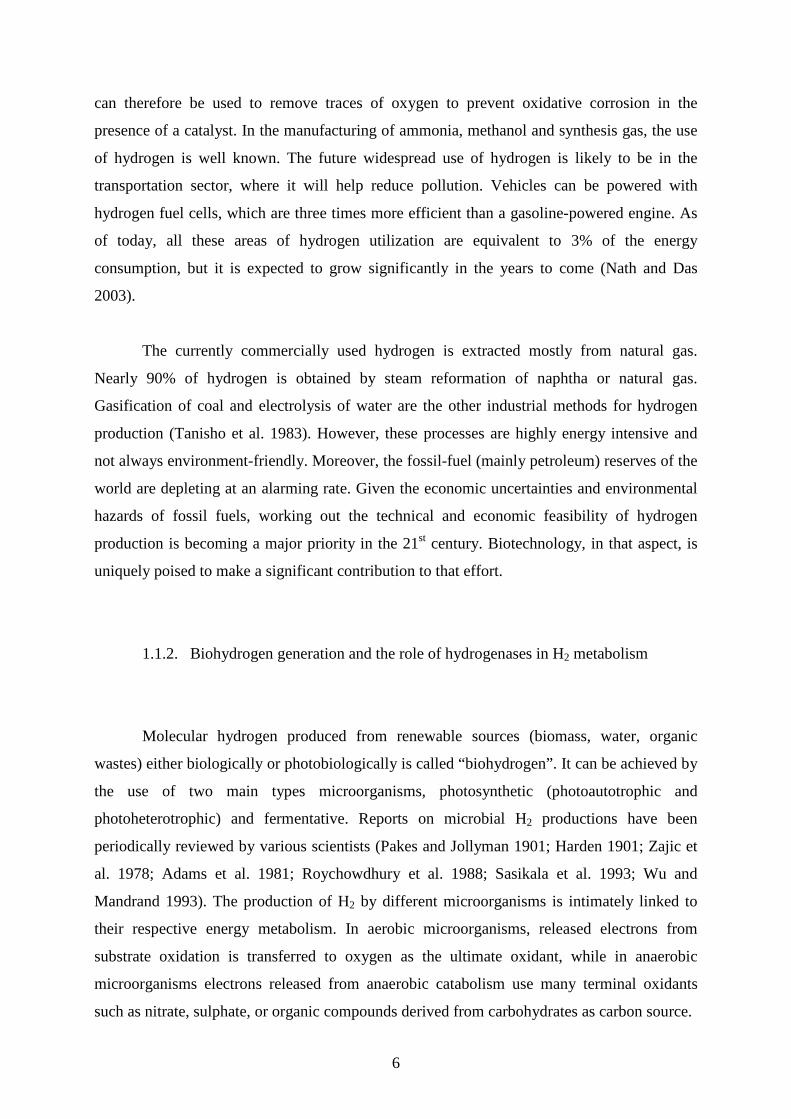
The [NiFe] hydrogenases are heterodimeric proteins consisting of small (about 30
kDa) and large (about 60 kDa) subunits. The small subunit contains three iron-sulfur clusters
while the large subunit contains a nickel-iron centre. Periplasmic, cytoplasmic, and
cytoplasmic membrane-bound hydrogenases have been found. The [NiFe] hydrogenases,
when isolated, are found to catalyse both H2 evolution and uptake, with low-potential
multihaem cytochromes such as cytochrome c3 acting as either electron donors or acceptors,
depending on their oxidation state.
8
Figure 2. A scheme of [NiFe] hydrogenase in Methanosarcina barkeri (Hedderich 2004).
The hydrogenases containing Fe-S clusters and no other metal than iron are called Fe-
hydrogenases. Three families of Fe-hydrogenases are recognized:
I. Cytoplasmic, soluble, monomeric Fe-hydrogenases, found in strict anaerobes such as
Clostridium pasteurianum and Megasphaera elsdenii. They are extremely sensitive to
inactivation by dioxygen (O2) and catalyse both H2 evolution and uptake;
II. Periplasmic, heterodimeric Fe-hydrogenases from Desulfovibrio spp., which can be
purified aerobically and catalyse mainly H2 oxidation;
III. Soluble, monomeric Fe-hydrogenases, found in chloroplasts of green alga Scenedesmus
obliquus, which catalyse H2 evolution. The [Fe2S2] ferredoxin functions as natural electron
donor linking the enzyme to the photosynthetic electron transport chain.
Ni-Fe and Fe-only hydrogenases have some common features in their structures: each
enzyme has an active site and a few Fe-S clusters. The active site is also a metallocluster, and
each metal is coordinated by carbon monoxide (CO) and cyanide (CN-) ligands.
9
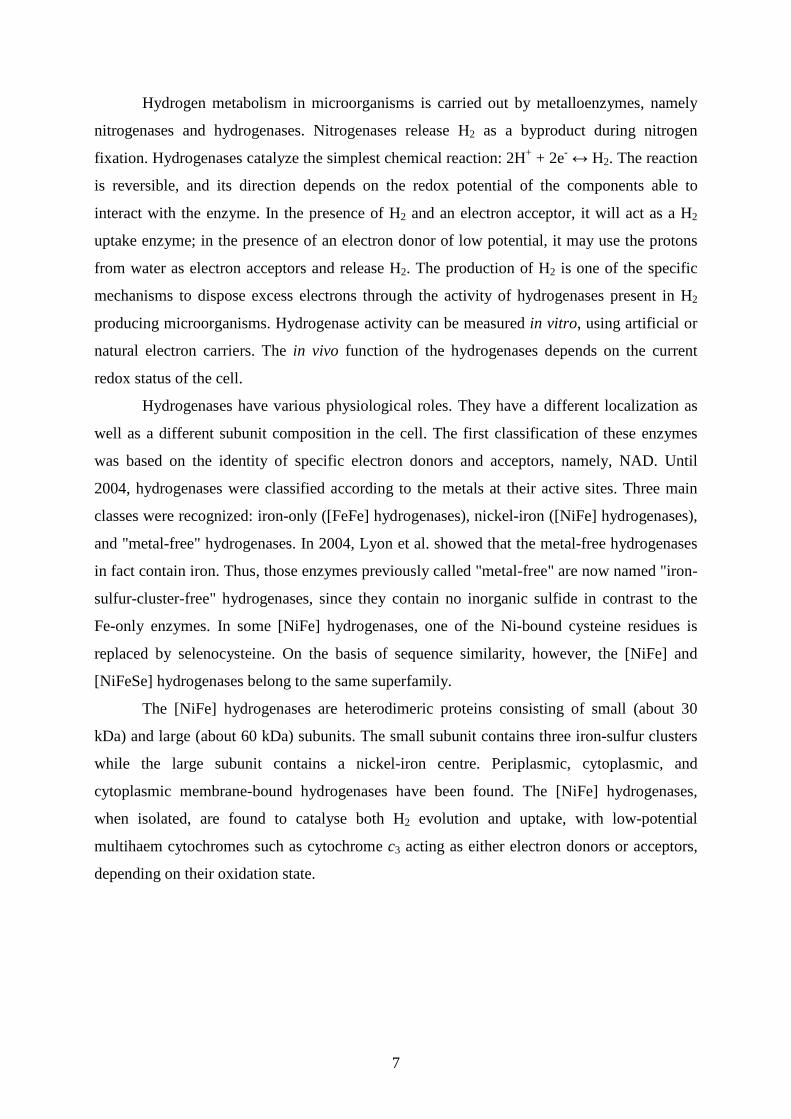
Nath and Das (2004) have summarized the processes related to biological H2
production and have pointed out the advantages, as well as the disadvantages of such
processes (Table 1)
Process Type of
microorganism
Advantages Disadvantages
Direct
biophotolysis
Green algae Can produce H2 directly from
water and sunlight
Solar conversion energy
increased by tenfolds as
compared to trees, crops
Requires light
O2 can be dangerous for the
system
Indirect
biophotolysis
Cyanobacteria Can produce H2 directly from
water
Has the ability to fix N2 from
atmosphere
Uptake hydrogenase enzymes
are to be removed to stop H2
dissociate
O2 present in gas mixture,
inhibits nitrogenases
Photo-
fermentation
Photosynthetic
bacteria
A wide spectral light energy can
be used by these bacteria
Can use different waste
materials like distillery effluents,
etc. and can produce H2 all day
without light
Light conversion efficiency is
very low – only 1-5%
O2 inhibits some hydrogenases
Dark
fermentation
Fermentative
bacteria
A variety of carbon sources can
be used as substrates
It can produce H2 all day without
light
It produces valuable metabolites
like butyric, lactic, propionic,
succinic and acetic acids as by-
products
Relatively lower achievable
yields of H2
As yields increase H2
fermentation becomes
thermodynamically
unfavorable
Product gas mixture contains
CO2
O2 is an inhibitor
Table 1. Comparison of important biological hydrogen production processes (modified after
Nath and Das 2004).
10
The hydrogen-producing microbes in a dark fermentation process can be classified
into two categories: facultative anaerobes (enteric bacteria, e.g. Escherichia coli,
Enterobacter, and Citrobacter) and strict anaerobes (clostridia, methylotrophic mathanogens,
and rumen bacteria). Enteric bacteria are rod-shaped, gram-negative facultative anaerobes,
less sensitive to oxygen and are able to recover following air exposure (Nath and Das 2004)
the presence of oxygen, however, causes degradation of formate – a major precursor for H2
production, without H2 formation. Clostridia are generally obligate anaerobes and are rod
shaped with round or pointed ends in some cases. Rod shape can be either straight or slightly
curved with 0.5-2 µm in diameter and up to 30 µm in length. Clostridia form endospores – a
survival structure, developed when the environmental conditions become unfavourable (high
temperature, desiccation, carbon or nitrogen deficiency, chemical toxicity). When favourable
conditions return, the spores germinate and become vegetative cells.
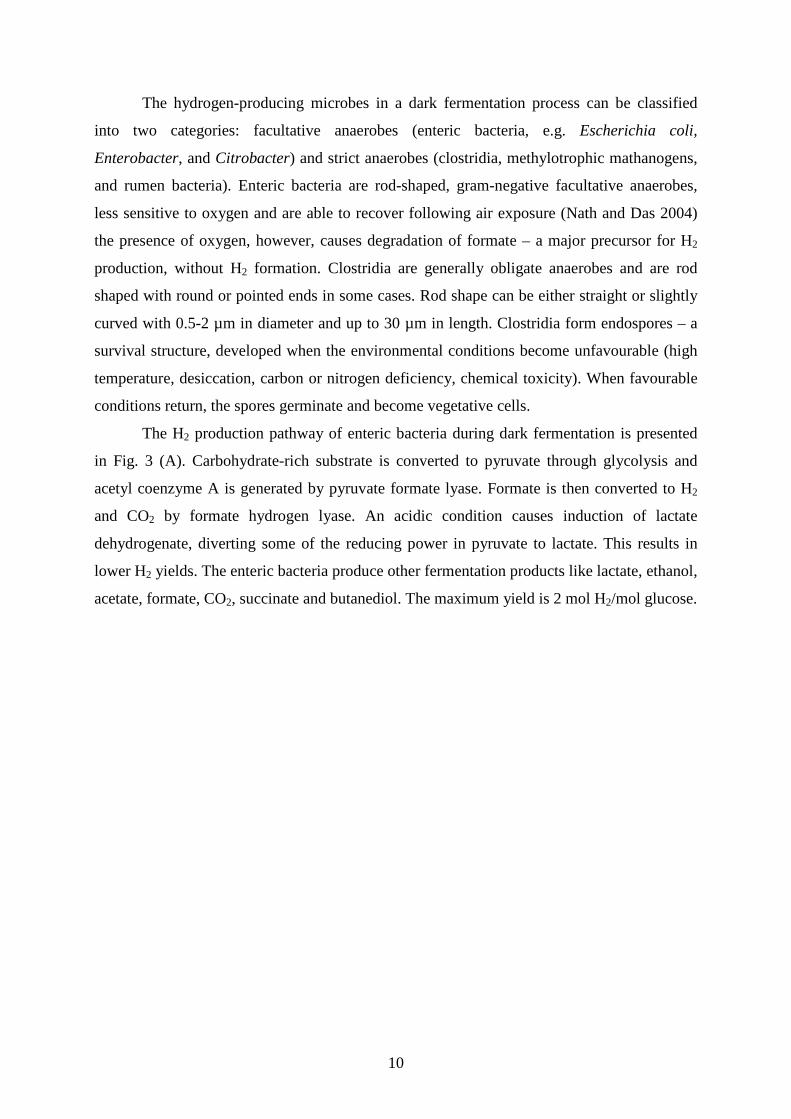
The H2 production pathway of enteric bacteria during dark fermentation is presented
in Fig. 3 (A). Carbohydrate-rich substrate is converted to pyruvate through glycolysis and
acetyl coenzyme A is generated by pyruvate formate lyase. Formate is then converted to H2
and CO2 by formate hydrogen lyase. An acidic condition causes induction of lactate
dehydrogenate, diverting some of the reducing power in pyruvate to lactate. This results in
lower H2 yields. The enteric bacteria produce other fermentation products like lactate, ethanol,
acetate, formate, CO2, succinate and butanediol. The maximum yield is 2 mol H2/mol glucose.
11
Figure 3 (A). Hydrogen production pathway of enteric bacteria during dark
fermentation (adapted from Hallenbeck 2004).
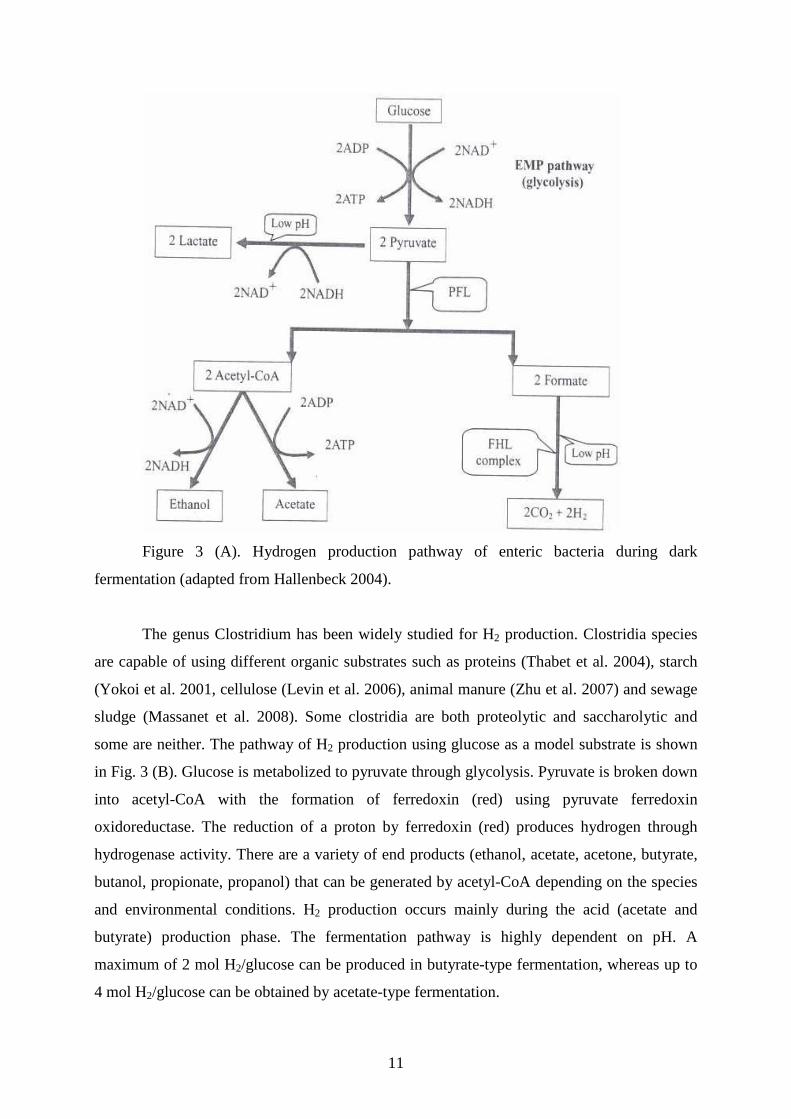
The genus Clostridium has been widely studied for H2 production. Clostridia species
are capable of using different organic substrates such as proteins (Thabet et al. 2004), starch
(Yokoi et al. 2001, cellulose (Levin et al. 2006), animal manure (Zhu et al. 2007) and sewage
sludge (Massanet et al. 2008). Some clostridia are both proteolytic and saccharolytic and
some are neither. The pathway of H2 production using glucose as a model substrate is shown
in Fig. 3 (B). Glucose is metabolized to pyruvate through glycolysis. Pyruvate is broken down
into acetyl-CoA with the formation of ferredoxin (red) using pyruvate ferredoxin
oxidoreductase. The reduction of a proton by ferredoxin (red) produces hydrogen through
hydrogenase activity. There are a variety of end products (ethanol, acetate, acetone, butyrate,
butanol, propionate, propanol) that can be generated by acetyl-CoA depending on the species
and environmental conditions. H2 production occurs mainly during the acid (acetate and
butyrate) production phase. The fermentation pathway is highly dependent on pH. A
maximum of 2 mol H2/glucose can be produced in butyrate-type fermentation, whereas up to
4 mol H2/glucose can be obtained by acetate-type fermentation.
12
Figure 3 (B). Hydrogen production pathway of clostridia during dark fermentation (modified
after Nath and Das 2004).
1.2. Hydrogen production from biomass
1.2.1. Biomass composition and methods for H2 production from biomass
Biomass, as a product of photosynthesis, is a versatile non-petroleum renewable
source that can be utilized for sustainable production of hydrogen (Table 2).
13
Source Maximum
output
Comment
Regenerative source
Biomass
Wind power
Geothermal source
Nuclear power
Fossil fuel
9 × 10¹² W
6 × 10¹² W
Perhaps 109 W
105 W or more
109 W maximum
allowable
For total world land coverage.
For total world land coverage.
Restricted to specific areas (for example,
mid-ocean ridges)
No more than 1 K rise in environmental
temperature. Problems of waste disposal and
safety.
Pollution abatement is essential for small and
large-scale application.
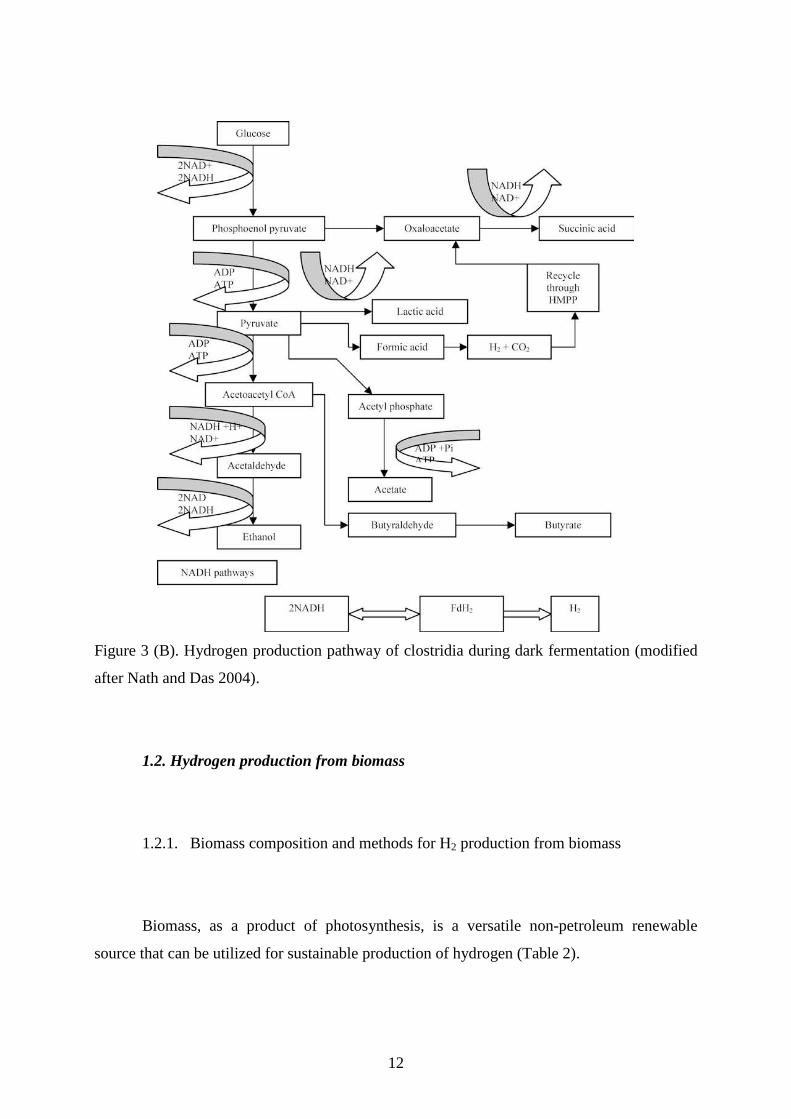
Table 2. Some power sources and possible practical expectations (Nath and Das 2003).
Major resources of biomass include agricultural crops (Table 3) and their waste
byproducts, lignocellulosic products such as wood and wood waste, waste from food
processing, aquatic plants and algae, and effluents produced in the human habitat.
Cereals
(1000 tonnes)
Wheat Maize Sorghum Rice Oats Rye
World 629 873 724 515 57 924 608 368 25 828 17 650
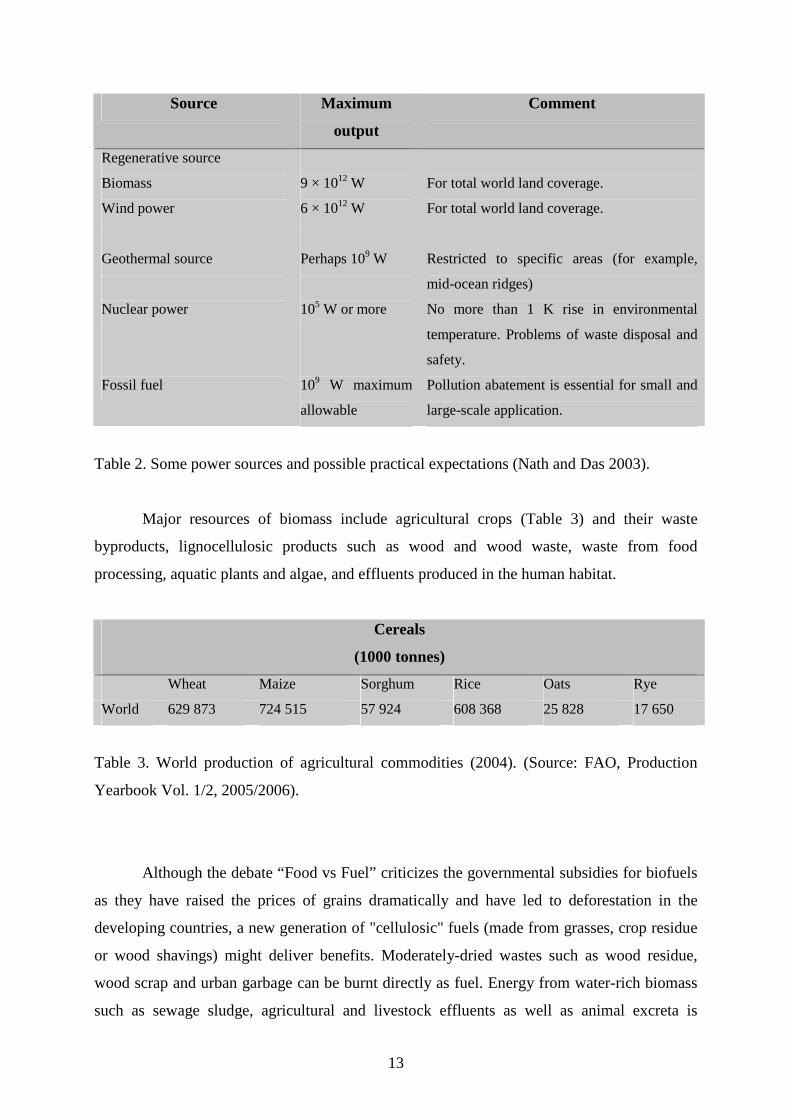
Table 3. World production of agricultural commodities (2004). (Source: FAO, Production
Yearbook Vol. 1/2, 2005/2006).
Although the debate “Food vs Fuel” criticizes the governmental subsidies for biofuels
as they have raised the prices of grains dramatically and have led to deforestation in the
developing countries, a new generation of "cellulosic" fuels (made from grasses, crop residue
or wood shavings) might deliver benefits. Moderately-dried wastes such as wood residue,
wood scrap and urban garbage can be burnt directly as fuel. Energy from water-rich biomass
such as sewage sludge, agricultural and livestock effluents as well as animal excreta is
14
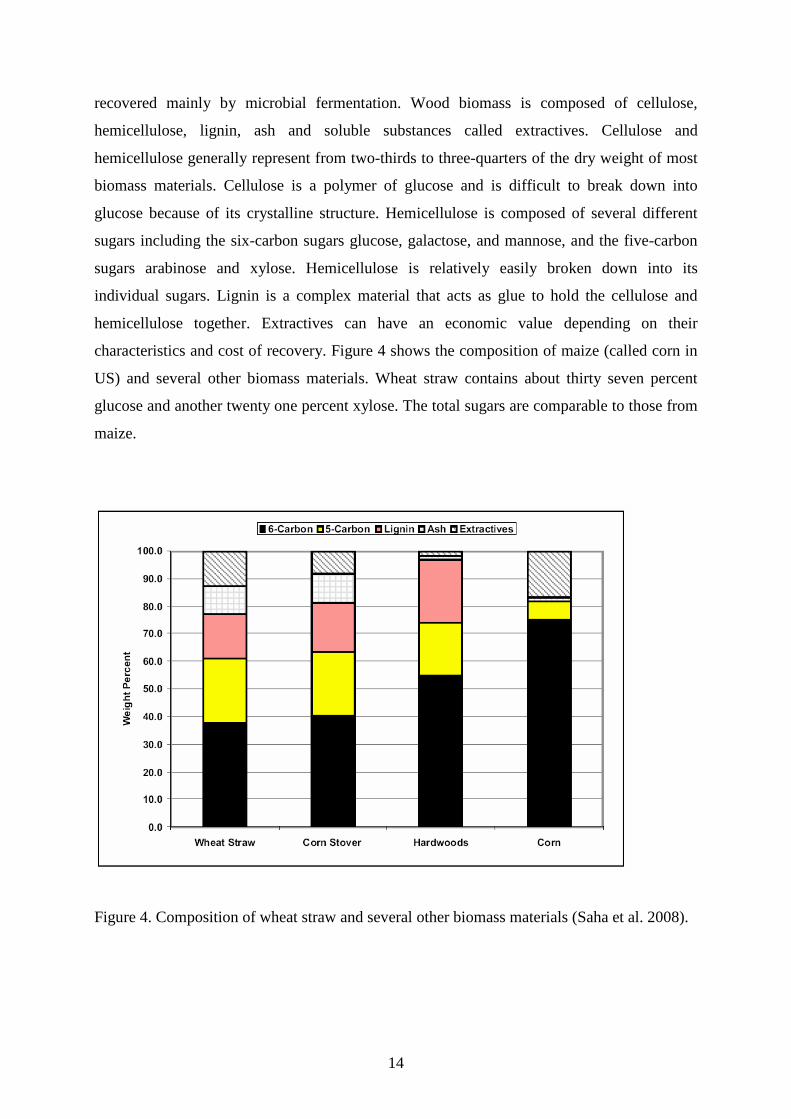
recovered mainly by microbial fermentation. Wood biomass is composed of cellulose,
hemicellulose, lignin, ash and soluble substances called extractives. Cellulose and
hemicellulose generally represent from two-thirds to three-quarters of the dry weight of most
biomass materials. Cellulose is a polymer of glucose and is difficult to break down into
glucose because of its crystalline structure. Hemicellulose is composed of several different
sugars including the six-carbon sugars glucose, galactose, and mannose, and the five-carbon
sugars arabinose and xylose. Hemicellulose is relatively easily broken down into its
individual sugars. Lignin is a complex material that acts as glue to hold the cellulose and
hemicellulose together. Extractives can have an economic value depending on their
characteristics and cost of recovery. Figure 4 shows the composition of maize (called corn in
US) and several other biomass materials. Wheat straw contains about thirty seven percent
glucose and another twenty one percent xylose. The total sugars are comparable to those from
maize.
Figure 4. Composition of wheat straw and several other biomass materials (Saha et al. 2008).
15
Hydrolysis is the step that breaks down the cellulose and hemicellulose polymers into
their basic sugars. The major technologies proposed for hydrolysis include dilute acid
hydrolysis, strong acid hydrolysis, alkaline hydrolysis and enzymatic hydrolysis. Dilute acid
hydrolysis is the most advanced technology, while enzymatic hydrolysis is viewed as an
environmentally – friendly technology for producing biofuels from biomass. Enzymatic
hydrolysis involves microorganisms that produce enzymes degrading cellulose into sugars. In
addition, using properly selected microorganisms, many agricultural feedstocks and their
residues can be exploited for hydrogen production as well (Saha et al. 2008).
Different production technologies of hydrogen from biomass are being available and
comparative analysis of different processes have been made on the basis of their relative
advantages and disadvantages (Das and Veziroglu 2001). Nath and Das (2003) classified
hydrogen production from biomass by physicochemical or biological methods as follows:
- thermochemical gasification coupled with water gas shift;
- fast pyrolysis followed by reforming of carbohydrate fractions of bio-oil;
- miscellaneous novel gasification process;
- microbial conversion of biomass.
1.2.2. Mechanism of microbial conversion of biomass to hydrogen
Despite its relatively lower yields of hydrogen, the fermentative route is a promising
method of biohydrogen production due to its higher rate of H2 evolution in the absence of any
light source as well as the versatility of the substrates used. Moreover, fermentative organisms
have a relatively high growth rate.
16
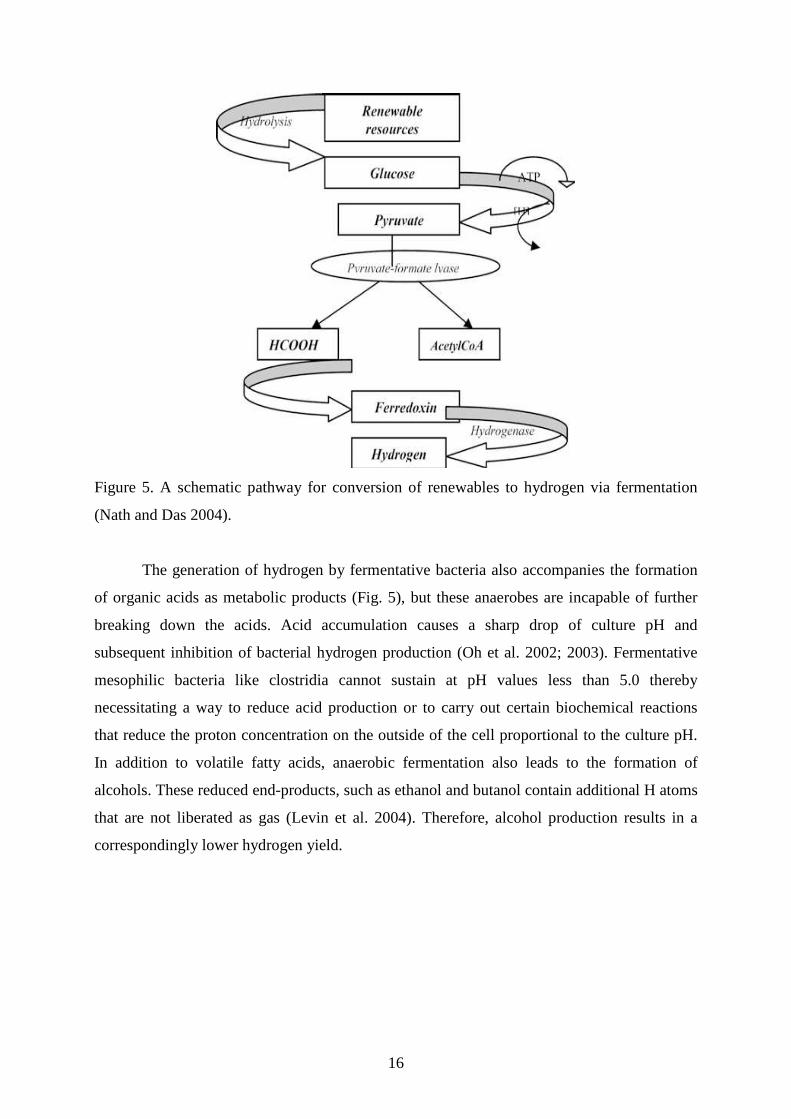
Figure 5. A schematic pathway for conversion of renewables to hydrogen via fermentation
(Nath and Das 2004).
The generation of hydrogen by fermentative bacteria also accompanies the formation
of organic acids as metabolic products (Fig. 5), but these anaerobes are incapable of further
breaking down the acids. Acid accumulation causes a sharp drop of culture pH and
subsequent inhibition of bacterial hydrogen production (Oh et al. 2002; 2003). Fermentative
mesophilic bacteria like clostridia cannot sustain at pH values less than 5.0 thereby
necessitating a way to reduce acid production or to carry out certain biochemical reactions
that reduce the proton concentration on the outside of the cell proportional to the culture pH.
In addition to volatile fatty acids, anaerobic fermentation also leads to the formation of
alcohols. These reduced end-products, such as ethanol and butanol contain additional H atoms
that are not liberated as gas (Levin et al. 2004). Therefore, alcohol production results in a
correspondingly lower hydrogen yield.
17
1.2.3. Energy crops and their by-products as substrates for biofuels
Energy crops are grown specifically for their ability to generate energy. Crops such as
switchgrass, hybrid poplars (cottonwoods), hybrid willows and sugarcane are being studied
for their ability to serve as energy crops for fuel. One of their great advantages is that they are
short rotation crops; they re-grow after each harvest, allowing multiple harvests without
having to re-plant. Maize and sorghum serve a dual purpose as they can be grown for fuel,
with the leftover by-products being used for other purposes, including feedstocks.
Biofuels are defined as solid, liquid and gas fuels derived from recently unviable
biological material or its metabolic byproducts (organic or food waste) unlike the fossil fuels
which are derived from long unviable biological material. In order to be considered a biofuel
the fuel must contain over 80 percent renewable materials. It is originally derived from
photosynthetic processes occurring in plants and is often being referred to as a solar energy
source (Figure 6).
18
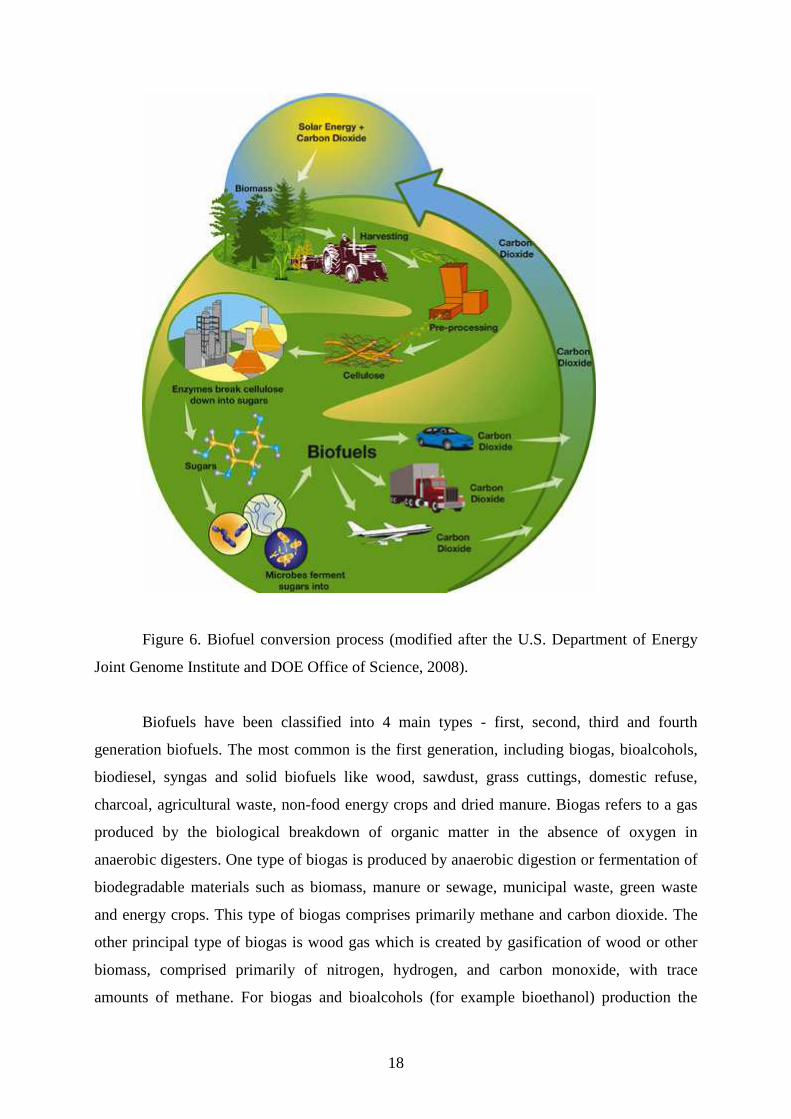
Figure 6. Biofuel conversion process (modified after the U.S. Department of Energy
Joint Genome Institute and DOE Office of Science, 2008).
Biofuels have been classified into 4 main types - first, second, third and fourth
generation biofuels. The most common is the first generation, including biogas, bioalcohols,
biodiesel, syngas and solid biofuels like wood, sawdust, grass cuttings, domestic refuse,
charcoal, agricultural waste, non-food energy crops and dried manure. Biogas refers to a gas
produced by the biological breakdown of organic matter in the absence of oxygen in
anaerobic digesters. One type of biogas is produced by anaerobic digestion or fermentation of
biodegradable materials such as biomass, manure or sewage, municipal waste, green waste
and energy crops. This type of biogas comprises primarily methane and carbon dioxide. The
other principal type of biogas is wood gas which is created by gasification of wood or other
biomass, comprised primarily of nitrogen, hydrogen, and carbon monoxide, with trace
amounts of methane. For biogas and bioalcohols (for example bioethanol) production the
19
energy crops have to be pretreated since they are rich in lignocellulose. The pretreatment
processes for bioethanol production involve hydrolysis, fermentation and distillation. For the
biogas production the hydrolysis is followed by acido-, aceto- and methanogenesis.
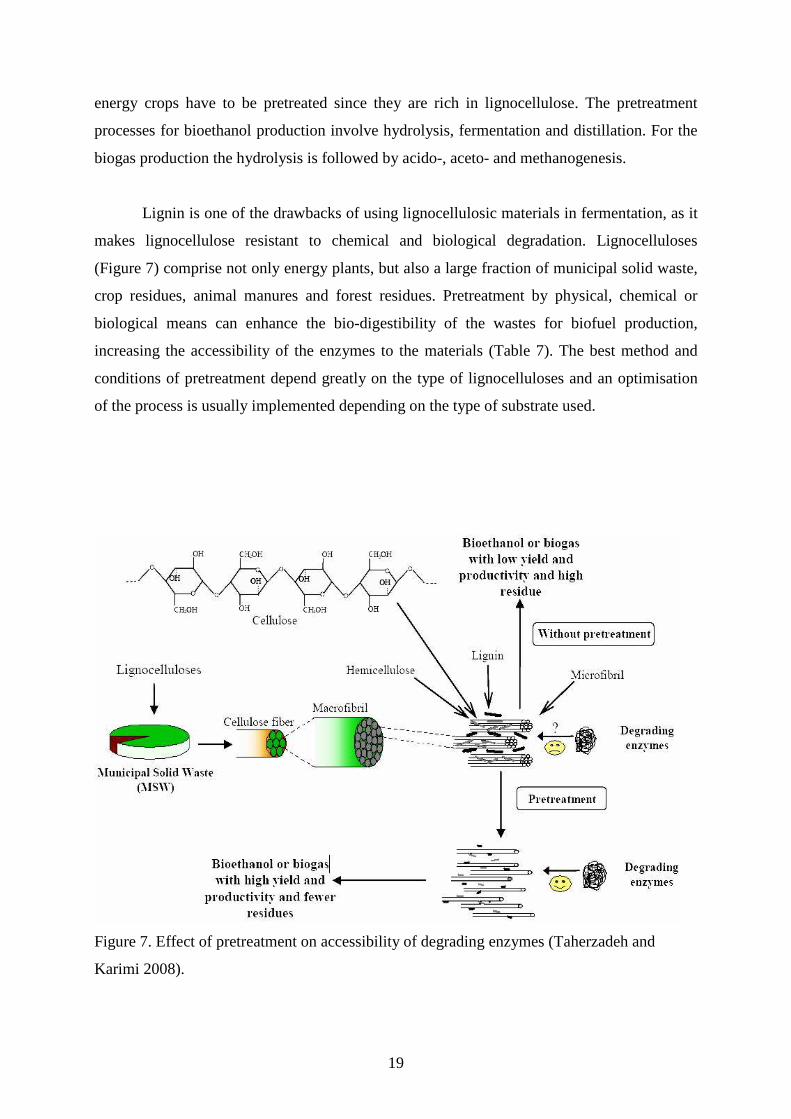
Lignin is one of the drawbacks of using lignocellulosic materials in fermentation, as it
makes lignocellulose resistant to chemical and biological degradation. Lignocelluloses
(Figure 7) comprise not only energy plants, but also a large fraction of municipal solid waste,
crop residues, animal manures and forest residues. Pretreatment by physical, chemical or
biological means can enhance the bio-digestibility of the wastes for biofuel production,
increasing the accessibility of the enzymes to the materials (Table 7). The best method and
conditions of pretreatment depend greatly on the type of lignocelluloses and an optimisation
of the process is usually implemented depending on the type of substrate used.
Figure 7. Effect of pretreatment on accessibility of degrading enzymes (Taherzadeh and
Karimi 2008).
20
1.2.3.1. Biofuel production from wheat and maize residues
There are reports on biogas and bioethanol production from wheat straw. Somayaji
and Khanna (1994) digested rice and wheat straw by adding cattle dung slurry, enhancing the
methane production, as well as the biodegradability of organic matter. Ahring et al. (1996)
produced ethanol from pretreated wheat straw by new thermophilic anaerobic isolates.
Schmersahl et al. (2007) generated biogas by using cattle manure and silages of wheat straw,
maize silage and grass. They concluded that the utilization of wheat straw via biogas and fuel
cells can make a contribution to the power supply of 0.4 kW/ha, whereas the exclusive use of
maize for biogas production might yield a constant power of up to 1.8 kW/ha.
Only in the past few years some reports on fermentative production of hydrogen from
wheat and maize residues appeared in the literature. Hussy et al. (2003) produced H2 from
wheat starch co-product by using mixed microflora via a dark fermentation. Fan et al. (2006)
showed an efficient conversion of wheat straw wastes into biohydrogen gas by cow dung
compost. Pan et al. (2008) examined the degradation of wheat brans by mixed anaerobic
culture. Argun et al. (2008) demonstrated biohydrogen evolution from wheat powder by
anaerobic sludge. The composition of the wheat brans and the solubilised hemicellulose of the
wheat have been well studied (Fang et al. 1999; Martinez-Perez 2007; Pan et al. 2008).
The distinctive features of biogas and biohydrogen formation are well described by
Kovacs et al. 2004. It has been shown that by manipulation of process parameters like pH and
temperature of the anaerobic fermentation biogas or biohydrogen generation can predominate
(Kovacs et al. 2004; Ren et al. 2007).
Apart from being used as food and for heating, maize is currently one of the two major
biofuel crops for bioethanol production (Farrel et al. 2006; Hill et al. 2006, Hammerschlag
2006; Torney et al. 2007). It is the most dominating crop for biogas production. Maize is
considered to have one of the highest yield potential of field crops grown in Central Europe.
The production of hydrogen from maize and their derivatives is still being at an early stage.
There are few studies in that field, reporting for H2 production using mixed microflora with
H2 yield of 62.4 mL/g dry matter fodder maize without pre-treatment (Martinez-Perez et al.
21
2007; Kyazze et al. 2008). Research on wheat and maize conversion to H2 using pure
thermophilic or extreme thermophilic anaerobic cultures has not been done so far.
1.2.3.2. Biofuel production from sweet sorghum and its derivatives bagasse and sweet
sorghum juice
The genus Sorghum is characterized by a vastly diverse germ plasm in terms of
phenotypic and morphological traits. Many of these have been exploited to give genotypes
suitable for grain and forage production as well as alternative uses, such as energy, pulp for
paper, food products, high grade chemicals and building products. It is a C4 crop, with a
fibrous root system that branches profusely. Under favorable conditions, the above ground
nodes may produce strong adventitious roots that may help anchor the plant and reduce
lodging The roots can be extended to a distance of up to 1 m and a depth of 1.8 m. Sweet
sorghum plants attain a height of up to 4 m. It is well adapted to the warm southern regions of
Europe and moderately well adapted to several central European regions with mild climates.
It is a cold-sensitive plant, so its adaptation in northern, cooler climates is poor. Historically,
syrup production was the main use of sweet sorghum, but nowadays this crop is being used as
animal fodder and is gaining attention as a potential alternative feedstock for energy and
industry, because of its high yield in biomass and, particularly, fermentable sugars.
Much of the work related to non-food agricultural production of sorghum has been
conducted on sweet sorghum because of the increased interest in sugar crops as potential
renewable resources that can be converted into ethanol. It has a shorter growing season than
sugarcane, and is therefore suitable to be grown in geographical areas with a temperate
climate. It has a rapid rate of growth. In several studies, sweet types have been evaluated for
fermentable sugar production and theoretical ethanol yields (Smith et al. 1987; Belletti et al.
1991), for the relationships between agronomic practices and yield (Broadhead and Freeman
1980), for optimal growth parameters (Shih et al. 1981; Tarantino et al. 1992), for the pattern
of soluble carbohydrates accumulation (Ferraris and Charles-Edwards 1986; Petrini et al.
1993), and for relevant physiological aspects of this metabolic process (Vietor and Miller
1990). Sweet sorghum can be converted into energy carriers through either one of two
pathways: biochemical and thermo-chemical. Through biochemical processes the crop sugars
22
can be converted to biofuels (ethanol, hydrogen). Thermo-chemical processes such as
combustion and gasification can be used for the conversion of the sweet sorghum bagasse (the
residual cake from crop pressing) to heat and electricity (Claassen et al. 2004). Unlike sweet
genotypes, nonsweet, and especially those characterized by stalk storage organ with high fiber
content, have had little attention so far.
Mamma et al. (1996) saccharified and fermented sweet sorghum carbohydrates to
ethanol by a mixed culture of Fusarium oxysporum and Saccharomyces cerevisiae in a
bioreactor. Fusarium oxysporum was grown aerobically for the production of the enzymes
necessary for the saccharification of sorghum cellulose and hemicellulose.
Although sweet sorghum has been thoroughly investigated as an energy crop for
bioethanol production, it was just recently tested as a potential source for biogas and hydrogen
production. The technologies for production of biogas from sweet sorghum is still on R&D
level but some results have been recently published by Antonopolulou et al. (2007; 2008).
Their study showed that sweet sorghum extract could be used for hydrogen and methane
production in a two-stage process. They proved that the effluent from the hydrogenogenic
reactor was an ideal substrate for methane production with approximately 107 L CH4/kg
sweet sorghum, 78 L of which come from the solid residues. The authors demonstrated that
biohydrogen production can be very efficiently coupled with a subsequent step of methane
production and that sweet sorghum could be an ideal substrate for a combined gaseous
biofuels production.
Ntaikou et al. 2008 used Ruminococcus albus chemostat cultures at 37 °C to produce
H2 from sorghum stalks, sorghum water extract, containing the free sugars, and sorghum
residues after the extraction process as substrates The hydrogen yield from sorghum water
extract was the same as the yield obtained from glucose batch experiments (approximately 2.5
mol H2/mol glucose). The hydrogen productivity of sorghum extract plus that of sorghum
residues equalled the hydrogen productivity obtained from the sorghum stalks, suggesting that
the process could be designed as a single-step process, avoiding the separate fermentation of
soluble and insoluble carbohydrates as well as the extraction process, without any
compromise in the hydrogen productivity. Hydrogen productivity was estimated to be
approximately 60 L of hydrogen per kg of wet sorghum biomass, proving that R. albus is
suitable for efficient hydrogen production from sweet sorghum biomass.
23
Bagasse is the fibrous biomass (cake) remaining after sorghum or sugarcane stalks are
pressed to extract their juice. In a sugarcane mill, freshly harvested sugarcane is shredded,
mixed with water, and crushed between heavy rollers to extract the juice, which is high in
sucrose (10-15%). The residue is used as a tree-free alternative for making paper. The process
requires no bleaching, it is biodegradable, easy to recycle and overall has less polluting affect
on the environment.
Bagasse is widely used for ethanol production from the sugar in sugarcane in Brazil.
The cellulose rich bagasse is currently being tested for production of cellulosic ethanol by
using yeasts and genetically modified bacteria (Martin et al. 2002; Dien et al. 2003; Boopathy
2005; Dawson and Boopathy 2007; 2008). The major limitations to efficient ethanol
production from bagasse come from the close physical and chemical associations between
lignin and plant cell wall polysaccharides, together with cellullose crystallinity. To convert
the biomass into ethanol, the cellulose must be readily available for cellulase enzymes, which
can be made possible by removing the lignin. Most reports on lignocellulosic ethanol involve
acid hydrolysis followed by expensive enzymatic saccharification (Martin et al. 2002). The
enzymatic step has been omitted by using recombinant and mutant bacteria (Dien et al. 2003;
Kim et al. 2007).
Bagasse has been extensively used in the past years for biogas production (Dellepiane
et al. 2003; Chinnaraj and Rao 2006). Dellepiane et al. (2003) discuss the economic
advantages and disadvantages of using bagasse for bioenergy in Latin America, a big
producer of sugarcane. Chinnaraj and Rao (2006) are regarding bagasse as a possibility to
reduce the methane and CO2 emissions in the atmosphere by using it in upflow anaerobic
sludge blanket digesters to replace the conventional anaerobically treated bagasse in lagoons.
Most of the hydrogen produced so far has been done by steam methane reforming of
natural gas for fuel cell vehicles. At low natural gas prices it is the least expensive way to
produce hydrogen but it relies on a non-renewable fossil fuel. Bowen et al. (2003) made a
techno-economic analysis of hydrogen production by gasification of three biomass
feedstocks: bagasse, switchgrass and nutshell mix. They concluded that H2 can be produced
economically from biomass gasification, with prices from $6.50 to $10.00 per 1 GJ compared
to $5.50 – $7.50 per 1GJ H2 from methane reforming. Chaudhari et al. (2003) produced
24
hydrogen and/or syngas from bagasse char and their results indicated that there was a strong
potential for H2 production using that method at temperatures of 700-800 °C and steam flow
rates of 1.25 to 10 g/h/g of bagasse char.
There are only few reports on biohydrogen production from sweet sorghum bagasse
and sweet sorghum juice. Bagasse has been pretreated with an acidic and alkaline catalyst for
increasing the biomass fermentability. The best results were obtained after the alkaline
pretreatment where 37.1 g glucose, corresponding to 60% cellulose conversion was obtained
from 100 g of original bagasse (Claassen et al. 2004). Sweet sorghum juice was also used for
biohydrogen production. Stalks were cut to 5-10 cm pieces and then milled. Three different
procedures were tested in order to produce the juice which was used as substrate for hydrogen
production: 1) pressing; 2) pretreatment and pressing; 3) water extraction and pressing the
residue. For the pretreatment a central composite design was applied with four design factors,
namely the temperature and the duration of the pretreatment, the pressure and the amount of
water added to the sample before pressing. The second pretreatment gave the best results.
Sweet sorghum juice supported the growth and H2 production by the extreme thermophile
Caldicellulosiruptor saccharolyticus for about 60 hours with an average production rate of 10
mmol H2/L.h during the first 16 hours and a maximal production rate of 21 mmol H2/L.h 10
hours after the start of fermentation. The authors concluded that the production of
biohydrogen had showed great promise to convert biomass such as sweet sorghum and its
byproducts to a pure hydrogen stream. Future optimisations of the micro-organisms and
system efficiency as well as research and development of process parameters such as
bioreactors’ design are needed.
1.3. The extreme thermophile Caldicellulosiruptor saccharolyticus
1.3.1. Characteristics of the extreme thermophiles (extremophiles)
Heat-loving microbes, or thermophiles reproduce readily in temperatures greater than
45 °C, and some of them, referred to as hyperthermophiles favour temperatures above 75-80
25
°C, up to 100 °C or even higher. Thermophiles that grow at temperatures up to 60 °C have
been known for a long time, but true extremophiles were first discovered only 40 years ago in
1968 by Thomas Brock at the University of Wisconsin, Madison, USA. He isolated
microorganisms growing at 80°C and higher in hot springs at Yellowstone National Park.
Among them was the bacterium Thermus aquaticus that later made possible the widespread
use of a revolutionary technology – the polymerase chain reaction (PCR) (Madigan and
Marrs, 1997). Hyperthermophiles have been isolated almost exclusively from environments
with in situ temperatures between about 75-80 and 115°C. Natural biotopes of
hyperthermophiles on land are water containing volcanic areas, hot springs, with low salinity
and a wide range of pH values (around pH 0.5–8.5). Marine biotopes are shallow submarine
hydrothermal systems, abyssal hot vents (‘Black Smokers’), and active seamounts. These
environments contain high concentrations of salt (around 3%) and the pHs are slightly acidic
to slightly alkaline (pH 5–8.5). In addition, smoldering coal refuse piles and geothermal
power plants are man-made biotopes for hyperthermophiles (Fuchs et al., 1995). Communities
of hyperthermophiles have also been discovered within oil-bearing deep geothermally heated
soils. Due to the low solubility of oxygen at high temperatures and the presence of reducing
gasses, biotopes of hyperthermophiles are mainly anoxic. Although unable to grow,
hyperthermophiles may survive for long times at ambient temperature. This ability may be
essential for dissemination through the cold atmosphere and hydrosphere. Hyperthermophiles
are well adapted to their biotopes. Within their habitats, they form complex ecosystems
consisting of a variety of primary producers and decomposers of organic matter. Primary
producers are chemolithoautotrophs using inorganic electron donors and acceptors in their
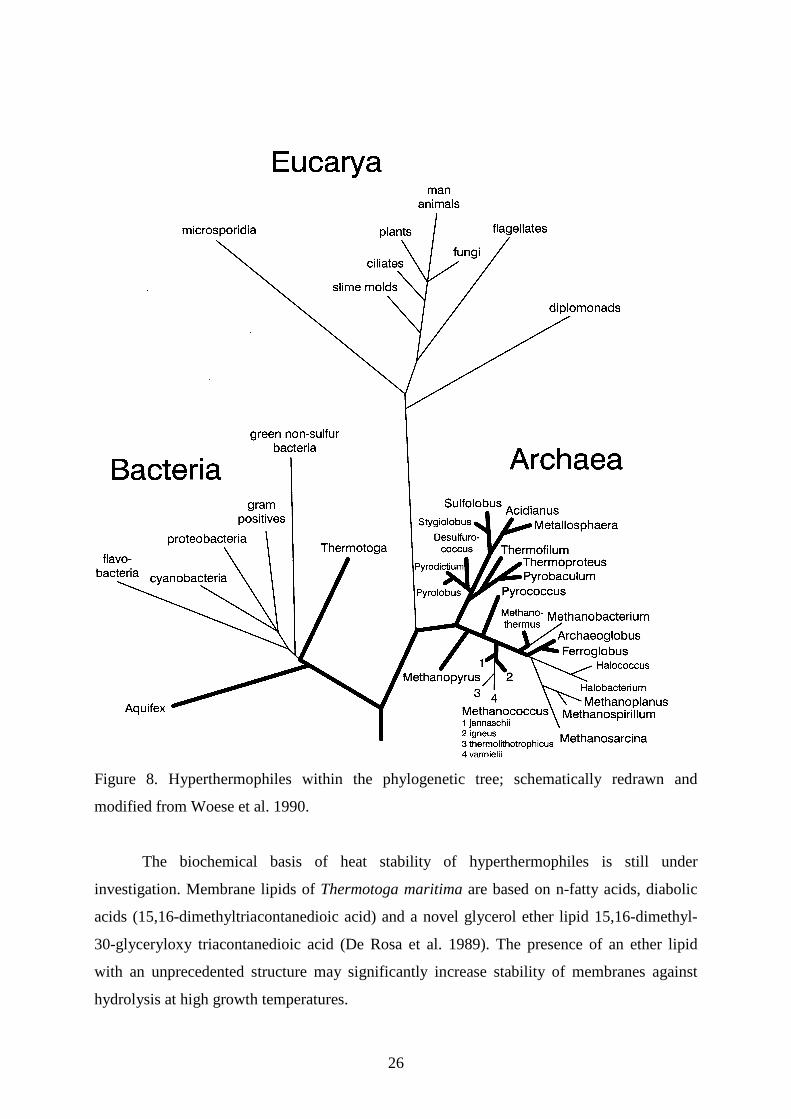
energy-yielding reactions. The 16S rRNA-based universal phylogenetic tree shows a tripartite
division of the living world consisting of the domains Bacteria, Archaea and Eucarya (Woese
et al. 1990; Fig. 8). The root is derived from phylogenetic trees of duplicated genes of ATPase
subunits and elongation factors Tu and G (Iwabe et al. 1989). Short phylogenetic branches
indicate a rather slow distance of evolution. Deep branching points are evidence for early
separation of two groups. Surprisingly, all the deepest and shortest lineages within the
universal phylogenetic tree are represented by hyperthermophiles, including Aquifex and
Thermotoga within the Bacteria; Pyrodictium, Pyrolobus, Pyrobaculum, Desulfurococcus,
Sulfolobus, Methanopyrus, Thermococcus, Methanothermus, Archaeoglobus within the
Archaea (Fig. 8, bold lines). Based on these observations, hyperthermophiles appear to be the
most primitive organisms still existing and the first common ancestor may have been a
hyperthermophile (Stetter 1994).
26
Figure 8. Hyperthermophiles within the phylogenetic tree; schematically redrawn and
modified from Woese et al. 1990.
The biochemical basis of heat stability of hyperthermophiles is still under
investigation. Membrane lipids of Thermotoga maritima are based on n-fatty acids, diabolic
acids (15,16-dimethyltriacontanedioic acid) and a novel glycerol ether lipid 15,16-dimethyl-
30-glyceryloxy triacontanedioic acid (De Rosa et al. 1989). The presence of an ether lipid
with an unprecedented structure may significantly increase stability of membranes against
hydrolysis at high growth temperatures.
27
In view of an enormous, so far uncultivated variety of hyperthermophiles (Barns et al.
1994), a further strategy to obtain novel enzymes could be based on DNA extraction directly
from the environment, followed by gene expression, robot screening, and cloning in
production strains of (mesophilic) microorganisms (Robertson et al. 1996). By comparison of
sequences of homologous enzymes, properties can be assigned to specific gene segments
which may be important for future enzyme design.
The hyperthermophiles’ enzymes are gaining new fields of applications. A major
commercial application of a thermostable enzyme so far is the polymerase- chain-reaction
(PCR) employing the DNA polymerase of Thermus aquaticus. In the future the whole variety
of hyperthermophilic isolates may serve as a source of enzymes with very different properties.
For example, the DNA polymerase of P. furiosus (Pfu) as well as that of T. maritima
(UITma™) with their higher fidelity due to proofreading, are already commercially available
now. Thermophilic hydrolases such as proteases, lipases, amylases, and xylanases are of
interest of several branches of industry for detergents, starch processing, paper mills, and
dairy products. Novel metabolites can give rise to new pharmaceuticals. For example,
Thermococcus forms organic sulphur compounds related to lenthionin, some of which are
pharmaceutically active (Ritzau et al. 1993). Oil-degrading hyperthermophiles form
surfactants, suitable for oil recovery. In addition, hyperthermophiles are directly applied in
technical processes like bioleaching of sulphide ores and in coal desulphurization. In
biohydrometallurgy representatives of Sulfolobus, Acidianus and Metallosphaera are applied
in leaching processes. This includes the treatment of refractory gold ores (by removing the
pyrite or arsenopyrite), the leaching of low grade ores (e.g. copper, zinc ores) or the removal
of pyrite from coal. The high turnovers, compared to mesophilic leaching organisms (Huber
and Stetter 1991) recommend hyperthermophiles even for reactor leaching of ore concentrates
in continuous processes. High temperatures arise due to self-heating during the biological
leaching process. Within heaps temperatures up to 80°C have been measured and in reactor
leaching the costs for cooling can be saved by using the archaeal hyperthermophilic leaching
organisms.
28
1.3.2. Properties of Caldicellulosiruptor saccharolyticus (C. saccharolyticus)
H2 production by strict anaerobic, thermophilic and extreme thermophilic bacteria has
not been fully elucidated yet. The number of reports on these topics continues to increase
(Adams 1990; Li and Borchardt 1995; Kengen et al. 1996; Ueno et al. 1996 and Rainey et al.
1994). Caldicellulosiruptor saccharolyticus has been first discovered by Rainey et al. (1994)
and described as an obligately anaerobic, extreme thermophilic rod-shaped bacterium,
isolated from thermal springs at 70-75 °C. It has attracted considerable attention by virtue of
its ability to degrade various polysaccharide substrates (e.g. amorphous cellulose and starch),
disaccharides (e.g. cellobiose and sucrose) and monosaccharides (e.g. glucose, fructose and
xylose) (Rainey et al. 1994; Van Niel et al. 2002) at temperatures above 70 °C. The
multifunctional, multidomain organization of the majority of C. saccharolyticus β-glycanases
(e.g. β-glucosidase and endo-1,4-β-mannosidase) (Bergquist et al. 2000), xylanases and
cellulases (Bergquist et al. 1999; Gibbs et al. 2000 and Sunna et al. 2000) makes this strain a
unique candidate for biotechnological exploitation. In consequence of its ability to convert
various sugars to H2 C. saccharolyticus has been selected for the fermentative production of
H2 from sucrose (Van Niel et al. 2003), from industrial waste paper sludge (Kadar et al.
2004), and from sources such as domestic organic waste, agro-industrial residues and energy
crops (Claassen et al. 1999). Its production rates are superior to those of the mesophiles
(Adams 1990). In anaerobic digestion H2-producing bacteria usually function in syntrophy
with hydrogenotrophic methanogens, which consume H2 (Claassen 2005). In this respect, C.
saccharolyticus can also be employed in biogas production technologies on the basis of its
ability to utilize pentose and hexose sugars (Bagi et al. 2007).
In contrast to mesophilic fermentative anaerobes, C. saccharolyticus produces almost no
reduced end products, such as lactate or ethanol, and the amount of hydrogen approaches 4
mol H2/mol glucose. The complete genome sequence of C. saccharolyticus provides new
insights into the exceptional capacity of that bacterium to degrade a variety of plant
polysaccharides and further reveals its plasticity with many transposases, sugar hydrolases
and transferases. Metabolic pathways for the degradation of residual components of cellulose,
hemicellulose, starch and pectin could be assigned (Fig. 9 (A)). Reducing equivalents are
produced as NADH or reduced ferredoxin, which are used to produce H2 by a soluble NADH-
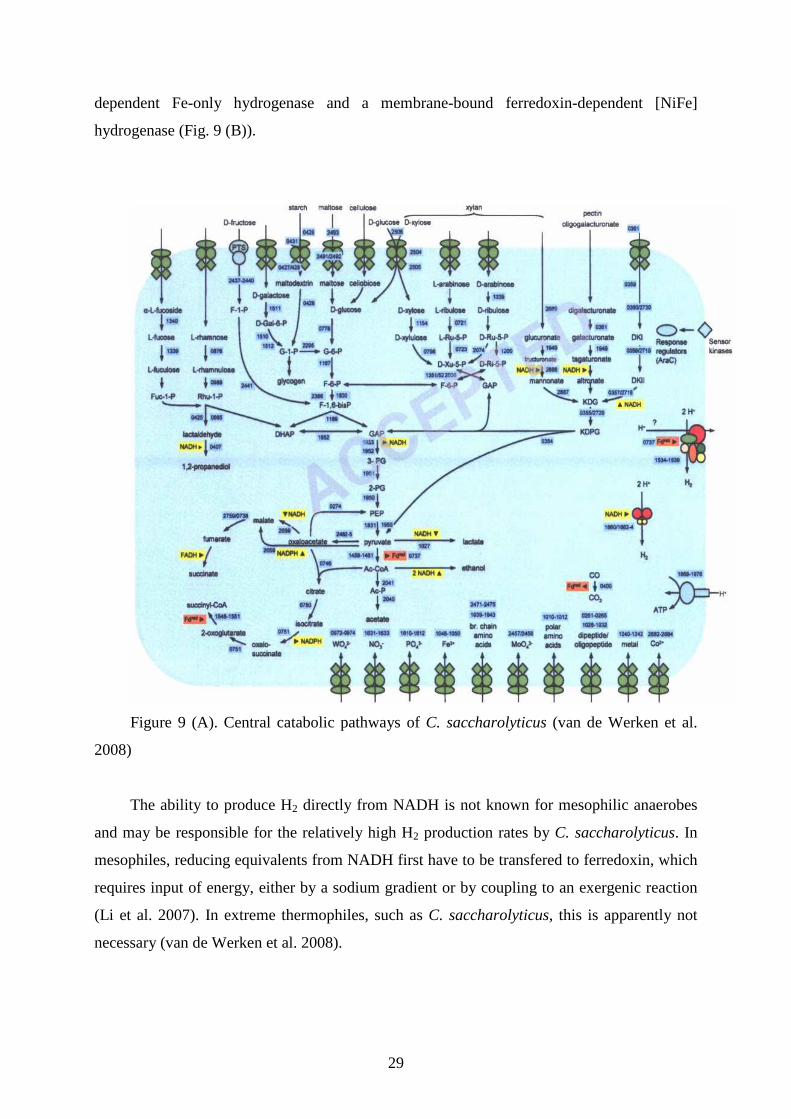
29
dependent Fe-only hydrogenase and a membrane-bound ferredoxin-dependent [NiFe]
hydrogenase (Fig. 9 (B)).
Figure 9 (A). Central catabolic pathways of C. saccharolyticus (van de Werken et al.
2008)
The ability to produce H2 directly from NADH is not known for mesophilic anaerobes
and may be responsible for the relatively high H2 production rates by C. saccharolyticus. In
mesophiles, reducing equivalents from NADH first have to be transfered to ferredoxin, which
requires input of energy, either by a sodium gradient or by coupling to an exergenic reaction
(Li et al. 2007). In extreme thermophiles, such as C. saccharolyticus, this is apparently not
necessary (van de Werken et al. 2008).
30
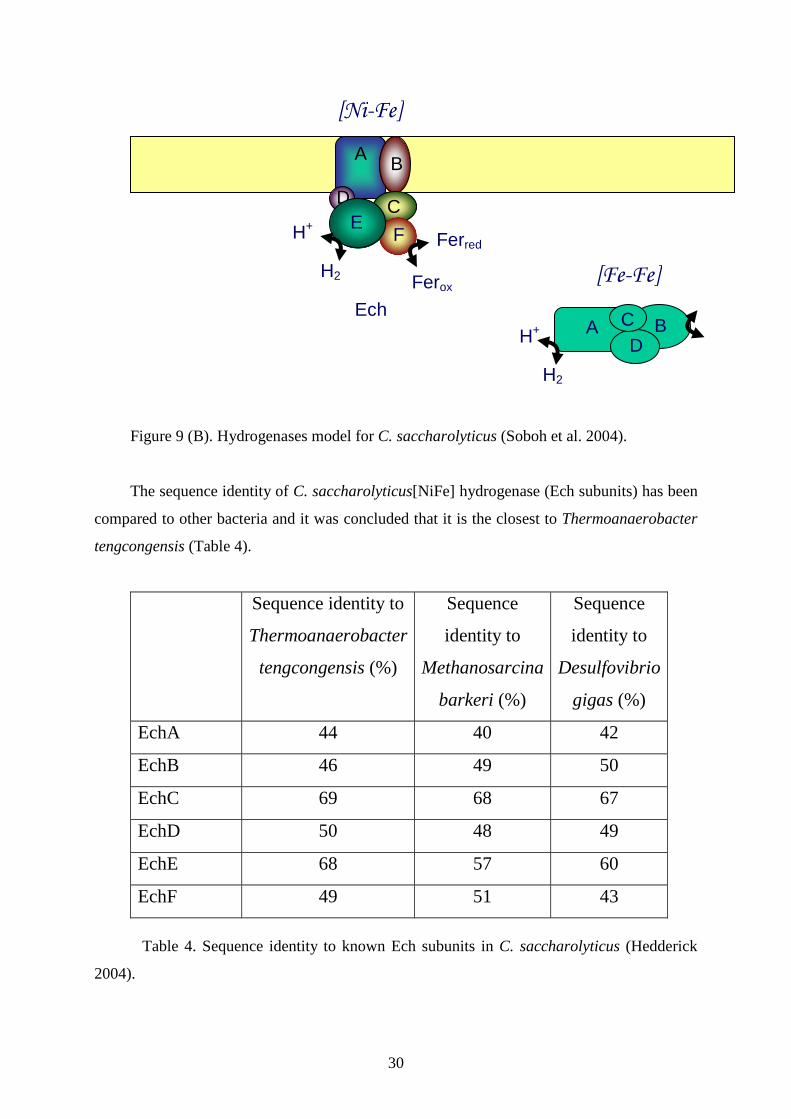
Figure 9 (B). Hydrogenases model for C. saccharolyticus (Soboh et al. 2004).
The sequence identity of C. saccharolyticus[NiFe] hydrogenase (Ech subunits) has been
compared to other bacteria and it was concluded that it is the closest to Thermoanaerobacter
tengcongensis (Table 4).
Sequence identity to
Thermoanaerobacter
tengcongensis (%)
Sequence
identity to
Methanosarcina
barkeri (%)
Sequence
identity to
Desulfovibrio
gigas (%)
EchA 44 40 42
EchB 46 49 50
EchC 69 68 67
EchD 50 48 49
EchE 68 57 60
EchF 49 51 43
Table 4. Sequence identity to known Ech subunits in C. saccharolyticus (Hedderick
2004).
A B
C D E
F
Ech
H+
H2 Ferox
Ferred
[Ni-Fe]
[Fe-Fe]
A B D H+
H2
C
31
The absence of catabolite repression by glucose is an important characteristic for
biohydrogen producers since it allows them to process an array of biomass-derived substrates
simultaneously. Glucose did not repress the use of xylose in C. saccharolyticus. The EM
pathway was not affected by the hexose or pentose substrate, in contrast to the transcriptome
analysis of E. coli (van de Werken 2008).
1.4. Rationale of whole cell immobilization and its application in biotechnology
1.4.1. Methods for immobilization of whole cells and their application in
biotechnology
Immobilized cell technologies have widely developed since the early 1960s, and
thousands of such documents are currently available. Immobilized cell (IC) systems can be
separated into artificial and naturally occurring ones. In the first category, microbial (or
eukaryotic) cells are artificially entrapped in or attached to various matrices/supports where
they keep a viable state, depending on the degree of harm of the immobilization procedure.
Polysaccharide gel matrices, more particularly Ca-alginate hydrogels (Gerbsch and Buchholz
1995), are by far the most frequently used materials for cell entrapment. The main benefit
derived from the use of whole cells instead of enzymes was to avoid enzyme extraction and
purification steps and their consequences on enzyme activity, stability and cost. As viable ICs
are able to multiply during substrate catabolism while remaining confined within the
immobilization structures (polysaccharide gel matrix of artificially gel-entrapped cells) high
cell densities may be expected in IC cultures, leading to high volumetric reaction rates. The
ability to grow in an immobilized state makes the regeneration of IC cultures possible after
having them incubated under hostile conditions such as low-nutrient medium or presence of
toxic compounds.
Cell attachment to an organic or inorganic support may be obtained by creating
chemical (covalent) bonds between cells and the support using cross-linking agents such as
glutaraldehyde or carbodiimide. The spontaneous adsorption of microbial cells to different
types of carrier gives natural immobilized cell systems in which cells are attached to their
32
support by weak (non-covalent), generally non-specific interactions such as electrostatic
interactions. In suitable environmental conditions, this initial adsorption step may be followed
by colonization of the support, leading to the formation of a biofilm in which microorganisms
are entrapped within a matrix of extracellular polymers they themselves secreted. Owing to
the presence of this polymer paste, biofilms are more firmly attached to their substratum than
merely adsorbed cells. Surface colonization to form biofilms is a universal bacterial strategy
for survival, and undesirable biofilms may occur on inert or living supports in natural or
biological environments as well as in industrial installations. The last 10 years have known a
burst in the number of published investigations on these natural immobilized cell systems
(Fig. 9B).
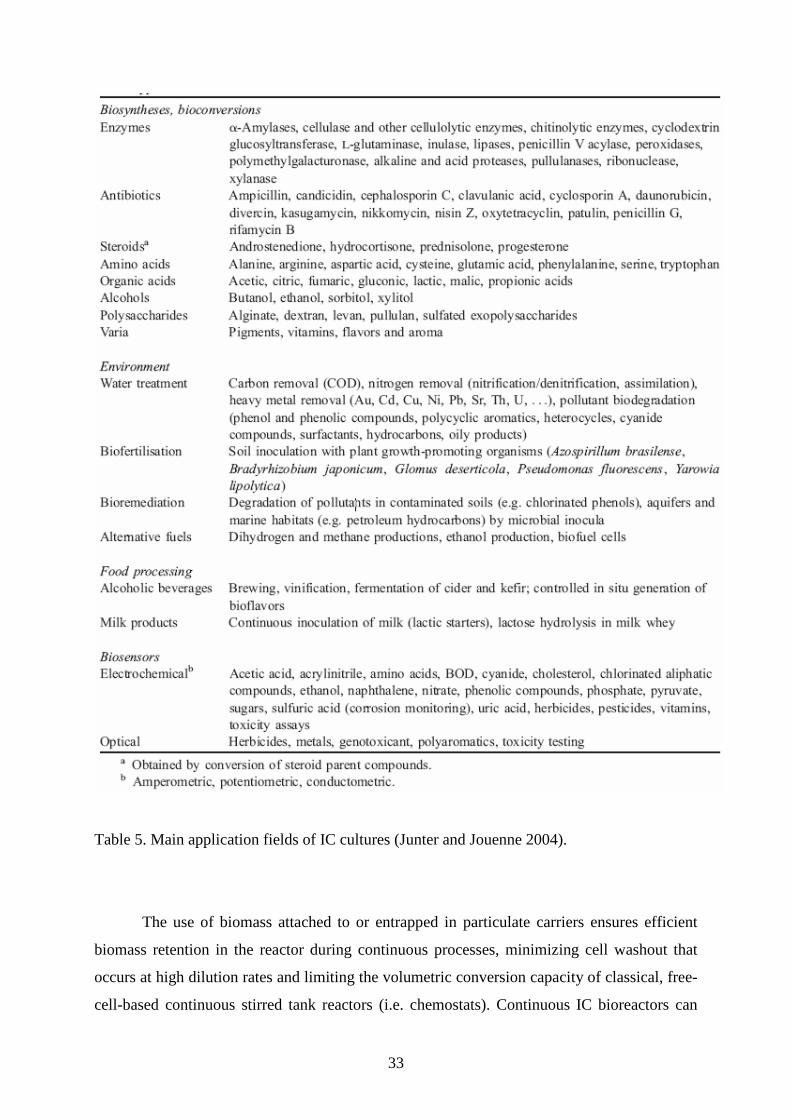
As detailed in Table 5, a large part of published data on artificial or natural IC systems
concerns their operation in bioreactors where they perform biosyntheses or bioconversions
leading to a variety of compounds, ranging from primary metabolites to high-value
biomolecules. IC cultures have also been widely applied to the treatment of domestic or
industrial wastewaters containing different types of pollutants such as nitrate/nitrite ions,
heavy metals or organic compounds recalcitrant to biodegradation. Together with brewing
and wine-making processes, biosensors for environmental monitoring, food quality analysis
and fermentation process control complete the main application fields of ICs. Faced with
these dominant and prolific developments, research on the physiological behaviour of
microbial cells in the immobilized state remains paradoxically limited.
33
Table 5. Main application fields of IC cultures (Junter and Jouenne 2004).
The use of biomass attached to or entrapped in particulate carriers ensures efficient
biomass retention in the reactor during continuous processes, minimizing cell washout that
occurs at high dilution rates and limiting the volumetric conversion capacity of classical, free-
cell-based continuous stirred tank reactors (i.e. chemostats). Continuous IC bioreactors can
34
therefore be operated at high load, even when diluted feeds are used: a definite advantage in
wastewater treatment. Easier downstream processing, due in particular to facilitated
cell/liquid separation, represents another asset of fermentation processes using IC cultures.
From the outset of IC technology, enhanced operational and storage stabilities have been
presented as a key feature for practical development of viable IC systems. These stabilities
involve both biological and mechanical characteristics of IC biocatalysts. In order to explain
the increase in the biological stability of ICs Dervakos and Webb (1991) proposed several
hypotheses based on IC’s ability to grow. Biological stabilization was explained by a
prolonged operational time and improved resistance to storage periods. Long-term biological
activities were allowed by alternate operations of ICs between growth and non-growth
conditions, adapted to non-growth-associated processes, as well as by periodic rejuvenation of
the biocatalyst in nutrient-rich medium.
A major characteristic of ICs is their high resistance to environmental stresses, in
particular, the exposure to toxic compounds. The biodegradation of toxic compounds,
pollutants and xenobiotics also represents a preferential application field of IC systems. The
high biodegradation efficiency and operational stability of IC cultures, highlighted for
instance, during continuous biodegradation assays of phenol and phenolic derivatives is
typically ascribed to some protecting effect of the immobilization support (Dervakos and
Webb, 1991), rather than to enhanced specific degradation capacity that might involve
physiological modifications in ICs. In the case of the widely investigated biodegradation of
phenol, several authors have implied reversible adsorption of the pollutant on the
immobilization matrix (Cassidy et al., 1997; Annadurai et al., 2000).
The potential advantages of IC systems over conventional fermentations can be
summarized as follows:
- Higher reaction rates due to increased cell densities;
- Possibilities for regenerating the biocatalytic activity of IC structures;
- Ability to conduct continuous operations at high dilution rate without washout;
- Easier control of the fermentation process;
- Long-term stabilization of cell activity;
- Reusability of the biocatalyst;
- Higher specific product yields.
35
The technological obstacles to a large-scale industrial implementation of IC systems
have also been regularly investigated, with particular emphasis on the mass transfer
limitations inside immobilization matrices and the coupled transport-reaction phenomena that
control the performance of IC cultures. Therefore, it appears that the initial rationale for IC
development essentially concerned the engineering level, with very few - if any - queries on
the physiological behaviour of microbial cultures in the immobilized state. This historical
prevalence of applications over more basic investigations may explain why our present
knowledge of IC physiology still remains fragmentary. A major physiological characteristic
of ICs is their high resistance to environmental stresses, in particular, the exposure to toxic
compounds. Some reports connect this resistance to changes in structural features affecting IC
permeability, namely the composition and organization of the cell wall and the plasma
membrane (Jirku 1999). The high biodegradation efficiency and operational stability of IC
cultures, highlighted for instance, during continuous biodegradation assays of phenol and
phenolic derivatives (Table 5), is typically ascribed to some protecting effect of the
immobilization support (Dervakos and Webb, 1991), rather than to enhanced specific
degradation capacity that might involve physiological modifications in ICs. A variety of
bacteria at surfaces and within biofilms have been shown to display altered gene expression as
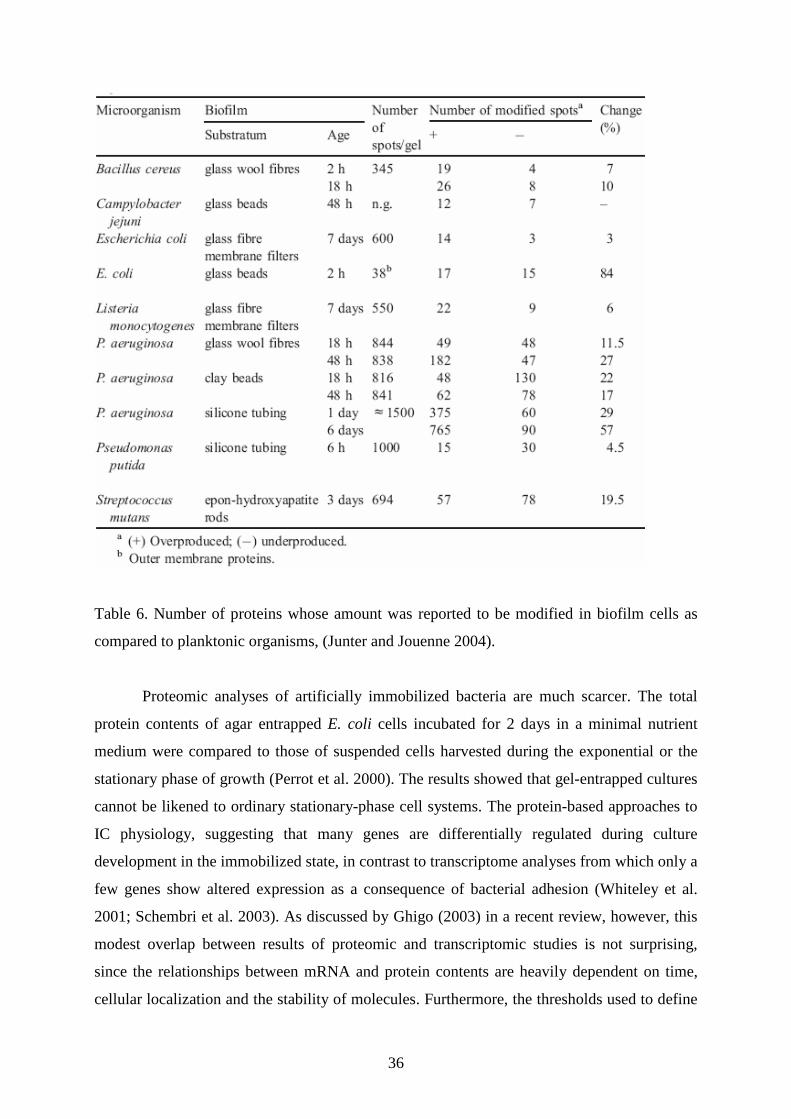
compared to planktonic organisms (Whiteley et al. 2001; Schembri et al. 2003). Most
proteomic analyses of biofilm cells consists of comparing the crude protein patterns of
organisms cultured in the sessile (immobilized) and planktonic (suspended) modes. These
studies have revealed some alterations in the bacterial protein profiles ranging from 3% to
more than 50% of the detected protein spots which gives evidence of significant physiological
differences between the two modes of growth.
36
Table 6. Number of proteins whose amount was reported to be modified in biofilm cells as
compared to planktonic organisms, (Junter and Jouenne 2004).
Proteomic analyses of artificially immobilized bacteria are much scarcer. The total
protein contents of agar entrapped E. coli cells incubated for 2 days in a minimal nutrient
medium were compared to those of suspended cells harvested during the exponential or the
stationary phase of growth (Perrot et al. 2000). The results showed that gel-entrapped cultures
cannot be likened to ordinary stationary-phase cell systems. The protein-based approaches to
IC physiology, suggesting that many genes are differentially regulated during culture
development in the immobilized state, in contrast to transcriptome analyses from which only a
few genes show altered expression as a consequence of bacterial adhesion (Whiteley et al.
2001; Schembri et al. 2003). As discussed by Ghigo (2003) in a recent review, however, this
modest overlap between results of proteomic and transcriptomic studies is not surprising,
since the relationships between mRNA and protein contents are heavily dependent on time,
cellular localization and the stability of molecules. Furthermore, the thresholds used to define
37
over - and down - regulations in both transcriptomic and proteomic analyses suffer from the
lack of standardization, which may contribute to these discrepancies.
1.4.2. Immobilization of whole cells by adsorption
Compared to the immobilization of cells by entrapment into organic polymers, the
adsorption is a process, suitable mainly for viable cells. The binding of the cells is rendered
by Van der Waals forces and ionic or covalent interactions and sometimes microbial
exopolymers are involved in the process as well. The metabolic status of the adsorbed cells is
important. In identical environment different kind of organisms show a different adsorption
behaviour (Ellwood et al. 1982). Hattori and Hattori (1987) distinguished between strongly
and loosely attached E. coli cells while before the adsorption experiment all cells were in the
same physiological state. A direct correlation between growth rate and adsorption was
observed with Pseudomonas cells in continuous culture (Nelson et al. 1985). Very high
adsorption rates have been obtained at a very low dilution rate, corresponding to low growth
rate.
The selection of the adsorption matrix should be influenced by several parameters.
The material has to be cheap and available in large amounts and the immobilization process
must be simple and effective in regard to yield and retaining the cell activities. Cheap
inorganic (fired bricks, sand particles, ceramics, metallic hydroxides and porous glass) and
organic carriers (charcoal, wood shavings and organic polymers like collagen, cellulose,
carrageenan, alginate, albumin, polyvinylchlorides, polypropylene, polysaccharides, ion
exchange resins, epoxides and polyurethanes) are widely available. Adsorption has to be
preferred, being the more simple immobilization method. That was proved by using porous
glass or lava-based fixed-bed reactors in the fields of aerobic (Bohnke 1981) and anaerobic
(Aivasidis 1984) waste water purification, for gas elimination in the form of trickling filters
and biofilters (Ottengreaf 1987), or in environmental technologies and vinegar production.
38
2. Aim of the study
Hydrogen has been accepted as an attractive, clean and renewable energy carrier.
Since it is unavailable in nature, inexpensive production methods are to be established. In
order to replace the conventional fossil fuels, depleting at a fast speed, with environmentally
friendly and economically feasible resources for hydrogen production, new substrates and
new biological activities need to be found. This research has been urged by the need of
recognizing such resources - cheap, widely spread or discarded as wastes, which are readily
degradable by the hydrogen-producing extremophile C. saccharolyticus.
In addition to identifying new substrates for H2 production, requiring adequate
enzymatic activities of C. saccharolyticus, optimal conditions for the storage of C.
saccharolyticus on suitable immobilization support matrices were targeted. They were aimed
to preserve the hydrogen producing capacity and the survival of the cells to the best extent.
More specifically, my study had the following main goals:
1. To demonstrate that C. saccharolyticus has diverse fermentation pathways
for utilization of energy-rich biopolymers, discarded as wastes in the
environment.
2. To select widely available and cheap polysaccharidic and cellulolytic
substrates, which are readily metabolized by C. saccharolyticus, producing
hydrogen.
3. To screen for suitable, non-toxic and cheap solid immobilization support
matrices to stabilize the hydrogen-producing system.
4. To establish the optimal storage conditions for C. saccharolyticus.
5. To improve the productivity and prolong the storability of the immobilized
C. saccharolyticus cells.
6. To select for support matrices, which have a duel function for the cells -
ones, which not only provide a solid surface for the cells, but also play a
role of a substrate, which maintains the viability and preserve the
physiology of stored cells over time.
39
3. Materials and methods
3.1. Microorganism, medium and culture conditions
C. saccharolyticus (DSM8903) was purchased from Deutsche Sammlung von
Mikroorganismen und Zellkulturen GmbH (DSMZ) and propagated at 70 oC on DSMZ
medium 640 in anaerobic 50 ml hypovials (Supelco) until OD600 = 0.5 cm-1, corresponding to
3x10⁷ CFU ml-1, was attained. Routine manipulations were performed in an anaerobic
chamber (Bactron IV, Sheldon Manufacturing, Inc., Canada). The inoculum size was 3%
(v/v). LMA and AA were purchased from Sigma – Aldrich, Germany. They were added in
concentrations of 0.1 to 0.7% (w/v) to the growth medium prior to sterilization at 120 oC for
30 min. Control batches were grown without any additives.
3.2. Cell growth, viable cell counts and cell biomass
Viable cell counts were determined as colony forming units (CFU) by plating on
DSMZ medium 640 solidified with 2.5% Gelrite Gellan Gum (Sigma-Aldrich, Germany)
(Rakhely and Kovacs 1996). Plates were incubated at 70 oC in the anaerobic chamber for 3 to
4 days in order to develop the colonies.
Cell biomass was determined as cell dry weight (CDW). 100-ml cell suspensions were
centrifuged at 15,000 x g for 15 min at 4 oC (Heraeus Biofuge Stratos, Kendro Laboratory
Products GmbH, Germany) for biomass measurements. When LMA was used as an additive,
centrifugation was carried out at 30 oC to avoid solidification. The pellets were washed with
phosphate-buffered saline (PBS), resuspended in water and dried at 70 oC to constant weight.
40
3.3. Analysis of hydrogen production
35-ml aliquots of exponentially growing cultures were placed into 50-ml gas-tight
hypovials fitted with rubber septa and flushed with N2 for 10 min prior to incubation at 70 oC.
H2 production was measured by injecting 250-µl aliquots from the headspace into a gas
chromatograph (6890N Network GC System, Agilent Technologies. Inc., USA) equipped
with a 5Å molecular sieve column (L 30 m, I.D. 0.53 megabore, film 25 µm) and a thermal
conductivity detector. The GC was calibrated with pure H2. This method measures only the
H2 content of the gas phase; other gaseous components, e.g. CO2 were not determined. The
vials were flushed with N2 after each daily measurement. Specific H2 production was
calculated by dividing the amount of H2 evolved by the cells by the CFU.
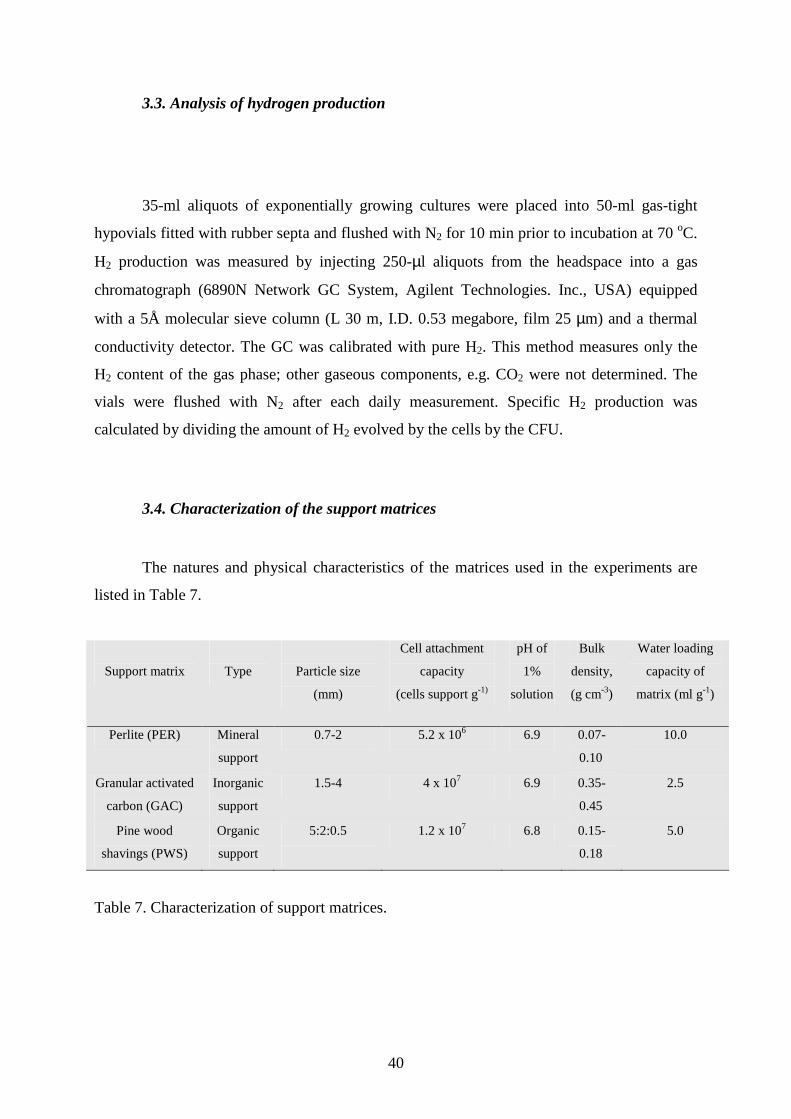
3.4. Characterization of the support matrices
The natures and physical characteristics of the matrices used in the experiments are
listed in Table 7.
Support matrix
Type
Particle size
(mm)
Cell attachment
capacity
(cells support g-1)
pH of
1%
solution
Bulk
density,
(g cm-3)
Water loading
capacity of
matrix (ml g-1)
Perlite (PER) Mineral
support
0.7-2 5.2 x 10⁶ 6.9 0.07-
0.10
10.0
Granular activated
carbon (GAC)
Inorganic
support
1.5-4 4 x 10⁷ 6.9 0.35-
0.45
2.5
Pine wood
shavings (PWS)
Organic
support
5:2:0.5
1.2 x 10⁷ 6.8 0.15-
0.18
5.0
Table 7. Characterization of support matrices.
41
Perlite (PER) was obtained from Corax-Bioner Corp., Hungary, granular activated
carbon (GAC) was purchased from Chemviron Carbon, Belgium, and the pine wood shavings
(PWS) were kindly provided by a local carpentry shop. One gram of each matrix was placed
individually in a vial containing 10 ml of cell culture in the stationary phase (0.63 x 10⁷ CFU
ml-1) and the vial was sealed and flushed with N2 for 10 min prior to gentle shaking at 70 oC
for 1 h. The cell-binding capacity of each immobilization matrix was determined by
subtracting the initial CFU of the culture in the vial from the CFU of the supernatant (Table
7).
3.5. Cell immobilization, storage and analysis of stored cells
The matrices used in the experiments were chosen on the basis of previous reports on
their use for the immobilization of bacterial and fungal cells (Dervakos and Web 1991;
Razmovski and Pejin 1996Raihan et al. 1997). The supports were washed in PBS, sterilized
and dried. The cell concentration was adjusted to 5% (v/v). 0.700 g of GAC, 0.175 g of PER
or 0.350 g of PWS was placed in 50 ml hypovials. Freshly grown liquid culture alone (LC), or
LC containing the additives LMA or AA was added to the support matrices until the maximal
loading capacity of the support matrices was attained. The vials were sealed, flushed with N2
for 10 min and stored at 42 oC for various periods of time. After storage fresh growth
medium, with or without additive, was added anaerobically to the hypovials, which were then
heated at 70 °C. LCs, grown with or without additives, were stored under the same conditions
and sub-cultured in fresh growth medium to serve as controls. H2 production was measured
daily and the gas phase was replaced with N2 after each measurement.
3.6. Protein measurement
Protein was determined by an ND-1000 Spectrophotometer V3.1, (NanoDrop
Technologies, Inc., USA) at 280 nm, using bovine serum albumin as standard.
42
3.7. One-dimensional SDS-PAGE analysis of proteins
For the analysis of crude extract proteins, cells (0.5 x 10⁷ CFU ml-1) were harvested by
centrifugation at 12,000 x g, suspended in 50mM Tris-HCl, pH 8.0 and disrupted with a
French press (Thermo IEC, USA). Approximately equal amounts of protein were loaded onto
each lane of 5-15% gradient sodium dodecylsulfate–polyacrylamide (SDS-PAGE) gels
(Sambrook et al. 1989).
For the analysis of extracellular proteins, cells were centrifuged at 12,000 x g for 20
min and the supernatants were filtered through a cellulose acetate membrane filter (Schleicher
& Schuell, Germany) with a 0.2 µm cut-off. The proteins were concentrated by the acetone
precipitation method (Rosenberg 1996). SDS-PAGE was performed as above.
3.8. Total organic carbon analysis
Total organic carbon was analyzed on an Apollo 9000 Combustion TOC Analyzer
(Tekmar Dohrmann, USA). Carbon in the injected sample (50 µl) was first converted to CO2
in the combustion furnace for total organic carbon (TOC) and total carbon (TC) analysis at
temperatures from 680 °C to 1000 °C. The carrier gas was nitrogen. The standards used were
potassium acid phthalate and sodium bicarbonate. The water used in the analyzer was
organic-free deionised water.
3.9. Total solids content analysis
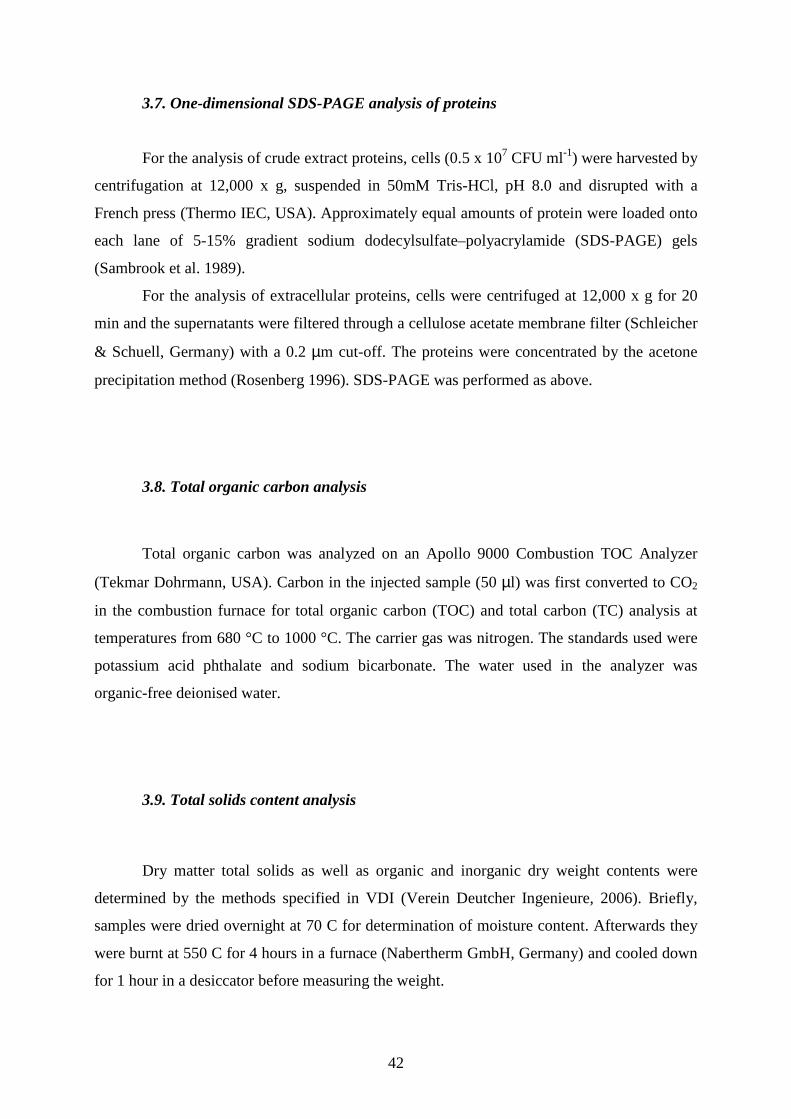
Dry matter total solids as well as organic and inorganic dry weight contents were
determined by the methods specified in VDI (Verein Deutcher Ingenieure, 2006). Briefly,
samples were dried overnight at 70 C for determination of moisture content. Afterwards they
were burnt at 550 C for 4 hours in a furnace (Nabertherm GmbH, Germany) and cooled down
for 1 hour in a desiccator before measuring the weight.
43
Substrate Dry matter total solids,
%
Organic dry-weight
content, %
Inorganic dry-weight content, %
Sorghum leaves 29.81 90.71 9.29 Sorghum stem 20.94 95.47 4.53 Sorghum juice 15.06 75.89 24.11
Sorghum juice 65 °Bx 74.01 90.92 9.08 Sugarcane bagasse 94.88 92.73 7.27
Wheat straw 95.43 90.24 9.76 Maize leaves 95.45 84.6 15.4
Pretreated maize 46.83 91.02 8.98 Silphium 41.67 78.67 21.33
Table 8. Total solids content of the biomass for H2 production.
3.10. Determination of glucose concentration
Glucose concentration in the medium was determined by the DNSA method as
described by Miller 1959.
44
4. Results and discussion
4. 1. Utilization of polymeric substrates by C. saccharolyticus
4.1.1. Agarose and alginic acid as a source for H2 production by C. saccharolyticus
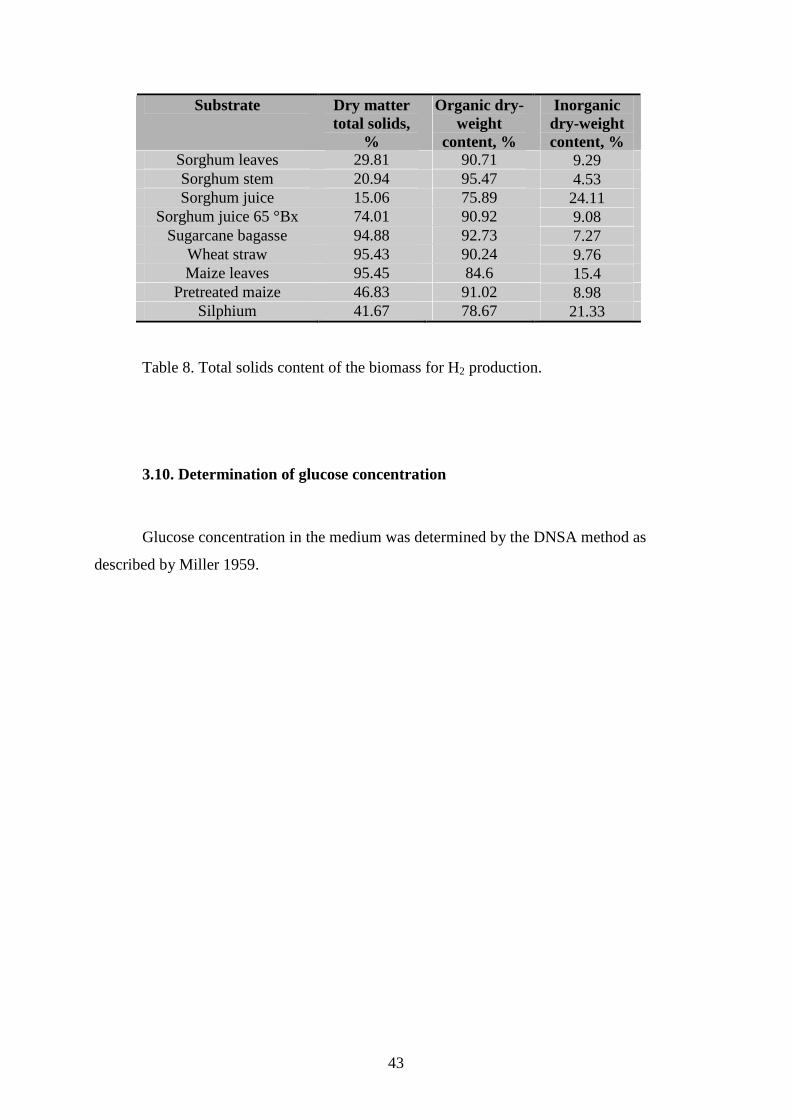
The freely suspended liquid cultures (LCs) of C. saccharolyticus retained hydrogen
evolving capacity for up to 8 days when the initial medium contained cellobiose (CB) and
yeast extract (YE). The polymers of polysaccharide derivatives LMA and AA were found to
be consumed as carbon and energy sources by C. saccharolyticus. The polymers were tested
in the concentration range 0.1-0.7% (w/v). In almost all the experiments, 0.1% (w/v)
cellobiose (CB) was used, in addition to the standard YE, as a readily metabolized carbon
source to facilitate the initial cell growth. Propagation in the presence of LMA and AA caused
elevated H2 evolution (Fig. 10).
0
5000
10000
15000
20000
25000
0% 0.2% 0.4% 0.5% 0.6% 0.7%
Amount of additive (%)
To
tal s
pec
ific
hyd
rog
en p
rod
uct
ion
(pL
H2
CF
U-1
)
LMA
AA
Figure 10. Total H2 production by liquid cultures grown on cellobiose (CB) and CB with low-
melting agarose (LMA) or alginic acid (AA) added in various concentrations.
45
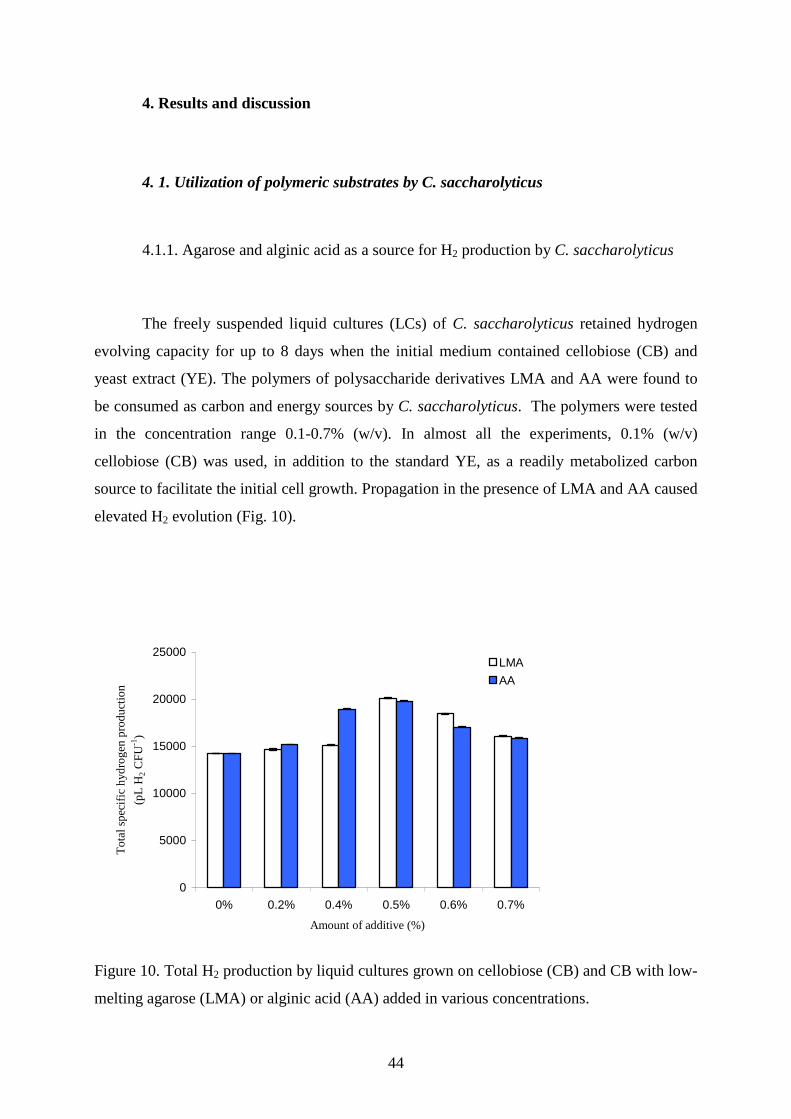
Figure 11 suggests that the improvement was due, at least in part, to an increased biomass
production.
0.00
0.05
0.10
0.15
0.20
0.25
0.30
0.35
0.40
0 2 4 6 8 10 12
Duration of fermentation (days)
Ce
ll m
ass
(g C
DW
L-1)
CB+0.5%LMA
CB+0.5%AA
CB
Figure 11. Biomass production of C. saccharolyticus grown on cellobiose (CB) and CB with
0.5% agarose (CB + 0.5% LMA) or 0.5% alginic acid (CB + 0.5% AA).
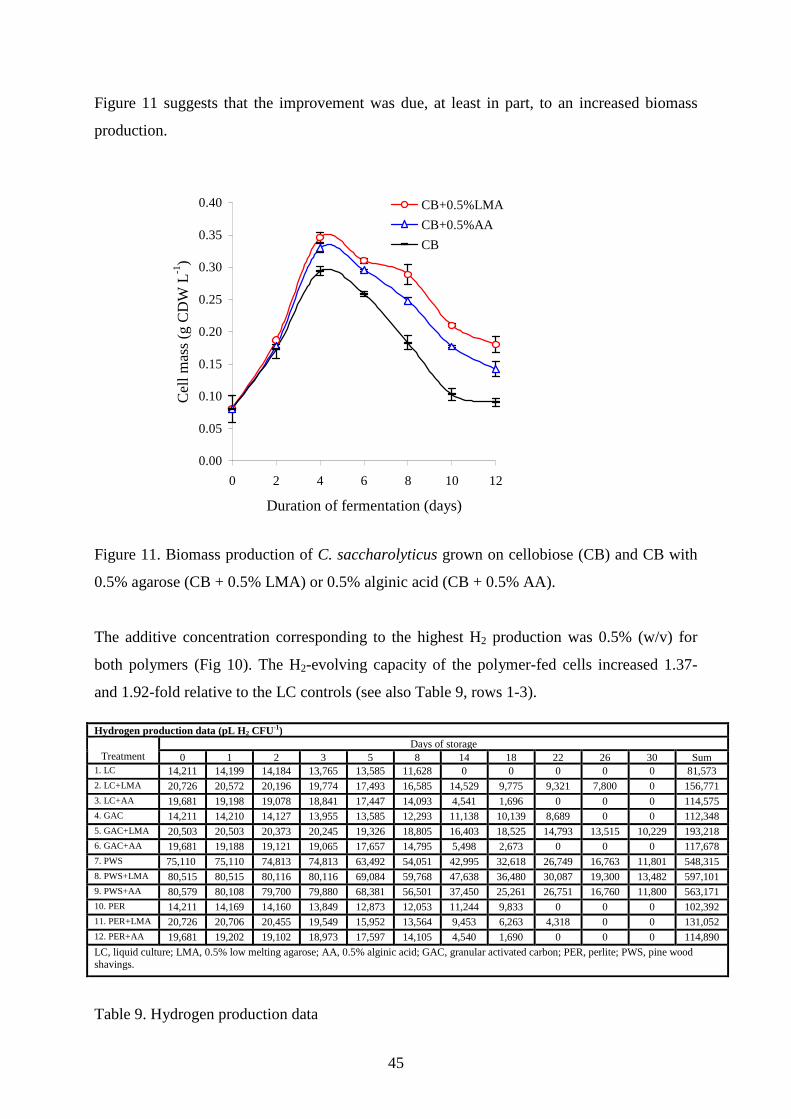
The additive concentration corresponding to the highest H2 production was 0.5% (w/v) for
both polymers (Fig 10). The H2-evolving capacity of the polymer-fed cells increased 1.37-
and 1.92-fold relative to the LC controls (see also Table 9, rows 1-3).
Table 9. Hydrogen production data
Hydrogen production data (pL H2 CFU-1) Days of storage
Treatment 0 1 2 3 5 8 14 18 22 26 30 Sum 1. LC 14,211
14,199
14,184
13,765
13,585
11,628
0
0 0 0 0 81,573 2. LC+LMA 20,726
20,572
20,196
19,774
17,493
16,585
14,529
9,775
9,321
7,800
0
156,771 3. LC+AA 19,681
19,198
19,078
18,841
17,447
14,093
4,541
1,696
0
0
0
114,575 4. GAC 14,211
14,210
14,127
13,955
13,585
12,293
11,138
10,139
8,689
0
0
112,348 5. GAC+LMA 20,503 20,503 20,373 20,245 19,326 18,805 16,403 18,525 14,793 13,515 10,229 193,218
6. GAC+AA 19,681 19,188 19,121 19,065 17,657 14,795 5,498 2,673 0 0 0 117,678 7. PWS 75,110
75,110
74,813
74,813
63,492
54,051
42,995
32,618
26,749
16,763
11,801
548,315
8. PWS+LMA 80,515 80,515 80,116 80,116 69,084 59,768 47,638 36,480 30,087 19,300 13,482 597,101 9. PWS+AA 80,579 80,108 79,700 79,880 68,381 56,501 37,450 25,261 26,751 16,760 11,800 563,171 10. PER 14,211
14,169
14,160
13,849
12,873
12,053
11,244
9,833
0
0
0
102,392 11. PER+LMA 20,726 20,706 20,455 19,549 15,952 13,564 9,453 6,263 4,318 0 0 131,052
12. PER+AA 19,681 19,202 19,102 18,973 17,597 14,105 4,540 1,690 0 0 0 114,890
LC, liquid culture; LMA, 0.5% low melting agarose; AA, 0.5% alginic acid; GAC, granular activated carbon; PER, perlite; PWS, pine wood shavings.
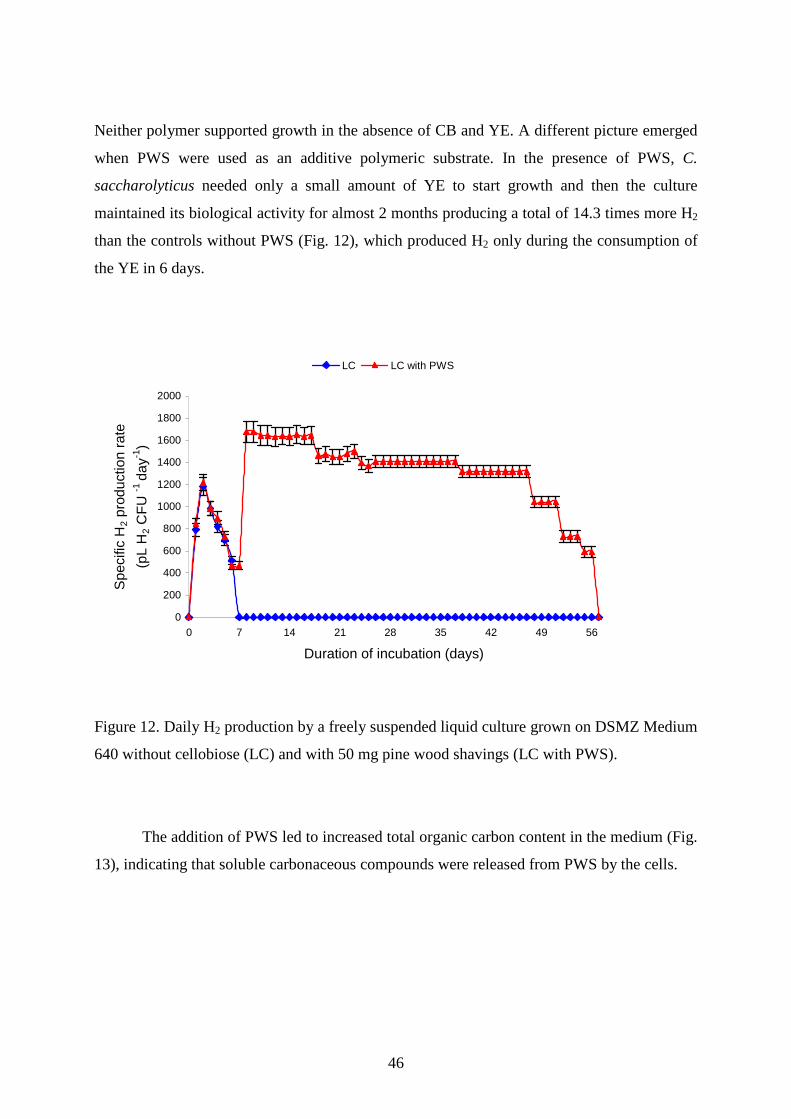
46
Neither polymer supported growth in the absence of CB and YE. A different picture emerged
when PWS were used as an additive polymeric substrate. In the presence of PWS, C.
saccharolyticus needed only a small amount of YE to start growth and then the culture
maintained its biological activity for almost 2 months producing a total of 14.3 times more H2
than the controls without PWS (Fig. 12), which produced H2 only during the consumption of
the YE in 6 days.
0
200
400
600
800
1000
1200
1400
1600
1800
2000
0 7 14 21 28 35 42 49 56
Duration of incubation (days)
Spe
cific
H2
prod
uctio
n ra
te
(pL
H2
CF
U -1
day-1
)
LC LC with PWS
Figure 12. Daily H2 production by a freely suspended liquid culture grown on DSMZ Medium
640 without cellobiose (LC) and with 50 mg pine wood shavings (LC with PWS).
The addition of PWS led to increased total organic carbon content in the medium (Fig.
13), indicating that soluble carbonaceous compounds were released from PWS by the cells.
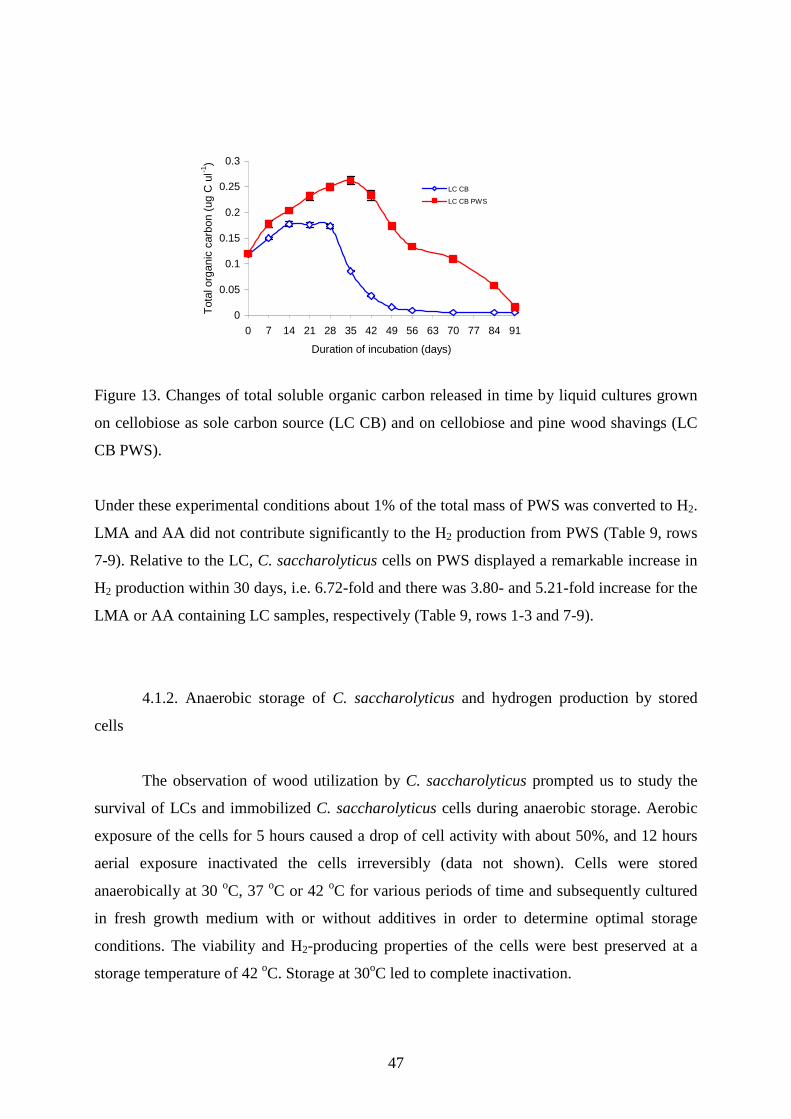
47
0
0.05
0.1
0.15
0.2
0.25
0.3
0 7 14 21 28 35 42 49 56 63 70 77 84 91
Duration of incubation (days)
Tot
al o
rgan
ic c
arbo
n (u
g C
ul-1
)
LC CB
LC CB PWS
Figure 13. Changes of total soluble organic carbon released in time by liquid cultures grown
on cellobiose as sole carbon source (LC CB) and on cellobiose and pine wood shavings (LC
CB PWS).
Under these experimental conditions about 1% of the total mass of PWS was converted to H2.
LMA and AA did not contribute significantly to the H2 production from PWS (Table 9, rows
7-9). Relative to the LC, C. saccharolyticus cells on PWS displayed a remarkable increase in
H2 production within 30 days, i.e. 6.72-fold and there was 3.80- and 5.21-fold increase for the
LMA or AA containing LC samples, respectively (Table 9, rows 1-3 and 7-9).
4.1.2. Anaerobic storage of C. saccharolyticus and hydrogen production by stored
cells
The observation of wood utilization by C. saccharolyticus prompted us to study the
survival of LCs and immobilized C. saccharolyticus cells during anaerobic storage. Aerobic
exposure of the cells for 5 hours caused a drop of cell activity with about 50%, and 12 hours
aerial exposure inactivated the cells irreversibly (data not shown). Cells were stored
anaerobically at 30 oC, 37 oC or 42 oC for various periods of time and subsequently cultured
in fresh growth medium with or without additives in order to determine optimal storage
conditions. The viability and H2-producing properties of the cells were best preserved at a
storage temperature of 42 oC. Storage at 30oC led to complete inactivation.
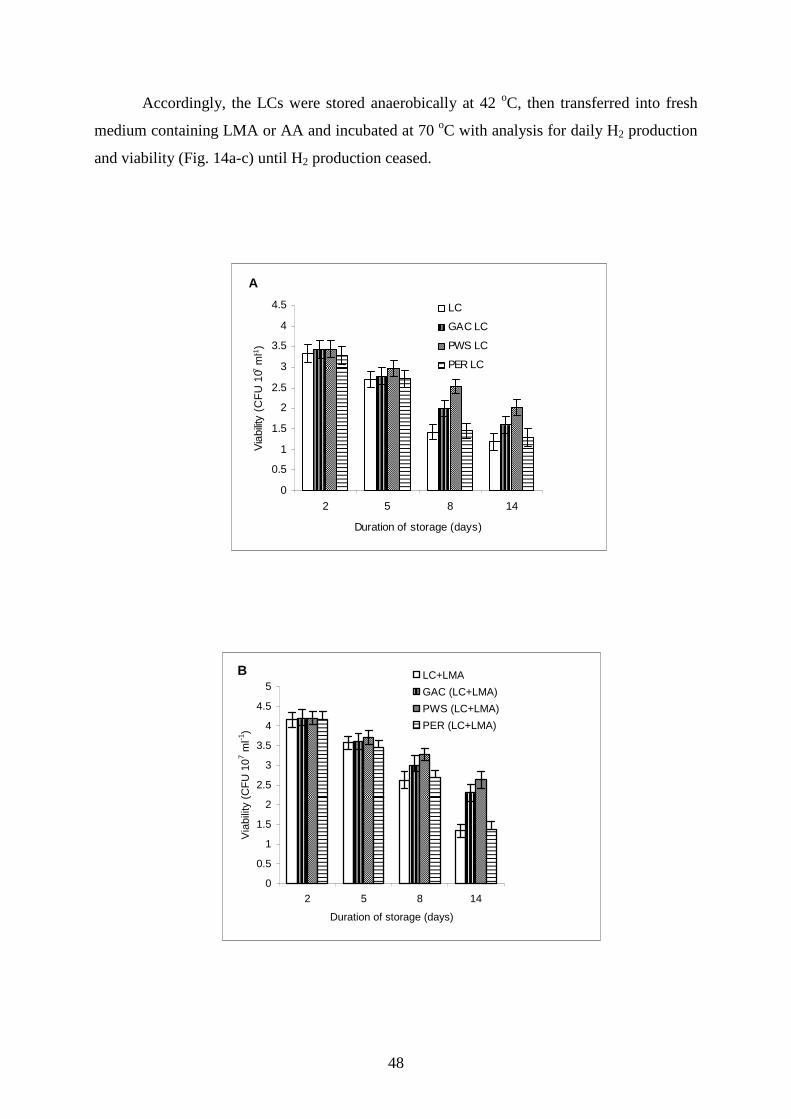
48
Accordingly, the LCs were stored anaerobically at 42 oC, then transferred into fresh
medium containing LMA or AA and incubated at 70 oC with analysis for daily H2 production
and viability (Fig. 14a-c) until H2 production ceased.
0
0.5
1
1.5
2
2.5
3
3.5
4
4.5
2 5 8 14
Duration of storage (days)
Via
bilit
y (C
FU
107
ml-1
)
LC
GAC LC
PWS LC
PER LC
A
0
0.5
1
1.5
2
2.5
3
3.5
4
4.5
5
2 5 8 14
Duration of storage (days)
Via
bilit
y (C
FU
107 m
l-1)
LC+LMA
GAC (LC+LMA)
PWS (LC+LMA)
PER (LC+LMA)
B
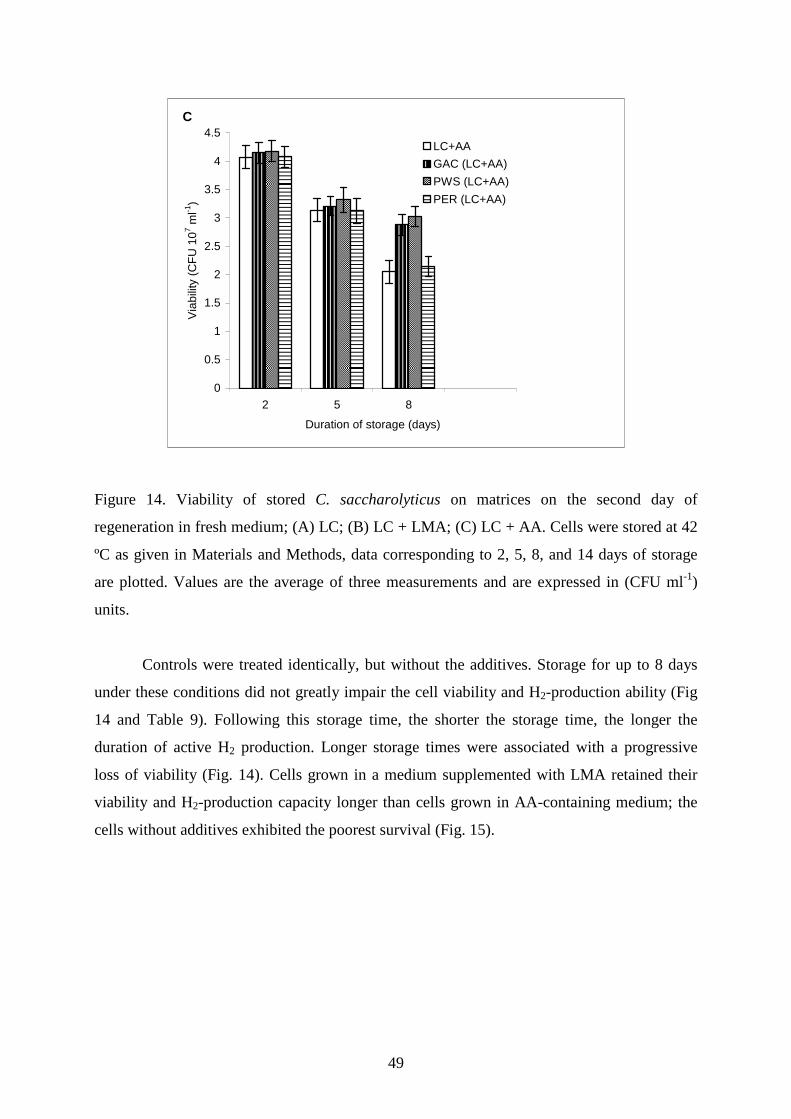
49
0
0.5
1
1.5
2
2.5
3
3.5
4
4.5
2 5 8
Duration of storage (days)
Via
bilit
y (C
FU
107 m
l-1)
LC+AA
GAC (LC+AA)
PWS (LC+AA)
PER (LC+AA)
C
Figure 14. Viability of stored C. saccharolyticus on matrices on the second day of
regeneration in fresh medium; (A) LC; (B) LC + LMA; (C) LC + AA. Cells were stored at 42
ºC as given in Materials and Methods, data corresponding to 2, 5, 8, and 14 days of storage
are plotted. Values are the average of three measurements and are expressed in (CFU ml-1)
units.
Controls were treated identically, but without the additives. Storage for up to 8 days
under these conditions did not greatly impair the cell viability and H2-production ability (Fig
14 and Table 9). Following this storage time, the shorter the storage time, the longer the
duration of active H2 production. Longer storage times were associated with a progressive
loss of viability (Fig. 14). Cells grown in a medium supplemented with LMA retained their
viability and H2-production capacity longer than cells grown in AA-containing medium; the
cells without additives exhibited the poorest survival (Fig. 15).
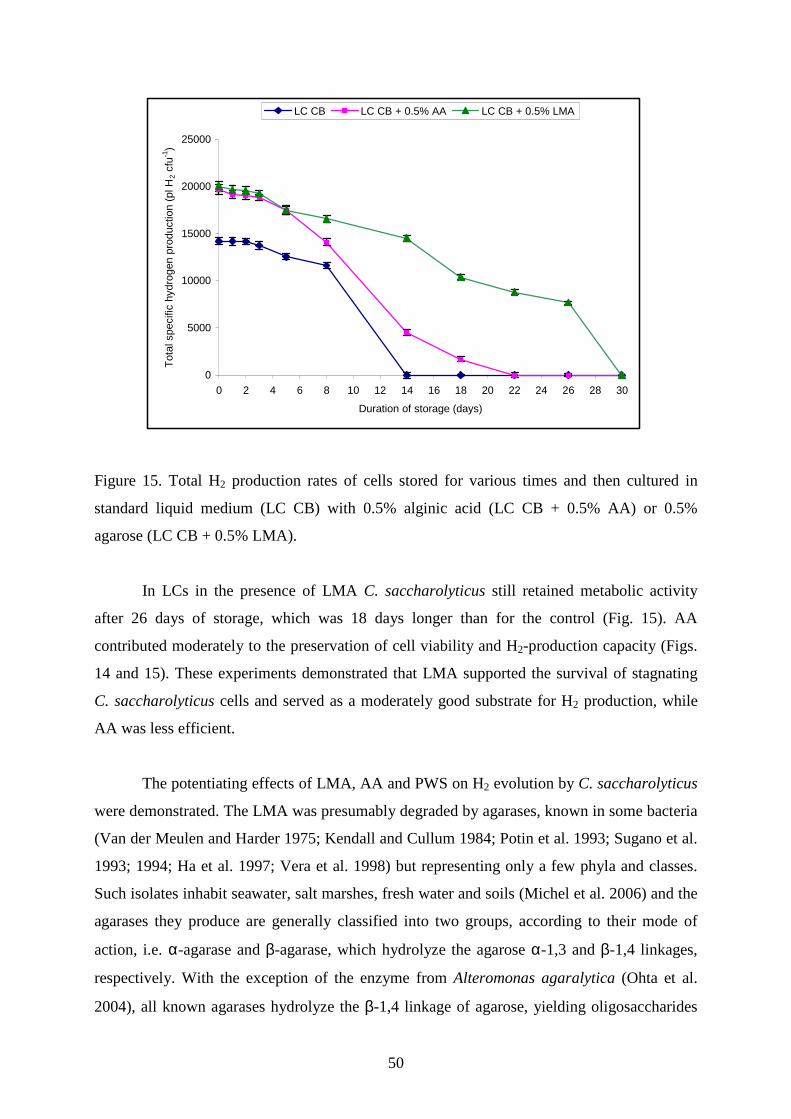
50
0
5000
10000
15000
20000
25000
0 2 4 6 8 10 12 14 16 18 20 22 24 26 28 30
Duration of storage (days)
Tot
al s
peci
fic h
ydro
gen
prod
uctio
n (p
l H2
cfu-1
)
LC CB LC CB + 0.5% AA LC CB + 0.5% LMA
Figure 15. Total H2 production rates of cells stored for various times and then cultured in
standard liquid medium (LC CB) with 0.5% alginic acid (LC CB + 0.5% AA) or 0.5%
agarose (LC CB + 0.5% LMA).
In LCs in the presence of LMA C. saccharolyticus still retained metabolic activity
after 26 days of storage, which was 18 days longer than for the control (Fig. 15). AA
contributed moderately to the preservation of cell viability and H2-production capacity (Figs.
14 and 15). These experiments demonstrated that LMA supported the survival of stagnating
C. saccharolyticus cells and served as a moderately good substrate for H2 production, while
AA was less efficient.
The potentiating effects of LMA, AA and PWS on H2 evolution by C. saccharolyticus
were demonstrated. The LMA was presumably degraded by agarases, known in some bacteria
(Van der Meulen and Harder 1975; Kendall and Cullum 1984; Potin et al. 1993; Sugano et al.
1993; 1994; Ha et al. 1997; Vera et al. 1998) but representing only a few phyla and classes.
Such isolates inhabit seawater, salt marshes, fresh water and soils (Michel et al. 2006) and the
agarases they produce are generally classified into two groups, according to their mode of
action, i.e. α-agarase and β-agarase, which hydrolyze the agarose α-1,3 and β-1,4 linkages,
respectively. With the exception of the enzyme from Alteromonas agaralytica (Ohta et al.
2004), all known agarases hydrolyze the β-1,4 linkage of agarose, yielding oligosaccharides
51
in the series related to neoagarobiose [O-3,6-anhydro-α-L-galactopyranosyl-(1→3)-D-
galactose]. It should be noted that galactose is an excellent carbon source for growth of C.
saccharalyticus, better than cellobiose (our observation, data not shown).
There have been no reports on agarolytic extreme thermophilic bacteria. Our studies
revealed that LMA is a good substrate for H2 production (Fig. 15) and increases the viability
of C. saccharolyticus cells upon storage (Fig. 14b and Table 9). These are strong indications
of the presence of an agarose-degrading enzyme in this bacterium. The addition of LMA to
the growth medium of C. saccharalyticus also caused an elevated protein content in the
extracellular protein fraction, and a number of new bands on an 8% SDS-PAGE gel (data not
shown), which is in line with the assumption that the tentative agarase of C. saccharolyticus
does exist and is an extracellular enzyme. Additional indirect evidence is the observation that
reducing sugars accumulate in the extracellular fraction only when the cells are grown on
agarose, a polymer of D-galactose, a reducing sugar (data not shown). Such activity was not
detected in the whole cell fraction or on cell fractions grown without LMA.
Alginates, which have wide-ranging commercial applications (Velings and Mestdagh
1995; Ertesvag and Valla 1998; Edwards-Levy and Levy 1999) are found in great abundance
in brown seaweeds and in two families of heterotrophic bacteria, the Pseudomonadaceae and
the Azotobacteriaceae (Preiss and Ashwell 1962; Wong et al. 2000). Alginate degradation,
catalyzed by alginate lyases (alginases and alginate depolymerases) isolated from numerous
microorganisms (Wong et al. 2000) involves a β-elimination mechanism that has yet to be
fully elucidated. The alginases have been characterized as either mannuronate or guluronate
lyases. Alginases synthesized by anaerobic extremophiles have not yet been reported and due
to the complex and undefined structures of alginate and its purified derivative AA, it is
difficult to assume which type is active in C. saccharolyticus. This extremophile degrades not
only alginic acid, but also sodium alginate. The commercial alginate product was
heterogeneous, it might have contained mono-, di- or oligomers, which could serve as a
substrate for the cells. Therefore the commercial alginate was dialyzed overnight at 4oC and
freeze-dried in order to get rid of the monomeric and oligomeric contaminations. Hydrogen
production and the degradation kinetics were very similar to that of the AA (data not shown).
Interestingly, both alginate and AA proved suitable as polymeric substrates for C.
saccharolyticus cells only when the cells were stored anaerobically at 42 ºC for not more than
8 days in the standard growth medium (Fig. 14c). Older cultures lost the ability to degrade
AA, even after replacement of the growth medium with a fresh one. The explanation of this
52
phenomenon and the nature of the change in metabolic status of the cells are unknown, but the
effect was observed systematically in both LCs and immobilized systems, regardless of the
immobilization matrix used except for PWS (Fig. 15 and Table 9, rows 3 and 9). Analysis of
the protein pattern of alginate-treated cells was not possible by SDS-PAGE in consequence of
the strong interference of the reagents used with even extremely minor amounts of alginate
left on extensively washed cells.
The cellulolytic activity of anaerobic extreme thermophiles has been known for some
time (Bergquist et al. 2000; Sissons et al. 1987; Hudson et al. 1990; Hudson et al. 1991), and
C. saccharolyticus was originally described as a cellulolytic bacterium (Rainey et al. 1994)
though this property has not been studied in detail subsequently. Soft wood shavings from the
pine are degraded by the extremophilic anaerobe in the absence of any other carbon source in
the growth medium. Attempts to hydrolyze wood shavings from oak trees (hard wood) were
not successful, presumably because of the distinct composition of this lignocellulosic raw
material (Iranmahboob et al. 2002). The bacterial hydrolysis of lignocelluloses is usually
preceded by physical and/or chemical pretreatment in order to break up the well-organized
and recalcitrant structure (Van Niel et al. 2003; Kadar et al. 2004; Iranmahboob et al. 2002. C.
saccharolyticus can apparently use soft wood as carbon and energy sources for biohydrogen
production without any pretreatment (Fig. 12). It must perform the hydrolysis via its own
cellulolytic apparatus, probably solubilizing the hemicellulose fraction of the wood, which
might explain the increased total organic carbon content in the growth medium (Fig. 13) and
considerably elevated H2 production (Fig 12 and Table 9, rows 1-3 and 7-9). The extracellular
protein concentration of the spent medium after growth on CB and PWS as carbon sources
was higher than that of a growth medium containing CB alone as carbon source. This may
suggest the presence of induced (hemi)cellulases in the extracellular space (data not shown).
Recent reports on the architecture of the cellulolytic enzymes of certain anaerobes indicate
that these enzymes are multiprotein complexes consisting of many subunits, e.g. the
cellulosome of Clostridia (Newcomb et al. 2007). We plan further analysis on the molecular
structure of the cellulases in C. saccharolyticus, which is phylogenetically related to
Clostridia.
53
4.1.3. Immobilization studies
The use of various zeolites (Na+- and NH4+-exchangers, silicate powders) as
immobilization matrices did not support the survival of C. saccharolyticus (data not shown).
Immobilization of C. saccharolyticus on GAC, PER or PWS had a beneficial effect on the
survival of the cells stored at 42 oC relative to the LCs, in the sequence PER<GAC<PWS
(Table 8). In the following experiments, the effects of using these immobilization matrices
alone or in combination with LMA and AA on the survival during storage and H2 production
from CB or from CB supplemented with LMA or AA were studied. The positive effect of
LMA on the stored immobilized cells was observed after the cultures had consumed the YE
and CB, i.e. after about 8-13 days of storage. AA displayed the same modest effect as seen
before: cells which had been stored for up to 8 days produced significantly elevated amounts
of H2 after replacement of the medium with a fresh one containing YE, CB and AA, but the
H2 production of cells stored for a longer period of time rapidly decreased when the same
substrates were applied (Table 9, rows 3, 6, 9, 12). The total H2 production of GAC-
immobilized and LMA-treated stored cells was 2.37 times higher than that of stored LMA
supplemented LCs (Table 9, rows 2 and 5). For perlite the raise was 1.60-fold (Table 9, rows
8 and 10).
C. saccharolyticus immobilized on PWS displayed an outstandingly higher H2
productivity than that of the LCs, with improvements both in storage survival and H2-
evolving capacity. It should be noted that PWS-immobilized C. saccharolyticus did not need
CB to survive and it retained its biological H2-production activity for up to 56 days (Fig. 12).
The total H2 produced in these samples during the first 30 days was 6.72-fold higher than the
control samples without PWS, clearly indicating the most significant contribution of PWS
(Table 9, rows 1-3 and 7-9). PWS in combination with LMA resulted in a 7.32-fold
intensification in the H2 evolution relative to LC. It should be emphasized that shavings of
hardwood, e.g. oak, behaved completely differently. In the presence of hard wood shavings
neither the stabilization of C. saccharolyticus cells upon storage nor an enhanced H2-evolving
capacity was observed (data not shown).
In any practical application of C. saccharolyticus in biohydrogen producing systems,
optimal working conditions for a high production yield and a long cell lifetime are critical.
Accordingly, LCs were compared with C. saccharolyticus cells immobilized on various
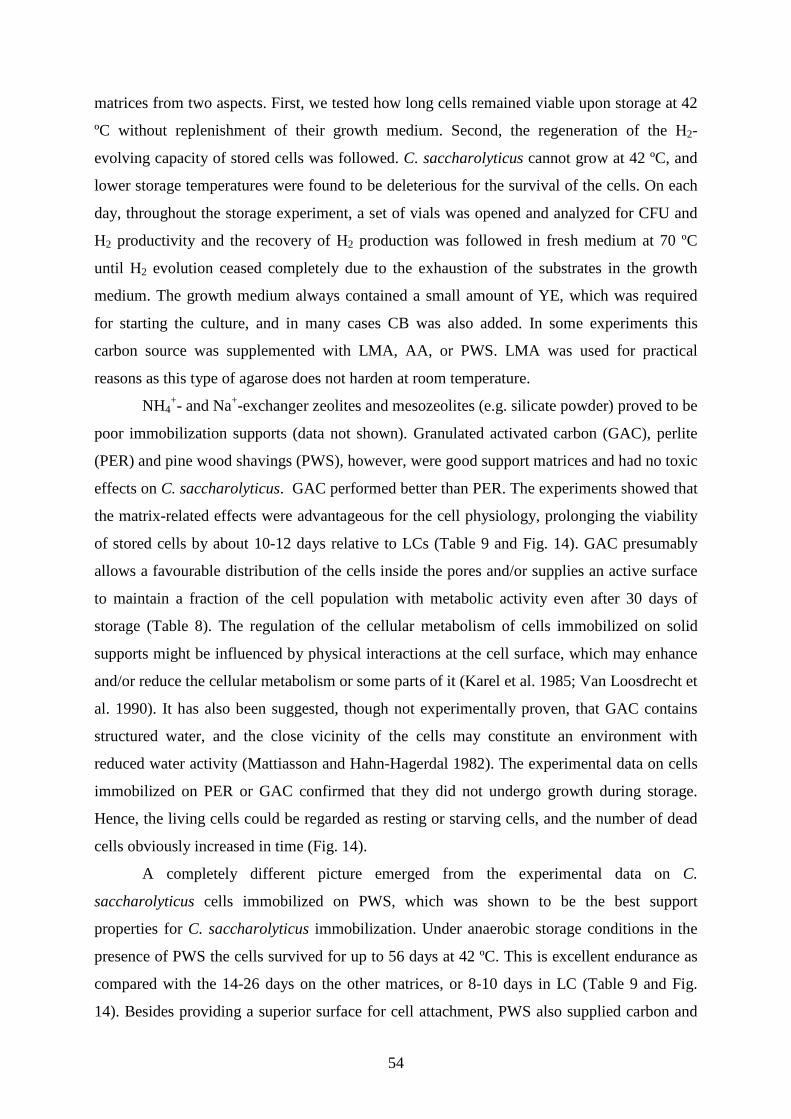
54
matrices from two aspects. First, we tested how long cells remained viable upon storage at 42
ºC without replenishment of their growth medium. Second, the regeneration of the H2-
evolving capacity of stored cells was followed. C. saccharolyticus cannot grow at 42 ºC, and
lower storage temperatures were found to be deleterious for the survival of the cells. On each
day, throughout the storage experiment, a set of vials was opened and analyzed for CFU and
H2 productivity and the recovery of H2 production was followed in fresh medium at 70 ºC
until H2 evolution ceased completely due to the exhaustion of the substrates in the growth
medium. The growth medium always contained a small amount of YE, which was required
for starting the culture, and in many cases CB was also added. In some experiments this
carbon source was supplemented with LMA, AA, or PWS. LMA was used for practical
reasons as this type of agarose does not harden at room temperature.
NH4+- and Na+-exchanger zeolites and mesozeolites (e.g. silicate powder) proved to be
poor immobilization supports (data not shown). Granulated activated carbon (GAC), perlite
(PER) and pine wood shavings (PWS), however, were good support matrices and had no toxic
effects on C. saccharolyticus. GAC performed better than PER. The experiments showed that
the matrix-related effects were advantageous for the cell physiology, prolonging the viability
of stored cells by about 10-12 days relative to LCs (Table 9 and Fig. 14). GAC presumably
allows a favourable distribution of the cells inside the pores and/or supplies an active surface
to maintain a fraction of the cell population with metabolic activity even after 30 days of
storage (Table 8). The regulation of the cellular metabolism of cells immobilized on solid
supports might be influenced by physical interactions at the cell surface, which may enhance
and/or reduce the cellular metabolism or some parts of it (Karel et al. 1985; Van Loosdrecht et
al. 1990). It has also been suggested, though not experimentally proven, that GAC contains
structured water, and the close vicinity of the cells may constitute an environment with
reduced water activity (Mattiasson and Hahn-Hagerdal 1982). The experimental data on cells
immobilized on PER or GAC confirmed that they did not undergo growth during storage.
Hence, the living cells could be regarded as resting or starving cells, and the number of dead
cells obviously increased in time (Fig. 14).
A completely different picture emerged from the experimental data on C.
saccharolyticus cells immobilized on PWS, which was shown to be the best support
properties for C. saccharolyticus immobilization. Under anaerobic storage conditions in the
presence of PWS the cells survived for up to 56 days at 42 ºC. This is excellent endurance as
compared with the 14-26 days on the other matrices, or 8-10 days in LC (Table 9 and Fig.
14). Besides providing a superior surface for cell attachment, PWS also supplied carbon and
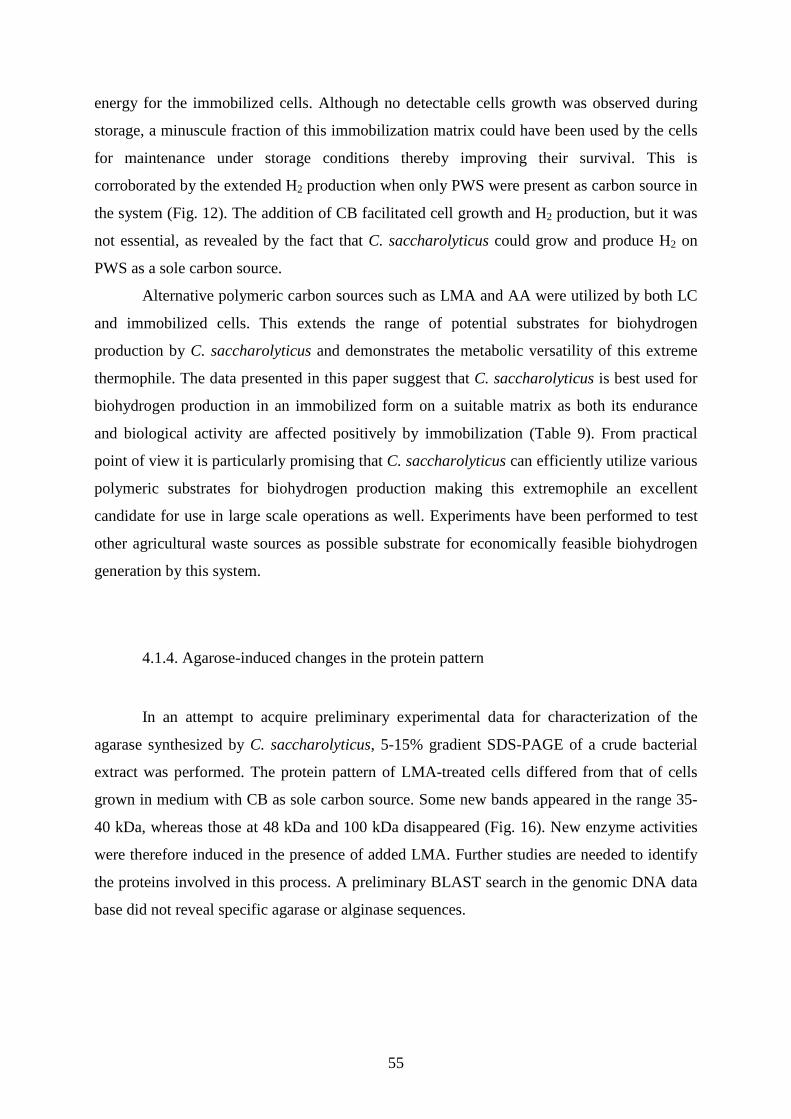
55
energy for the immobilized cells. Although no detectable cells growth was observed during
storage, a minuscule fraction of this immobilization matrix could have been used by the cells
for maintenance under storage conditions thereby improving their survival. This is
corroborated by the extended H2 production when only PWS were present as carbon source in
the system (Fig. 12). The addition of CB facilitated cell growth and H2 production, but it was
not essential, as revealed by the fact that C. saccharolyticus could grow and produce H2 on
PWS as a sole carbon source.
Alternative polymeric carbon sources such as LMA and AA were utilized by both LC
and immobilized cells. This extends the range of potential substrates for biohydrogen
production by C. saccharolyticus and demonstrates the metabolic versatility of this extreme
thermophile. The data presented in this paper suggest that C. saccharolyticus is best used for
biohydrogen production in an immobilized form on a suitable matrix as both its endurance
and biological activity are affected positively by immobilization (Table 9). From practical
point of view it is particularly promising that C. saccharolyticus can efficiently utilize various
polymeric substrates for biohydrogen production making this extremophile an excellent
candidate for use in large scale operations as well. Experiments have been performed to test
other agricultural waste sources as possible substrate for economically feasible biohydrogen
generation by this system.
4.1.4. Agarose-induced changes in the protein pattern
In an attempt to acquire preliminary experimental data for characterization of the
agarase synthesized by C. saccharolyticus, 5-15% gradient SDS-PAGE of a crude bacterial
extract was performed. The protein pattern of LMA-treated cells differed from that of cells
grown in medium with CB as sole carbon source. Some new bands appeared in the range 35-
40 kDa, whereas those at 48 kDa and 100 kDa disappeared (Fig. 16). New enzyme activities
were therefore induced in the presence of added LMA. Further studies are needed to identify
the proteins involved in this process. A preliminary BLAST search in the genomic DNA data
base did not reveal specific agarase or alginase sequences.
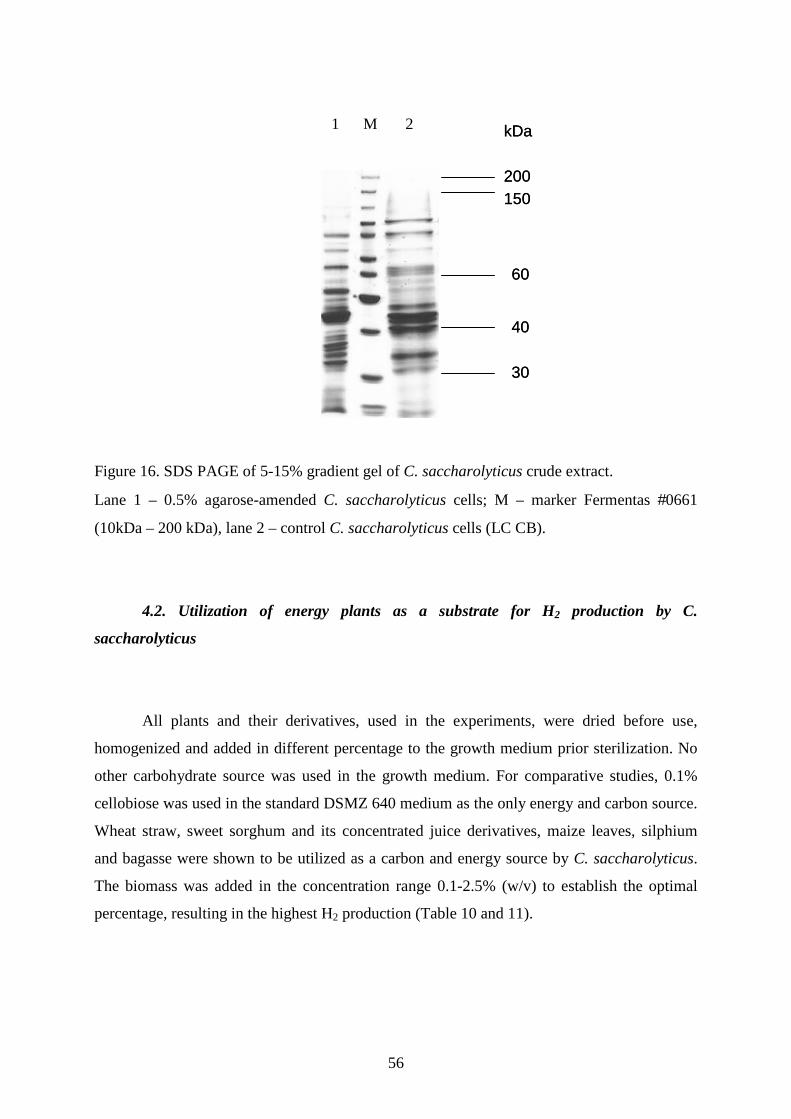
56
Figure 16. SDS PAGE of 5-15% gradient gel of C. saccharolyticus crude extract.
Lane 1 – 0.5% agarose-amended C. saccharolyticus cells; M – marker Fermentas #0661
(10kDa – 200 kDa), lane 2 – control C. saccharolyticus cells (LC CB).
4.2. Utilization of energy plants as a substrate for H2 production by C.
saccharolyticus
All plants and their derivatives, used in the experiments, were dried before use,
homogenized and added in different percentage to the growth medium prior sterilization. No
other carbohydrate source was used in the growth medium. For comparative studies, 0.1%
cellobiose was used in the standard DSMZ 640 medium as the only energy and carbon source.
Wheat straw, sweet sorghum and its concentrated juice derivatives, maize leaves, silphium
and bagasse were shown to be utilized as a carbon and energy source by C. saccharolyticus.
The biomass was added in the concentration range 0.1-2.5% (w/v) to establish the optimal
percentage, resulting in the highest H2 production (Table 10 and 11).
1 M 2
200 150
60
40
30
kDa
200 150
60
40
30
kDa
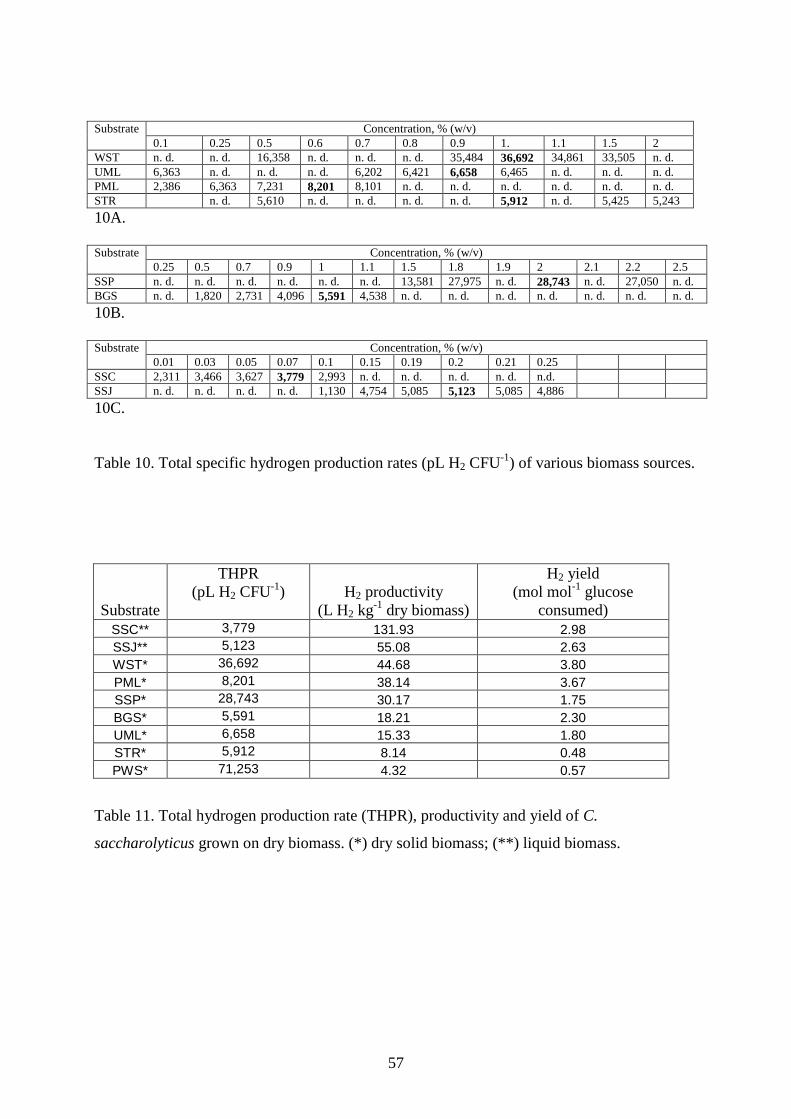
57
Concentration, % (w/v) Substrate 0.1 0.25 0.5 0.6 0.7 0.8 0.9 1. 1.1 1.5 2
WST n. d. n. d. 16,358 n. d. n. d. n. d. 35,484 36,692 34,861 33,505 n. d. UML 6,363 n. d. n. d. n. d. 6,202 6,421 6,658 6,465 n. d. n. d. n. d. PML 2,386 6,363 7,231 8,201 8,101 n. d. n. d. n. d. n. d. n. d. n. d. STR n. d. 5,610 n. d. n. d. n. d. n. d. 5,912 n. d. 5,425 5,243
10A.
Concentration, % (w/v) Substrate 0.25 0.5 0.7 0.9 1 1.1 1.5 1.8 1.9 2 2.1 2.2 2.5
SSP n. d. n. d. n. d. n. d. n. d. n. d. 13,581 27,975 n. d. 28,743 n. d. 27,050 n. d. BGS n. d. 1,820 2,731 4,096 5,591 4,538 n. d. n. d. n. d. n. d. n. d. n. d. n. d.
10B.
Concentration, % (w/v) Substrate 0.01 0.03 0.05 0.07 0.1 0.15 0.19 0.2 0.21 0.25
SSC 2,311 3,466 3,627 3,779 2,993 n. d. n. d. n. d. n. d. n.d. SSJ n. d. n. d. n. d. n. d. 1,130 4,754 5,085 5,123 5,085 4,886
10C.
Table 10. Total specific hydrogen production rates (pL H2 CFU-1) of various biomass sources.
Substrate
THPR (pL H2 CFU-1) H2 productivity
(L H2 kg-1 dry biomass)
H2 yield (mol mol-1 glucose
consumed) SSC** 3,779 131.93 2.98 SSJ** 5,123 55.08 2.63 WST* 36,692 44.68 3.80 PML* 8,201 38.14 3.67 SSP* 28,743 30.17 1.75 BGS* 5,591 18.21 2.30 UML* 6,658 15.33 1.80 STR* 5,912 8.14 0.48 PWS* 71,253 4.32 0.57
Table 11. Total hydrogen production rate (THPR), productivity and yield of C.
saccharolyticus grown on dry biomass. (*) dry solid biomass; (**) liquid biomass.
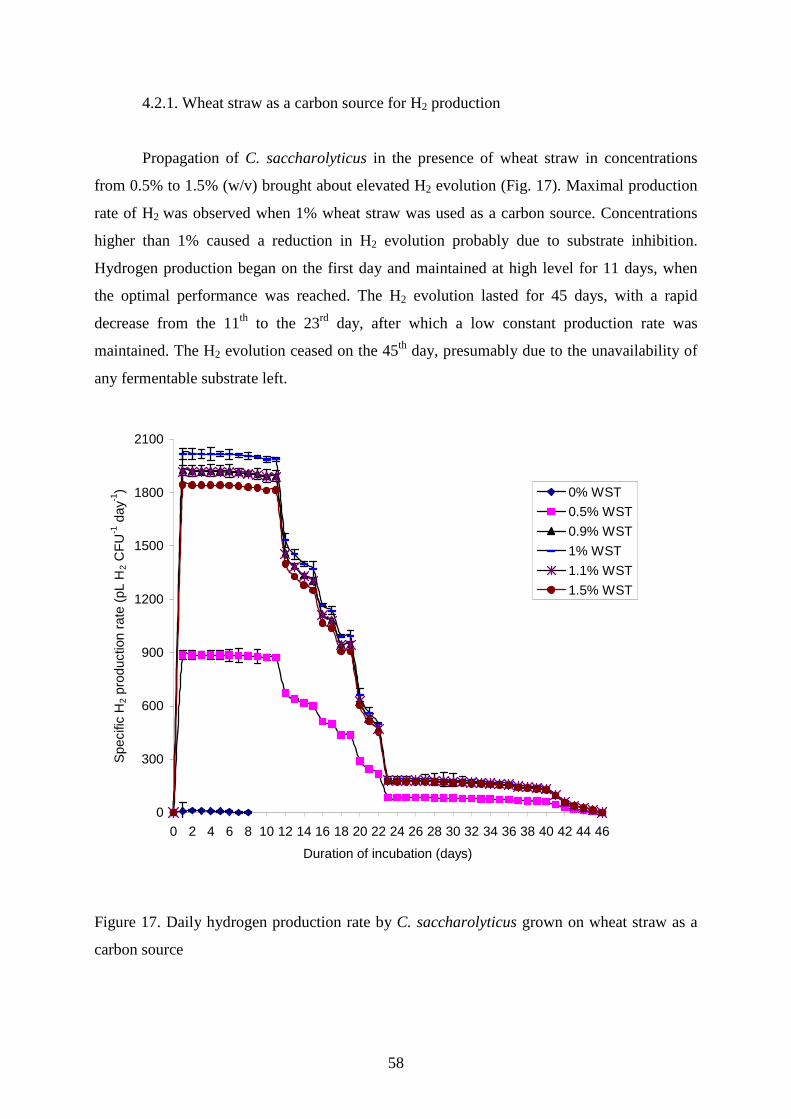
58
4.2.1. Wheat straw as a carbon source for H2 production
Propagation of C. saccharolyticus in the presence of wheat straw in concentrations
from 0.5% to 1.5% (w/v) brought about elevated H2 evolution (Fig. 17). Maximal production
rate of H2 was observed when 1% wheat straw was used as a carbon source. Concentrations
higher than 1% caused a reduction in H2 evolution probably due to substrate inhibition.
Hydrogen production began on the first day and maintained at high level for 11 days, when
the optimal performance was reached. The H2 evolution lasted for 45 days, with a rapid
decrease from the 11th to the 23rd day, after which a low constant production rate was
maintained. The H2 evolution ceased on the 45th day, presumably due to the unavailability of
any fermentable substrate left.
3317 3317 37243318 3328 37523367 3334 29 3387 3344 38 3710 3729 212546 2546 27982579 2534 27562531 2552 25 2597 2559 33 2719 2758 40
0
300
600
900
1200
1500
1800
2100
0 2 4 6 8 10 12 14 16 18 20 22 24 26 28 30 32 34 36 38 40 42 44 46
Duration of incubation (days)
Spe
cific
H2
prod
uctio
n ra
te (
pL H
2 C
FU
-1 d
ay-1
) 0% WST
0.5% WST
0.9% WST
1% WST
1.1% WST
1.5% WST
Figure 17. Daily hydrogen production rate by C. saccharolyticus grown on wheat straw as a
carbon source
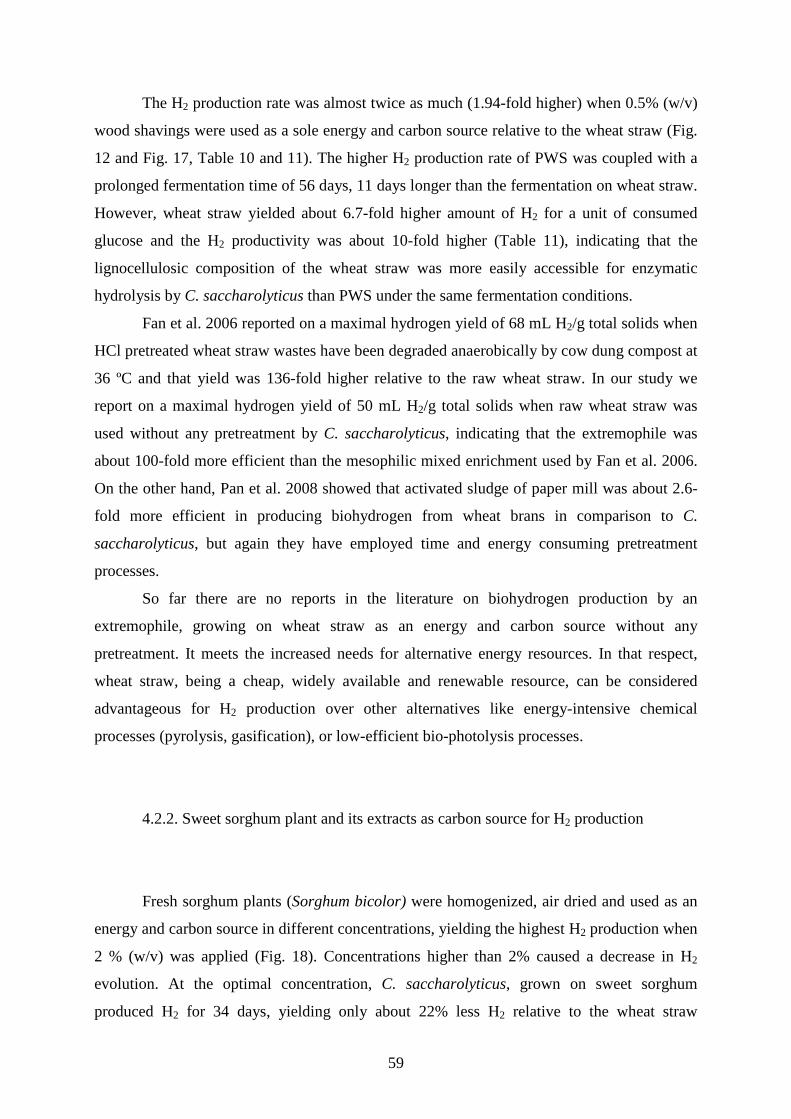
59
The H2 production rate was almost twice as much (1.94-fold higher) when 0.5% (w/v)
wood shavings were used as a sole energy and carbon source relative to the wheat straw (Fig.
12 and Fig. 17, Table 10 and 11). The higher H2 production rate of PWS was coupled with a
prolonged fermentation time of 56 days, 11 days longer than the fermentation on wheat straw.
However, wheat straw yielded about 6.7-fold higher amount of H2 for a unit of consumed
glucose and the H2 productivity was about 10-fold higher (Table 11), indicating that the
lignocellulosic composition of the wheat straw was more easily accessible for enzymatic
hydrolysis by C. saccharolyticus than PWS under the same fermentation conditions.
Fan et al. 2006 reported on a maximal hydrogen yield of 68 mL H2/g total solids when
HCl pretreated wheat straw wastes have been degraded anaerobically by cow dung compost at
36 ºC and that yield was 136-fold higher relative to the raw wheat straw. In our study we
report on a maximal hydrogen yield of 50 mL H2/g total solids when raw wheat straw was
used without any pretreatment by C. saccharolyticus, indicating that the extremophile was
about 100-fold more efficient than the mesophilic mixed enrichment used by Fan et al. 2006.
On the other hand, Pan et al. 2008 showed that activated sludge of paper mill was about 2.6-
fold more efficient in producing biohydrogen from wheat brans in comparison to C.
saccharolyticus, but again they have employed time and energy consuming pretreatment
processes.
So far there are no reports in the literature on biohydrogen production by an
extremophile, growing on wheat straw as an energy and carbon source without any
pretreatment. It meets the increased needs for alternative energy resources. In that respect,
wheat straw, being a cheap, widely available and renewable resource, can be considered
advantageous for H2 production over other alternatives like energy-intensive chemical
processes (pyrolysis, gasification), or low-efficient bio-photolysis processes.
4.2.2. Sweet sorghum plant and its extracts as carbon source for H2 production
Fresh sorghum plants (Sorghum bicolor) were homogenized, air dried and used as an
energy and carbon source in different concentrations, yielding the highest H2 production when
2 % (w/v) was applied (Fig. 18). Concentrations higher than 2% caused a decrease in H2
evolution. At the optimal concentration, C. saccharolyticus, grown on sweet sorghum
produced H2 for 34 days, yielding only about 22% less H2 relative to the wheat straw
60
substrate (Fig. 17 and Fig. 18, Table 10 and 11). The hydrogen production rate varied very
little, with a decrease from 1,300 pL H2 CFU-1 day-1 to 1,000 pL H2 CFU-1 day-1 in 23 days,
which may indicate a more homogeneous distribution of the accessible substrate compared to
the wheat straw. A fast decrease in H2 production followed due to depletion of the available
substrate (Fig. 18) and that was coupled with a drop of the cell viability (data not shown).
0
300
600
900
1200
1500
0 2 4 6 8 10 12 14 16 18 20 22 24 26 28 30 32 34 36 38 40 42 44
Duration of incubation (days)
Spe
cific
H2
prod
uctio
n ra
te (
pL H
2 C
FU
-1 d
ay-1
)
0% SSP
1.5% SSP
1.8% SSP
2% SSP
2.2% SSP
Figure 18. Daily hydrogen production by C. saccharolyticus grown on sweet sorghum as a
carbon source
In a different experiment, sweet sorghum plant was stripped into leaves and stems and
water extraction at 30 °C of the available sugars was performed according to the method of
Ntaikou et al. 2008. The extract, containing the readily extractable sugars accounted for 7.5 %
of the overall H2 production, the leaves contributed by 53.2% and the stems by 39.3%. The
sum of H2 evolution, coming from the three treatments equalled that one of the homogenized
whole plants (data not shown).
Reports on the use of sweet sorghum plants for H2 production started to emerge in the
literature recently. Ntaikou et al. 2008 used mesophilic pure culture of Ruminococcus albus to
61
produce hydrogen from wet sweet sorghum biomass. They reported H2 productivity of 58 L
H2 kg-1 wet sorghum biomass which is in a good agreement with our studies of 30.17 L H2 kg-
1 dry sorghum biomass (Table 11) and H2 yield of 2.5 mol H2 mol-1 consumed glucose for
sorghum residues, which is consistent with our yield of 1.75 mol H2 mol-1 consumed glucose.
Our data fit very well to the H2 yield, reported by Martinez-Perez et al. 2007, who indicated
1.7 mol H2/mol hexose converted in sweet sorghum in anaerobic digesters.
We report for the first time on H2 production by an extremophile using sweet sorghum
plants as a growth substrate. We have proven that H2 production from sweet sorghum by the
extremophile C. saccharolyticus without any pretreatment of the substrate is possible and
stable for a period of 24 days under batch fermentation conditions, with an average production
rate of 1000 pL H2 CFU-1 day-1, the second best among the other utilized substrates (Figure
18). In terms of H2 productivity, sweet sorghum comes in the fifth place as the most suitable
H2 substrate after its derivatives SSC and SSJ, wheat straw and pretreated maize leaves (Table
11).
Preliminary studies have been carried out by Claassen et al. 2004 and Antonopoulou et
al. 2008 on biohydrogen production from sweet sorghum derivatives like extracts and
bagasse. We also demonstrated that C. saccharolyticus was able to produce H2 from SSJ and
SSC (Table 10, Figures 19 and 20). The highest H2 production for SSJ was reached when
0.2% SSJ was used with concurring batch fermentation of 34 days. For SSC the optimal
percentage for H2 production was 0.07% and the fermentation was 10 days shorter. Claassen
et al. reported on 4 mol H2/mol C6 which is close to our data of 3 mol H2/mol glucose when
C. saccharolyticus was grown on SSJ (Table 11). Antonopoulou et al. 2008 reported on H2
yield of 0.86 mol H2/mol glucose consumed which is half of the value for SSP and over 3-fold
lower for SSJ and SSC relative to our studies. Their H2 productivity for SSJ was about 5-fold
lower than our results (Table 11).
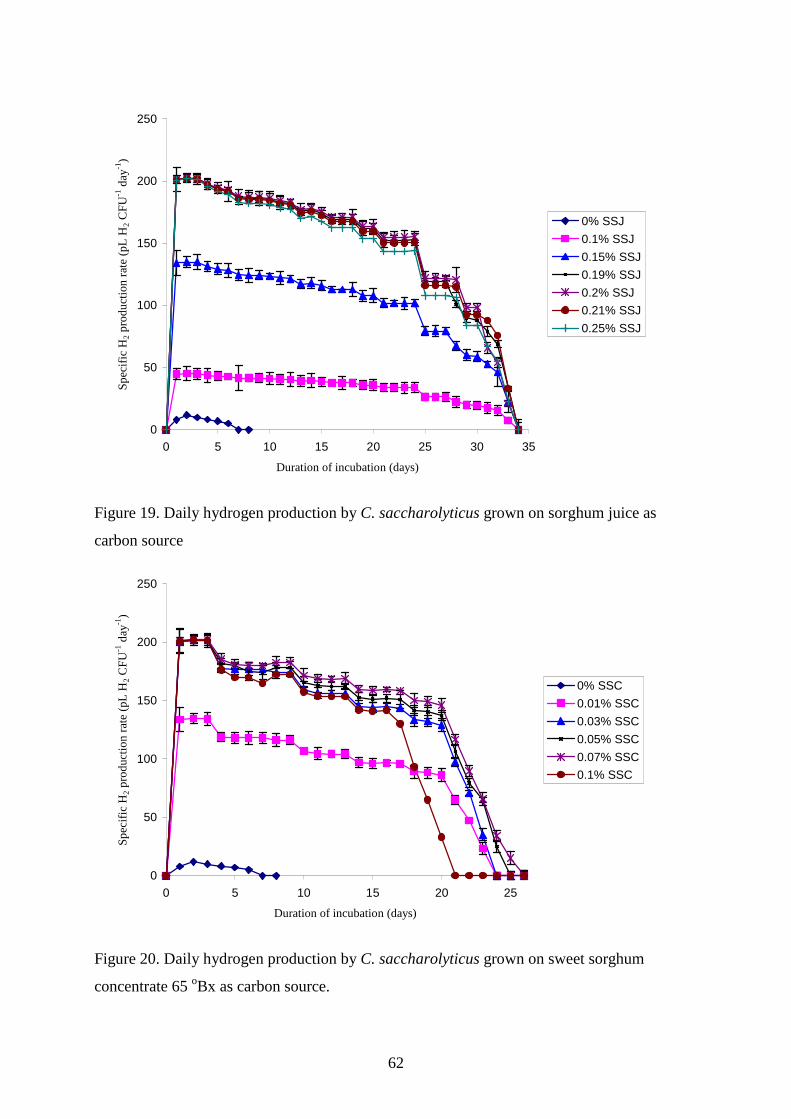
62
0
50
100
150
200
250
0 5 10 15 20 25 30 35
Duration of incubation (days)
Sp
ecifi
c H 2
pro
du
ctio
n r
ate
(pL
H 2 C
FU
-1 d
ay-1
)
0% SSJ
0.1% SSJ
0.15% SSJ
0.19% SSJ
0.2% SSJ
0.21% SSJ
0.25% SSJ
Figure 19. Daily hydrogen production by C. saccharolyticus grown on sorghum juice as
carbon source
0
50
100
150
200
250
0 5 10 15 20 25
Duration of incubation (days)
Sp
ecifi
c H 2
pro
duc
tion
rat
e (p
L H 2
CF
U-1
day
-1)
0% SSC
0.01% SSC
0.03% SSC
0.05% SSC
0.07% SSC
0.1% SSC
Figure 20. Daily hydrogen production by C. saccharolyticus grown on sweet sorghum
concentrate 65 oBx as carbon source.
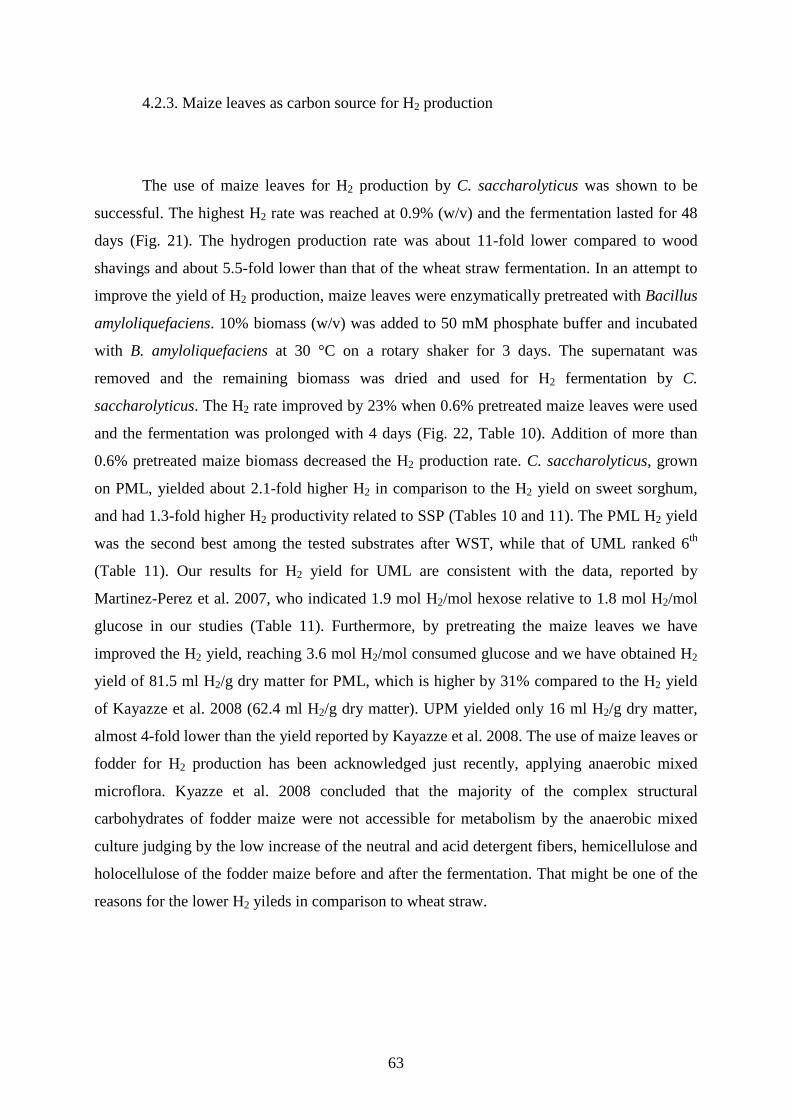
63
4.2.3. Maize leaves as carbon source for H2 production
The use of maize leaves for H2 production by C. saccharolyticus was shown to be
successful. The highest H2 rate was reached at 0.9% (w/v) and the fermentation lasted for 48
days (Fig. 21). The hydrogen production rate was about 11-fold lower compared to wood
shavings and about 5.5-fold lower than that of the wheat straw fermentation. In an attempt to
improve the yield of H2 production, maize leaves were enzymatically pretreated with Bacillus
amyloliquefaciens. 10% biomass (w/v) was added to 50 mM phosphate buffer and incubated
with B. amyloliquefaciens at 30 °C on a rotary shaker for 3 days. The supernatant was
removed and the remaining biomass was dried and used for H2 fermentation by C.
saccharolyticus. The H2 rate improved by 23% when 0.6% pretreated maize leaves were used
and the fermentation was prolonged with 4 days (Fig. 22, Table 10). Addition of more than
0.6% pretreated maize biomass decreased the H2 production rate. C. saccharolyticus, grown
on PML, yielded about 2.1-fold higher H2 in comparison to the H2 yield on sweet sorghum,
and had 1.3-fold higher H2 productivity related to SSP (Tables 10 and 11). The PML H2 yield
was the second best among the tested substrates after WST, while that of UML ranked 6th
(Table 11). Our results for H2 yield for UML are consistent with the data, reported by
Martinez-Perez et al. 2007, who indicated 1.9 mol H2/mol hexose relative to 1.8 mol H2/mol
glucose in our studies (Table 11). Furthermore, by pretreating the maize leaves we have
improved the H2 yield, reaching 3.6 mol H2/mol consumed glucose and we have obtained H2
yield of 81.5 ml H2/g dry matter for PML, which is higher by 31% compared to the H2 yield
of Kayazze et al. 2008 (62.4 ml H2/g dry matter). UPM yielded only 16 ml H2/g dry matter,
almost 4-fold lower than the yield reported by Kayazze et al. 2008. The use of maize leaves or
fodder for H2 production has been acknowledged just recently, applying anaerobic mixed
microflora. Kyazze et al. 2008 concluded that the majority of the complex structural
carbohydrates of fodder maize were not accessible for metabolism by the anaerobic mixed
culture judging by the low increase of the neutral and acid detergent fibers, hemicellulose and
holocellulose of the fodder maize before and after the fermentation. That might be one of the
reasons for the lower H2 yileds in comparison to wheat straw.
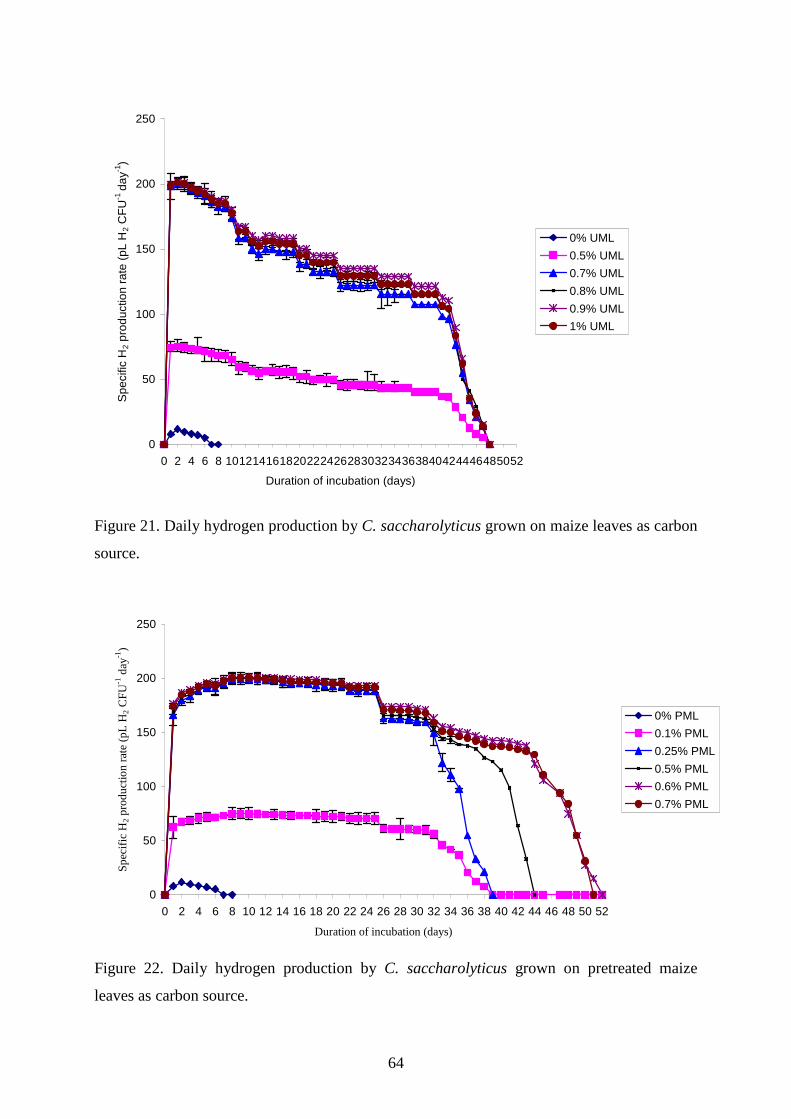
64
0
50
100
150
200
250
0 2 4 6 8 10121416182022242628303234363840424446485052
Duration of incubation (days)
Spe
cific
H2
prod
uctio
n ra
te (
pL H
2 C
FU
-1 da
y-1)
0% UML
0.5% UML
0.7% UML
0.8% UML
0.9% UML
1% UML
Figure 21. Daily hydrogen production by C. saccharolyticus grown on maize leaves as carbon
source.
0
50
100
150
200
250
0 2 4 6 8 10 12 14 16 18 20 22 24 26 28 30 32 34 36 38 40 42 44 46 48 50 52
Duration of incubation (days)
Sp
ecifi
c H 2
pro
du
ctio
n r
ate
(pL
H 2 C
FU
-1 d
ay-1
)
0% PML
0.1% PML
0.25% PML
0.5% PML
0.6% PML
0.7% PML
Figure 22. Daily hydrogen production by C. saccharolyticus grown on pretreated maize
leaves as carbon source.
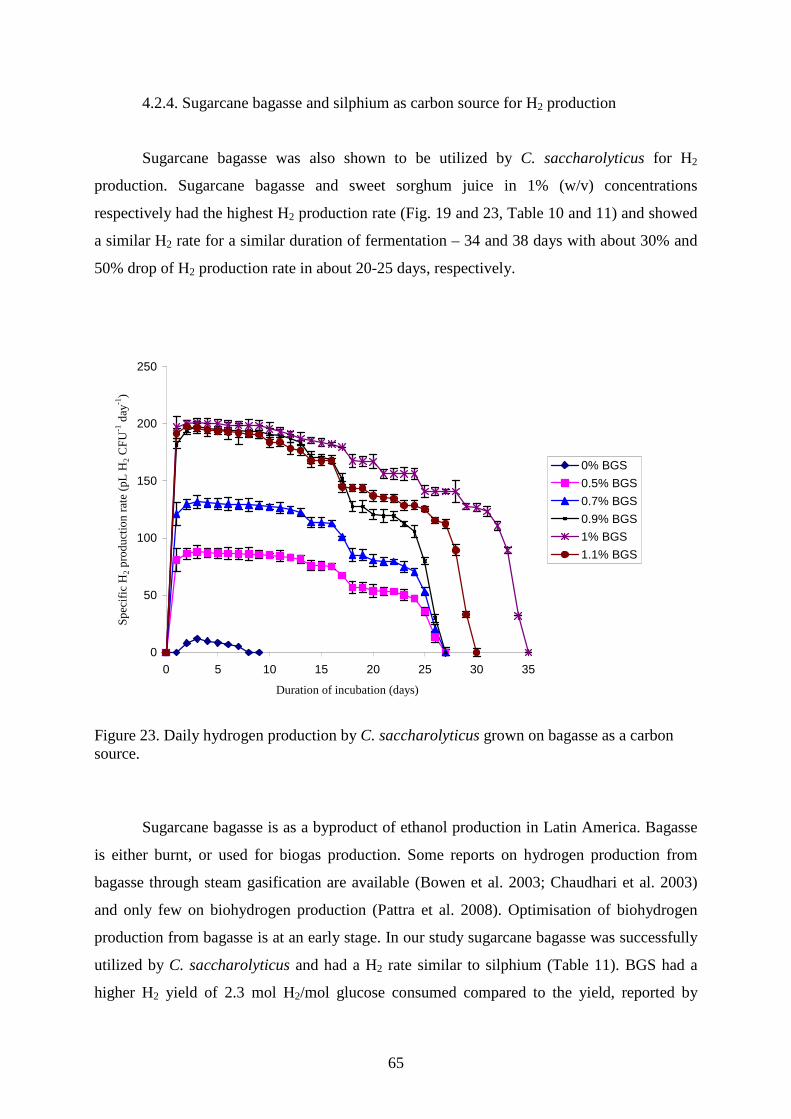
65
4.2.4. Sugarcane bagasse and silphium as carbon source for H2 production
Sugarcane bagasse was also shown to be utilized by C. saccharolyticus for H2
production. Sugarcane bagasse and sweet sorghum juice in 1% (w/v) concentrations
respectively had the highest H2 production rate (Fig. 19 and 23, Table 10 and 11) and showed
a similar H2 rate for a similar duration of fermentation – 34 and 38 days with about 30% and
50% drop of H2 production rate in about 20-25 days, respectively.
0
50
100
150
200
250
0 5 10 15 20 25 30 35
Duration of incubation (days)
Sp
ecifi
c H 2
pro
du
ctio
n r
ate
(pL
H 2 C
FU
-1 d
ay-1
)
0% BGS
0.5% BGS
0.7% BGS
0.9% BGS
1% BGS
1.1% BGS
Figure 23. Daily hydrogen production by C. saccharolyticus grown on bagasse as a carbon source.
Sugarcane bagasse is as a byproduct of ethanol production in Latin America. Bagasse
is either burnt, or used for biogas production. Some reports on hydrogen production from
bagasse through steam gasification are available (Bowen et al. 2003; Chaudhari et al. 2003)
and only few on biohydrogen production (Pattra et al. 2008). Optimisation of biohydrogen
production from bagasse is at an early stage. In our study sugarcane bagasse was successfully
utilized by C. saccharolyticus and had a H2 rate similar to silphium (Table 11). BGS had a
higher H2 yield of 2.3 mol H2/mol glucose consumed compared to the yield, reported by
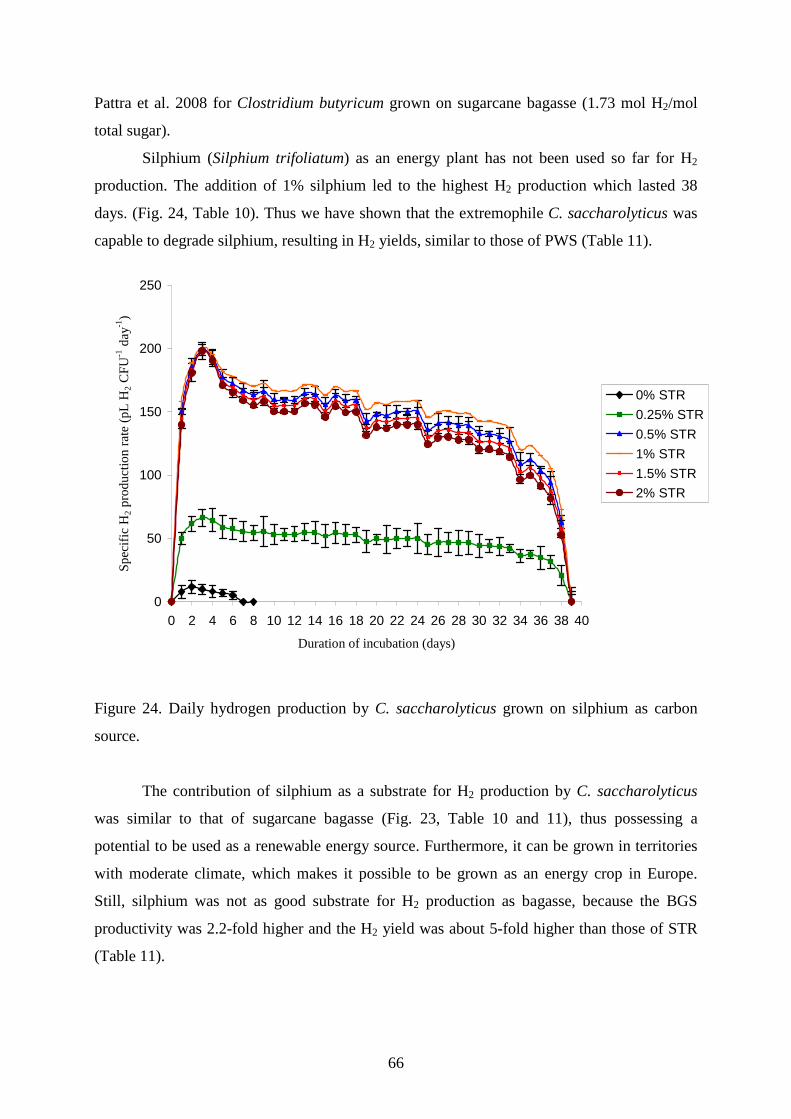
66
Pattra et al. 2008 for Clostridium butyricum grown on sugarcane bagasse (1.73 mol H2/mol
total sugar).
Silphium (Silphium trifoliatum) as an energy plant has not been used so far for H2
production. The addition of 1% silphium led to the highest H2 production which lasted 38
days. (Fig. 24, Table 10). Thus we have shown that the extremophile C. saccharolyticus was
capable to degrade silphium, resulting in H2 yields, similar to those of PWS (Table 11).
0
50
100
150
200
250
0 2 4 6 8 10 12 14 16 18 20 22 24 26 28 30 32 34 36 38 40
Duration of incubation (days)
Sp
eci
fic H
2 p
rod
uct
ion
ra
te (
pL
H 2 C
FU
-1 d
ay-1
)
0% STR
0.25% STR
0.5% STR
1% STR
1.5% STR
2% STR
Figure 24. Daily hydrogen production by C. saccharolyticus grown on silphium as carbon
source.
The contribution of silphium as a substrate for H2 production by C. saccharolyticus
was similar to that of sugarcane bagasse (Fig. 23, Table 10 and 11), thus possessing a
potential to be used as a renewable energy source. Furthermore, it can be grown in territories
with moderate climate, which makes it possible to be grown as an energy crop in Europe.
Still, silphium was not as good substrate for H2 production as bagasse, because the BGS
productivity was 2.2-fold higher and the H2 yield was about 5-fold higher than those of STR
(Table 11).
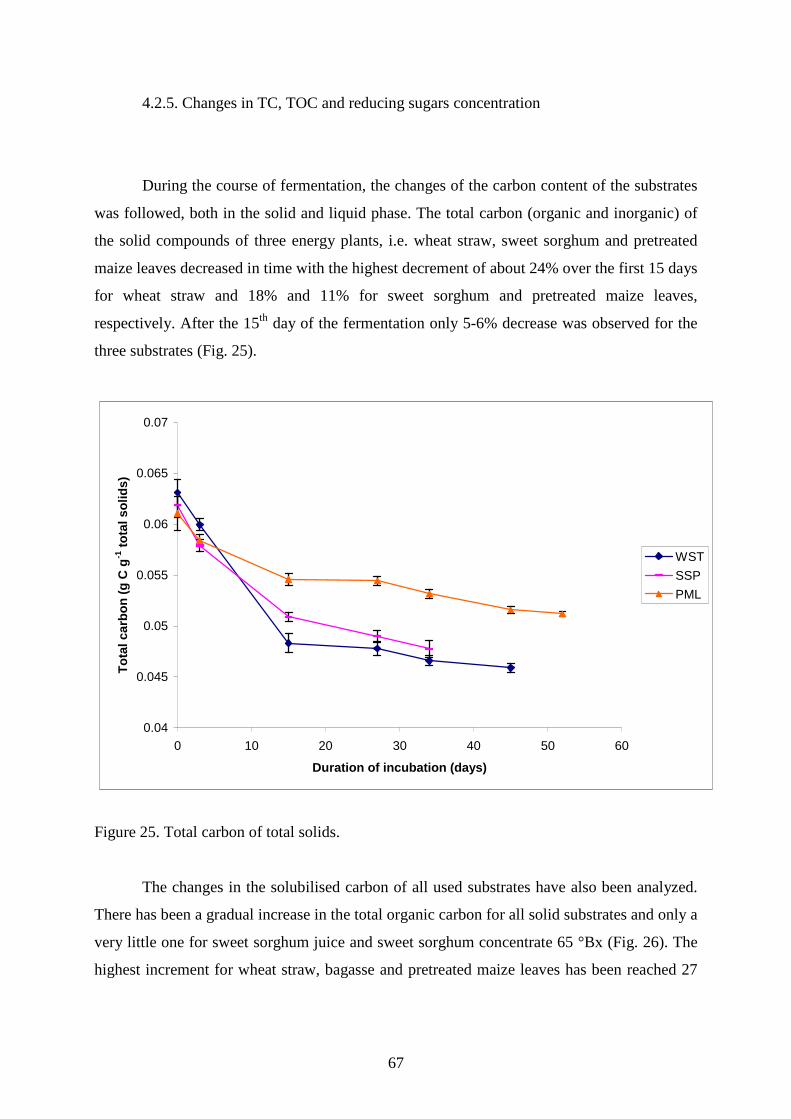
67
4.2.5. Changes in TC, TOC and reducing sugars concentration
During the course of fermentation, the changes of the carbon content of the substrates
was followed, both in the solid and liquid phase. The total carbon (organic and inorganic) of
the solid compounds of three energy plants, i.e. wheat straw, sweet sorghum and pretreated
maize leaves decreased in time with the highest decrement of about 24% over the first 15 days
for wheat straw and 18% and 11% for sweet sorghum and pretreated maize leaves,
respectively. After the 15th day of the fermentation only 5-6% decrease was observed for the
three substrates (Fig. 25).
0.04
0.045
0.05
0.055
0.06
0.065
0.07
0 10 20 30 40 50 60
Duration of incubation (days)
To
tal c
arb
on
(g
C g
-1 t
ota
l so
lids)
WST
SSP
PML
Figure 25. Total carbon of total solids.
The changes in the solubilised carbon of all used substrates have also been analyzed.
There has been a gradual increase in the total organic carbon for all solid substrates and only a
very little one for sweet sorghum juice and sweet sorghum concentrate 65 °Bx (Fig. 26). The
highest increment for wheat straw, bagasse and pretreated maize leaves has been reached 27
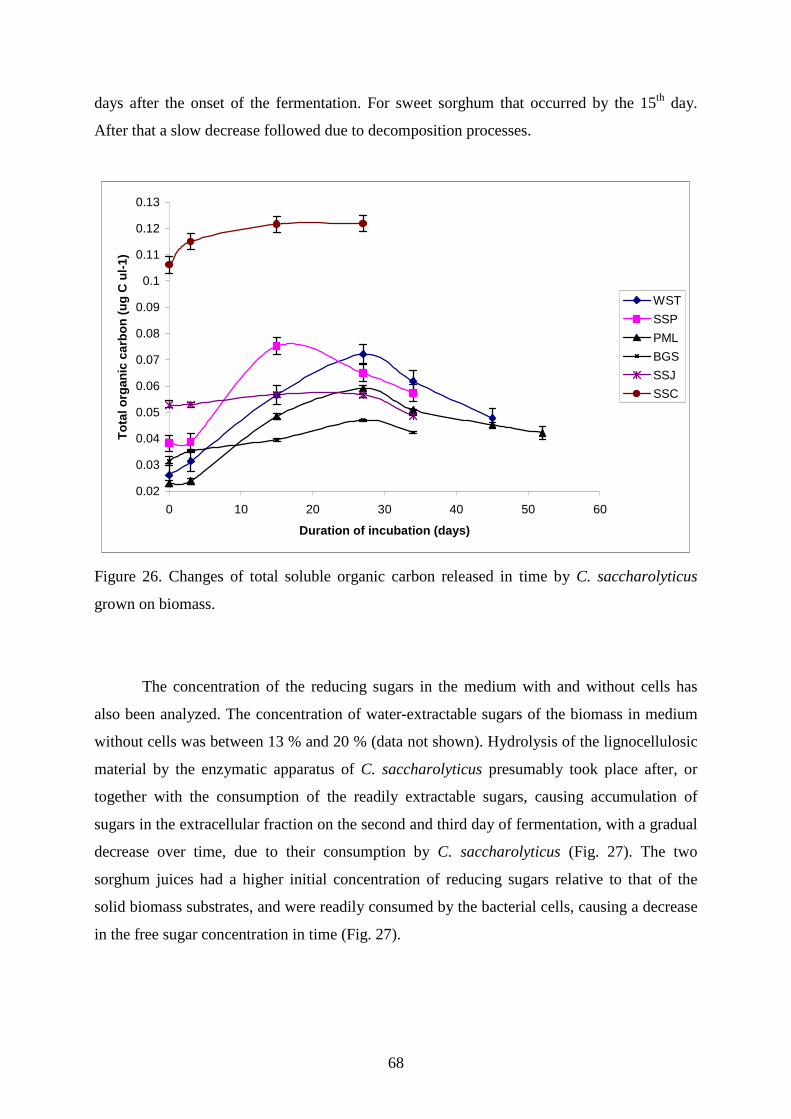
68
days after the onset of the fermentation. For sweet sorghum that occurred by the 15th day.
After that a slow decrease followed due to decomposition processes.
0.02
0.03
0.04
0.05
0.06
0.07
0.08
0.09
0.1
0.11
0.12
0.13
0 10 20 30 40 50 60
Duration of incubation (days)
To
tal o
rgan
ic c
arb
on
(u
g C
ul-
1)
WST
SSP
PML
BGS
SSJ
SSC
Figure 26. Changes of total soluble organic carbon released in time by C. saccharolyticus
grown on biomass.
The concentration of the reducing sugars in the medium with and without cells has
also been analyzed. The concentration of water-extractable sugars of the biomass in medium
without cells was between 13 % and 20 % (data not shown). Hydrolysis of the lignocellulosic
material by the enzymatic apparatus of C. saccharolyticus presumably took place after, or
together with the consumption of the readily extractable sugars, causing accumulation of
sugars in the extracellular fraction on the second and third day of fermentation, with a gradual
decrease over time, due to their consumption by C. saccharolyticus (Fig. 27). The two
sorghum juices had a higher initial concentration of reducing sugars relative to that of the
solid biomass substrates, and were readily consumed by the bacterial cells, causing a decrease
in the free sugar concentration in time (Fig. 27).
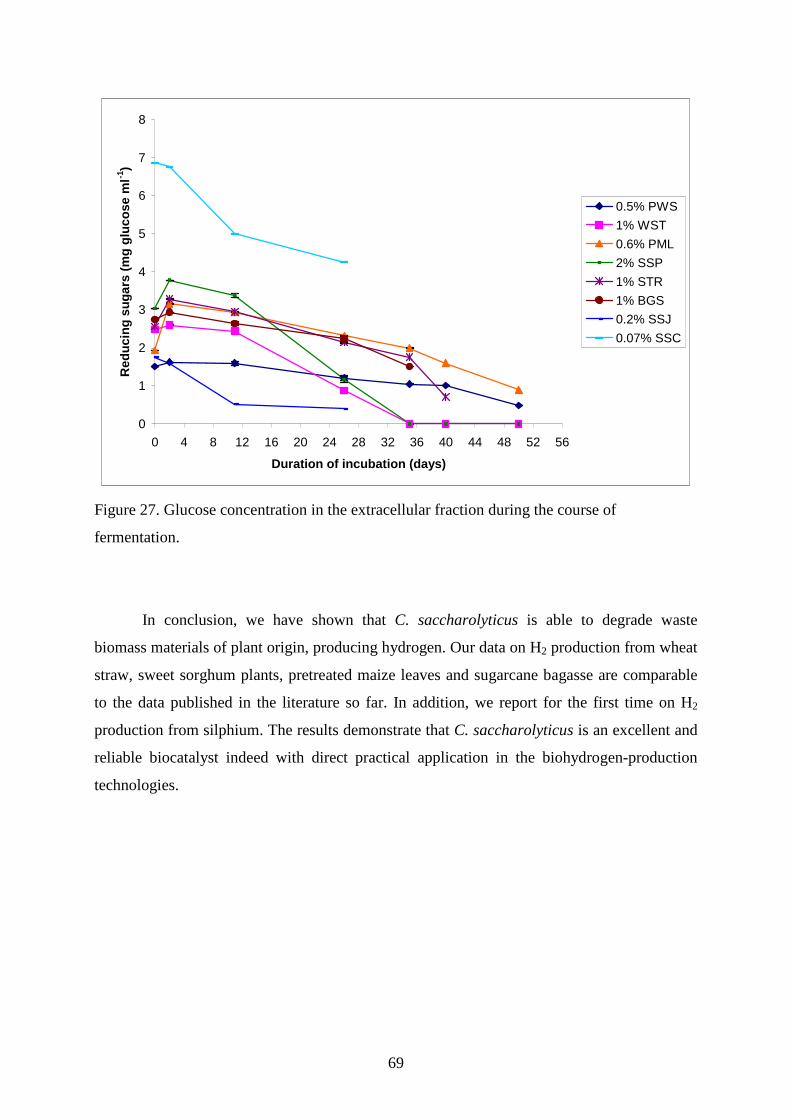
69
0
1
2
3
4
5
6
7
8
0 4 8 12 16 20 24 28 32 36 40 44 48 52 56
Duration of incubation (days)
Red
uci
ng
su
gar
s (m
g g
luco
se m
l-1)
0.5% PWS
1% WST
0.6% PML
2% SSP
1% STR
1% BGS
0.2% SSJ
0.07% SSC
Figure 27. Glucose concentration in the extracellular fraction during the course of
fermentation.
In conclusion, we have shown that C. saccharolyticus is able to degrade waste
biomass materials of plant origin, producing hydrogen. Our data on H2 production from wheat
straw, sweet sorghum plants, pretreated maize leaves and sugarcane bagasse are comparable
to the data published in the literature so far. In addition, we report for the first time on H2
production from silphium. The results demonstrate that C. saccharolyticus is an excellent and
reliable biocatalyst indeed with direct practical application in the biohydrogen-production
technologies.
70
5. Summary
Based on the data, presented in this thesis, the following main conclusion can be
drawn:
1. I demonstrated that C. saccharolyticus possesses an agarolytic activity in the
presence of cellobiose, with a possible practical application in biohydrogen
production, involving inexpensive and simple way of utilizing agarose as a
discarded waste.
2. I performed preliminary studies on the protein profile of agarose-induced C.
saccharolyticus cells, cultured in the presence of cellobiose and detected a number
of newly synthesized proteins due to the use of agarose as an additional carbon and
energy source.
3. I proved that C. saccharolyticus has the ability to catabolise alginic acid and
alginates in the presence of cellobiose, and produces hydrogen from this substrate.
4. I confirmed the cellulolytic activity of C. saccharolyticus using pine tree wood
shavings, demonstrating the metabolic versatility of that extremophile.
5. I have selected cheap, widely available and non-toxic support matrices for the
stabilization of the hydrogen-producing system by immobilization.
6. I selected for a support matrix, which has a duel function for the cells – on one
hand, providing a solid surface for the cells, and on the other, playing the role of a
substrate, which maintains the viability and preserve the physiology status during
storage.
7. The optimal storage conditions of C. saccharolyticus cells have been established
and their storability has been improved by immobilization. The hydrogen
productivity of immobilized cells has been preserved for a period of 30 days
compared to 8 days of their freely suspended counterparts.

71
8. I demonstrated that energy plants and agricultural waste resources were suitable
for use by C. saccharolyticus for hydrogen production, making that extremophile
an excellent candidate for large scale operations of economically feasible
biohydrogen generation.
72
6. Publications
Ivanova, G., Rakhely, G. and Kovacs, K. L. Hydrogen production from biopolymers by
Caldicellulosiruptor saccharolyticus and stabilization of the system by immobilization. Int J
Hydrogen Energy 2008; doi:10.1016/j.ijhydene.2008.08.058.
Ivanova, G., Rakhely, G. and Kovacs, K. L. Thermophilic biohydrogen production from
energy plants by Caldicellulosiruptor saccharolyticus. Submitted to Int J Hydrogen Energy.
Ivanova, G., Meredith, W., Dickinson, M. J., Kovacs, K. L. and West, H. M. Relationship
between n-alkane length and fungal contribution to diesel degradation in an acidic sandy
loam. Submitted to Bioresour Technol.
Ivanova, G., Meredith, W., Dickinson, M., Kovacs, K.L. and West, W. M. The contribution
of species richness to diesel degradation. International Conference on Biotechnology, Leipzig,
Germany, 9-13 July 2006.
Ivanova, G. Physiological studies on hydrogen-evolving and diesel-degrading
microorganisms. Acta Biologica Szegediensis 2006;50(3-4):151.
Krysteva, M. Fyrtzov, K., Kodjabashev, I. and Ivanova, G. A substratum for hydrogen
production. Patent utility model N: 681 / 03.09.2004, Patent Office of the Republic of
Bulgaria.
Ivanova, G. Photobiological hydrogen production from vinasse by Rhodobacter sphaeroides.
4th International Conference on Biohydrogen, Ede, the Netherlands, 21-24 April 2002, pp.82.
Krysteva, M, Lalov, I. and Ivanova, G. Energy from food wastes - the energy of the 21st
century (in Bulgarian). 4th National Chemistry Confernece, Sofia, Bulgaria, 27-29 September
2001, pp.153.
73
7. Aknowledgements
I am deeply indebted to my supervisor Prof. Kornel Kovacs, who has been supporting
me throughout my PhD studies, giving me valuable professional advice and care. His utmost
dedication to science and his remarkable ability to understand and solve not only research, but
also every day’s life problems have made him a bright role model for me.
I thank Assoc. Prof. Gabor Rakhely and Dr. Perei Katalin for their practical and
theoretical consultations, which improved my experimental set-up, as well as my thesis’ and
articles’ structure.
I’m grateful to my Mother, who’s been giving me all her love and comfort at difficult
moments of my personal life and scientific career.
I’ll always keep a dear memory for Zsiros Szilvi, who’s been by my side not only in
the labs, but also in my private life at all times; to Molnar Erika, who’s been cheering me up
on hard days during my stay in Hungary; to Balint Balazs, Bagi Zoli, Safar Zsolti, Takacs
Mari and Toth Andras, who have been always helping me when I was in any need, keeping
my scientific enthusiasm and devotion alive.
74
8. Summary in Hungarian (Összefoglalás)
A dolgozatban bemutatott kísérleti eredmények alapján a következı
következtetéseket vonom le:
1. Kimutattam, hogy C. saccharolyticus agar bontó enzim aktivitással
rendelkezik cellobióz jelenlétében. A baktériumnak ez a tulajdonsága nem volt
ismert korábban és lehetıséget nyújt arra, hogy agar tartalmú hulladékokból
biohidrogént állítsunk elı.
2. A sejtekbıl készített fehérje extraktum gélképében eltéréseket találtam attól
függıen, hogy cellobióz mellett agar is jelen volt a tápfolyadékban vagy sem.
Ez arra utal, hogy a polimer szubsztrát jelenlétében új fehérjék, enzimek
indukálódnak, melyek pontos jellemzését újabb kísérletekkel kell elvégezni.
3. Kimutattam, hogy C. saccharolyticus képes lebontani cellobióz jelenlétében a
güluronsavat, ami a természetben elıforduló biopolimer alginát egyik
komponense és bontja az alginátot magát is. Ezekbıl a polimerekbıl szintén
hidrogént állít elı.
4. Megerısítettem azt a korábban leírt, de vitatott tényt, hogy a C.
saccharolyticus sejtek cellulózbontó aktivitással rendelkeznek. A C.
saccharolyticus sejtek hidrogéntermelés mellett hasznosították a puhafa
forgácsban levı cellulózt és lignocellulózt termofil hımérsékleten.
5. Olcsó hordozókon hatékony felületi immobilizálási eljárást dolgoztam ki a C.
saccharolyticus sejtek számára.
6. Az immobilizálási körülmények optimalizálásával a sejtek életképességének
jelentıs növelését és biológiai aktivitásának hatékony megırzését lehetett
elérni a C. saccharolyticus számára kedvezıtlen életfeltételek mellett is.
7. Teszteltem különféle mezıgazdasági hulladékot és mellékterméket a C.
saccharolyticus rendszerben és azt találtam, hogy a legtöbb alapanyag
megfelelı szubsztrát a biohidrogén termelés számára. Ez és a C.
saccharolyticus extrém termofil természete arra utal, hogy a vizsgált törzs
kiválóan alkalmas ipari léptékő biohidrogén termelı rendszerekben való
alkalmazásra.
75
9. References
Adams M. W. W. The metabolism of hydrogen by extremely thermophilic, sulfur-dependent
bacteria. FEMS Microbiol Rev 1990;75:219-238.
Adams, M. W. W., Mortenson, L. E., and Chen, J.-S., Hydrogenase, Biochim Biophys Acta
1981;594:105.
Ahring, B. K.; Jensen, K.; Nielsen, P.; Bjerre, A. B.; Schmidt, A. S. Pretreatment of wheat
straw and conversion of xylose and xylan to ethanol by thermophilic anaerobic bacteria.
Biores Technol 1996, 58, 107-113.
Aivasidis, A. Scale up of a new fixed bed loop reactor for anaerobic digestion. Proceedings of
the 3rd European Congress of Biotechnology 1984;3:51-60.
Amon T., Amon B., Kryvoruchko V., Zollitsch W., Mayer K. and Gruber L. Biogas
production from maize and dairy cattle manure—Influence of biomass composition on the
methane yield. Agricul Ecosys and Environ 2007;(118):173-182.
Antonopoulou A., Gavala, H.N., Skiadas I.V., Angelopoulos K. and Lyberatos, G. Biofuels
generation from sweet sorghum: Fermentative hydrogen production and anaerobic digestion
of the remaining biomass. Biores Technol 2008;99:110-119.
Antonopoulou A., Ntaikou, I. Gavala, H. N., Skiadas I. V., Angelopoulos K. and Lyberatos,
G. Biohydrogen production from sweet sorgum biomass using mixed acidogenic cultures and
pure cultures of Ruminococcus albus. Global NEST J 2007;9(2):144-151.
Argun, H., Kargi, H., Kapdan, I. K., and Oztekin, R. Biohydrogen production by dark
fermentation of wheat powder solution: Effects of C/N and C/P ratio on hydrogen yield and
formation rate. Int J Hydrogen Energy 2008;33:1813 - 1819.
76
Badziong, W., Thauer, R. K., and Zeikus, J. G., Isolation and characterization of
Desulfovibrio growing on hydrogen plus sulfate as the sole energy source, Arch Microbiol
1978;116:41.
Bagi Z., Acs N., Balint B., Horvath L., Dobo K., Perei K., Rakhely G., Kovacs K. L.
Biotechnological intensification of biogas production. Appl Microbiol Biotechnol
2007;76:473-482.
Barns, S. M., Fundyga, R. E., Jeffries, M. W., Pace, N. R. Remarkable archaeal diversity
detected in a Yellowstone National Park hot spring environment. Proc. Natl. Acad. Sci. USA
1994;91:1609–1613.
Belletti, A., Petrini, C., Minguzzi, A., Landini, V., Piazza, C., Salamini, F. Yield potential and
adaptability to Italian conditions of sweet sorghum as biomass crop for energy production.
Maydica 1991;36:283–291.
Beneman, J. Hydrogen biotechnology - progress and prospect. Nat Biotechnol 1996;14:1101.
Bergquist P. L., Gibbs M. D., Morris D. D., Junior Te'o V. S., Saul D. J., Dwivedi P. P. and
Morris D. Molecular genetics of thermophilic bacterial genes coding for enzymes involved in
cellulose and hemicellulose degradation. Genetics, Biochemistry and Ecology in
Biodegradation of Lignocellulose (Eds. K. Shimada, S. Hoshino, K. Ohmiya, K. Sakka, Y.
Kobayashi and S. Karita), Uni Publishers, Tokyo, Japan 2000;276-285.
Bergquist P. L., Gibbs M. D., Morris D. D., Junior Te'o V. S., Saul D. J. and Morgan H. W.
Molecular diversity of thermophilic cellulolytic and hemicellulolytic bacteria. FEMS
Microbiol Ecol 1999; 28:99-110.
Bohnke, B. Energieminimierung beim adsorptions – tropfkorperverfahren. Gewasserschutz -
wasser - abwasser 1981;45:85-107.
Boopathy, R. Use of microbes in managing post-harvest crop residues: Sugarcane residue as a
case study. In: Microbial Biotechnology in Agriculture and Aquaculture. R.C. Ray (ed.).
Science Publishers Inc., Plymouth, UK, 2005;433-446.
77
Bowen, D. A., Lau, F., Zabransky, R., Remick, R., Slimane, R. and Doong, S. Techno-
economic analysis of hydrogen production by gasification of biomass. Hydrogen, fuel cells
and infrastructure technologies, progress report 2003.
Broadhead, D. M., Freeman, K.C. Stalk and sugar yield of sweet sorghum as affected by
spacing. J Agron 1980;72:523–524.
Chaudhari, S. T., Dalai, A. K. and Bakhshi, N. N. Production of hydrogen and/or syngas (H2
+ CO) via steam gasification of biomass-derived chars. Energy & Fuels 2003;17:1062-1067.
Chinnaraj, S. and Rao, G.V. Implementation of an UASB anaerobic digester at bagasse-based
pulp and paper industry. Biomass and Bioenergy 2006;30:273–277.
Claassen P. A. M. Bioprocess for hydrogen production from biomass, 1st Course in
Technologies and Genomics of Microbial Hydrogen Production, Bertinoro di Romagna, Italy,
12-16 March 2005.
Claassen P. A. M., van Lier J. B., Lopez Contreraz A. M., van Niel E. W. J., Sijtsma L.,
Stams A. J. M., de Vries S. S. and Weusthuis R. A. Utilisation of biomass for the supply of
energy carriers. Appl Microbiol Biotechnol 1999;52:741-755.
Claassen, P. A. M., de Vrije, T. and. Budde, M. A. W. Biological hydrogen production from
sweet sorghum by thermophilic bacteria. 2nd World Conference on Biomass for Energy,
Industry and Climate Protection, 10-14 May 2004, Rome, Italy
Das, D. and Veziroglu, T. N. Hydrogen production by biological processes. Int J Hydrogen
Energy 2001;26:13-28.
Dawson, L. and Boopathy, R. Cellulosic ethanol production from sugarcane bagasse without
enzymatic saccharification. Bioresources 2008;3(2):452-460.
Dawson, L. and Boopathy, R. Use of post-harvest sugarcane residue for ethanol production.
Biores Technol 2007;98:1695-1699.
78
Dellepiane, D., Bosio, B. and Arato, E. Clean energy from sugarcane waste: feasibility study
of an innovative application of bagasse and barbojo. Journal of Power Sources 2003;122:47–
56.
DeRosa, M., Gambacorta, A., Huber, R. Lanzotti, V., Nicolaus, B., Stetter, K. O. and
Trincone, A. Lipid structures in Termotoga maritima. Microbiology of extreme environments
and its potential for biotechnology. London and New York: Elsevier Applied Science.
1989;167-173.
Dervakos G. A, Webb C. On the merits of viable-cell immobilisation. Biotechnol Adv
1991;9:559 –612.
Dien, B. S., Cotta, M. A. and Jeffries, T. W. Bacteria engineered for fuel ethanol production:
current status. Appl Micrbiol and Biotechnol 2003;63:258-266.
Edwards-Levy F, Levy M. C. Serum albumin-alginate coated beads: mechanical properties
and stability. Biomaterials 1999;20:2069-2084.
Ellwood, D. C., Keevil, C. W. Marsh, P. D. Brown, C. M. and Wardell, J. N. Surface
associated growth. Phil. Trans. R. Soc. London 1982; 512-532.
Ertesvag H, Valla S. Biosynthesis and applications of alginates. Polymer Degradation and
Stability 1998;59:85-91.
Fan, Y-T., Zhang, Y-H., Zhang, S-F., Hou, H-W and Ren, B-Z. Efficient conversion of wheat
straw wastes into biohydrogen gas by cow dung compost. Biores Technol 2006;97:500-505.
Fang, J. M., Sun, R. C., Salisbury D., Fowler P. and Tomkinson J. Comparative study of
hemicelluloses from wheat straw by alkali and hydrogen peroxide extractions. Polymer
Degrad and Stab 1999;66(3):423-432.
Farrell A. E., Plevin R. J., Turner B. T., Jones A. D., O’Hare M. and Kammen D. M.: Ethanol
can contribute to energy and environmental goals. Science 2006;311:506-508.
79
Ferraris, R. and Charles-Edwards, D.A. A comparative analysis of the growth of sweet and
forage sorghum crops. I. Dry matter production, phenology and morphology. Aust. J. Agri
Res 1986;37:495–512.
Fuchs, T., Huber, H., Teiner, K., Burggraf, S. and Stetter, K. O. Metallosphaera prunae, sp.
nov., a novel metal-mobilizing thermoacidophilic Archaeum, isolated from a uranium mine in
Germany. Syst. Appl. Microbiol. 1995;18:560–566.
Gerbsch, N. and Buchholz, R. New processes and actual trends in biotechnology. FEMS
Microbiol Rev 1995;16:259– 69.
Gest, H. and Peck , H. D., Jr. A study of the hydrogen lyase reaction with systems derived
from normal and anaerobic coli-aerogenes bacteria. J Bacteriol 1955;70:326.
Gest, H., Kamen, M. D. and Bregoff, H. M. Studies on the metabolism of photosynthetic
bacteria, V. Photoproduction of hydrogen and nitrogen fixation by Rhodospirillum rubrum, J
Biol Chem 1950;182:153-158.
Ghigo, J-M. Are there biofilm-specific physiological pathways beyond a reasonable doubt?
Res Microbiol 2003;154:1 –8.
Gibbs M. D., Reeves R. A., Farrington G. K., Anderson P., Williams D. P. and Bergquist P.
L. Multidomain and multifunctional glycosyl hydrolases from the extreme thermophile
Caldicellulosiruptor rchisolate Tok7B.1. Curr Microbiol 2000;40:333-340.
Gray, C. T. and Gest, H. Biological formation of molecular hydrogen. Sci 1965;148:186.
Ha J, Kim G. T, Tim S. K, Oh T. K, Yu J. H, Kong I. S. β-Agarase from Pseudomonas sp.
W7: purification of the recombinant enzyme from Escherichia coli and the effects of salt on
its activity. Biotechnol Appl Biochem 1997;26:1-6.
Hallenbeck, P. C. Fundamentals of the fermentative production of hydrogen. Water Sci and
Technol 2005;52:21-29.
80
Hammerschlag R. Ethanol’s energy return on investment: a survey of the literature 1990-
present. Environ Sci Technol 2006;40:1744-1750.
Harden, A., The chemical action of Bacillus coli communis and similar organisms on
carbohydrates and allied compounds, J Chem Soc 1901;79:601.
Hattori, R. and Hattori, T. Interaction of microorganisms with a charged surface – a model
experiment. Rep. Inst Agric Res 1987;36:21-67.
Hedderich, R. Energy-converting [NiFe] hydrogenases from Archea and extremophiles:
ancestors of Complex I. J Bioenerg Biomembr 2004;36:65-75.
Hill J., Nelson E., Tilman D., Polasky S. and Tiffany D. From the cover: environmental,
economic, and energetic costs and benefits of biodiesel and ethanol biofuels. Proc Natl Acad
Sci USA 2006;103:11206-11210.
Huber H. and Stetter, K.O. Hyperthermophiles and their possible potential in biotechnology. J
Biotechnol 1998;64:39–52.
Huber, G. and Stetter, K. O. Sulfolobus metallicus, sp. nov., a novel strictly
chemolithoautotrophic thermophilic archaeal species of metal mobilizers. Syst. Appl.
Microbiol. 1991;14:372–378.
Hudson, J. A., Morgan, H. W. and Daniel, R. M. A survey of cellulolytic anaerobic
thermophiles from hot springs. Syst Appl Microbiol 1990;13:72-76.
Hudson, R. C., Schofield, L. R., Coolbear, T., Daniel, R. M. and Morgan, H. W. Purification
and properties of an aryl beta-xylosidase from a cellulolytic extreme thermophile expressed in
Escherichia coli. Biochem J 1991;273:645-650.
Hussy, I., Hawkes, F. R., Dinsdale, R. and Hawkes, D. L. Continuous fermentative hydrogen
production from a wheat starch co-product by mixed microflora. Biotechnol and Bioeng
2003;84(6):619-626.
81
Iranmahboob, J., Nadim, F. and Monemi, S. Optimizing acid hydrolysis: a critical step for
production of ethanol from mixed wood chips. Biomass and Bioenergy 2002;22:401-404.
Iwabe, N., Kuma, K., Hasegawa, M., Osawa, S. and Miyata, T. Evolutionary relationship of
archaebacteria, eubacteria and eucaryotes inferred from phylogenetic trees of duplicated
genes. Proc. Natl. Acad. Sci. USA 1989;86:9355– 9359.
Jirku, V. Whole cell immobilization as a means of enhancing ethanol tolerance. J Ind
Microbiol Biotech 1999;22:147– 51.
Johns, A. T. and Barker, H. A., Methane formation, fermentation of ethanol in the absence of
CO2 by Methanobacillus omelianskii. J Bacteriol 1960;80:837.
Johns, A. T., The mechanism of propionic acid formation by Veillonella gazogenes. J Gen
Microbiol 1951;5:326.
Junter, J-A and Jouenne, T. Immobilized viable microbial cells: from the process to the
proteome. . . or the cart before the horse. Biotechnology Advances 2004;22:633–658.
Kadar, Zs., de Vrije T., van Nooeden, G. E., Budde, M. A. W., Szengyel, Zs., Reczey, K. and
Claassen, P. A. M. Yields from glucose, xylose, and paper sludge hydrolysate during
hydrogen production by the extreme thermophile Caldicellulosiruptor saccharolyticus. Appl
Biochem Biotechnol 2004;(113-116):497-508.
Karel, S. F., Libicki, S. B. and Robertson, C. B. The immobilization of whole cells:
engineering principles. Chem Eng Sci 1985;40:1321–1354.
Kates, M. Archaebacterial lipids: structure, biosynthesis and function. The archaebacteria:
biochemistry and biotechnology. London and Chapel Hill: Portland Press, 1992;51-72.
Kendall, K. and Cullum, J. Cloning and expression of extracellular agarase from Streptomyces
coelicolor A3(2) in Streptomyces lividans 66. Gene 1984;29:315-321.
82
Kengen, S. W. M., Stams, A. J. M. and de Vos, W. M. Sugar metabolism of
hyperthermophiles. FEMS Microbiol Rev 1996;18:119-137.
Kim, Y., Ingram, L. O. and Shanmugam, K. T. Construction of an Escherichia coli K-12
mutant for homoethanologenic fermentation of glucose or xylose without foreign genes. Appl
Env Microbiol 2007; 73:1766-1771.
Kyazze, G., Dinsdale, R., Hawkes, F. R., Guwy, A. J., Premier, G. C. and Donnison, I. S.
Direct fermentation of fodder maize, chicory fructans and perennial ryegrass to hydrogen
using mixed microflora. Bioresour Tecnol 2008;99(18):8833-9.
Leuschner, C. and Antranikian, G. Heat-stable enzymes from extremely thermophilic and
hyperthermophilic microorganisms. World J. Microbiol. Biotechnol. 1995;11:95–114.
Levin, D. B., Pitt, L. and Love, M. Biohydrogen production: prospects and limitations to
practical application. Int J Hydrogen Energy 2004;29: 173–185.
Levin, D. B., Rumana, I. Cicek, N. Sparling, R. Hydrogen production by Clostridium
thermocellum 27405 from cellulosic biomass substrates. Int J Hydrohen Energy
2006;31:1496-1503.
Li S., Schöneich C. and Borchardt R. T. Chemical instability of protein pharmaceuticals:
Mechanisms of oxidation and strategies for stabilization. Biotechnol Bioeng 1995;48:490-
500.
Li, F., Hinderberger, J., Seedorf, H., Zhang, J., Buckel, W. and Thauer, R. K. Coupled
ferredoxin- and crotonyl-CoA reduction with NADH catalyzed by the butyryl-CoA
dehydrogenase/Etf complex from Clostridium kluyveri. J Bacteriol 2007;190:843-850.
Lyon, E.J., Shima, S., Boecher, R., Thauer, R.K., Grevels, F.-W., Bill, E., Roseboom, W. and
Albracht, S.P.J. "Carbon monoxide as an intrinsic ligand to iron in the active site of the iron-
sulfur-cluster-free hydrogenase H2-forming methylenetetrahydromethanopterin
dehydrogenase as revealed by infrared spectroscopy". J Am Chem Soc 2004;126:14239-
14248.
83
Madigan, M. T. and Marrs, B. L. Extremophiles. Scientific American 1997;(4):66-71.
Mamma, D., Koullas D., Fountoukidis, G., Kekos, D., Macris, B. J. and Koukios, E.
Bioethanol from sweet sorghum: Simultaneous saccharification and fermentation of
carbohydrates by a mixed microbial culture. Proc Biochem 1996;31(4):377-381.
Martin, C., Galbe, M., Wahlbom, C. F., Hahn-Hagerdal, B. and Jonsson, L. J. Ethanol
production from enzymatic hydrolysates of sugarcane bagasse using recombinant xylose-
utilizing Saccharomyces cerevisiae. Enz Microb Technol 2002; 31:274-282.
Martinez-Perez, N., Cherryman, S. J., Premier, G. C., Dinsdale, R. M., Hawkes, D. L.,
Hawkes, F. R., Kyazze, G. and Guwy, A. J. The potential for hydrogen-enriched biogas
production from crops: Scenarios in the UK. Biomass and Bioenergy 2007;31:95–104.
Massanet-Nicolau, J., Dinsdale, R. and Guwy A. Hydrogen production from sewage sludge
using mixed microflora inoculum: Effect of pH and enzymatic pretreatment. Bioresour
Technol 2008;99:6325-6331
Mattiasson B, Hahn-Hagerdal B. Microenvironmental effects on metabolic behaviour of
immobilized cells: a hypothesis. Eur J Appl Microbiol Biotechnol 1982;16:52-55.
Michel, G., Nyval-Collen, P., Barbeyron, M. C. and Helbert, W. Bioconversion of red
seaweed galactans: a focus on bacterial agarases and carragenases. Appl Microbiol Biotechnol
2006;71:23-33.
Miller, G. L. Use of dinitrosalicylic acid reagent for determination of reducing sugars. Anal
Chem 1959;31:426-428.
Nandi, R. and Sengupta, S. Microbial production of hydrogen: an overview. Crit Rev
Microbiol 1998;24:61–84.
Nath, K. and Das, D. Hydrogen from biomass. Curr Sci 2003;85(3):265-271.
84
Nath, K. and Das, D. Improvement of fermentative hydrogen production: various
Approaches. Appl Microbiol Biotechnol 2004;65:520–529.
Nelson, C. H., Robinson, J. A. and Characklis, W. G. Bacterial adsorption to smooth surfaces.
Biotechnol Bioeng 1988;27:1662-1667.
Newcomb, M., Chen, C. Y., David, Wu. J. H. Induction of the celC operon of Clostridium
thermocellum by laminaribiose. PNAS 2007;104(10):3747-3752.
Ntaikou, I., Gavala H. N., Kornaros, A. and Lyberatos, G. Hydrogen production from sugars
and sweet sorghum biomass using Ruminococcus albus. Int J of Hydrogen Energy
2008;(13):1153 – 1163.
Oh, Y-K., Seol, E-H., Kim, J. R., Park, S. Fermentative biohydrogen production by a new
chemoheterotrophic bacterium Citrobacter sp. Y19. Int J Hydrogen Energy 2003;28:1353–
1359.
Oh, Y-K., Seol, E-H., Yeol, L. E., Park, S. Fermentative hydrogen production by a new
chemolithotrophic bacterium Rhodopseudomonas palustris P4. Int J Hydrogen Energy
2002;27:1373–1379.
Ohta, Y., Nogi, Y., Miyazaki, M., Li, Z., Hatada, Y., Ito, S. and Horikoshi, K. Enzymatic
properties and nucleotide and amino acid sequences of a thermostable β-agarase from the
novel marine isolate, JAMB-A94. Biosci Biotechnol Biochem 2004;68:1073-1081.
Ormerod, J. G., Ormerod, K. S., and Gest, H. Light dependent utilization of organic
compounds and photoproduction of molecular hydrogen by photosynthetic bacteria;
relationships with nitrogen metabolism, Arch Biochem Biophys 1961;94:449-457.
Ottengraf, S. P. P. Biological systems for waste gas elimination. Trends Biotechnol
1987;5:132-136.
85
Pakes, W. C. C. and Jollyman, W. H., The bacterial decomposition of formic acid into CO2
and H2, J Chem Soc 1901;79:386.
Pan, Ch., Fan, Y. and Hou, H. Fermentative production of hydrogen from wheat bran by
mixed anaerobic cultures. Ind Eng Chem Res 2008;47:5812-5818.
Pattra, S., Sangyoka, S., Boonmee, M. and Reungsang, A. Bio-hydrogen production from the
fermentation of sugarcane bagasse hydrolysate by Clostridium butyricum. Int J Hydrogen
Energy 2008;33:5256-5265.
Peck, H. D., Jr. and Gest, H., Formic dehydrogenase and the hydrogenlyase enzyme complex
in coli-aerogenes bacteria, J Bacteriol 1957;73:706.
Perrot, F., Hebraud, M., Charlionet, R., Junter, G-A. and Jouenne, T. Protein patterns of gel-
entrapped Escherichia coli differ from those of free-floating organisms. Electrophoresis
2000;21:645– 53.
Petrini, C., Belletti, A. and Salamini, F. Accumulation and distribution on dry matter and
soluble carbohydrates in two sweet sorghum cultivars: influence of sowing date and
harvesting time. Eur J Agron 1993;2(3):185–192.
Pfennig, N. Phototrophic green and purple bacteria: a comperative, systematic survey. Ann
Rev Microbiol 1977;31:275-277.
Potin, P., Richard, C., Rochas, C. and Kloareg, B. Purification and characterization of α-
agarase from Alteromonas agaralyticus (Cataldi) comb. Nov., strain GJ1B. Eur J Biochem
1993;214:599-607.
Preiss, J. and Ashwell, G. Alginic acid metabolism in bacteria. J Biol Chem 1962;237:309-
316.
Raihan, S., Ahmed, N., Macaskie, L. E. and Lloyd, J. R. Immobilization of whole bacterial
cells for anaerobic biotransformations, Appl Microbiol Biotechnol 1997;47:352-357.
86
Rainey, F. A., Donnison, A .M., Janssen, P. H., Saul, D., Rodrigo, A., Bergquist, P. L.,
Daniel, R. M., Stackebrandt, E. and Morgan, H. W. Description of Caldicellulosiruptor
saccharolyticus gen nov., sp. Nov: An obligately anaerobic, extremely thermophilic,
cellulolytic bacterium. FEMS Microbiology Letters 1994;120:263-266.
Rakhely, G. and Kovacs, K. L. Plating hyperthermophilic archea on solid surface. Anal
Biochem 1996;243: 181-183.
Raposo, F., Banks, C. J., Siegert, I., Heaven, S. and Borja, R. Influence of inoculum to
substrate ratio on the biochemical methane potential of maize in batch tests. Process Biochem
2006;41:1444–1450.
Razmovski, R. and Pejin, D. Immobilization of Saccharomyces diastaticus on wood chips for
ethanol production. Folia Microbiol (Praha) 1996;41:201-207.
Ritzau, M., Keller, M., Wessels, P., Stetter, K. O. and Zeeck, A. New cyclic polysulfides from
hyperthermophilic archaea of the genus Thermococcus. Liebigs Ann Chem 1993;871-876.
Robertson, D. E., Mather, E. J., Swanson, R. V., Marrs, B. L. and Short, J. M. The discovery
of new biocatalysts from microbial diversity. Soc. Ind. Microbiol. News 1996;46:3–8.
Rosenberg, I. M. Protein analysis and purification. Benchtop techniques. Birkhauser Boston
1996.
Roychowdhury, S., Cox, D., and Levandowsky, M. Production of hydrogen by microbial
fermentation. Int. J Hydrogen Energy 1988;13:407.
Saha, B. C., Biswas, A. and Cotta, M. A. Fuel ethanol production from microwave pretreated
wheat straw. Proceedings of the United States-Japan Cooperative Program in Natural
Resources Food and Agriculture Panel 37th Annual Meeting, August 24-28, 2008, Chicago,
Illinois. p. 46-47.
87
Sambrook, J., Maniatis, T., Fritsch, E. F: Molecular cloning: a laboratory manual. Cold
Spring Harbour Laboratory, Cold Spring Harbour, NY. 1989.
Sasikala, K., Ramana, Ch. V., Rao, P. R. and Kovacs, K. L. Anoxygenic phototrophic
bacteria: physiology and advances in hydrogen production technology. Adv Appl Microbiol
1993;38:211-295.
Schembri, M. A., Kjrgaard, K. and Klemm, P. Global gene expression in Escherichia coli
biofilms. Mol Microbiol 2003;48:253– 67.
Schmersahl, R., Mumme, J. and Scholz, V. Farm-based biogas production, processing, and
use in polymer electrolyte membrane (PEM) fuel cells. Ind Eng Chem Res 2007;46:8946-
8950
Shih, S. F., Gascho, G. J. and Rahi, G. S. Modeling biomass production of sweet sorghum.
Agron J 1981;73:1027–1032.
Sissons, C. H,, Sharrock, K. R., Daniel, R. M. and Morgan, H. W. Isolation of cellulolytic
anaerobic extreme thermophiles from New Zealand thermal sites. Appl. Environ. Microbiol
1987;53:832-838.
Slesarev, A., Stetter, K. O., Lake, J. A., Gellert, M., Krah, R. and Kozyavkin, S. A. DNA
topoisomerase V is a relative of eukaryotic topoisomerase I from hypothermophylic
prokaryote. Nature 1993;364:735-737.
Smith, G. A., Bagby, M. O., Lewellan, R. T., Doney, D. L., Moore, P. H., Hills, F. J.,
Campbell, L. G., Hogaboam, G. J., Coe, G. E. and Freeman, K. Evaluation of sweet sorghum
for fermentable sugar production potential. Crop Sci 1987;27:788–793.
Soboh, B., Linder, D. and Hedderich, R. A multisubunit membrane-bound [NiFe] hydrogenase
and an NADH-dependent Fe-only hydrogenase in the fermenting bacterium
Thermoanaerobacter tengcongensis. Microbiology 2004;150:2451-2463
88
Somayaji, D.. and Khanna, S. Biomethanation of rice and wheat straw. World J Microbiol and
Biotechnol 1994;10(5):521-523.
Stetter, K. O. The lesson of Archaebacteria. In: Bengtson, S. (Ed.), Nobel Symposium, vol.
84. Columbia University Press, New York, 1994;143–151.
Sugano, Y., Matsumoto, T., Kodama, H. and Noma, M. Cloning and sequencing of agaA, a
unique agarase 0107 gene from a marine bacterium Vibrio sp. Strain JT0107. Appl Environ
Microbiol 1993;59:3750-3756.
Sugano, Y., Matsumoto, T. and Noma, M. Sequence analysis of the agaB gene encoding a
new β-agarase from Vibrio sp. Strain JT0107. Biochim Biophys Acta 1994;17:105-108.
Sunna, A., Gibbs, M. D. and Bergquist, P. L. A novel thermostable multidomain 1,4-b
xylanase from Caldibacillus cellulovorans and effect of its xylan-binding domain on enzyme
activity. Microbiol 2000;146:2947-2955.
Taherzadeh, M. J. and Karimi, K. Pretreatment of lignocellulosic wastes to improve ethanol
and biogas production: a review. Int J Mol Sci 2008;9:1621-1651.
Tanisho, S., Wakao, N. and Kosako, P. Biological hydrogen production by Enterobacter
aerogenes. J Chem Eng Jpn 1983;16:529-530.
Tarantino, E., Perniola, M., Quaglietta, F. and Rivelli, A. R. Growth analysis and sugar yield
of sweet sorghum under different irrigation times. Proc. 2nd ESA Congress, 1992;142–143.
Thabet, O. B. D., Fardeau, M.-L., Joulian, C., Thomas, P., Hamdi, M., Garcia, J.-L. &
Ollivier, B. Clostridium tunisiense sp. nov., a new proteolytic, sulfur-reducing bacterium
isolated from an olive mill wastewater contaminated by phosphogypse. Anaerobe
2004;10:185–190.
Torney, F., Moeller, L., Scarpa, A. and Wang, K. Genetic engineering approaches to improve
bioethanol production from maize. Curr Opini in Biotechnol 2007;18:193–199.
89
Twarog, R. and Wolfe, R. S., Role of butyryl phosphate in the energy metabolism of
Clostridium tetanomorphum. J Bacteriol 1965;86:112.
Ueno Y., Otauka S. and Morimoto M. Hydrogen production from industrial wastewater by
anaerobic microflora in chemostat culture. J Ferment Bioeng 1996;82:194-7.
Van de Werken, H. J. G., Verhaart, M. R. A., VanFossen, A. L., Willquist, K., Lewis, D. L.,
Nichols, J. D., Goorissen, H. P., Mongodin, E. F., Nelson, K. E., van Niel, E. W. J., Stams, A.
J. M., Ward, D. E., de Vos, W. M., van der Oost, J., Kelly, R. M. and Kengen, S. W. M.
Hydrogenomics of the extremely thermophilic bacterium Caldicellulosiruptor saccharolyticus.
Appl Environ Microbiol 2008;doi:10.1128/AEM.00968-08.
Van der Meulen, H. J. and Harder, W. Production and characterization of the agarase of
Cytophaga flevensis. Antonie Van Leeuwenhoek 1975;41:431-447.
Van Loosdrecht, M. C. M., Norde, W. and Zehnder, A. J. B. Physical chemical description of
bacterial adhesion. J Biomater Appl 1990;5:91-106.
Van Niel E.W.J., Budde M.A.W., de Haas G.G., van der Wal F.J., Claassen P.A.M. and
Stams A.J.M. Distinctive properties of high hydrogen producing extreme thermophiles,
Caldicellulosiruptor saccharolyticus and Thermotoga elfii. Int J Hydrogen Energy
2002;27:1391-1398.
Van Niel, E. W. J., Claassen, P. A. M. and Stams, A. J. M. Substrate and product inhibition of
hydrogen production by the extreme thermophile, Caldicellulosiruptor saccharolyticus.
Biotechnol Bioeng 2003;81:255-262.
Velings, N. M. and Mestdagh, M. M. Physico-chemical properties of alginate gel beads.
Polymer Gels and Networks 1995;3:311-330.
Vera, J., Alvarez, R., Murano, E., Slebe, J. C. and Leon, O. Identification of a marine
agarolytic Pseudoalteromonas isolate and characterization of its extracellular agarase. Appl
Environ Microbiol 1998;64:4378-4383.
90
Verein Deutcher Ingenieure VDI 4630: Fermentation of organic materials, characterisation of
the substrate, sampling, collection of material data, fermentation tests. Beuth Verlag GmbH,
Dusseldorf 2006.
Vietor, D. M. and Miller, F. R. Assimilation, partitioning and nonstructural carbohydrates in
sweet sorghum compared with grain sorghum. Crop Sci 1990;30:1109-1115.
Vignais, P. M. and Billoud, B. Occurence, classification, and biological function of
hydrogenases: an overview. Chem Rev 2007;107:4206-4272.
Whiteley, M., Bangera, M. G., Bumgarner, R. E., Parsek, M. R., Teitzel, G. M. and Lory, S.
Gene expression in Pseudomonas aeruginosa biofilms. Nature 2001;413:860-4.
Woese, C. R., Kandler, O. and Wheelis, M. L. Towards a natural system of organisms.
Proposal for the domains Archaea, Bacteria, and Eucarya. Proc. Natl. Acad. Sci. USA
1990;87:4576-4579.
Wong, T. Y., Preston, L. A. and Schiller, N. L. Alginate lyase: review of major sources and
enzyme characteristics, structure-function analysis, biological roles, and applications. Ann
Rev Microbiol 2000;54:289-340.
Wu, L. F. and Mandrand, L. A., Microbial hydrogenase-primary structure classification,
signatures and phylogeny. FEMS Microbiol Rev 1993;104:243.
Yokoi, H., Saitsu, A., Uchida, H., Hirose, J., Hayashi, S. AND Takasaki, Y. Microbial
hydrogen production from sweet potato starch residue. J Biosci Bioeng 2001;91:58-63
Zajic, J. E., Kosaric, N., and Brosseau J. D., Microbial production of hydrogen. Adv Biochem
Eng 1978;9:57.
Zhu, J., Wu, X., Miller, C., Yu, F., Chen, P., Ruan, R. Biohydrogen production through
fermentation using liquid swine manure as substrate. J Environ Sci Health B 2007;42:393-401