Embed Size (px)
Citation preview
Ph.D. Gordana Stefanović, Assist. Prof.Dušan Marković, Ph.D. Student
Faculty of Mechanical Engineering
University of Nis, Serbia
COMPARATIVE ANALYSIS OF THE WASTE MANAGEMENT POSSIBILITY ON THE TERRITORIES OF SERBIA AND CROATIA
XIth International Symposium Waste management Zagreb 2010, 25-26 XI 2010. Zagreb
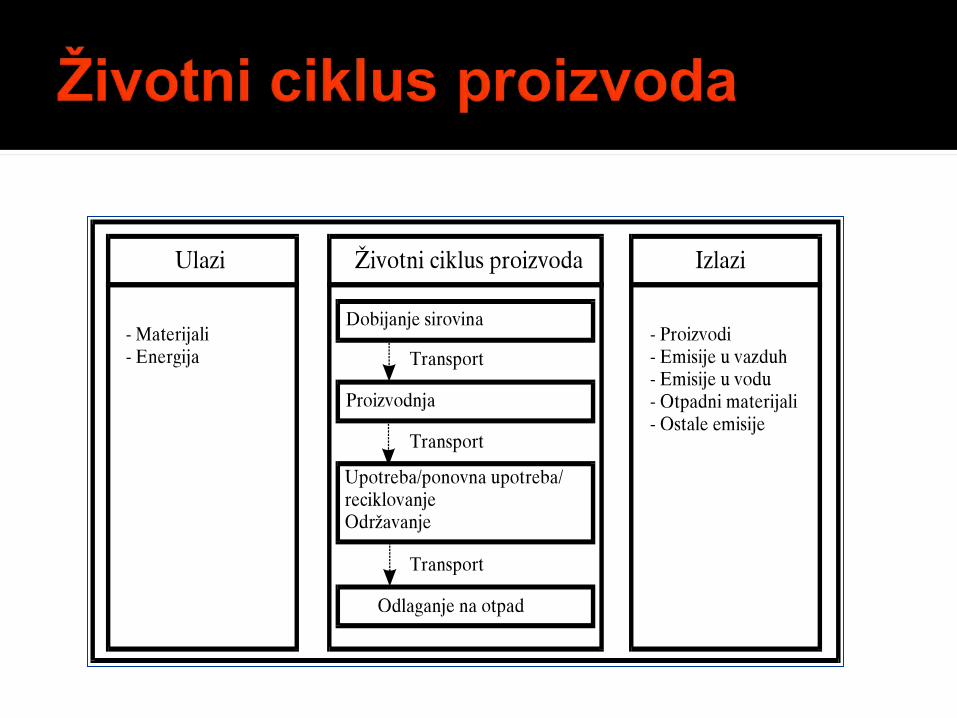
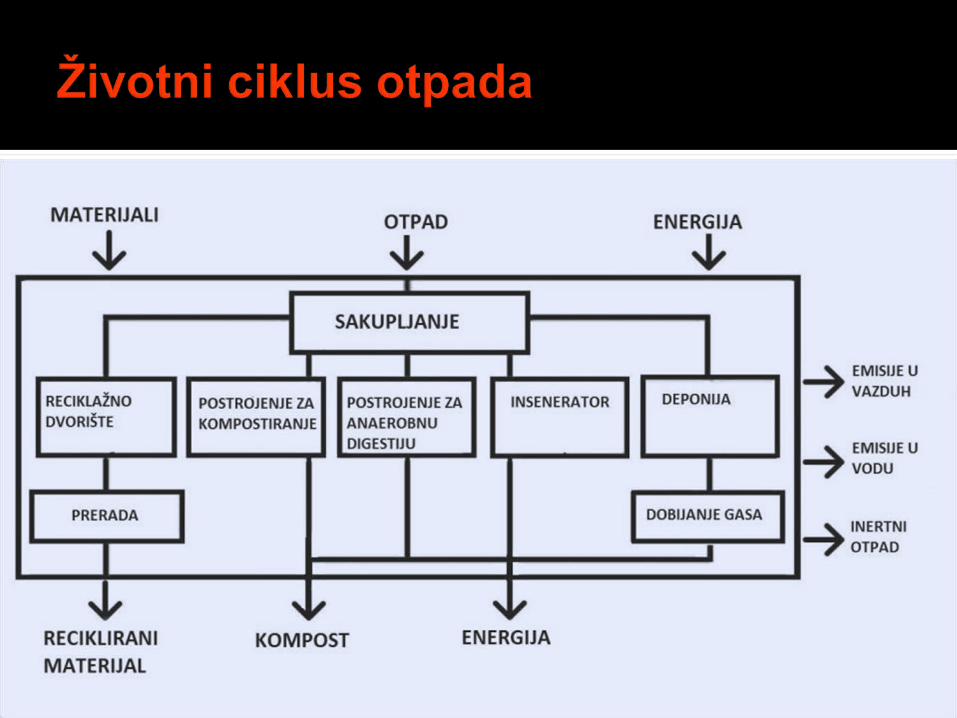
Introduction LCA of product and LCA of the waste IWM model
Indicated parameter of the model Model limitations Waste quantity and quality analysis (Nis and Zagreb) Scenarios 1-4
Results and discussion Conclusions
SWM trendsState of the art in EuropeState of the art in Serbia and CroatiaFuture plansLCA
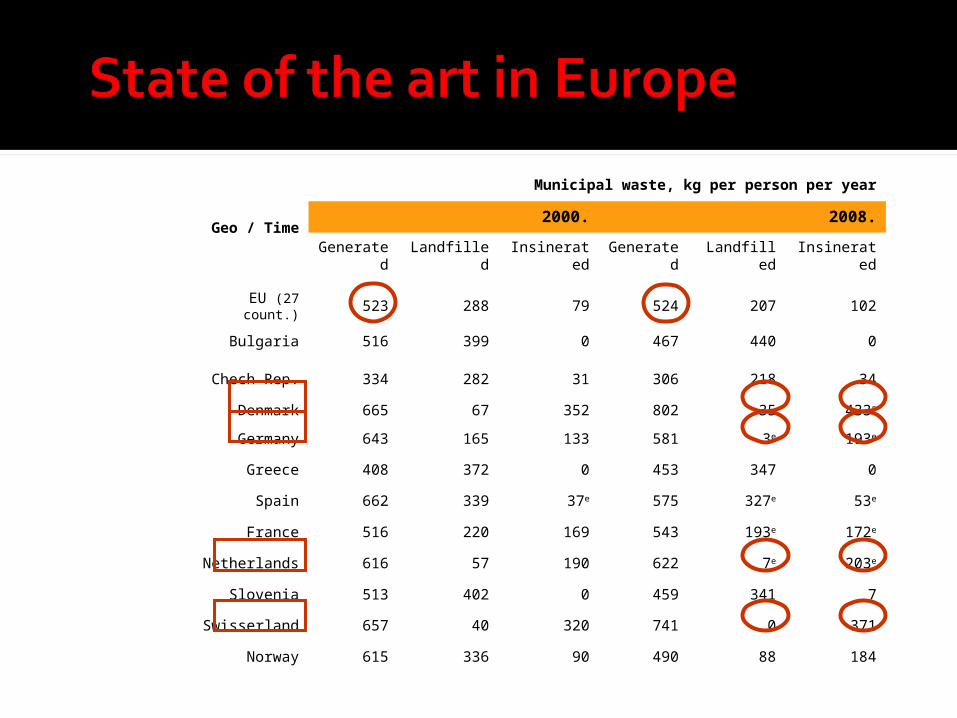
Geo / Time
Municipal waste, kg per person per year
2000. 2008.
Generated Landfilled Insinerated Generated Landfilled Insinerated
EU (27 count.) 523 288 79 524 207 102
Bulgaria 516 399 0 467 440 0
Chech Rep. 334 282 31 306 218 34
Denmark 665 67 352 802 35 433s
Germany 643 165 133 581 3e 193e
Greece 408 372 0 453 347 0
Spain 662 339 37e 575 327e 53e
France 516 220 169 543 193e 172e
Netherlands 616 57 190 622 7e 203e
Slovenia 513 402 0 459 341 7
Swisserland 657 40 320 741 0 371
Norway 615 336 90 490 88 184
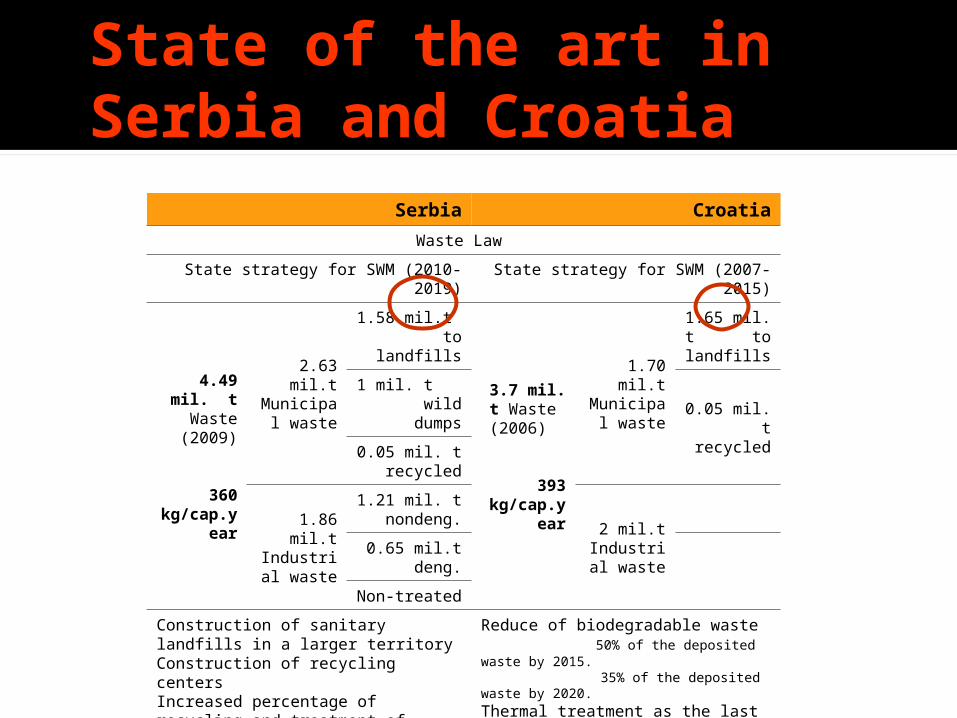
Serbia Croatia
Waste Law
State strategy for SWM (2010-2019) State strategy for SWM (2007-2015)
4.49 mil. t Waste (2009)
360 kg/cap.year
2.63 mil.t Municipal
waste
1.58 mil.t to landfills
3.7 mil. t Waste
(2006)
393 kg/cap.year
1.70 mil.t Municipal
waste
1.65 mil. t to landfills
1 mil. t wild dumps 0.05 mil. t
recycled0.05 mil. t recycled
1.86 mil.t Industrial
waste
1.21 mil. t nondeng. 2 mil.t
Industrial waste0.65 mil.t deng.
Non-treated
Construction of sanitary landfills in a larger territoryConstruction of recycling centersIncreased percentage of recycling and treatment of hazardous waste
Reduce of biodegradable waste 50% of the deposited waste by 2015. 35% of the deposited waste by 2020.
Thermal treatment as the last step in waste management
State of the art in Serbia and Croatia
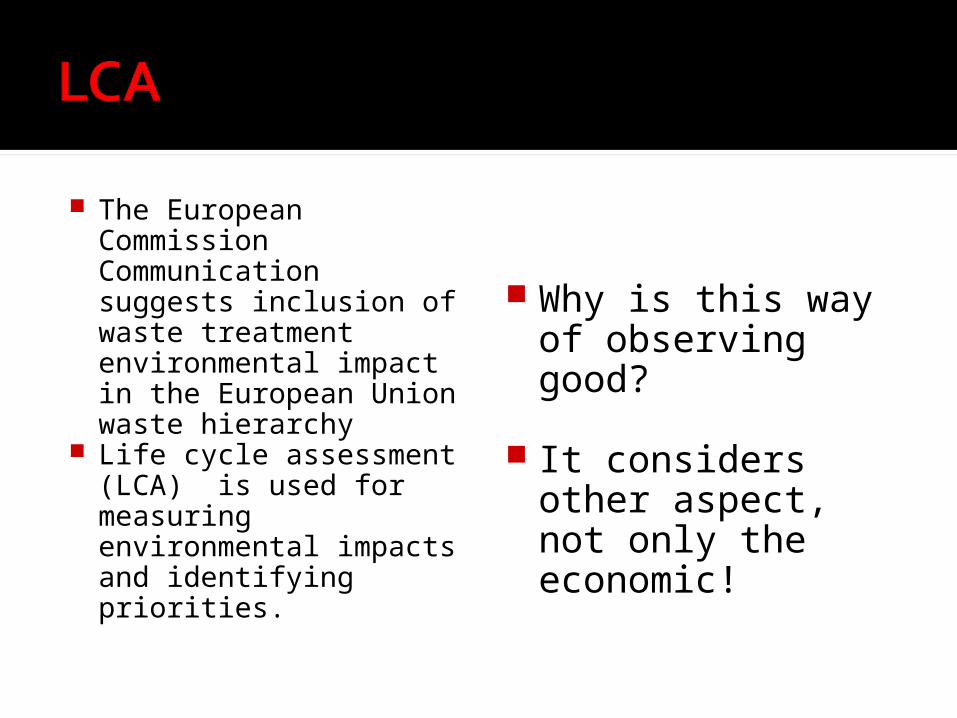
The European Commission Communication suggests inclusion of waste treatment environmental impact in the European Union waste hierarchy
Life cycle assessment (LCA) is used for measuring environmental impacts and identifying priorities.
Why is this way of observing good?
It considers other aspect, not only the economic!
The aim of this study is the application of the LCA procedure to MSW management in two cities (Nis and Zagreb) in order to choose the best management system from the aspect of environment protection.
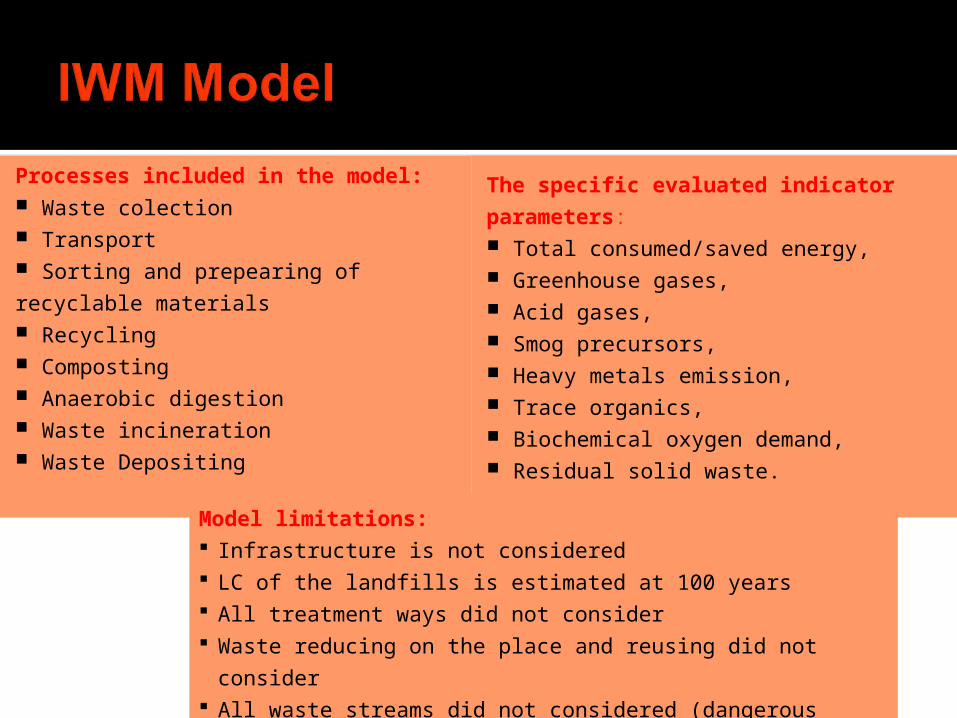
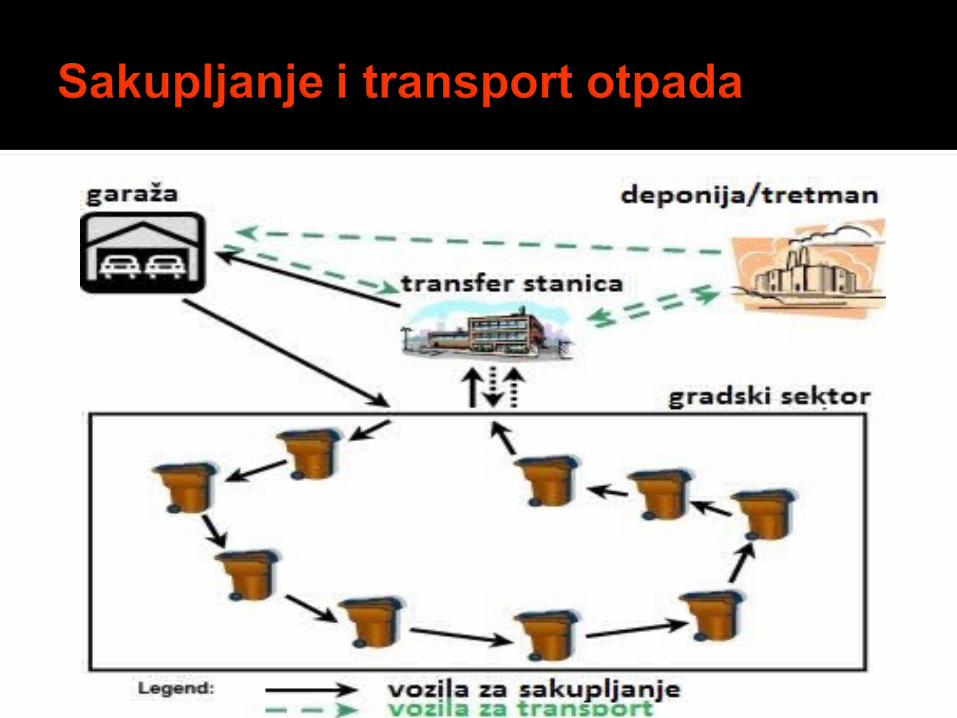
Processes included in the model: Waste colection Transport Sorting and prepearing of recyclable
materials Recycling Composting Anaerobic digestion Waste incineration Waste Depositing
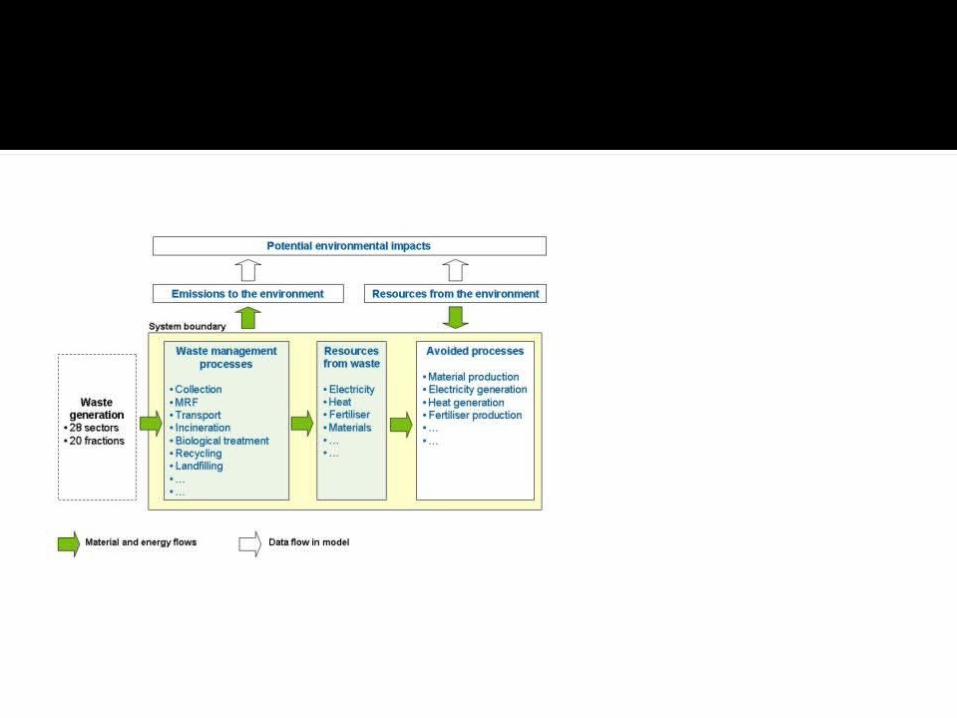
The specific evaluated indicator parameters: Total consumed/saved energy, Greenhouse gases, Acid gases, Smog precursors, Heavy metals emission, Trace organics, Biochemical oxygen demand, Residual solid waste.
Model limitations: Infrastructure is not considered LC of the landfills is estimated at 100 years All treatment ways did not consider Waste reducing on the place and reusing did not consider All waste streams did not considered (dangerous waste,..)
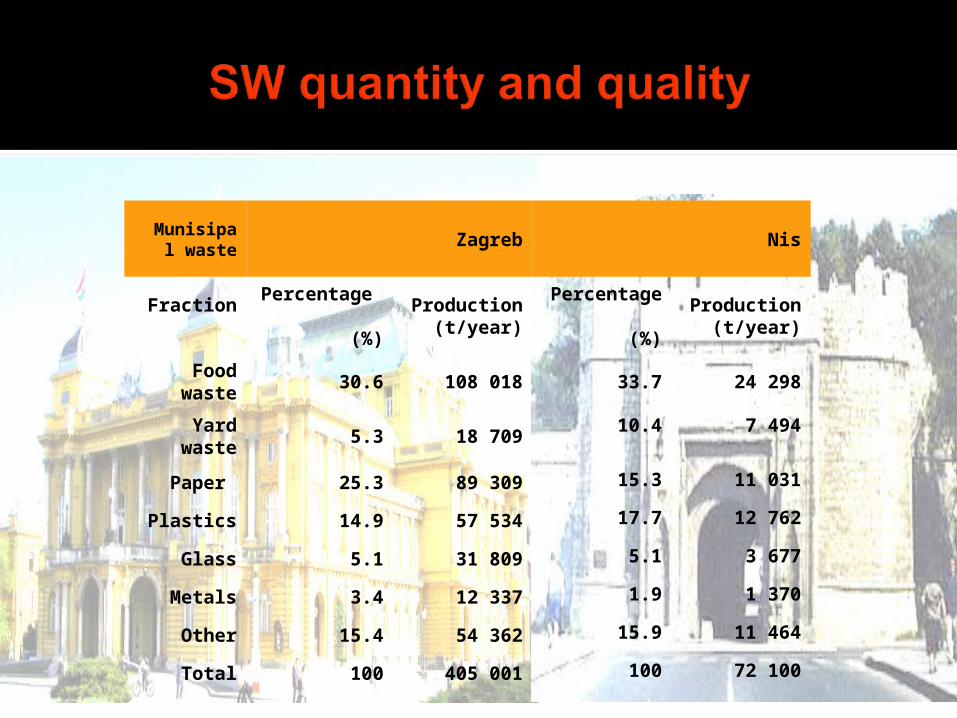
Munisipal waste
Zagreb Nis
Fraction Percentage (%)
Production (t/year)
Percentage (%)
Production (t/year)
Food waste 30.6 108 018 33.7 24 298
Yard waste 5.3 18 709 10.4 7 494
Paper 25.3 89 309 15.3 11 031
Plastics 14.9 57 534 17.7 12 762
Glass 5.1 31 809 5.1 3 677
Metals 3.4 12 337 1.9 1 370
Other 15.4 54 362 15.9 11 464
Total 100 405 001 100 72 100
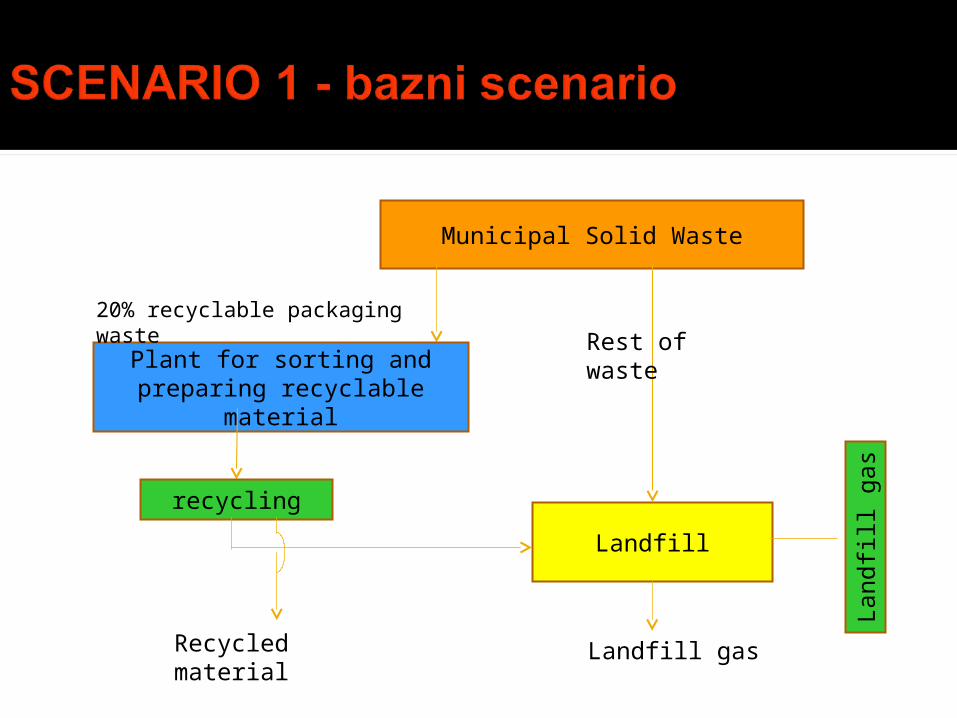
Municipal Solid Waste
Plant for sorting and preparing recyclable material
Landfill
recycling
20% recyclable packaging waste
Landfill gasRecycled material
Rest of waste
Landfill
gas
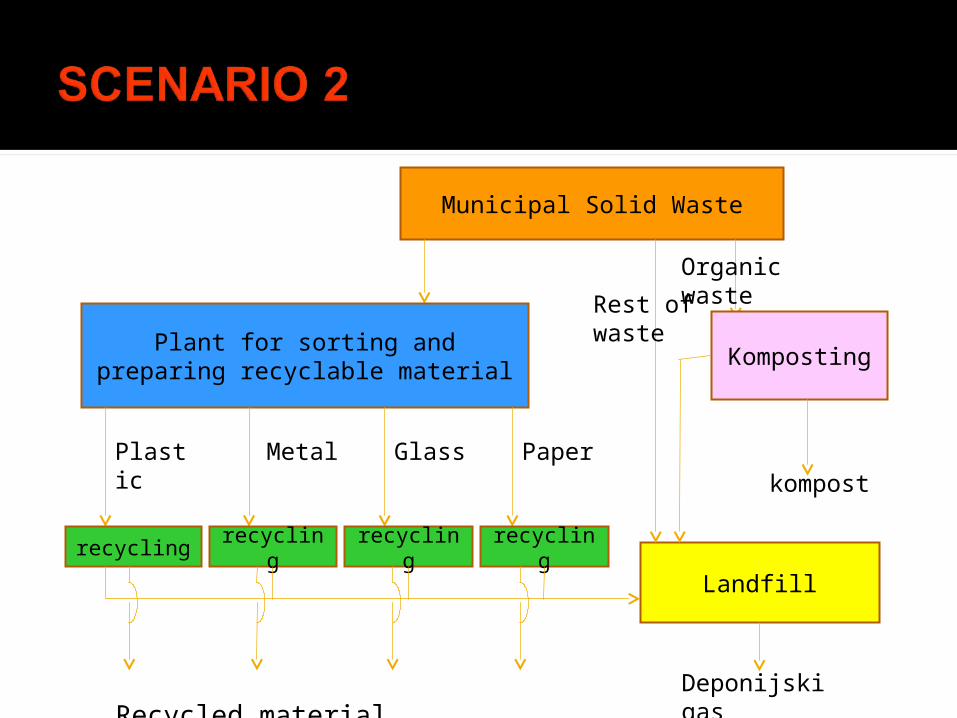
Municipal Solid Waste
Komposting
Organic waste
kompost
Plant for sorting and preparing recyclable material
Landfill
recycling recycling recycling
Plastic Metal Glass
Deponijski gas Recycled material
recycling
Paper
Rest of waste
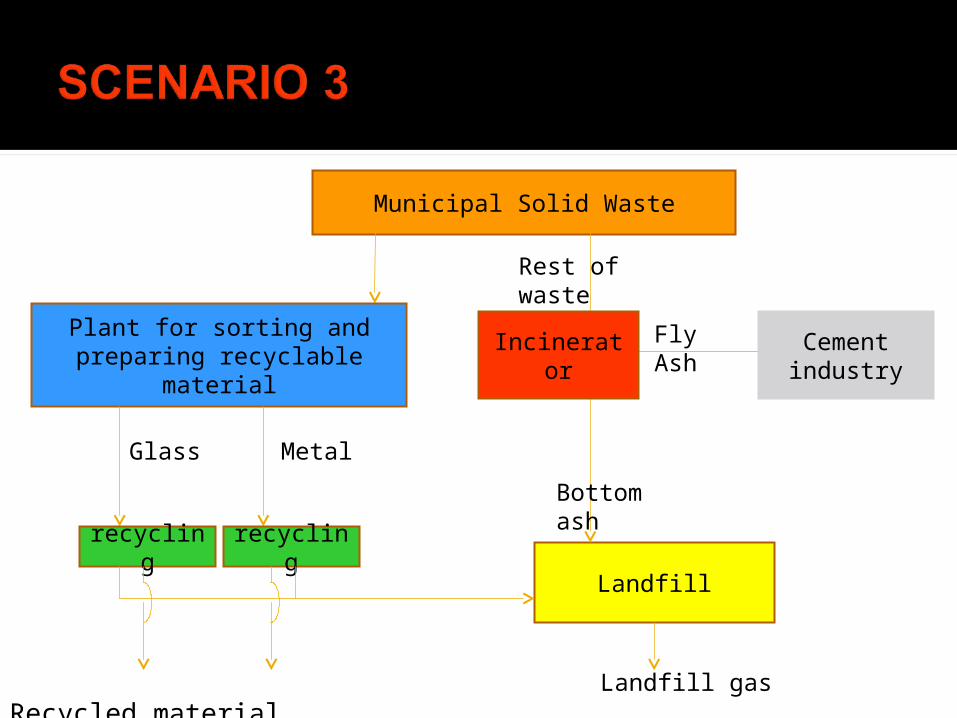
Municipal Solid Waste
Cement industry
Plant for sorting and preparing recyclable material
Landfill
recycling recycling
Glass Metal
Landfill gas Recycled material
Rest of waste
IncineratorFly Ash
Bottom ash
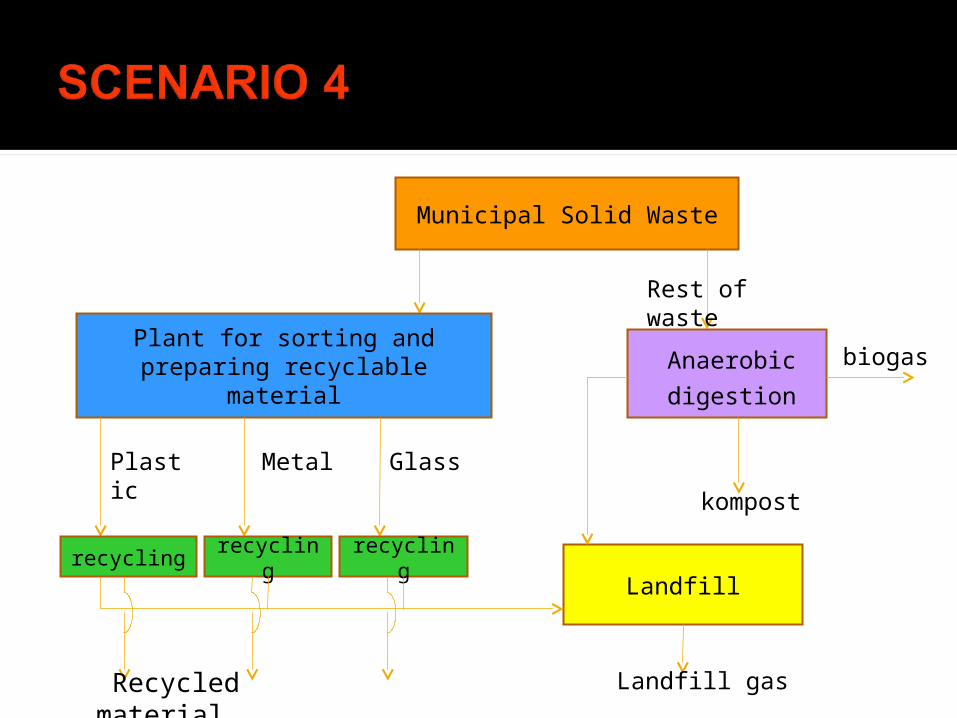
Municipal Solid Waste
Anaerobic
digestion
Rest of waste
kompost
Plant for sorting and preparing recyclable material
Landfillrecycling recycling recycling
Plastic Metal Glass
Landfill gas Recycled material
biogas
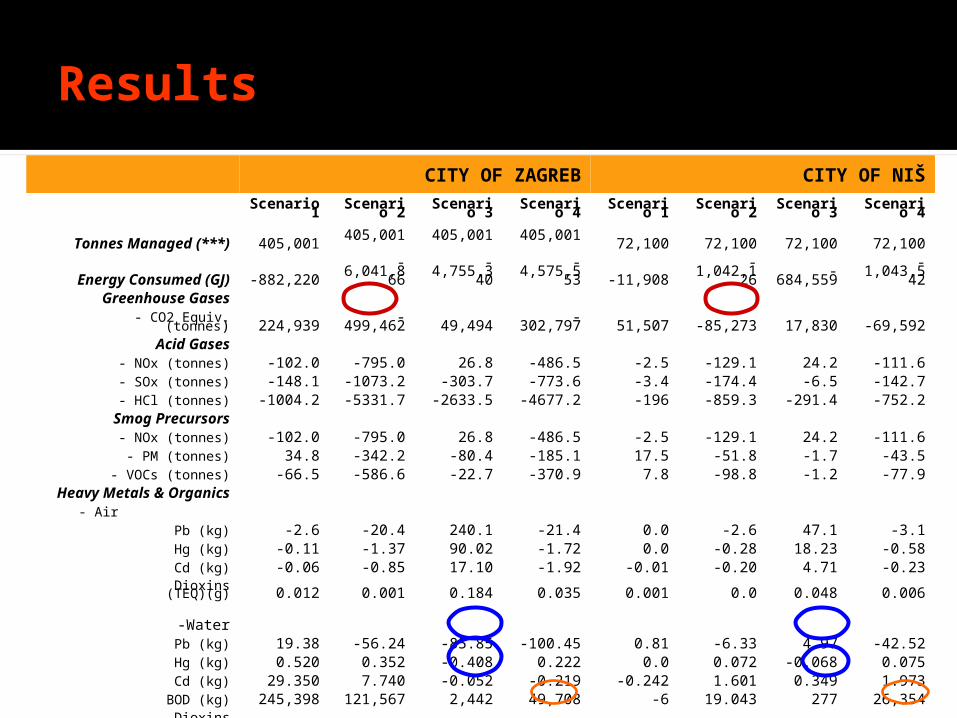
Results
CITY OF ZAGREB CITY OF NIŠ
Scenario 1 Scenario 2 Scenario 3 Scenario 4 Scenario 1 Scenario 2 Scenario 3 Scenario 4
Tonnes Managed (***) 405,001 405,001 405,001 405,001 72,100 72,100 72,100 72,100Energy Consumed (GJ) -882,220 -6,041,866 -4,755,340 -4,575,553 -11,908 -1,042,126 -684,559 -1,043,542
Greenhouse Gases - CO2 Equiv. (tonnes) 224,939 -499,462 49,494 -302,797 51,507 -85,273 17,830 -69,592
Acid Gases - NOx (tonnes) -102.0 -795.0 26.8 -486.5 -2.5 -129.1 24.2 -111.6 - SOx (tonnes) -148.1 -1073.2 -303.7 -773.6 -3.4 -174.4 -6.5 -142.7 - HCl (tonnes) -1004.2 -5331.7 -2633.5 -4677.2 -196 -859.3 -291.4 -752.2
Smog Precursors - NOx (tonnes) -102.0 -795.0 26.8 -486.5 -2.5 -129.1 24.2 -111.6 - PM (tonnes) 34.8 -342.2 -80.4 -185.1 17.5 -51.8 -1.7 -43.5
- VOCs (tonnes) -66.5 -586.6 -22.7 -370.9 7.8 -98.8 -1.2 -77.9Heavy Metals & Organics
- Air Pb (kg) -2.6 -20.4 240.1 -21.4 0.0 -2.6 47.1 -3.1 Hg (kg) -0.11 -1.37 90.02 -1.72 0.0 -0.28 18.23 -0.58 Cd (kg) -0.06 -0.85 17.10 -1.92 -0.01 -0.20 4.71 -0.23
Dioxins (TEQ)(g) 0.012 0.001 0.184 0.035 0.001 0.0 0.048 0.006
-Water Pb (kg) 19.38 -56.24 -85.85 -100.45 0.81 -6.33 4.97 -42.52 Hg (kg) 0.520 0.352 -0.408 0.222 0.0 0.072 -0.068 0.075 Cd (kg) 29.350 7.740 -0.052 -0.219 -0.242 1.601 0.349 1.973
BOD (kg) 245,398 121,567 2,442 49,708 -6 19.043 277 26,354 Dioxins (TEQ)(g) 0.00234 0.00068 0.00025 0.00010 0.0 0.00012 0.0004 0.00017
Residual Waste (tonnes) 355,981 71,266 38,920 17,600 68,652 13,977 6,853 3,100
The main findings of the study can be summarized as follows: :
Having in mind the plan of installing a waste recycling plant in Nis, scenario 2 would be most suitable to the set demands. As the minimal amount of waste for depositing is gained in scenario 4, this scenario is also of importance for Nis having in mind the capacity of the existing landfill.
Considering thermal treatment of MSW in Zagreb, the waste treated in scenario 3 will reduce the demand of energy from fossil fuel, but, if virgin material displacement credit is taken into account, i.e. complete net life cycle inventory, scenario 2 is the best, in terms of energy saved.
LCA is a very powerful tool for assessing the potential environmental impacts of different waste management strategies
The results demonstrate that, if the system is modeled in sufficient detail, LCA can identify not only the best scenario, but also the analytical contribution of single operations to the overall environmental performance of the system.
Results obtained from this study also support the conclusion that LCA, as an environmental tool, can be successfully applied in an Integrated Solid Waste Management System (ISWMS) as a decision support tool.
THANKS FOR THE ATTENTION!
Kolicina otpada koja se generise na teritoriji Srbije I Hrvatske kao I njiegov sastav je prilicno slican. U odnosu na zemlje Evropske Unije kolicina otpada u obe drzave po glavi stanovnika se nalazi na donjoj granici. Od ukupne kolicine otpada najveci deo se deponuje, dok se svega oko 5% reciklira. Obe drzave su u potrazi za savremenim modelima upravljanja otpadom imajuci u vidu odrzivi razvoj i bast available technologies.
LCA is a very powerful tool for assessing the potential environmental impacts of different waste management strategies.
U radu su prikazana cetiri alternativna scenarija for the MSW management of the city of Zagrab and city of Nis. Prikazani rezultati demonstrate that, if the system is modelled in sufficient detail, LCA can identify not only the best scenario, but also the analytical contribution of single operations to the overall environmental performance of the system.
In accordance with the results obtained from this study, scenario 2 ima najmanji uticaj na zivotnu sredinu, dok je scenario 3 is the most environmentally sound option, in terms of water pollution. The minimum amount of final MSW disposed was obtained from scenario 4
Considering thermal treatment of MSW in Zagreb, the waste treated in scenario 3 will reduce the demand of energy from fossil fuel, but, if we take into account virgin material displacement credit, i.e. complete net life cycle inventory, scenario 2 is the best, in terms of energy saved.
Imajuci u vidu plan da se u Nisu instalira postrojenje za reciklazu otpada, scenario 2 najvise odgovara postavljenim zahtevima. Takodje I scenario 4 u kome se generise najmanja kolicina otpada moze biti od znacaja za Nis imajuci u vidu kapacitet postojec deponije.
Results obtained from this study also support the conclusion that LCA, as an environmental tool, can be successfully applied in an Integrated Solid Waste Management System (ISWMS) as a decision support tool.