Embed Size (px)
Citation preview

Patch loading resistance of girders with corrugated webs
PhD Dissertation
Balázs KÖVESDI Budapest University of Technology and Economics
Supervisors:
László DUNAI, DSc
Professor
Budapest University of Technology and Economics, Hungary
Ulrike KUHLMANN, Prof. Dr. -Ing. Professor
University of Stuttgart, Germany
Budapest, 2010.

II
Abstract The corrugated steel plate is a widely used structural element in many fields of application
because of its favourable properties. From the 1990's it has been increasingly used as web of
steel and composite bridges. When such a bridge is incrementally launched, buckling of the
thin steel web may occur. During launching nearly all cross-sections come at least once over a
support where a concentrated reaction force is introduced and hereby buckling problems may
arise. Bearing stiffeners give no solutions in case of moving, therefore it is necessary to
determine the patch loading resistance of the corrugated webs under partial compressive patch
loading, what is the topic of the thesis.
On the basis of previous experiments and numerical investigations found in the literature a
numerical model is developed. On this model failure mode and ultimate load is determined by
geometrical and material nonlinear analysis using geometric imperfections. Model
verification is executed by the comparison of the experimental and numerical resistances and
failure modes. In the frame of a numerical parametric study the geometric parameters which
have influence on the patch loading resistance and on the structural behaviour are analysed,
tendencies are determined. Existing design formulas from literature are summarised from the
point of view of bridges and enhanced by Braun and Kuhlmann based on the numerical
results.
Experimental program on 12 large scale test specimens are designed and tested at the
Department of Structural Engineering of the Budapest University of Technology and
Economics to analyze the structural behaviour and ultimate loads under patch loading. The
aim of the experiments is the determination of the patch loading resistance by different
geometrical arrangements, loading lengths and loading positions. Different failure modes and
structural behaviours are analyzed and described in the function of the investigated
parameters. Based on the test results the design method developed by Braun and Kuhlmann is
studied and modified.
Based on the experimental program suggestions for the consideration of the equivalent
geometric imperfection in the FEM based design method are collected. The applied equivalent
geometric imperfection has a major importance in the FEM based design and there are no
recommendations in the current version of the Eurocode 3 for corrugated web girders. In the
completed research work different applicable equivalent geometric imperfection shapes are
investigated and appropriate scaling factors are developed.
Eccentricities of the patch load with respect to the middle plane of the web are unavoidable
during the bridge launching process, therefore the influence of the eccentricities on the patch
loading resistance of corrugated web girders is investigated in this thesis. Based on the
numerical calculations and based on the own experiments, conclusions for girders with
trapezoidal corrugated webs are summarized and design recommendations are proposed
concerning bridge launching in case of eccentric patch loading.
During launching of a bridge structure a parallel shear and transverse force are acting on the
corrugated web in the same cross section, what should be considered in the design. The
interaction behaviour of steel girders subjected to combination of shear and patch loading was
studied only scarcely by researchers in the past and there are no standard design interaction
equation in the current version of the Eurocode 3. In the frame of a numerical parametric
study typical corrugation profiles, different loading lengths and a larger range of web and fold
ratios are investigated. The influence of each investigated parameters are studied, tendencies
are determined and a design interaction equation is proposed.

III
Acknowledgement
The research work is completed under the partial financial support of the following projects,
foundations and cooperations:
- cooperation between the Budapest University of Technology and Economics
(BME), Hungary and the University of Stuttgart, Germany,
- FOSTA Project No. P 645, German Research Association for Steel Application,
Germany,
- OTKA - T049305 project, Hungarian National Scientific Research Foundation,
Hungary,
- “Research scholarship for PhD students and young researchers”, founded by the
German Academic Exchange Service DAAD,
- the test specimens were spondored by RUTIN Kft and by Pont-TERV Rt,
which are gratefully acknowledged.
I would like to express my special thanks to my supervisors: Prof. László Dunai (Budapest
University of Technology and Economics, BME, Department of Structural Engineering) and
Prof. Ulrike Kuhlmann (University of Stuttgart, Institute of Structural Design) who
supervised and supported me to improve the presented research work. I would like to thank
their help which covered not only the professional help, but personal advices.
I would like to thank László Kaltenbach, Dr. Miklós Kálló and Mansour Kachichian
(Structural Laboratory, BME) and all of the laboratory staff for helping me to perform the
experimental part of the presented research. They gave me a special experience in the
laboratory work what highly developed my researcher aspect.
I would like to give special thanks to Benjamin Braun (University of Stuttgart, Institute of
Structural Design) who supported my research work with practical advices and helped in
several ways and always turned a ready ear to my question.
I would like to thank all kind of help and support to the members of the Department of
Structural Engineering of the Budapest University of Technology and Economics, where I
spend most of my PhD years.
Thanks are also to the members of the Institute of Structural Design of the University of
Stuttgart who helped my integration in the university life in Stuttgart, and who secured me a
friendly environment during my study stay in Germany.
Special thanks are also to my family who has emotionally supported me to execute the
presented research.

IV
Abstract
Acknowledgement
1. Introduction .......................................................................................................................... 1
1.1. Background of the research ...................................................................................... 1
1.2. Motivation of the research ........................................................................................ 2
1.2.1. Determination of the patch loading resistance of girders with trapezoidally
corrugated webs ................................................................................................ 2
1.2.2. Determination of the eccentric patch loading resistance of girders with
trapezoidally corrugated webs .......................................................................... 3
1.2.3. Interaction of shear and transverse forces ........................................................ 3
1.3. Solution strategy ........................................................................................................ 4
2. Determination of the patch loading resistance under centric loading .................................... 5
2.1. General ....................................................................................................................... 5
2.2. Review of previous investigations ............................................................................. 5
2.2.1. Experimental and numerical investigations ...................................................... 5
2.2.2. Theoretical investigations ................................................................................. 6
2.2.3. Summary of previous investigations and research aims ................................... 7
2.3. Verification of the numerical model .......................................................................... 8
2.3.1. Geometrical model ............................................................................................ 8
2.3.2. Material model .................................................................................................. 9
2.3.3. Imperfections .................................................................................................... 9
2.3.4. Analysis and calculation results ........................................................................ 11
2.4. Numerical parametric study ....................................................................................... 13
2.4.1. Structural behaviour .......................................................................................... 13
2.4.2. Effect of the loading length ............................................................................... 14
2.4.3. Effect of the local and global slenderness ......................................................... 16
2.4.4. Effect of the corrugation angle .......................................................................... 16
2.4.5. Effect of the flange size .................................................................................... 17
2.5. Design method development ...................................................................................... 18
2.5.1. Evaluation of the previous design methods ...................................................... 18
2.5.2. Design method of Braun and Kuhlmann ........................................................... 19
2.6. Summary and conclusion ........................................................................................... 22
3. Experimental investigations ................................................................................................... 23
3.1. Aim of the tests .......................................................................................................... 23
3.2. Test program .............................................................................................................. 23
3.2.1. Test specimens and test arrangement ................................................................ 23
3.2.2. Measurement system ......................................................................................... 25
3.3. Experimental program and test results ....................................................................... 25
3.4. Verification of the developed design method ............................................................ 31
3.5. Summary .................................................................................................................... 33
4. Development of FEM based design method for patch loading of corrugated web girders ... 35
4.1. General ....................................................................................................................... 35
4.2. Numerical model development and structural behaviour .......................................... 35
4.3. Analysis and development of equivalent geometric imperfection shapes ................. 40
4.3.1. Investigated imperfection shapes ...................................................................... 40
V
4.3.2. Development of a modified imperfection shape ............................................... 41
4.4. Analysis and development of equivalent geometric imperfection magnitudes ......... 44
4.4.1. Imperfection sensitivity analysis ....................................................................... 44
4.4.2. Determination of the necessary imperfection magnitudes ................................ 45
4.4.3. Evaluations of the ultimate shape imperfection ................................................ 45
4.5. Application of the results ........................................................................................... 46
4.6. Summary .................................................................................................................... 47
5. Patch loading resistance considering the loading width and eccentricities............................. 48
5.1. General ....................................................................................................................... 48
5.2. Review of previous investigations and research aims ............................................... 48
5.3. Numerical modelling and structural behaviour .......................................................... 50
5.4. Resistance reduction due to loading width ................................................................ 52
5.4.1. Numerical parametric study .............................................................................. 52
5.4.2. Design method development ............................................................................. 57
5.5. Resistance reduction due to loading eccentricity ....................................................... 61
5.5.1. Numerical parametric study .............................................................................. 61
5.5.2. Design method development ............................................................................. 65
5.6. Application of the results ........................................................................................... 67
5.7. Summary .................................................................................................................... 67
6. Determination of partial factor to the developed design methods ......................................... 69
6.1. General ....................................................................................................................... 69
6.2. Review of different determination methods of the partial factor ............................... 69
6.2.1. Determination methods according to EC1990 Annex D .................................. 69
6.2.2. Modification of the standardized determination method .................................. 71
6.2.3. Evaluation of the literature overview ...................................…......................... 72
6.3. Determination of partial factor of the model uncertainties - γRd**
............................. 73
6.3.1. Background databases for the statistical evaluation ......................................... 73
6.3.2. Statistical determination using the single property method .............................. 74
6.3.3. Statistical determination using the resistance model method ........................... 77
6.3.4. Comparison and evaluation of the results ......................................................... 81
6.4. Determination of partial factor of the material properties - γm .................................. 82
6.5. Determination of the partial factor - γM1** ............................................................... 84
6.6. Summary .................................................................................................................... 85
7. Interaction between shear force and patch loading ................................................................ 86
7.1. General ....................................................................................................................... 86
7.2. Review of previous investigations ............................................................................. 86
7.2.1. General .............................................................................................................. 86
7.2.2. Previous investigations on flat web girders ...................................................... 86
7.2.3. Previous investigations on corrugated web girders .......................................... 88
7.2.4. Evaluation of the previous investigations and research aims ........................... 88
7.3. Numerical investigations ........................................................................................... 89
7.3.1. General ............................................................................................................. 89
7.3.2. Numerical model development and model verification ................................... 89
7.3.3. Structural behaviour ......................................................................................... 91
7.3.4. Evaluation of the results and development of interaction curves .................... 92
7.3.5. Influence of the analyzed parameters .............................................................. 94

VI
7.4. Statistical evaluation of the proposed interaction curve ........................................... 97
7.5. Conclusions ............................................................................................................... 99
8. Summary and conclusions .................................................................................................... 100
8.1. New scientific results ................................................................................................ 100
8.1.1. The theses of the dissertation in English ..........................................................100
8.1.2. The theses of the dissertation in Hungarian ..................................................... 102
8.2. Publications on the subject of the thesis ................................................................... 104
8.3. Proposal for further studies ....................................................................................... 106
References ................................................................................................................................... 107

1
1. Introduction
1.1. Background of the research
The corrugated steel plate has been used in many fields of application for a long time because
of its favourable properties. For example in the field of structural engineering it is used as
sheet-pile wall or girder web in building structures, in the field of building design it is used
for façades or roof structures, and it is a basic component of composite floors. For the last 20
years it has been increasingly used as a beam web. This structural layout has spread in the
field of bridges, too, especially in hybrid bridges. This is a special bridge type with concrete
decks and steel webs, mostly with corrugated steel webs.
A schematic drawing of this bridge type can be seen in Fig. 1. The first hybrid bridge with
trapezoidally corrugated webs was built in France in 1986 (Pont de Cognac bridge). Because
of the great number of advantages this structural layout spread very fast especially in Japan,
where numerous hybrid bridges have been built or are still under construction.
Figure 1: Corrugated steel web bridges, from [1].
Due to the features of corrugation, the application of corrugated steel webs leads to
advantages for hybrid bridge structures. The web has a small stiffness in longitudinal
direction, therefore the prestressing force remains in the concrete chords. The resistance
against buckling – locally and globally – rises, so the number of stiffeners or diaphragms may
be reduced significantly. In comparison to flat webs there is a high bending stiffness in
transverse direction, which allows reducing the number of cross frames in box girder bridges.
Due to the increased stiffness the web thickness may be reduced, therefore the dead load of
the structure may be smaller leading to easier and faster building processes especially in case
of incremental launching. An another advantage is that the concreting difficulty of thin
reinforced concrete webs disappears, which also results in a faster and easier building process.
The Altwipfergrund-Viaduct in Germany has the same structural layout. The building process
of the bridge was finished in 2002. The lateral view can be seen in Fig. 2. This is a three-span-
bridge, which spans are on the north bridge 81.47 m + 115 m + 81.35 m = 277.32 m, and on
the south bridge 84.55 m + 115.00 m + 80.52 m = 280.00 m [2]. The cross section is a hybrid
box girder with corrugated steel webs. The University of Stuttgart had a FOSTA Research
Project No. P 645 [3] which was dealing with the structural behaviour of this new type of
bridge structure. In one part of this research project the patch loading resistance of girders
with corrugated webs was investigated in detail.
The current research started in the frame of this FOSTA Research Project and further
continued in the cooperation between the Institute of Structural Design of the University of
Stuttgart and the Department of Structural Engineering of the Budapest University of
Technology and Economics. In the current PhD thesis only my part of the research
cooperation is presented and results of my own research activities are referred. More
informations are given in Section 2.5.2 where some research details which are not part of my

2
own work and those which are absolutely necessary to understand the research steps, are
clearly separated.
Figure 2: Lateral view of the Altwipfergrund-Viaduct, from [2].
1.2. Motivation of the research
1.2.1. Determination of the patch loading resistance of girders with trapezoidally
corrugated webs
From the modern bridge erection methods the incremental launching technique is one of the
most competitive. This building process, however, involves a problem with buckling of the
thin steel web under patch loading. During launching nearly all cross-sections come at least
once over a support where a concentrated reaction force is introduced and hereby buckling
problems may arise. Bearing stiffeners give no solutions in case of moving, therefore it is
necessary to determine the patch loading resistance of the corrugated webs under partial
compressive patch loading.
Figure 3: Incremental launching of a corrugated web bridge, from [1].
When launching a bridge the buckling stability due to patch loading is a decisive situation to
be considered. There are no rules provided however for patch loading of corrugated web
girders in the EN1993-1-5 Annex D [4]. In the literature there are only a few investigations
dealing with the patch loading resistance of girders with corrugated webs. The existing
experimental, analytical and numerical investigations were analysed from the point of view of
bridge constructions. Investigations up to now focused on typical building structures, where
the web slenderness is high and the loading length is short. These investigations are extended
on typical bridge structures in the current PhD thesis.
On the basis of previous experimental results available from literature a numerical model is
developed. In the frame of numerous numerical simulations by finite element method (FEM)
the structural behaviour of corrugated web girders under patch loading is analysed and the
influence of the geometric parameters on the load bearing capacity are determined. Existing
design methods from literature were studied and compared to the previous experimental and
current numerical results. The applicability of different design models were analysed and the
design method of Kähönen [5] showed the best approach in case of typical bridge structures.
On the basis of my numerical calculations the design method of Kähönen is further developed
and modified by Braun and Kuhlmann [3]. To justify this modified design method laboratory
experiments are performed on 12 steel I-girders at the Budapest University of Technology and
corrugated web
concrete deck
3
Economics, Department of Structural Design. The previously proposed design method is
modified and verified by these test results and by further numerical calculations.
Based on the executed tests recommendations are formulated for a finite element simulation
based design method. The aim of the finite element calculations is the direct determination of
the design value of the patch loading resistance. In case of design methods based on finite
element analysis the consideration of the equivalent geometric imperfection has a major
importance. There are no standardized imperfection shapes and scaling factors for corrugated
webs. Therefore in the frame of this PhD thesis applicable imperfection shapes and scaling
factors are determined for patch loading resistance calculation of corrugated web girders.
1.2.2. Determination of the eccentric patch loading resistance of girders with
trapezoidally corrugated webs
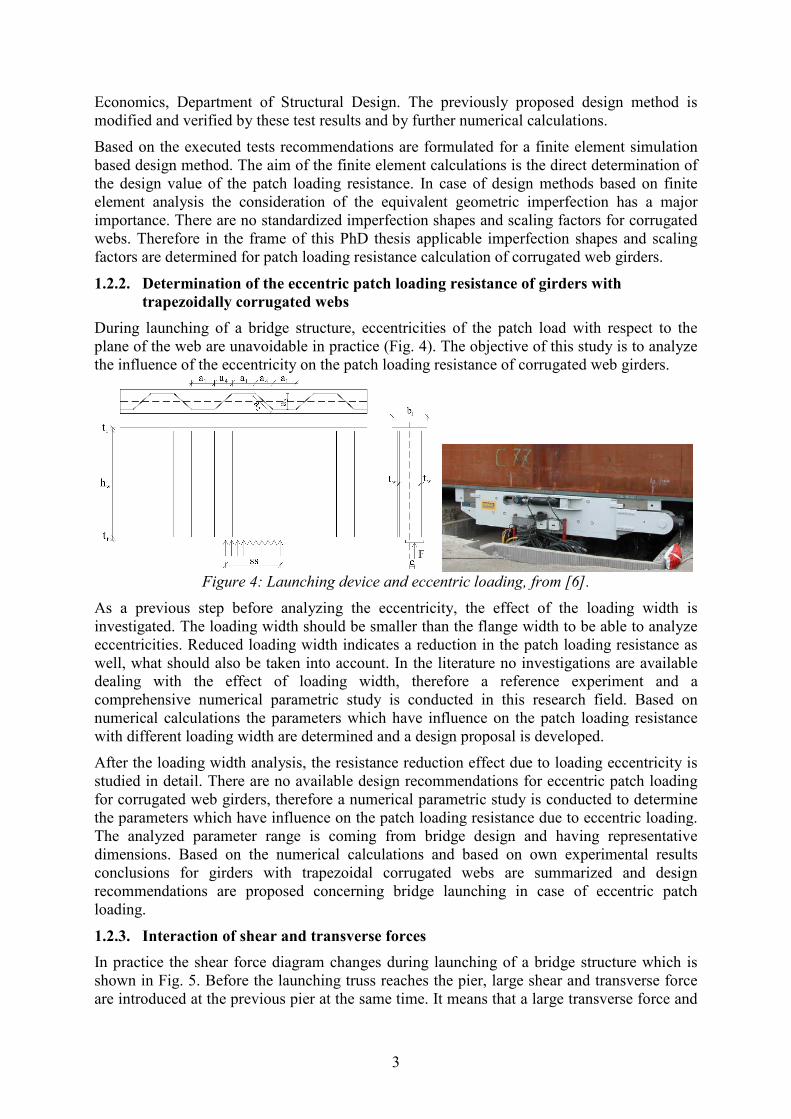
During launching of a bridge structure, eccentricities of the patch load with respect to the
plane of the web are unavoidable in practice (Fig. 4). The objective of this study is to analyze
the influence of the eccentricity on the patch loading resistance of corrugated web girders.
Figure 4: Launching device and eccentric loading, from [6].
As a previous step before analyzing the eccentricity, the effect of the loading width is
investigated. The loading width should be smaller than the flange width to be able to analyze
eccentricities. Reduced loading width indicates a reduction in the patch loading resistance as
well, what should also be taken into account. In the literature no investigations are available
dealing with the effect of loading width, therefore a reference experiment and a
comprehensive numerical parametric study is conducted in this research field. Based on
numerical calculations the parameters which have influence on the patch loading resistance
with different loading width are determined and a design proposal is developed.
After the loading width analysis, the resistance reduction effect due to loading eccentricity is
studied in detail. There are no available design recommendations for eccentric patch loading
for corrugated web girders, therefore a numerical parametric study is conducted to determine
the parameters which have influence on the patch loading resistance due to eccentric loading.
The analyzed parameter range is coming from bridge design and having representative
dimensions. Based on the numerical calculations and based on own experimental results
conclusions for girders with trapezoidal corrugated webs are summarized and design
recommendations are proposed concerning bridge launching in case of eccentric patch
loading.
1.2.3. Interaction of shear and transverse forces
In practice the shear force diagram changes during launching of a bridge structure which is
shown in Fig. 5. Before the launching truss reaches the pier, large shear and transverse force
are introduced at the previous pier at the same time. It means that a large transverse force and

4
a large shear force are acting on the corrugated web in the same cross section, what should be
considered in the design.
Figure 5: Shear force diagrams during launching, from [7].
In case of bridges, which are typically built with large web depths, the main part of the shear
resistance comes from the contribution of the web. Bridges erected by incremental launching
process have mostly thick webs and the applied loading length at the launching device is
usually long. Therefore the main part of the patch loading resistance comes also from the web
contribution. For corrugated web girders it is especially true, because due to the corrugation
profile the lateral stiffness of the web increases which leads to the increase of the shear and
patch loading resistance as well. It means that a larger part of the resistance comes from the
web contribution. Due to the enlarged role of the web in both resistances, the interaction of
shear and transverse forces is extensively investigated.
The interaction behaviour of steel girders subjected to combination of shear and transverse
force was studied only scarcely by researchers in the past. Even for flat web girders there are
only a limited number of investigations conducted in this topic till now and there is no
standard design interaction formula in the current version of the EN1993-1-5 [4] neither for
flat web nor for corrugated web girders. There is only one available investigation in the
literature dealing with the interaction of transverse and shear force of corrugated web girders.
No experiments on corrugated webs are conducted to analyze this effect and only some
numerical calculations are available dealing with a relative small parameter range.
In the framework of a numerical parametric study the analyzed parameter range is extended
for the typical bridge geometries. Typical corrugation profiles, longer loading lengths, and a
larger range of web and fold ratios are investigated. Numerical parametric study is conducted
to analyze the influence of each investigated parameters and tendencies are determined. Based
on the numerical calculations design interaction equation is also developed.
1.3. Solution strategy
The aim of the research is fulfilled by the above listed general solution steps at each particular
topic:
- literature overview,
- evaluation of the previous investigations and problem statement,
- numerical model development and model accuracy verification based on
experiments,
- analysis of the structural behaviour,
- virtual experiments, extending the real experimental results if available,
- numerical parametric study to analyse the parameters which have influence on the
load bearing capacity,
- development of design method proposals based on numerical and experimental
results.

5
2. Determination of the patch loading resistance under centric
loading
2.1. General
Patch loading of corrugated steel web girders is a research field where only a few
investigations are conducted till now, however the local buckling of the thin steel web can
occur under patch load during incremental launching. There is no standard design method in
order to determine the patch loading resistance of corrugated web girders and only a few
research recommendations can be found in the literature. A comprehensive study is executed
in the frame of the current PhD thesis in this topic which is detailed in this chapter. The
parameters which are used in the followings are noted in Fig. 6.
Figure 6: Used notations for trapezoidally corrugated girders.
2.2. Review of previous investigations
2.2.1. Experimental and numerical investigations
Experimental research on the patch loading resistance of girders with trapezoidally corrugated
webs started in 1987 by Leiva-Aravena and Edlund [8]. A total of six specimens were tested
in Sweden. Three parameters, namely the patch load width, the load location and the web
thickness, were considered. The load was applied across the total width of the flange, as a 50
mm wide patch or as a line load at three different locations, namely, over a parallel or inclined
fold, or at the fold line. Three different beam depths were analyzed in the frame of the
experimental investigations. In 1988, Kähönen made six tests on different I-girders, where the
web crippling was analysed under patch loading [5]. The influence of web thickness, web
depth and span were examined. In all experiments, the girder was preloaded with two
independent concentrated loads, covering the additional shear stress and bending moment for
the structure. Based on the experiments Kähönen made the conclusion that the difference
between girders with corrugated webs and traditional I-beams is not only in the patch loading
resistance, but these I-beams have a special character, which is called by him as „snap-
through-phenomenon”. Its essence is that the failure of the girder appears very quickly after
reaching the ultimate load. Elgaaly and Seshadri made five tests in 1997 [9]. The tests were
performed on a simply supported beam by varying the position of the applied load. All tests
focused on typical building structures, where the load is transferred from the purlins to the
roof girder, and therefore the loading length is usually very short. In all cases, the failure was
due to vertical bending of the flange and crippling of the web under the load. The vertical
bending of the flange, when the load was applied over a parallel fold, was accompanied by
twisting.

6
Numerical investigations were made by Elgaaly and Seshadri based on their experiments [9]
and a finite element model was developed to analyse the patch loading failure. The finite
element model was used thereafter to conduct parametric studies to examine the influence of
the thickness and yield strength of the flange and web, the width and location of the applied
load, the web panel aspect ratio, and the corrugation profile on the behaviour. Ultimate
strength of girders with corrugated webs are determined and investigated under in plane
compressive patch loading.
Further numerical investigations were conducted by Luo and Edlund in 1996 [10]. The
ultimate strength of steel plate girders with trapezoidally corrugated webs under patch loading
was studied using non-linear finite element analysis. The following factors were investigated:
elasto-plastic strain-hardening material models; initial imperfections (global and local);
variation of yield stress and strain-hardening degree at the corrugation corners due to cold-
forming („corner effect”); loading position; load distribution length; variation of geometric
parameters.
2.2.2. Theoretical investigations
Based on the experimental and numerical investigations design models were already
developed and are available in the literature. The first design model for patch loading
resistance of girders with corrugated webs was recommended by Kähönen in 1988 [5]. This
design formula is based on the four plastic hinge failure mechanism (Fig. 7) developed by
Rockey and Roberts for flat web girders [11].
Figure 7: Flange mechanism under patch loading failure, from [5].
The resistance calculation method of Rockey and Roberts according to Eq. (1) can be
subdivided into two parts, the first is the contribution of the flange, and the second is the
contribution of the web [11].
)(4 . fsstfftMF wywywwfplR +⋅⋅+⋅⋅⋅= (1)
where: Mpl.f plastic moment resistance calculated from the flange plate by Eq. (2),
yf
ff
fpl ftb
M ⋅⋅
=4
2
. , (2)
fyf yield stress of the flange,
fyw yield stress of the web,
tw web thickness,
tf flange thickness,
ss loading length,
f deflected shape length next to the applied load.
Kähönen modified this formula for corrugated web girders. The design method is calibrated to
the experimental results with several factors. To include the possible interaction of bending
moment and shear force and supplemented the formula with a third part, concerning the
influence of the normal force in the flange plates.
Elgaaly and Seshadri also developed a design method on the basis of their experimental and
numerical investigations [9]. Two distinct failure modes were observed, web crippling and

7
web yielding for which separate equations were proposed. The ultimate load for web crippling
consists of two components. One represents the contribution of the flange which can be
determined from the flange collapse mechanism, and the other represents the contribution
from the web, which can be calculated on the basis of an empirical equation developed for flat
web girders. The ultimate load of web yielding can be calculated based on yielding of the
web. The smaller of the two calculated resistances is governing.
In 1996, Luo and Edlund [10] proposed an empirical design formula based on a simple design
model for flat webs. According to their investigations the most influential parameters are the
loading length and the corrugation angle. Recommendations for the influence of those
parameters were developed, and they were taken into account in the resistance formula.
The EN1993-1-5 Annex D [4] deals with members with corrugated webs, but there is no
standard design method for patch loading of girders with trapezoidally corrugated webs.
2.2.3. Summary of previous investigations and research aims
The parameter range of the previously executed tests and numerical calculations is shown in
Fig. 8, depending on the loading length and web panel ratio. The grey area illustrates the
considered parameter range used in bridges. The majority of the executed experiments until
now deal with very short loading lengths where the loads are applied only along one fold. For
bridges, built with incremental launching process, the launching device at the pier
corresponds to the location of load introduction and its length is usually not limited to one
fold, but it can be significantly longer. By the up to now built bridges the loading length
varies in general between 40-80% of the web depth (ss/hw = 0.4 to 0.8).
0
0.2
0.4
0.6
0.8
1
0 200 400 600 800 1000 1200h w /t w [-]
ss/h
w [
-]
Leiva-Aravena and Edlund [8]Kähönen [5]Elgaaly and Seshadri [9]fdfxcxcElgaaly and Seshadri [9]Lou and Edlund [10]
typical parameter range
for bridges
Experimental investigations
Numerical investigations
Figure 8: Parameter range of experimental and numerical investigations.
The other important difference is that in most of the tests the global web ratio (hw/tw) was
higher than usually used in bridges. In bridges with trapezoidally corrugated webs this ratio is
typically between hw/tw=250 - 500. Figure 8 shows that most of the executed tests are far from
this typical parameter range, therefore an extended analysis is executed in the framework of a
numerical parametric study and a numerical database is developed for patch loading
resistance of girders with trapezoidally corrugated webs covering a large parameter range.
Structural behaviour is analysed and all geometric parameters having influence on the patch
loading resistance are determined and tendencies are clarified. All the previous theoretical
investigations are based on limited number of test results or numerical calculations. The
applicability of the previously developed design methods are studied and evaluated for bridge
design. Based on the numerical database developed in this thesis, influences of all geometric
parameters are established and tendencies are implemented in the design method developed
by Braun and Kuhlmann [3], [12].
8
2.3. Verification of the numerical model
2.3.1. Geometrical model
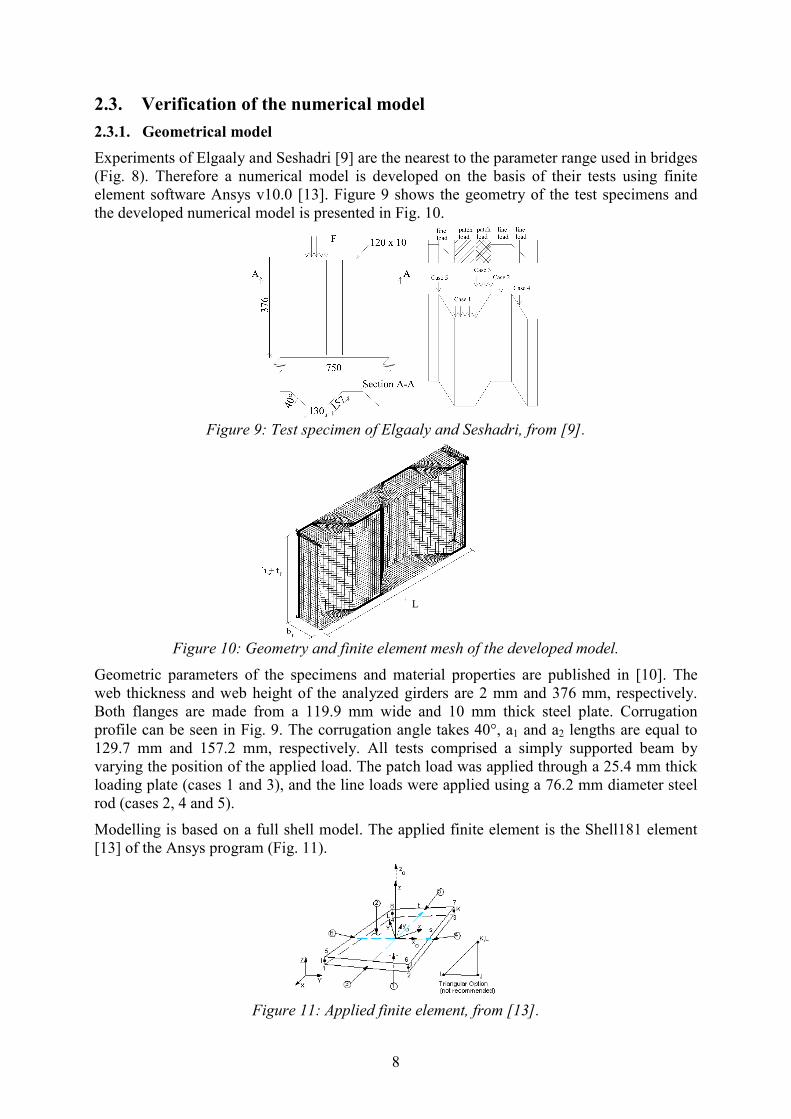
Experiments of Elgaaly and Seshadri [9] are the nearest to the parameter range used in bridges
(Fig. 8). Therefore a numerical model is developed on the basis of their tests using finite
element software Ansys v10.0 [13]. Figure 9 shows the geometry of the test specimens and
the developed numerical model is presented in Fig. 10.
Figure 9: Test specimen of Elgaaly and Seshadri, from [9].
Figure 10: Geometry and finite element mesh of the developed model.
Geometric parameters of the specimens and material properties are published in [10]. The
web thickness and web height of the analyzed girders are 2 mm and 376 mm, respectively.
Both flanges are made from a 119.9 mm wide and 10 mm thick steel plate. Corrugation
profile can be seen in Fig. 9. The corrugation angle takes 40°, a1 and a2 lengths are equal to
129.7 mm and 157.2 mm, respectively. All tests comprised a simply supported beam by
varying the position of the applied load. The patch load was applied through a 25.4 mm thick
loading plate (cases 1 and 3), and the line loads were applied using a 76.2 mm diameter steel
rod (cases 2, 4 and 5).
Modelling is based on a full shell model. The applied finite element is the Shell181 element
[13] of the Ansys program (Fig. 11).
Figure 11: Applied finite element, from [13].
L

9
It is a four-node thin shell element, which has 6 degrees of freedom at each node, translations
in the nodal x, y, and z directions and rotations about the nodal x, y, and z-axis. This element
has both bending and membrane capabilities, so both in-plane and normal loads are permitted.
Large strain and large deflection capabilities are also included. Well-suited for linear or
nonlinear applications, geometrical and material nonlinearities can be also taken into
consideration.
2.3.2. Material model
The applied material model is linear elastic - hardening plastic using multilinear isotropic
hardening rule with von Mises yield criterion. The material is assumed to behave linear-
elastic until reaching the yield strength by a Young’s modulus of 210000 MPa. After it the
material is assumed to follow linear hardening with a reduced hardening modulus Er equal to
0.01·E=210 MPa. The material is modelled perfectly plastic when it reaches the ultimate
strength. In the experiments of Elgaaly the yield and the ultimate strengths of the flange
material were provided by the girder manufacturer, and they are 389 MPa and 563 MPa,
respectively. The yield and ultimate stresses of the web were determined from test coupons to
be 379 MPa and 413 MPa, respectively. The measured material properties are used for the
model verification, and for the numerical parametric studies standard steel grades are used
(S235, S355) with the characteristic values of the yield and ultimate strengths.
σ
ε Figure 12: Linear elastic - hardening plastic material model.
2.3.3. Imperfections
For the nonlinear simulations global and local geometric imperfections are used, and the
material nonlinearities are taken also into consideration. EC3 permits to use standard
geometric imperfection patterns or eigenmode imperfections from a bifurcation analysis. Both
imperfection types are used for the model verification. As global equivalent imperfection a
sinusoidal curved shape over the web height is applied. The magnitude of this imperfection is
hw/200 for welded structures with a double symmetrical cross-section according to
EN1993-1-5 [4]. This imperfection type is presented in Fig. 13.
Figure 13: Global imperfection form.
10
In the bifurcation analysis no global eigenmode is found in the first 150 eigenmodes for the
most of the models. Therefore as global imperfection only standard geometric imperfection
pattern (Fig. 13) is applied.
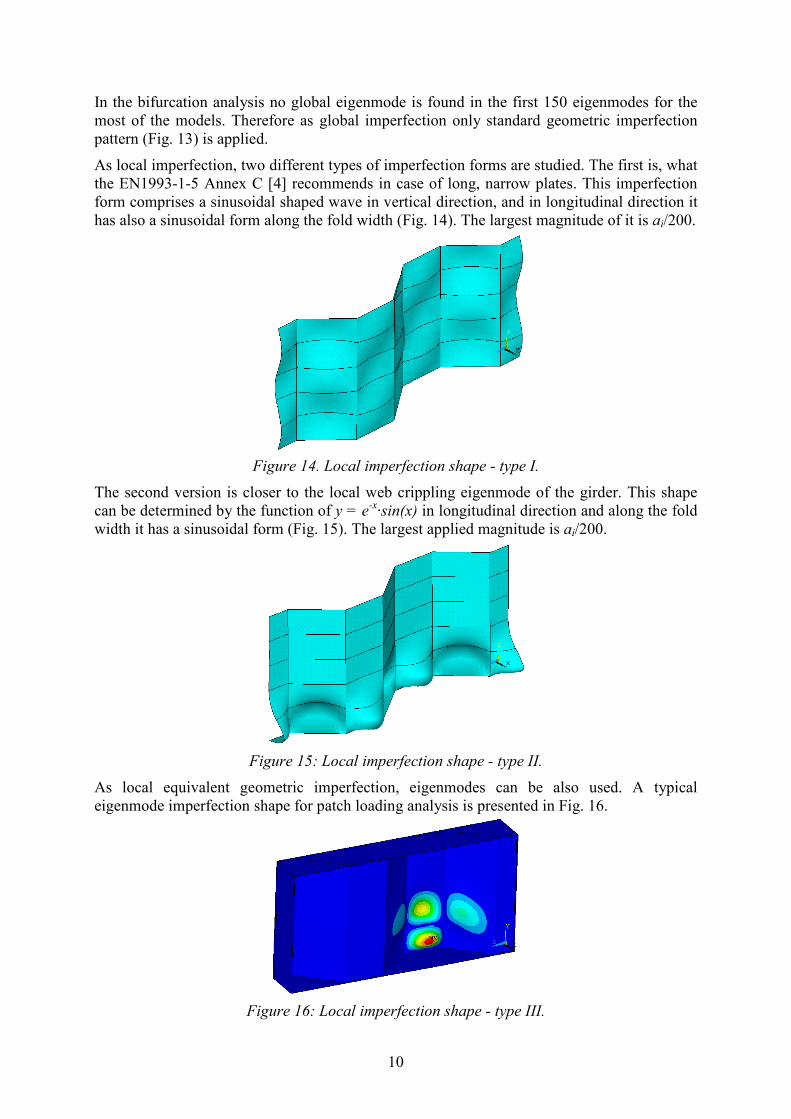
As local imperfection, two different types of imperfection forms are studied. The first is, what
the EN1993-1-5 Annex C [4] recommends in case of long, narrow plates. This imperfection
form comprises a sinusoidal shaped wave in vertical direction, and in longitudinal direction it
has also a sinusoidal form along the fold width (Fig. 14). The largest magnitude of it is ai/200.
Figure 14. Local imperfection shape - type I.
The second version is closer to the local web crippling eigenmode of the girder. This shape
can be determined by the function of y = e-x
·sin(x) in longitudinal direction and along the fold
width it has a sinusoidal form (Fig. 15). The largest applied magnitude is ai/200.
Figure 15: Local imperfection shape - type II.
As local equivalent geometric imperfection, eigenmodes can be also used. A typical
eigenmode imperfection shape for patch loading analysis is presented in Fig. 16.
Figure 16: Local imperfection shape - type III.

11
2.3.4. Analysis and calculation results
Model verification is executed by simulation of all tests of Elgaaly and Seshadri [9]. The
ultimate loads are determined by geometrical and material nonlinear analysis using
imperfections. The Newton-Raphson approach is used in the nonlinear analysis. The
convergence of the solution is checked on the basis of the Euclidean norm of unbalanced
force vector by applying a tolerance of 0,1%. In the geometric nonlinear analysis large
displacements and strains are considered. Automatic load stepping is used which cut a load
step size in half whenever equilibrium iterations fail to converge and automatically restart
from the last converged sub step. If the halved load step again fails to converge, bisection will
again cut the load step size and restart, continuing the process until convergence is achieved
or until the minimum load step size is reached.
The influence of the imperfection shapes and directions is analyzed. The standard local and
global imperfection patterns made it possible to combine the imperfection shapes and
directions in each folds. 16 different cases are analyzed. Eight from these belongs to the
y = e-x
·sin(x) shaped imperfection form, and eight to the y = sin(x) shaped form. The applied
load on the structure is the experimental load carrying capacity of the structure according to
Elgaaly's test report (FR,exp=131.275kN). The ratio between the numerical and experimental
results is studied and summarized in Table 1.
Table 1: Comparison of imperfections FR,num/FR,exp
Imperfection form: e-x
·sin(x)
+1+1+1 +1-1+1 +1+1-1 +1-1-1 -1+1+1 -1-1+1 -1+1-1 -1-1-1
0.96661 0.94987 0.93551 0.94994 0.97662 0.95469 0.94429 0.95469
Imperfection form: sin(x)
+1+1+1 +1-1+1 +1+1-1 +1-1-1 -1+1+1 -1-1+1 -1+1-1 -1-1-1
0.9581 0.95337 0.94858 0.95928 0.9664 0.96084 0.9604 0.96361
The first number shows the direction of the global imperfection, the second one means the
direction of the local imperfection of the parallel folds, and the third one means the direction
of the local imperfection in the inclined folds. Where two signs are corresponding, the
imperfection has the same direction. The definition of the signs is illustrated in Fig. 17. For
example the imperfection code +1+1-1 means that the global imperfection form is in the
positive direction (Fig. 17) and the local imperfection forms are in all folds in the opposite
directions.
Figure 17: Illustration of imperfection directions.
It can be seen that the 93.5-97.7% of the experimental load carrying capacity is reached by the
simulation by varying of the imperfection form. Results applying the sinus wave imperfection
form give in all cases higher patch loading capacities than the other local imperfection shape.
Case #5 gives the nearest resistance to the experiment, and case #3 resulted in the smallest

12
load carrying capacity (0.935·131.3=122.8kN), where the global and local imperfection of the
parallel folds are in the same direction, and the local imperfection of the inclined folds are in
the opposite direction. Calculations showed that the load carrying capacity is the smallest if
the local imperfections of the neighbouring folds are in opposite directions. Reason for this is
the ultimate buckling shape where buckling of the neighbouring folds is every time in
opposite directions.
Patch loading resistance with eigenmode imperfections is also investigated. The load carrying
capacity is FR,num=126.04 kN, which is the 96.0% of the experimental value. This is higher
than most of the results with standard imperfection forms. But it can be stated that the
imperfection form and direction has not a significant influence on the patch loading capacity.
Imperfection sensitivity showed that the influence is lower than 10%, if the applied
imperfection magnitude is not larger than ai/50.
After the detailed study of imperfection shapes and magnitudes all the test specimens of
Elgaaly and Seshadri are recalculated. Table 2 shows the ultimate loads according to the
experiments (FR,exp) and numerical calculations (FR,num). It is shown that the numerically
calculated results give a good approach of the test results. Differences in cases 1-4 are
between 2% - 9% and they are always on the safe side. In case #5 the experimental failure
load is lower than the numerical, which may be due to the fact that this test was conducted
last and after performing two tests on each flange, resulting in permanent deformations in the
specimen as it was stated by Elgaaly and Seshadri in [9].
Table 2: Comparison between experimental and numerical results
Case Location of load Loading length,
ss (mm) FR,exp
[kN]
FR,num
[kN] FR,num/FR,exp
Case 1 Parallel fold 146.05 131.275 122.81 0.935
Case 2 Parallel fold ≈ 0 82.325 79.737 0.969
Case 3 Inclined fold 104.14 102.35 99.79125 0.975
Case 4 Inclined fold ≈ 0 95.675 87.354 0.913
Case 5
Junction between
a parallel and an
inclined fold
≈ 0 73.425 100.73 1.372
The finite element model exhibited the same structural behaviour which could be observed
during the tests and is published in [9]. A typical failure mode can be seen in Fig. 18/a
showing not only pure web crippling, but also interaction of web and flange buckling.
Figure 18: Typical failure mode by the numerical analysis.
13
In case of bridge launching the local lateral flange buckling cannot occur, because the
launching device is usually stiff enough in both lateral and longitudinal directions to avoid
this failure mode. Therefore in the numerical calculations the applied load is a uniformly
distributed displacement load to model the load introduction through a rigid plate. This
modelling approach is nearer to the real stiffness relationships in bridges as a flexible loading
situation. In this way the stiffening effect of the launching device is taken into account and the
failure mode is only web crippling (Fig. 18/b). The further results in the thesis are valid using
this assumption.
Accomplished convergence study showed that the maximal adequate element side length is
20-40 mm depending on the fold length (a1) of the developed model. It means that one fold
should be modelled by minimum 8-10 elements along the fold length to determine the local
web crippling resistance with adequate reliability. In the forgoing numerical parametric study
this principle is used and the models are characterised by an element number between 9000 to
20000 depending on the span and corrugation profile.
2.4. Numerical parametric study
2.4.1. Structural behaviour
Based on the verified model a comprehensive parametric study is executed in order to analyse
the patch loading resistance in the typical parameter range used in bridges. The analysed
parameters, which have influence on the load carrying capacity are varied between the
following values:
� web ratio: hw/tw=200 - 300 - 400 - 500
� fold ratio: ai/tw=12.5 - 25 - 50 -75 - 100 - 116.7 (in all cases a1=a2)
� loading length: ss/hw=0.4 - 0.6 - 0.8
� corrugation angle: α=15° - 30° - 45° - 65°
� flange width: bf=150 - 300- 400 - 500mm
� flange thickness: tf=20 - 40 - 60 - 80 - 100mm
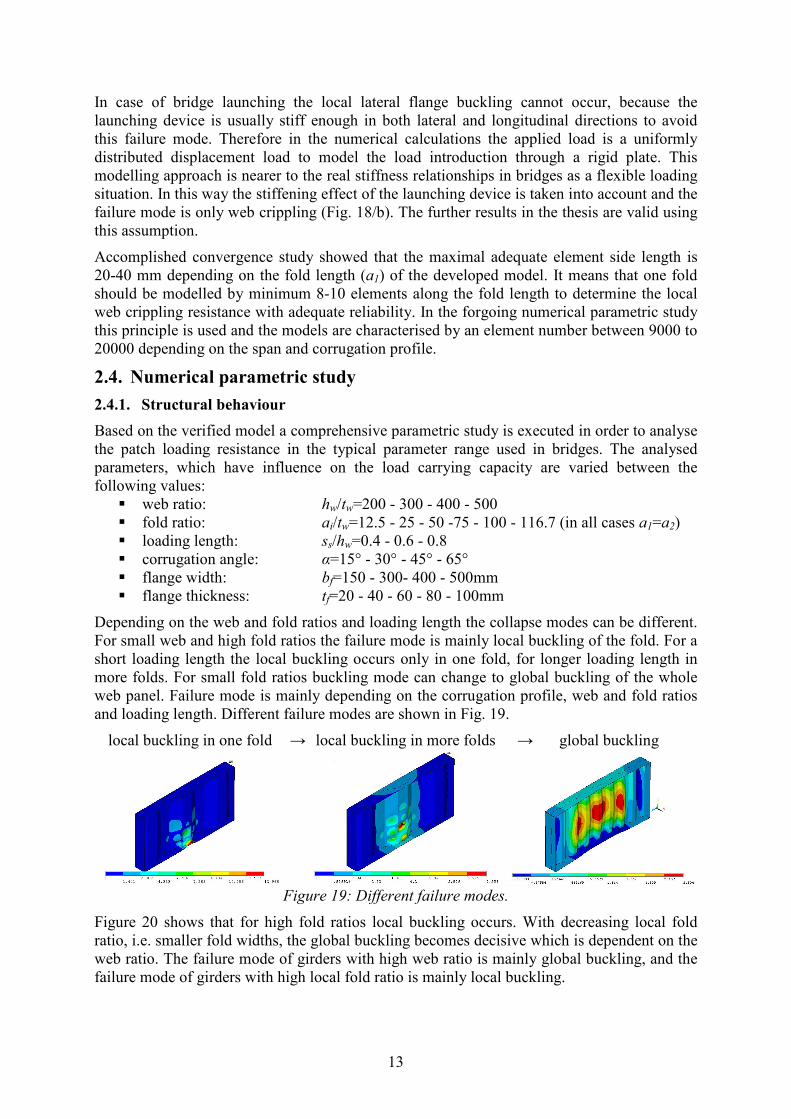
Depending on the web and fold ratios and loading length the collapse modes can be different.
For small web and high fold ratios the failure mode is mainly local buckling of the fold. For a
short loading length the local buckling occurs only in one fold, for longer loading length in
more folds. For small fold ratios buckling mode can change to global buckling of the whole
web panel. Failure mode is mainly depending on the corrugation profile, web and fold ratios
and loading length. Different failure modes are shown in Fig. 19.
local buckling in one fold → local buckling in more folds → global buckling
Figure 19: Different failure modes.
Figure 20 shows that for high fold ratios local buckling occurs. With decreasing local fold
ratio, i.e. smaller fold widths, the global buckling becomes decisive which is dependent on the
web ratio. The failure mode of girders with high web ratio is mainly global buckling, and the
failure mode of girders with high local fold ratio is mainly local buckling.

14
Generally, it can be concluded that the failure mode of the analysed girders used in bridges
are rather in the local buckling domain, and the global buckling occurs only at the limits of
the analysed parameter range. In case of global buckling a further decrease in fold width only
leads to a small or no increase in the ultimate load.
Figure 20: Change from local to global buckling.
This PhD thesis focuses only on the local web crippling in one or more folds. Numerical
simulations show that the change from local and global buckling is related to web (hw/tw) and
fold (ai/tw) ratios and corrugation angle. Based on the numerical database created in this study
a limit function is determined by Braun [12] for the minimum fold length ai in order to ensure
local buckling.
0
100
200
300
400
500
600
700
800
900
-12 -10 -8 -6 -4 -2 0 2 4 6 8
e [mm]
F [kN
]
deflection at the midspan
lateral displacement of the loaded fold
(1)
(2)(3)
(4)
(2)
(3)
(1)
Figure 21: Typical load-displacement curves.
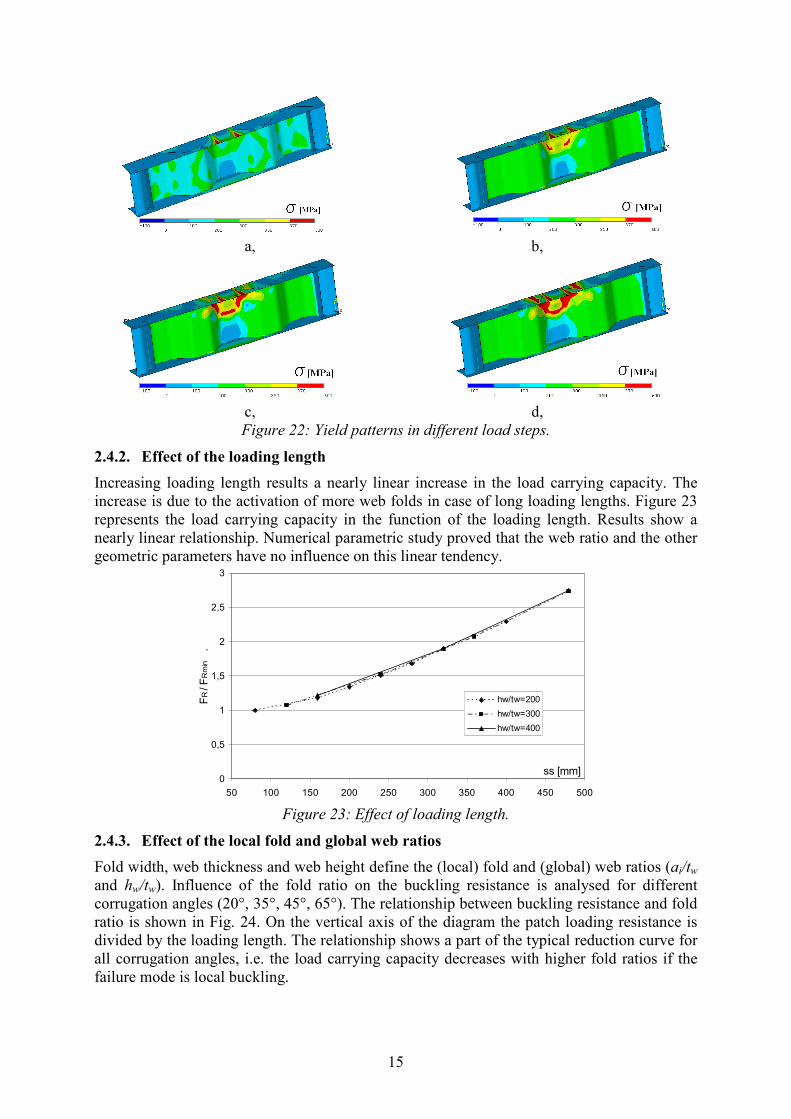
A typical load-displacement curve under patch loading is presented in Fig. 21. Characteristic
points of the structural behaviour are signed by points. Linear part of the diagram finishes at
point (1) which means the first yielding in the flange or in the web depending on the web and
flange geometries and imperfection size (Fig. 22/a). Between points (1) and (2) the flange and
web plates are yielding simultaneously (Fig. 22/b). Ultimate load is reached after reaching
point (2) if two plastic hinges in the flange and a continuous yield line in the web are
completely developed (Fig. 22/c). In the post ultimate range of the load displacement curve
the third and fourth plastic hinges begin to develop at point (3) in the flange which leads to
the failure mechanism of the girder. Point (4) shows the situation if all four plastic hinges are
completely developed (Fig. 22/d).
15
a, b,
c, d,
Figure 22: Yield patterns in different load steps.
2.4.2. Effect of the loading length
Increasing loading length results a nearly linear increase in the load carrying capacity. The
increase is due to the activation of more web folds in case of long loading lengths. Figure 23
represents the load carrying capacity in the function of the loading length. Results show a
nearly linear relationship. Numerical parametric study proved that the web ratio and the other
geometric parameters have no influence on this linear tendency.
0
0,5
1
1,5
2
2,5
3
50 100 150 200 250 300 350 400 450 500
ss [mm]
FR
/ F
Rm
in .
hw/tw=200
hw/tw=300
hw/tw=400
Figure 23: Effect of loading length.
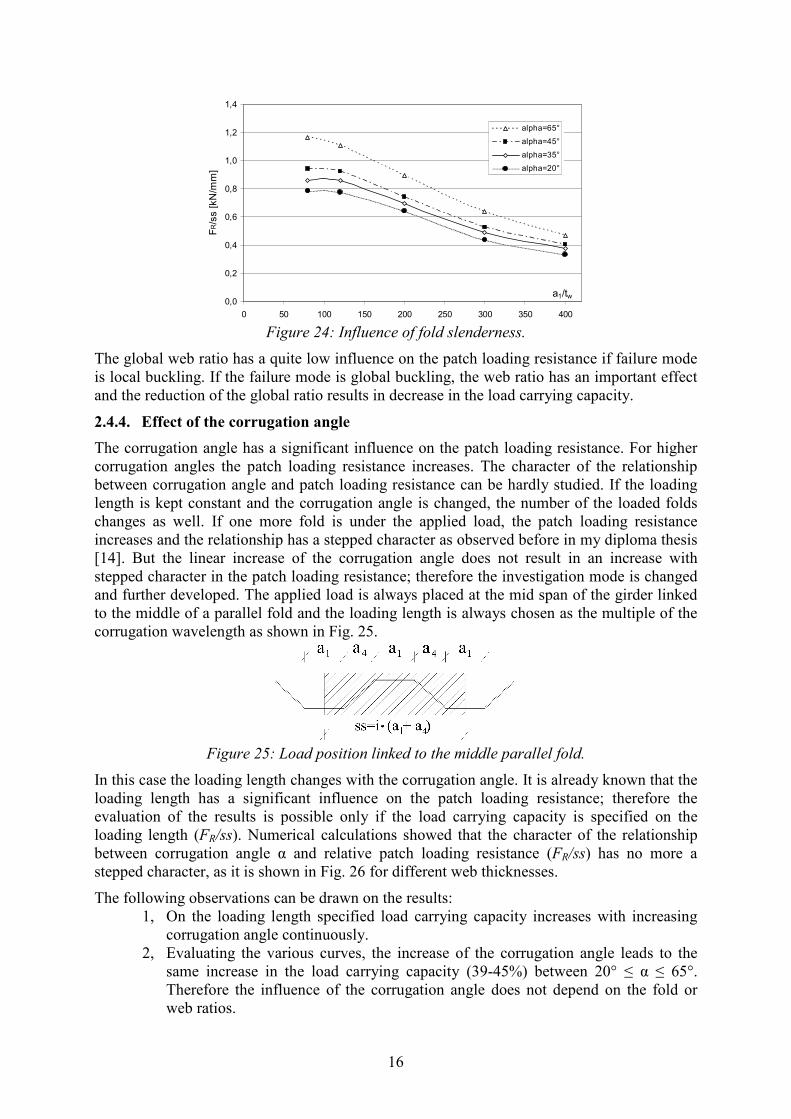
2.4.3. Effect of the local fold and global web ratios
Fold width, web thickness and web height define the (local) fold and (global) web ratios (ai/tw
and hw/tw). Influence of the fold ratio on the buckling resistance is analysed for different
corrugation angles (20°, 35°, 45°, 65°). The relationship between buckling resistance and fold
ratio is shown in Fig. 24. On the vertical axis of the diagram the patch loading resistance is
divided by the loading length. The relationship shows a part of the typical reduction curve for
all corrugation angles, i.e. the load carrying capacity decreases with higher fold ratios if the
failure mode is local buckling.
16
0,0
0,2
0,4
0,6
0,8
1,0
1,2
1,4
0 50 100 150 200 250 300 350 400
a1/tw
FR/s
s [kN
/mm
]
alpha=65°
alpha=45°
alpha=35°
alpha=20°
Figure 24: Influence of fold slenderness.
The global web ratio has a quite low influence on the patch loading resistance if failure mode
is local buckling. If the failure mode is global buckling, the web ratio has an important effect
and the reduction of the global ratio results in decrease in the load carrying capacity.
2.4.4. Effect of the corrugation angle
The corrugation angle has a significant influence on the patch loading resistance. For higher
corrugation angles the patch loading resistance increases. The character of the relationship
between corrugation angle and patch loading resistance can be hardly studied. If the loading
length is kept constant and the corrugation angle is changed, the number of the loaded folds
changes as well. If one more fold is under the applied load, the patch loading resistance
increases and the relationship has a stepped character as observed before in my diploma thesis
[14]. But the linear increase of the corrugation angle does not result in an increase with
stepped character in the patch loading resistance; therefore the investigation mode is changed
and further developed. The applied load is always placed at the mid span of the girder linked
to the middle of a parallel fold and the loading length is always chosen as the multiple of the
corrugation wavelength as shown in Fig. 25.
Figure 25: Load position linked to the middle parallel fold.
In this case the loading length changes with the corrugation angle. It is already known that the
loading length has a significant influence on the patch loading resistance; therefore the
evaluation of the results is possible only if the load carrying capacity is specified on the
loading length (FR/ss). Numerical calculations showed that the character of the relationship
between corrugation angle α and relative patch loading resistance (FR/ss) has no more a
stepped character, as it is shown in Fig. 26 for different web thicknesses.
The following observations can be drawn on the results:
1, On the loading length specified load carrying capacity increases with increasing
corrugation angle continuously.
2, Evaluating the various curves, the increase of the corrugation angle leads to the
same increase in the load carrying capacity (39-45%) between 20° ≤ α ≤ 65°.
Therefore the influence of the corrugation angle does not depend on the fold or
web ratios.
17
0,0
0,2
0,4
0,6
0,8
1,0
1,2
1,4
1,6
15 25 35 45 55 65
α [°]
FR/s
s [
kN
/mm
]
.
tw=5mm
tw=4mm
tw=3mm
tw=2mm
tw=1mm
Figure 26: Influence of the corrugation angle.
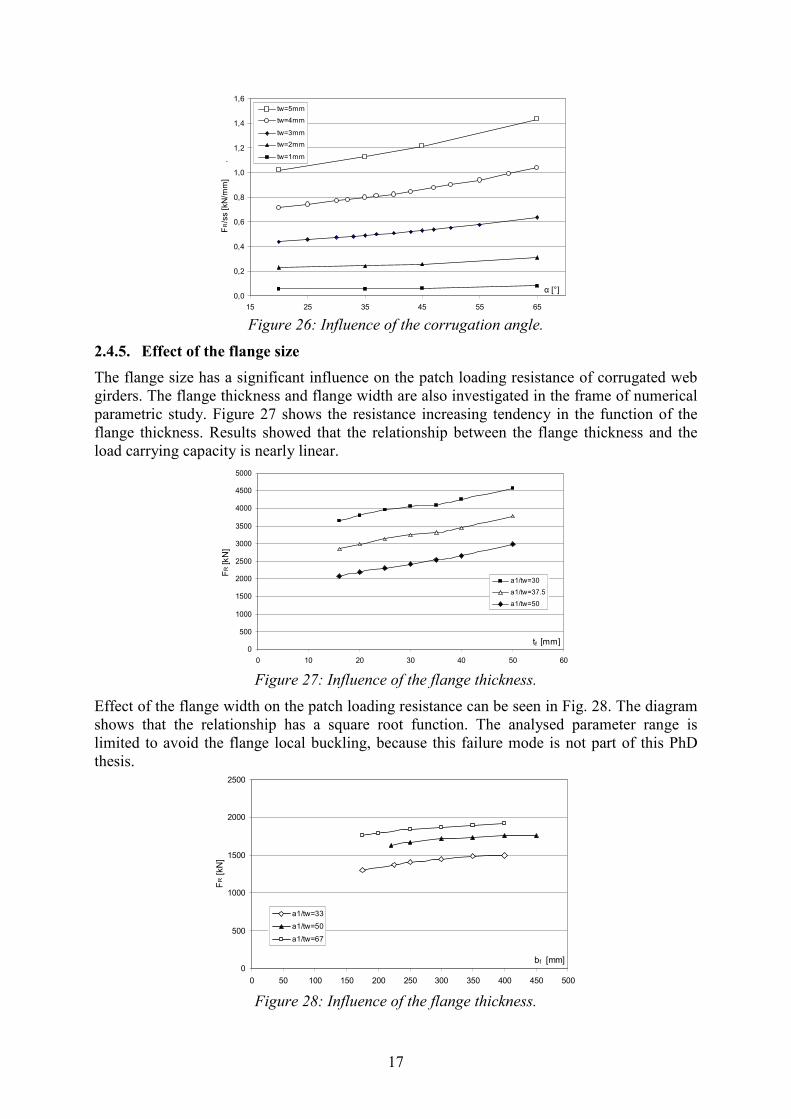
2.4.5. Effect of the flange size
The flange size has a significant influence on the patch loading resistance of corrugated web
girders. The flange thickness and flange width are also investigated in the frame of numerical
parametric study. Figure 27 shows the resistance increasing tendency in the function of the
flange thickness. Results showed that the relationship between the flange thickness and the
load carrying capacity is nearly linear.
0
500
1000
1500
2000
2500
3000
3500
4000
4500
5000
0 10 20 30 40 50 60
tf [mm]
FR [kN
]
a1/tw=30
a1/tw=37.5
a1/tw=50
Figure 27: Influence of the flange thickness.
Effect of the flange width on the patch loading resistance can be seen in Fig. 28. The diagram
shows that the relationship has a square root function. The analysed parameter range is
limited to avoid the flange local buckling, because this failure mode is not part of this PhD
thesis.
0
500
1000
1500
2000
2500
0 50 100 150 200 250 300 350 400 450 500
bf [mm]
FR [
kN
]
a1/tw=33
a1/tw=50
a1/tw=67
Figure 28: Influence of the flange thickness.
18
2.5. Design method development
2.5.1. Evaluation of the previous design methods
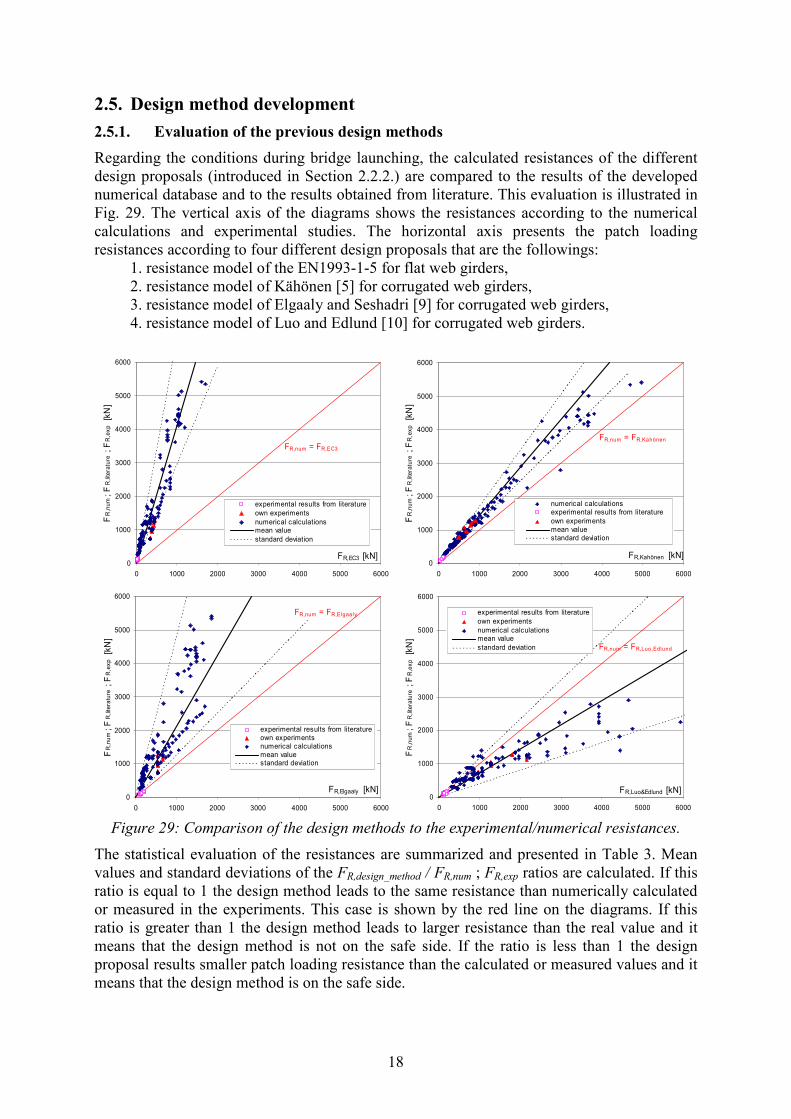
Regarding the conditions during bridge launching, the calculated resistances of the different
design proposals (introduced in Section 2.2.2.) are compared to the results of the developed
numerical database and to the results obtained from literature. This evaluation is illustrated in
Fig. 29. The vertical axis of the diagrams shows the resistances according to the numerical
calculations and experimental studies. The horizontal axis presents the patch loading
resistances according to four different design proposals that are the followings:
1. resistance model of the EN1993-1-5 for flat web girders,
2. resistance model of Kähönen [5] for corrugated web girders,
3. resistance model of Elgaaly and Seshadri [9] for corrugated web girders,
4. resistance model of Luo and Edlund [10] for corrugated web girders.
0
1000
2000
3000
4000
5000
6000
0 1000 2000 3000 4000 5000 6000
FR,EC3 [kN]
FR
,nu
m ; F
R,li
tera
ture
; F
R,e
xp [k
N]
experimental results from literature
own experiments
numerical calculationsmean value
standard deviation
FR,num = FR,EC3
0
1000
2000
3000
4000
5000
6000
0 1000 2000 3000 4000 5000 6000
FR,Kahönen [kN]
FR
,nu
m ; F
R,li
tera
ture
; F
R,e
xp [k
N]
numerical calculationsexperimental results from literature
own experimentsmean valuestandard deviation
FR,num = FR,Kahönen
0
1000
2000
3000
4000
5000
6000
0 1000 2000 3000 4000 5000 6000
FR,Elgaaly [kN]
FR
,nu
m ; F
R,li
tera
ture
; F
R,e
xp [k
N]
experimental results from literatureown experimentsnumerical calculationsmean valuestandard deviation
FR,num = FR,Elgaaly
0
1000
2000
3000
4000
5000
6000
0 1000 2000 3000 4000 5000 6000
FR,Luo&Edlund [kN]
FR
,nu
m ; F
R,li
tera
ture
; F
R,e
xp [k
N]
experimental results from literature
own experiments
numerical calculationsmean value
standard deviation FR,num = FR,Luo,Edlund
Figure 29: Comparison of the design methods to the experimental/numerical resistances.
The statistical evaluation of the resistances are summarized and presented in Table 3. Mean
values and standard deviations of the FR,design_method / FR,num ; FR,exp ratios are calculated. If this
ratio is equal to 1 the design method leads to the same resistance than numerically calculated
or measured in the experiments. This case is shown by the red line on the diagrams. If this
ratio is greater than 1 the design method leads to larger resistance than the real value and it
means that the design method is not on the safe side. If the ratio is less than 1 the design
proposal results smaller patch loading resistance than the calculated or measured values and it
means that the design method is on the safe side.

19
Comparison shows that the resistance model for flat web girders according to EN1993-1-5 [4]
leads to conservative results for corrugated web girders and it provides only a lower bound
solution for the determination of the patch loading resistance of corrugated web girders.
The design proposal of Kähönen [5] leads to appropriate resistance for the existing
experimental and numerical results in the parameter range used in bridges. This is due to the
introduction of an effective web thickness which is able to cope with the number of loaded
folds as long as local buckling occurs. Statistical evaluation showed that the design method of
Kähönen underestimates the patch loading resistance of the corrugated web girders with about
30% in average and the standard deviation of the results are relative small.
The design proposal of Elgaaly and Seshadri [9] gives a good prediction of the main
experimental results from literature. Since the chosen formulas for the resistance calculation
are not able to account for loading of several folds appropriately, therefore the results of this
design method shows larger differences for longer loading lengths which are used in bridges.
This design method is recommended rather for building structures and not for bridges.
The design model of Luo and Edlund [10] generally overestimates the resistance. This
originates from the calibration of the empirical factors, which is based only on a limited
number of numerical calculations. In the extended analyzed parameter range this design
method is not on the safe side and the scatter of the calculation results are also relative large.
Table 3: Statistical evaluation of different design methods (FR,design_method / FR.Num ; FR.Exp)
Design method: EC1993-1-5 Kähönen Elgaaly and
Seshadri
Luo and
Edlund
Mean value: 0.242 0.701 0.471 1.386
Standard deviation: 0.092 0.092 0.262 0.414
The comparison shows that the design method of Kähönen leads to the nearest resistance to
the existing experimental and numerical results in the whole extended parameter range
therefore it is used for further development of the patch loading resistance model. This design
method does not contains the effect of the corrugation angle which has a significant effect as
shown based on the numerical parametric study (Section 2.4.4.) and it does not follow the
general format of the Eurocode 3 in case of stability analysis (reduction factor based design).
Therefore a new modified design proposal is developed by Braun and Kuhlmann [3], [12]
based on the presented numerical calculations completed by myself.
2.5.2. Design method of Braun and Kuhlmann
Based on the numerical database developed by myself an enhanced design method is
developed at the Institute of Structural Design of the University of Stuttgart by Braun and
Kuhlmann [3]. This section does not contain my work but a short review about this design
method is definitely needed to understand the further research results of mine because they
are partly claimed to this design method.
The design method is based on the four plastic hinge failure mechanism according to the
patch loading theory of Rockey and Roberts [11] which was evolved for flat web girders. The
design method was calibrated for corrugated web girders by Kähönen [5], and further
investigated and modified by Braun and Kuhlmann for a larger parameter range based on my
numerical calculations published in [14]. Equation (3) gives the value of the patch loading
resistance.
( ) 0,, kFFkF flRwRR ⋅+⋅= α for 5.11
260 w
w
wi
t
t
ha ⋅
+≥ (3)
20
The first part of this equation refers to the resistance of the web and the second part to the
resistance of the flange. The web resistance can be calculated by Eq. (4).
wywwwR kssftF ⋅⋅⋅⋅= χ, (4)
χ should be calculated from Eqs. (5) and (6):
2
798.09.1
pp λλχ −= if 273.1>λ p (5)
00.1=χ if 273.1≤λ p (6)
where:
cr
ywp
f
σ=λ ,
2
2
2
)1(12
⋅⋅
υ−⋅π⋅
=σ σ
i
wcr
a
tE
k , 11.1=σk (7), (8), (9)
fyw: yield strength of the web,
tw: web thickness,
ai: loaded fold length (if more fold are loaded, the maximum fold length)
ss: loading length,
kw: modification factor due to shear and transverse force interaction.
Recommendation for the flange resistance is in Eq. (10) according to [3].
fffwfywwfplflR tbkkftMF ⋅⋅⋅−⋅⋅⋅⋅⋅⋅⋅= σχ 07.042 ., (10)
where: yf
ff
fpl ftb
M ⋅⋅
=4
2
. (11)
fyf: yield strength of the flange,
kf: modification factor due to bending and patch loading interaction,
bf: flange width,
tf: flange thickness,
σf: normal stress in the flange,
τw: shear stress in the web plate.
The design method takes the influence of the shear and bending interactions by several
modification factors into account. These are the followings:
63,03
63,10 +⋅τ
⋅σ⋅=
yw
w
yf
f
ffk if 23,0
3<
⋅τ⋅
σ
yw
w
yf
f
ff , (12)
0,10 =k if 23,03≥
⋅τ⋅
σ
yw
w
yf
f
ff , (13)
2
5,01
⋅τ
−=yw
ww
fk , (14)
2
1
σ−=
yf
f
ff
k . (15)
The new non-dimensional slenderness curve (λp-χ) was derived from the formula of Kähönen
[5] and it can be applied for the patch loading resistance of corrugated web girders. The
recommendation is shown in Fig. 30. Curve � is the proposal of EN1993-1-5 [4] for patch
loading of flat web girders, points show the results calculated from tests, curve � shows the

21
proposal derived from the formula of Kähönen, and curve � is the recommended enhanced
non-dimensional slenderness curve for local buckling of corrugated web girders by Braun and
Kuhlmann [3].
0
0,2
0,4
0,6
0,8
1
1,2
0 1 2 3 4 5 6 7λp [-]
χ [-]
prEN 1993-1-5:2003 for f lat w ebs
Tests of Kähönen
Tests of Leiva-Aravena et al.
Tests of Elgaaly et al.
Proposal of Braun et al.
Design method of Kähönen
1
2
3
Figure 30: Non-dimensional slenderness and reduction factor relationship.
Numerical results showed that the corrugation angle has a significant influence on the patch
loading resistance. Luo and Edlund [10] developed an empirical design formula which
considers the influence of the corrugation angle. Parametric study shows that this curve does
not follow the numerical results calculated by myself in case of larger corrugation angles (α >
40°). According to the numerical parametric study the character of the increasing patch
loading resistance can be described sufficiently well by referring the real length of the folded
web to the projected loading length. Therefore it is proposed by Braun and Kuhlmann to
improve the design method by the factor kα, which can be calculated from Eq. (16) developed
in [12].
41
21
aa
aak
++
=α (16)
The points in Fig. 31 show the results of the numerical calculations. The proposal of Luo and
Edlund is illustrated by curve �, and the proposal of Braun and Kuhlmann is shown by curve
�, which follows the numerical results well and in the whole analyzed parameter range it is
on the safe side. The applicability of the developed kα is proved by me based on the numerical
calculations.
The developed design method is valid for corrugation angles 15°≤ α ≤ 65°, for loading lengths
in the range between ss/hw = 0.4 and 0.8, if inclined and parallel folds have the same length
(a1 = a2). This design formula can be used between the web hw/tw= 200 to 500 and fold ratios
a1/tw= 15 to 100. This parameter range is relevant for bridges.
1,0
1,1
1,2
1,3
1,4
1,5
1,6
1,7
15 25 35 45 55 65 75α [°]
kα
numerical results
Proposal of Luo and Edlund
Proposal of Braun et al.
1
2
Figure 31: Influence of the corrugation angle.

22
2.6. Summary and conclusions
All the presented results are directly applied in a German research project (FOSTA Project
No. P 645) aiming (among others) to analyze the patch loading resistance of corrugated web
girders. The project is introduced in [3].
On the basis of the till now executed experiments a numerical model is developed with the
finite element program Ansys 10.0. On this model a nonlinear calculation is conducted with
geometrical and material nonlinearities. A model verification is executed by the comparison
of the ultimate loads and failure modes observed in the tests and in the numerical calculations.
In the frame of the numerical simulations different imperfection forms and magnitudes are
also studied. After the model verification a large number of numerical simulations (virtual
tests) are carried out. The influences of all geometric parameters are analyzed and the
following conclusions are drawn:
- increase of loading length → linear increase of the patch loading resistance,
- increase of fold ratio → decrease of the load carrying capacity if failure
mode is local buckling,
this has no effect if the failure mode is global
buckling,
- increase of web ratio → decrease of the load carrying capacity in the
global buckling domain,
this has no effect if the failure mode is local
buckling,
- increase of corrugation angle → patch loading resistance increases continuously,
- increase of flange thickness → linear increase of the patch loading resistance,
- increase of flange width → increase of the patch loading resistance.
Numerical calculations are used for the design method development which may be applied for
the practical design of corrugated web girders. An enhanced design method is developed by
Braun and Kuhlmann for patch loading of corrugated web girders in [3], [12]. A new
formulation of the corrugation angle influence is developed and its applicability in a large
parameter range is proved.
23
3. Experimental investigations
3.1. Aim of the tests
Patch loading tests are conducted on 12 simply supported girders. The aim of the tests is to
determine the patch loading resistance of corrugated web girders with a typical corrugation
profile of a real bridge girder by tests. Ultimate loads are determined and structural
behaviours and failure modes are analysed and described. Based on the test results the
previously developed design method is verified and improved.
3.2. Test program
3.2.1. Test specimens and test arrangement
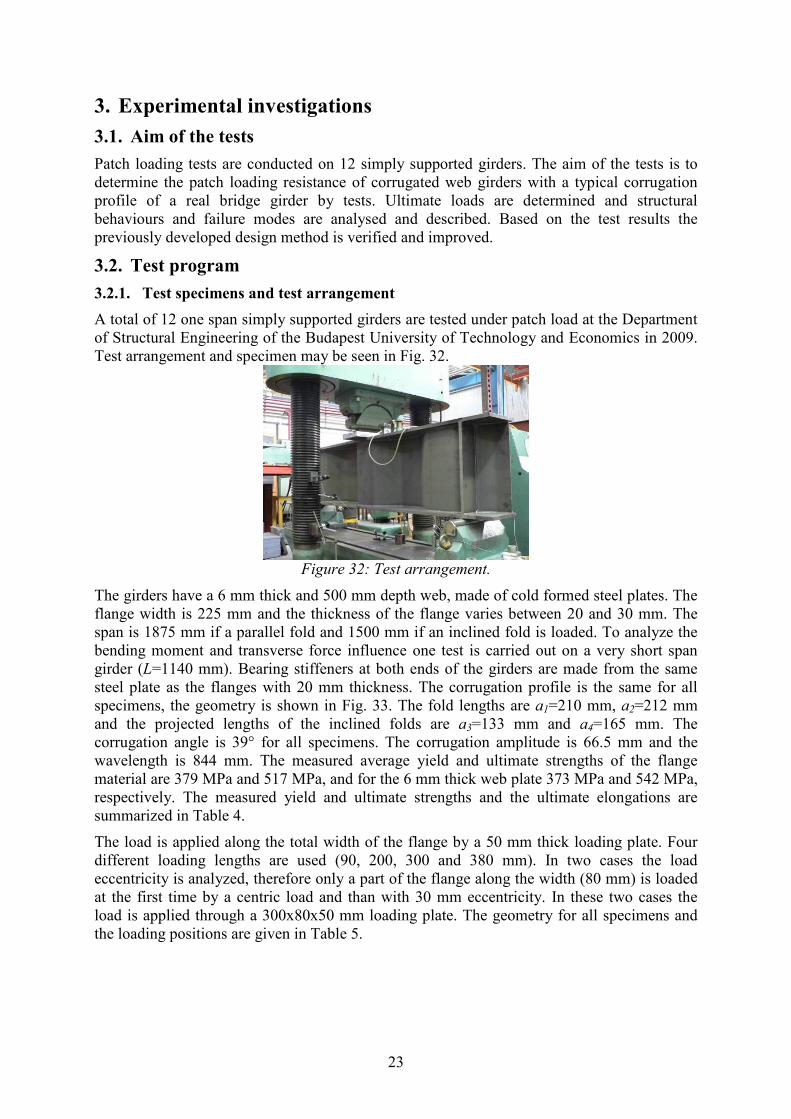
A total of 12 one span simply supported girders are tested under patch load at the Department
of Structural Engineering of the Budapest University of Technology and Economics in 2009.
Test arrangement and specimen may be seen in Fig. 32.
Figure 32: Test arrangement.
The girders have a 6 mm thick and 500 mm depth web, made of cold formed steel plates. The
flange width is 225 mm and the thickness of the flange varies between 20 and 30 mm. The
span is 1875 mm if a parallel fold and 1500 mm if an inclined fold is loaded. To analyze the
bending moment and transverse force influence one test is carried out on a very short span
girder (L=1140 mm). Bearing stiffeners at both ends of the girders are made from the same
steel plate as the flanges with 20 mm thickness. The corrugation profile is the same for all
specimens, the geometry is shown in Fig. 33. The fold lengths are a1=210 mm, a2=212 mm
and the projected lengths of the inclined folds are a3=133 mm and a4=165 mm. The
corrugation angle is 39° for all specimens. The corrugation amplitude is 66.5 mm and the
wavelength is 844 mm. The measured average yield and ultimate strengths of the flange
material are 379 MPa and 517 MPa, and for the 6 mm thick web plate 373 MPa and 542 MPa,
respectively. The measured yield and ultimate strengths and the ultimate elongations are
summarized in Table 4.
The load is applied along the total width of the flange by a 50 mm thick loading plate. Four
different loading lengths are used (90, 200, 300 and 380 mm). In two cases the load
eccentricity is analyzed, therefore only a part of the flange along the width (80 mm) is loaded
at the first time by a centric load and than with 30 mm eccentricity. In these two cases the
load is applied through a 300x80x50 mm loading plate. The geometry for all specimens and
the loading positions are given in Table 5.

24
Figure 33: Test specimen.
Table 4: Measured material properties
Specimen Yield strength
Ultimate
strength
Ultimate
elongation thickness width
fy fu A
Specimen
number
mm N/mm2 %
BME94/1 5,99 20,2 374 541 27,0
BME94/2 5,99 20,2 374 544 26,0
BME94/3 5,99 20,2 370 541 29,5
BME94/4 19,74 15,5 367 510 26,5
BME94/5 20,32 15,4 410 535 25,5
BME94/6 20,01 15,5 360 507 27,0
Table 5: Geometry of test specimens and loading positions specimen tf [mm] L [mm] ss [mm] loaded fold
1 20 1500 90 inclined
2 20 1500 200 inclined
3 20 1875 90 parallel
4 20 1875 200 parallel
5 30 1875 200 parallel
6 30 1500 200 inclined
7 20 1140 200 parallel
8 20 1500 380 inclined
9 30 1500 300x80 inclined (centric loading)
10 30 1500 300x80 inclined (eccentric loading)
11 20 1875 380 parallel
12 20 1500 90 corner area

25
3.2.2. Measurement system
Applied loading press is a VEB 276/3 hydraulic press which has a loading capacity of 6000
kN. During the tests the applied force and displacements are measured on different positions.
Load is determined using a load cell connected to the hydraulic jack. Inductive displacement
transducers are used to measure the vertical and horizontal displacements of the specimens. In
case of specimens 1-4 two inductive transducers (T1 and T2) and in case of specimens 5-12
three inductive transducers are applied (T1-T3). Location of the transducers is identical in all
test sets and the arrangement is shown in Fig. 34.
Figure 34: Measurement system.
Measuring goals:
- Transducer 1 (T1) is placed on the web in 50 mm distance from the upper flange. This
transducer measures the horizontal displacement of the loaded fold and therefore it is
placed near to the zone where web crippling is expected.
- Transducer 2 (T2) measures the vertical displacement of the tested girder at the mid
span under the lower (unloaded) flange.
- Transducer 3 (T3) measures the vertical displacement of the upper (loaded) flange
under the loading plate.
The measured data of the inductive transducers and load cell are recorded at 1 Hz frequency
by a HBM Spider8 amplifier connected to a Laptop PC running the HBM CatmanEasy
software. During a real-time data visualization the load is increased continuously by a
constant loading velocity.
3.3. Experimental program and test results
The aim of the tests is to determine the patch loading resistance by different geometrical
arrangements, loading lengths and positions. These tests give verification background for the
finite element model development and for the design method presented in Section 2.5.2. In the
frame of the tests the following parameters are varied:
� loading length (90 mm; 200 mm; 380 mm),
� loaded fold (inclined, parallel fold or corner area),
� flange thickness (20 mm; 30 mm),
� span (1140 mm; 1500 mm; 1875 mm),
� load eccentricity in transverse direction.
Two different failure modes are observed during the tests. If the loading length is short the
web buckling is limited mainly in one fold, and the wavelength of the buckled shape along the
web depth is relatively short. If buckling occurs in the neighbouring folds as well, all buckling
waves have the same direction as presented in Fig. 35/a. This failure mode is called web
crippling in the following. If the loading length is longer, more folds take part in the load

26
carrying and therefore web buckling appears in all loaded folds at the same time. The
buckling zone extends on more folds and it is longer compared to the previous one as
illustrated in Fig. 35/b. In this failure mode bucking waves in the neighbouring folds have
every time alternating direction. This failure is called local web buckling. These two failure
modes are compared in Fig. 35. A sharp limit between them cannot be determined, it is
mainly depending on the loading length, corrugation profile and on the fold ratio. In the case
of all tested girders one of these two failure types occurred.
a, web crippling b, local web buckling
Figure 35: Observed failure modes.
During the tests the applied force, the deflection of the upper and lower flange, and the lateral
displacement of the loaded fold are measured and presented in diagrams for all test
specimens. The corresponding failure modes are shortly described and presented in the
following figures.
Specimen 1:
In case of specimen #1 the inclined fold is loaded with a relatively short (ss=90 mm) loading
length. The span of the girder is 1500 mm and the flange thickness is 20 mm. Only one fold is
loaded and therefore the extension of the buckled zone is quite small and mainly limited on
the loaded fold. The neighbouring folds are only partly buckled and plastic deformations in
the flange plate can also be observed. This failure mode is the typical web crippling. The
measured ultimate load during the experiment is 754.2 kN and the recorded load-displacement
curves are presented in Fig. 36. The red thin curve on the diagram shows the lateral
displacement of the inclined web fold under the applied load. The diagram has a characteristic
point at the load level of 630 kN. Horizontal deformations are relatively small under this load
level; this means that buckling of the web developed only after reaching this load level. The
linear part of the load-displacement curve finishes here and the first yielding appears near to
this point. On higher load levels until reaching the ultimate load and in the post ultimate
behaviour the plastic deformations of the web panel are relatively large. The blue bold curve
shows the vertical deflection of the lower flange at the midspan. The linear part of this
diagram is relative long and after the first yielding the ultimate load is reached quite quickly.
It means that the girder has only a small plastic reserve and the failure comes relatively
quickly after the first yielding. The post ultimate range of the load-displacement curve shows
a typical buckling failure where after reaching the ultimate load the load carrying capacity
falls down quickly.

27
0
100
200
300
400
500
600
700
800
0 5 10 15 20 25 30
e [mm]
F [kN
] .
deflection
lateral displacement
Figure 36: Failure mode of test specimen #1.
Specimen 2:
Specimen #2 is loaded by a 200 mm long loading plate above an inclined fold. The span of
the girder is 1500 mm and the flange thickness is 20 mm. Neighbouring folds have buckling
waves with alternating directions and the extension of the buckled zone is larger than by the
first test and not limited to one fold. This failure mode is the local web buckling. First
yielding appears at the load level of 820 kN and the ultimate load is reached at 956.5 kN. The
load-deflection curve shows the same character as in case of specimen #1. The load - lateral
displacement diagram has an interesting tendency. It starts in the negative direction and after
reaching a higher load level buckling occurs in the opposite direction. The same structural
behaviour can be observed in case of some other specimens as well and this phenomenon is
dominant if a parallel fold is loaded. It can be explained by the imperfection direction. If the
initial geometric imperfection is in the opposite direction than the final buckling shape the
horizontal displacement diagram has a tendency as presented in Fig. 37. This effect is much
larger in case of specimens where a parallel fold is loaded, because the loaded cross-section is
unsymmetrical. In case of specimens #1 and #2 this effect is relatively small and in case of
specimens #3 and #4 where parallel folds are loaded it is dominant.
0
100
200
300
400
500
600
700
800
900
1000
-4 0 4 8 12 16 20
e [mm]
F [kN
] .
deflection
lateral displacement
Figure 37: Failure mode of test specimen #2.
Specimen 3:
A parallel fold is loaded in case of specimen #3, and the loading length is 90 mm. The failure
mode of the girder is web crippling and the buckled shape has in all folds the same direction.
The ultimate load is reached by 764.8 kN. Load and horizontal displacement diagram in Fig.
38 shows that the initial imperfection has the opposite direction as the final buckling shape.
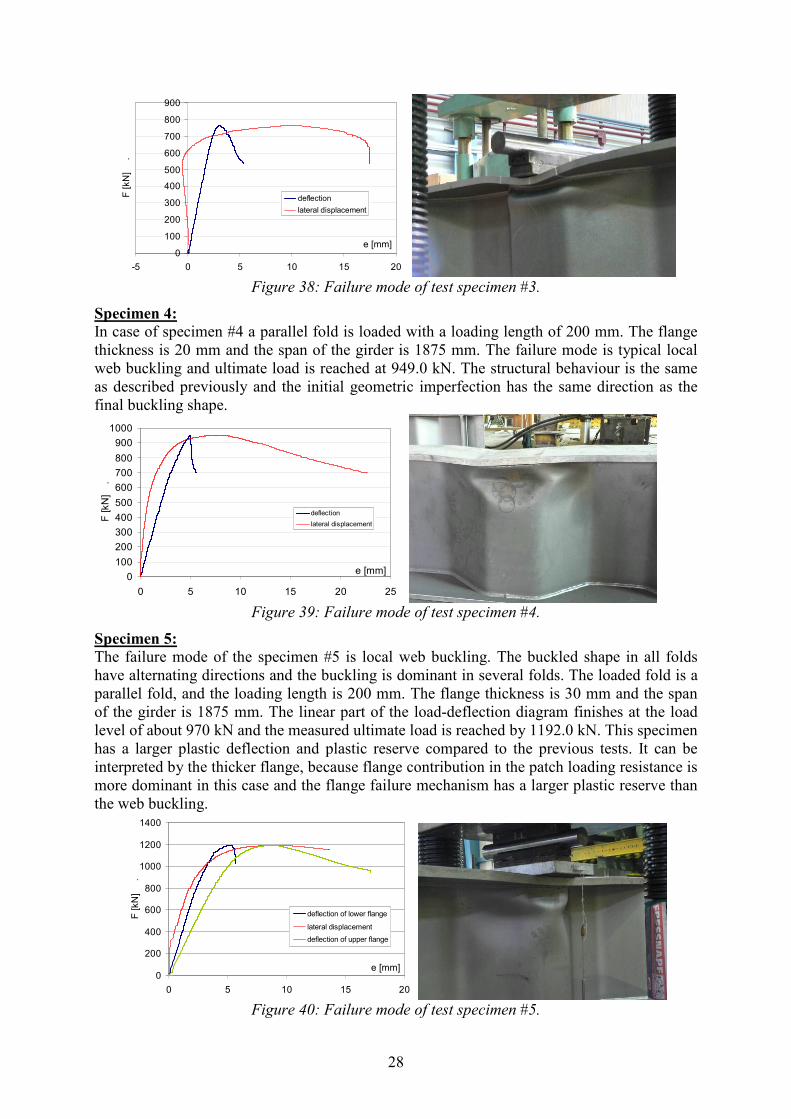
28
0
100
200
300
400
500
600
700
800
900
-5 0 5 10 15 20
e [mm]
F [kN
] .
deflection
lateral displacement
Figure 38: Failure mode of test specimen #3.
Specimen 4:
In case of specimen #4 a parallel fold is loaded with a loading length of 200 mm. The flange
thickness is 20 mm and the span of the girder is 1875 mm. The failure mode is typical local
web buckling and ultimate load is reached at 949.0 kN. The structural behaviour is the same
as described previously and the initial geometric imperfection has the same direction as the
final buckling shape.
0
100
200
300
400
500
600
700
800
900
1000
0 5 10 15 20 25
e [mm]
F [kN
] .
deflection
lateral displacement
Figure 39: Failure mode of test specimen #4.
Specimen 5:
The failure mode of the specimen #5 is local web buckling. The buckled shape in all folds
have alternating directions and the buckling is dominant in several folds. The loaded fold is a
parallel fold, and the loading length is 200 mm. The flange thickness is 30 mm and the span
of the girder is 1875 mm. The linear part of the load-deflection diagram finishes at the load
level of about 970 kN and the measured ultimate load is reached by 1192.0 kN. This specimen
has a larger plastic deflection and plastic reserve compared to the previous tests. It can be
interpreted by the thicker flange, because flange contribution in the patch loading resistance is
more dominant in this case and the flange failure mechanism has a larger plastic reserve than
the web buckling.
0
200
400
600
800
1000
1200
1400
0 5 10 15 20
e [mm]
F [kN
] .
deflection of lower flange
lateral displacement
deflection of upper flange
Figure 40: Failure mode of test specimen #5.

29
Specimen 6:
Failure mode of the specimen #6 is the same local web buckling as previously. The loaded
fold is an inclined fold, and the loading length is 200 mm. The flange thickness is 30 mm and
the span of the girder is 1500 mm. First yielding occurred at the load level of 810 kN and the
ultimate load is measured at 1119.3 kN. The horizontal displacement is until reaching the first
yielding almost negligible as typical if an inclined fold is loaded.
0
200
400
600
800
1000
1200
0 5 10 15 20
e [mm]
F [kN
] .
deflection of lower flange
lateral displacement
deflection of upper flange
Figure 41: Failure mode of test specimen #6.
Specimen 7:
In case of specimen #7 the span is 1140 mm and the flange thickness is 20 mm. The loaded
fold is a parallel fold, and the loading length is 200 mm. The very short span does not
indicated any change in the failure mode. The measured patch loading resistance is 1077.7 kN
which is 12% higher than in case of specimen #4 with the same loading conditions and with
the span of 1875 mm. It means that the effect of the bending moment cannot be neglected
during the patch loading resistance determination.
0
200
400
600
800
1000
1200
-5 0 5 10 15 20 25
e [mm]
F [kN
]
deflection of lower flange
deflection of upper flange
lateral displacement
Figure 42: Failure mode of test specimen #7.
Specimen 8:
Loading position of the specimen #8 is a parallel fold, and the loading length is 380 mm. The
span is 1500 mm and the flange thickness is 20 mm.
0
200
400
600
800
1000
1200
1400
-5 0 5 10 15 20 25
e [mm]
F [kN
]
deflection of lower flange
lateral displacement
deflection of upper flange
Figure 43: Failure mode of test specimen #8.

30
The failure mode of the specimen is local web buckling. By this test specimen the patch
loading resistance under longer loading length is investigated. The failure mode does not
change compared to the previous tests and the ultimate load is increased to 1263.94 kN.
Specimen 9:
In case of specimen #9 the applied load is introduced through a 80 mm wide and 300 mm
long loading plate. The flange thickness is 30 mm and the span of the girder is 1500 mm. Aim
of this test is to execute a reference experiment for the next research step to analyze the effect
of the loading width and eccentricity. The failure mode does not change due to the effect of
the loading width and the girder failed by local web buckling. Ultimate load is reached at
1220.48 kN.
0
200
400
600
800
1000
1200
1400
-5 0 5 10 15 20
e [mm]
F [kN
] .
deflection of lower flanges
lateral displacement
deflection of upper flange
Figure 44: Failure mode of test specimen #9.
Specimen 10:
Specimen #10 is loaded under eccentric patch loading. Girder geometry, span, loaded fold and
the loading plate is the same as in the previous tests, only the loading position is modified and
the applied load is introduced with a 30 mm eccentricity. This test is a calibration test to
analyze the effect of the loading eccentricity, which is investigated in details and presented in
Chapter 5. The numerical model is developed based on this test specimen and the effect of the
loading eccentricity is studied by numerical calculations. The experiment showed that the
failure mode does not change due to the loading eccentricity and the girder failed by local
web buckling. The displacements are not measured on this specimen because of the global
buckling danger of the whole specimen. The ultimate load is reached at 1090.2 kN, which is
10.69% lower than the ultimate load in the reference test (specimen #9). This result showed
that the load eccentricity has a significant effect on the patch loading resistance which should
be investigated further.
Figure 45: Failure mode of test specimen #10.
Specimen 11:
In case of specimen #11 the flange thickness is 20 mm. A parallel fold is loaded therefore the
span of the girder is 1875 mm. The load is applied through a 380 mm long loading plate to

31
analyze longer loading lengths. The failure mode is local web buckling and the area of the
buckled zone is relatively large due to the long loading length. Ultimate load is reached at
1280.99 kN which is approximately the same as in the case of specimen #8, which had the
same geometry only the span and the loaded fold differed. The experiments showed that the
loaded fold and the load position has not a significant influence on the patch loading
resistance of corrugated web girders.
0
200
400
600
800
1000
1200
1400
0 5 10 15 20
e [mm]
F [kN
]
deflection of lower flange
lateral displacement
deflection of upper flange
Figure 46: Failure mode of test specimen #11.
Specimen 12:
In case of specimen #12 the span is 1500 mm and the flange thickness is 20 mm. The girder is
loaded through a 90 mm long loading plate. The load is introduced at the corner area of two
neighbouring folds. Buckling occured in both folds against the short loading length and the
failure mode is local web buckling. Ultimate load is reached at 772.39 kN. In comparison
with the other specimens which are loaded by a 90 mm loading plate the difference between
load carrying capacities are under 2.5%. This result proved that the loading position has not a
significant influence on the patch loading resistance.
0
100
200
300
400
500
600
700
800
900
0 2 4 6 8 10 12 14
e [mm]
F [kN
]
deflection of lower flange
lateral displacement
deflection of upper flange
Figure 47: Failure mode of test specimen #12.
3.4. Verification and modification of the developed design method
Based on the executed experiments and numerical database the design method developed by
Braun and Kuhlmann is refined. The aim of the further investigations is to determine the pure
patch loading resistance without interacting shear force and bending moment. Possible
interaction of patch loading, bending and shear is separatly investigated later and an
interaction equation is developed in Chapter 7.
Eq. (17) gives the pure patch loading resistance without any interaction consideration.
( )flRwRR FFF ,, += (17)
The formulation of this modified design method is the same as developed by Braun and
Kuhlmann in [3], only the interactions are not considered. The first part of the equation gives
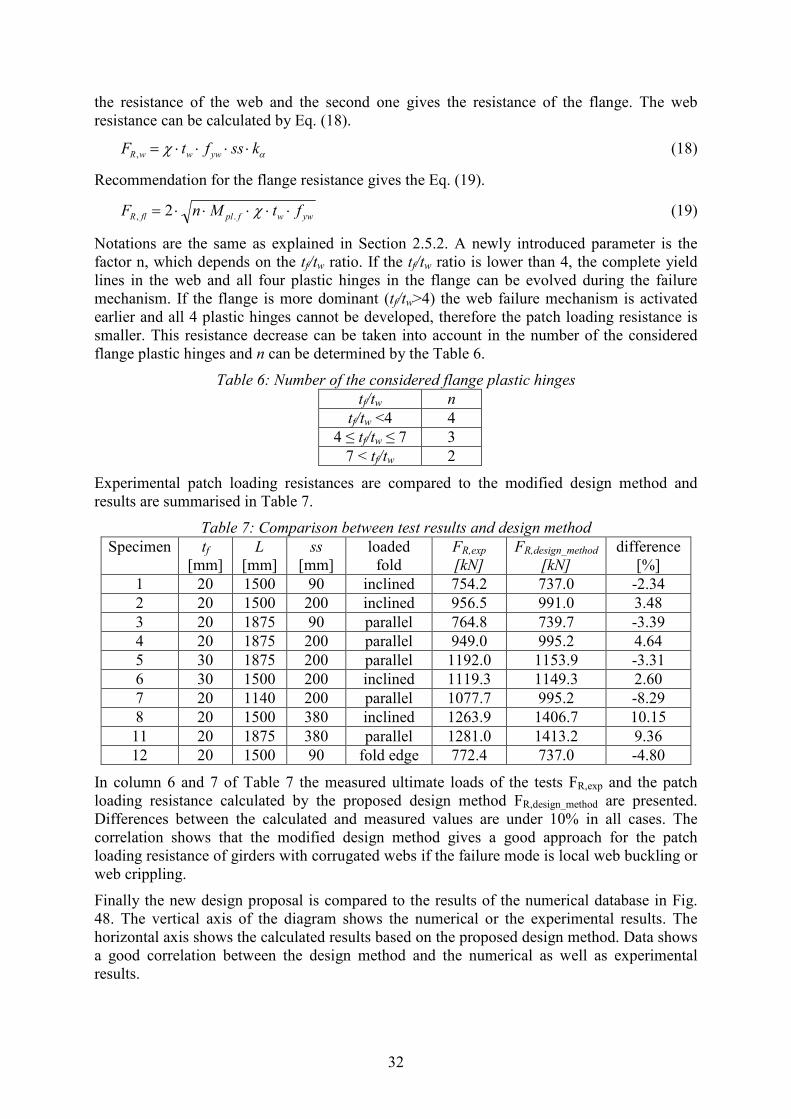
32
the resistance of the web and the second one gives the resistance of the flange. The web
resistance can be calculated by Eq. (18).
αχ kssftF ywwwR ⋅⋅⋅⋅=, (18)
Recommendation for the flange resistance gives the Eq. (19).
ywwfplflR ftMnF ⋅⋅⋅⋅⋅= χ., 2 (19)
Notations are the same as explained in Section 2.5.2. A newly introduced parameter is the
factor n, which depends on the tf/tw ratio. If the tf/tw ratio is lower than 4, the complete yield
lines in the web and all four plastic hinges in the flange can be evolved during the failure
mechanism. If the flange is more dominant (tf/tw>4) the web failure mechanism is activated
earlier and all 4 plastic hinges cannot be developed, therefore the patch loading resistance is
smaller. This resistance decrease can be taken into account in the number of the considered
flange plastic hinges and n can be determined by the Table 6.
Table 6: Number of the considered flange plastic hinges
tf/tw n
tf/tw <4 4
4 ≤ tf/tw ≤ 7 3
7 < tf/tw 2
Experimental patch loading resistances are compared to the modified design method and
results are summarised in Table 7.
Table 7: Comparison between test results and design method
Specimen tf
[mm]
L
[mm]
ss
[mm]
loaded
fold
FR,exp
[kN]
FR,design_method
[kN]
difference
[%]
1 20 1500 90 inclined 754.2 737.0 -2.34
2 20 1500 200 inclined 956.5 991.0 3.48
3 20 1875 90 parallel 764.8 739.7 -3.39
4 20 1875 200 parallel 949.0 995.2 4.64
5 30 1875 200 parallel 1192.0 1153.9 -3.31
6 30 1500 200 inclined 1119.3 1149.3 2.60
7 20 1140 200 parallel 1077.7 995.2 -8.29
8 20 1500 380 inclined 1263.9 1406.7 10.15
11 20 1875 380 parallel 1281.0 1413.2 9.36
12 20 1500 90 fold edge 772.4 737.0 -4.80
In column 6 and 7 of Table 7 the measured ultimate loads of the tests FR,exp and the patch
loading resistance calculated by the proposed design method FR,design_method are presented.
Differences between the calculated and measured values are under 10% in all cases. The
correlation shows that the modified design method gives a good approach for the patch
loading resistance of girders with corrugated webs if the failure mode is local web buckling or
web crippling.
Finally the new design proposal is compared to the results of the numerical database in Fig.
48. The vertical axis of the diagram shows the numerical or the experimental results. The
horizontal axis shows the calculated results based on the proposed design method. Data shows
a good correlation between the design method and the numerical as well as experimental
results.
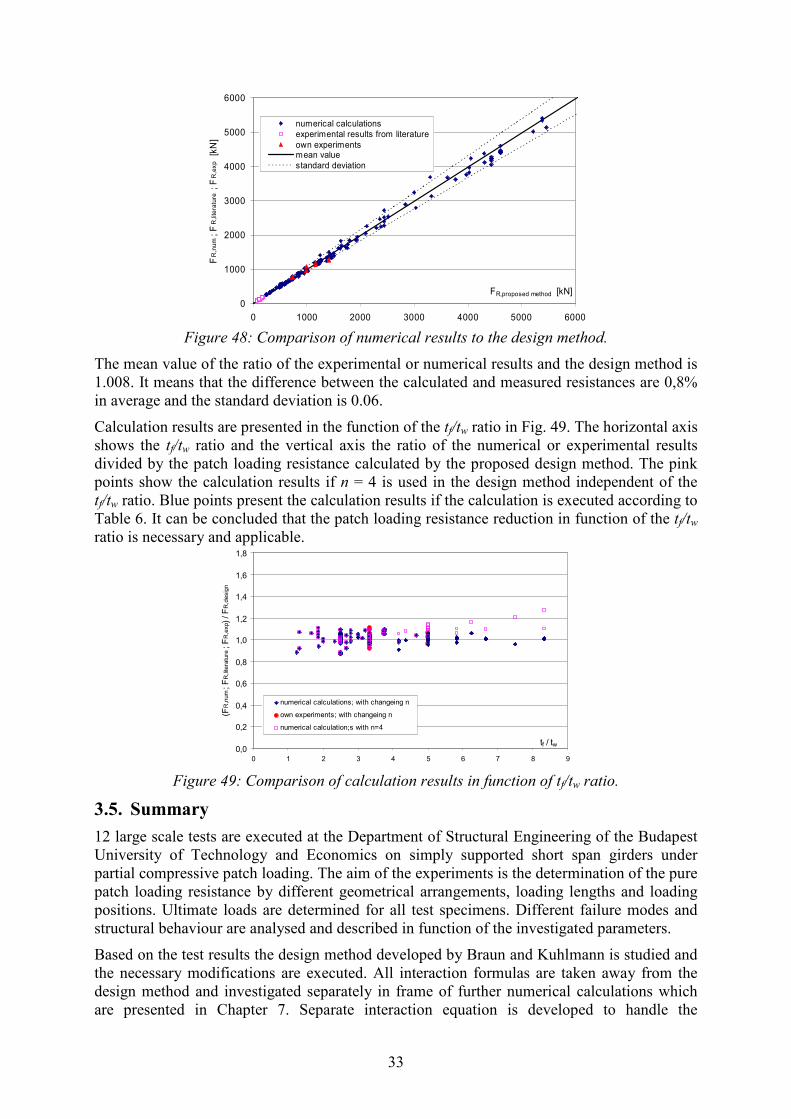
33
0
1000
2000
3000
4000
5000
6000
0 1000 2000 3000 4000 5000 6000
FR,proposed method [kN]
FR
,num ; F
R,li
tera
ture
; F
R,e
xp [k
N]
numerical calculations
experimental results from literature
own experimentsmean value
standard deviation
Figure 48: Comparison of numerical results to the design method.
The mean value of the ratio of the experimental or numerical results and the design method is
1.008. It means that the difference between the calculated and measured resistances are 0,8%
in average and the standard deviation is 0.06.
Calculation results are presented in the function of the tf/tw ratio in Fig. 49. The horizontal axis
shows the tf/tw ratio and the vertical axis the ratio of the numerical or experimental results
divided by the patch loading resistance calculated by the proposed design method. The pink
points show the calculation results if n = 4 is used in the design method independent of the
tf/tw ratio. Blue points present the calculation results if the calculation is executed according to
Table 6. It can be concluded that the patch loading resistance reduction in function of the tf/tw
ratio is necessary and applicable.
0,0
0,2
0,4
0,6
0,8
1,0
1,2
1,4
1,6
1,8
0 1 2 3 4 5 6 7 8 9
tf / tw
(FR
,num ; F
R,lite
ratu
re ; F
R,e
xp ) / F
R,d
esig
n
numerical calculations; with changeing n
own experiments; with changeing n
numerical calculation;s with n=4
Figure 49: Comparison of calculation results in function of tf/tw ratio.
3.5. Summary
12 large scale tests are executed at the Department of Structural Engineering of the Budapest
University of Technology and Economics on simply supported short span girders under
partial compressive patch loading. The aim of the experiments is the determination of the pure
patch loading resistance by different geometrical arrangements, loading lengths and loading
positions. Ultimate loads are determined for all test specimens. Different failure modes and
structural behaviour are analysed and described in function of the investigated parameters.
Based on the test results the design method developed by Braun and Kuhlmann is studied and
the necessary modifications are executed. All interaction formulas are taken away from the
design method and investigated separately in frame of further numerical calculations which
are presented in Chapter 7. Separate interaction equation is developed to handle the

34
interaction of transverse and shear forces. The interaction between patch loading and bending
is a future research topic. This chapter focuses only on the determination of the pure patch
loading resistance. The design method of Braun and Kuhlmann is modified according to the
test results and numerical calculations. The resistance influencing effect of the tf/tw ratio is
determined and built in the design method.
Finally the result of the design proposal is compared to the own laboratory tests and
numerical database. Ultimate loads measured during the tests and the calculated values show
a good correlation, therefore the design method is verified and it may be used for girders
within the parameter range detailed in Chapter 2 which is relevant for bridges.
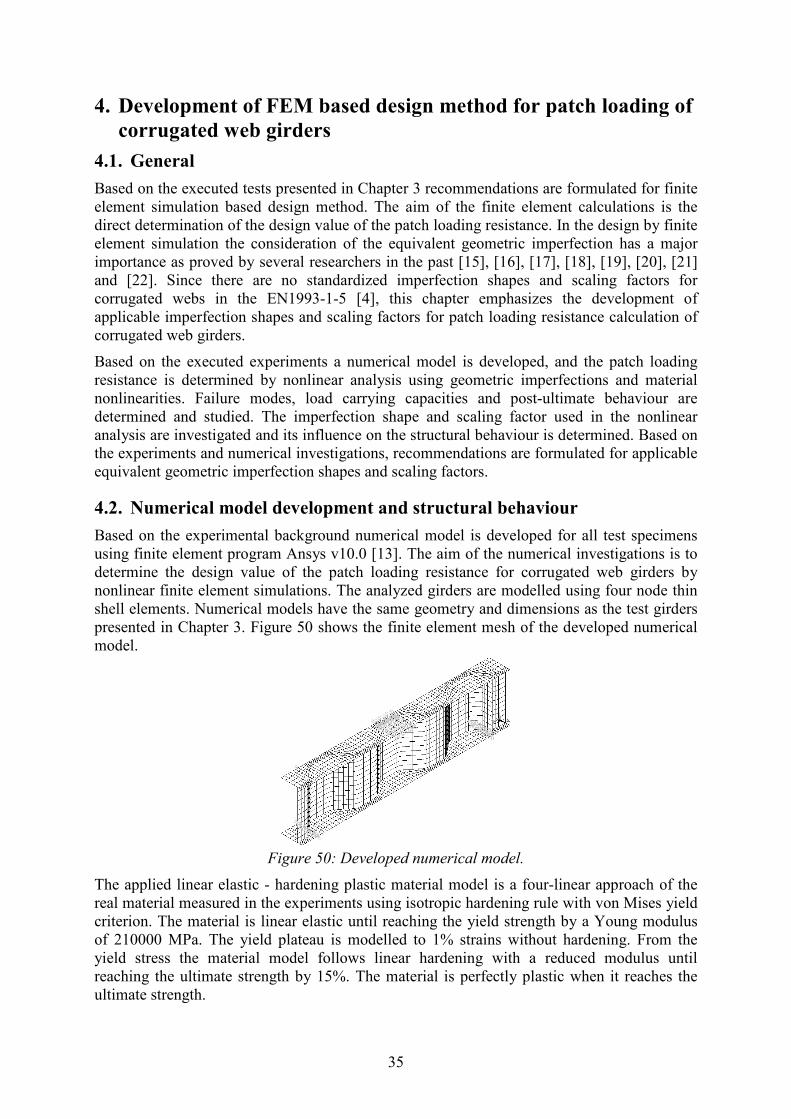
35
4. Development of FEM based design method for patch loading of
corrugated web girders
4.1. General
Based on the executed tests presented in Chapter 3 recommendations are formulated for finite
element simulation based design method. The aim of the finite element calculations is the
direct determination of the design value of the patch loading resistance. In the design by finite
element simulation the consideration of the equivalent geometric imperfection has a major
importance as proved by several researchers in the past [15], [16], [17], [18], [19], [20], [21]
and [22]. Since there are no standardized imperfection shapes and scaling factors for
corrugated webs in the EN1993-1-5 [4], this chapter emphasizes the development of
applicable imperfection shapes and scaling factors for patch loading resistance calculation of
corrugated web girders.
Based on the executed experiments a numerical model is developed, and the patch loading
resistance is determined by nonlinear analysis using geometric imperfections and material
nonlinearities. Failure modes, load carrying capacities and post-ultimate behaviour are
determined and studied. The imperfection shape and scaling factor used in the nonlinear
analysis are investigated and its influence on the structural behaviour is determined. Based on
the experiments and numerical investigations, recommendations are formulated for applicable
equivalent geometric imperfection shapes and scaling factors.
4.2. Numerical model development and structural behaviour
Based on the experimental background numerical model is developed for all test specimens
using finite element program Ansys v10.0 [13]. The aim of the numerical investigations is to
determine the design value of the patch loading resistance for corrugated web girders by
nonlinear finite element simulations. The analyzed girders are modelled using four node thin
shell elements. Numerical models have the same geometry and dimensions as the test girders
presented in Chapter 3. Figure 50 shows the finite element mesh of the developed numerical
model.
Figure 50: Developed numerical model.
The applied linear elastic - hardening plastic material model is a four-linear approach of the
real material measured in the experiments using isotropic hardening rule with von Mises yield
criterion. The material is linear elastic until reaching the yield strength by a Young modulus
of 210000 MPa. The yield plateau is modelled to 1% strains without hardening. From the
yield stress the material model follows linear hardening with a reduced modulus until
reaching the ultimate strength by 15%. The material is perfectly plastic when it reaches the
ultimate strength.

36
The ultimate loads are determined by geometrical and material nonlinear analysis using
different imperfection shapes. The finite element model exhibited the same structural
behaviour and the same failure modes which are observed during the tests. The measured
patch loading resistances are compared to the numerical calculations, the experimental failure
modes to the numerical failure modes and the measured load displacement curves to the
equilibrium paths of the numerical analyses.
Convergence study gave the same result as established in Chapter 2. One fold should be
modelled minimum of 8-10 elements along the fold length to determine the patch loading
resistance with adequate reliability. In the forgoing studies this principle is taken into account
and the models are characterised by an element number between 10000 to 15000 depending
on the span and corrugation profile.
Figures 51 to 55 show the comparison of the experimental and numerical failure modes for
five specimens. On the left side of the figures the experimental failure modes and on the right
side the result of the finite element calculations are presented.
Figure 51: Experimental and numerical failure modes - specimen #2.
Figure 52: Experimental and numerical failure modes - specimen #4.
Figure 53: Experimental and numerical failure modes - specimen #5.
Figure 54: Experimental and numerical failure modes - specimen #10.
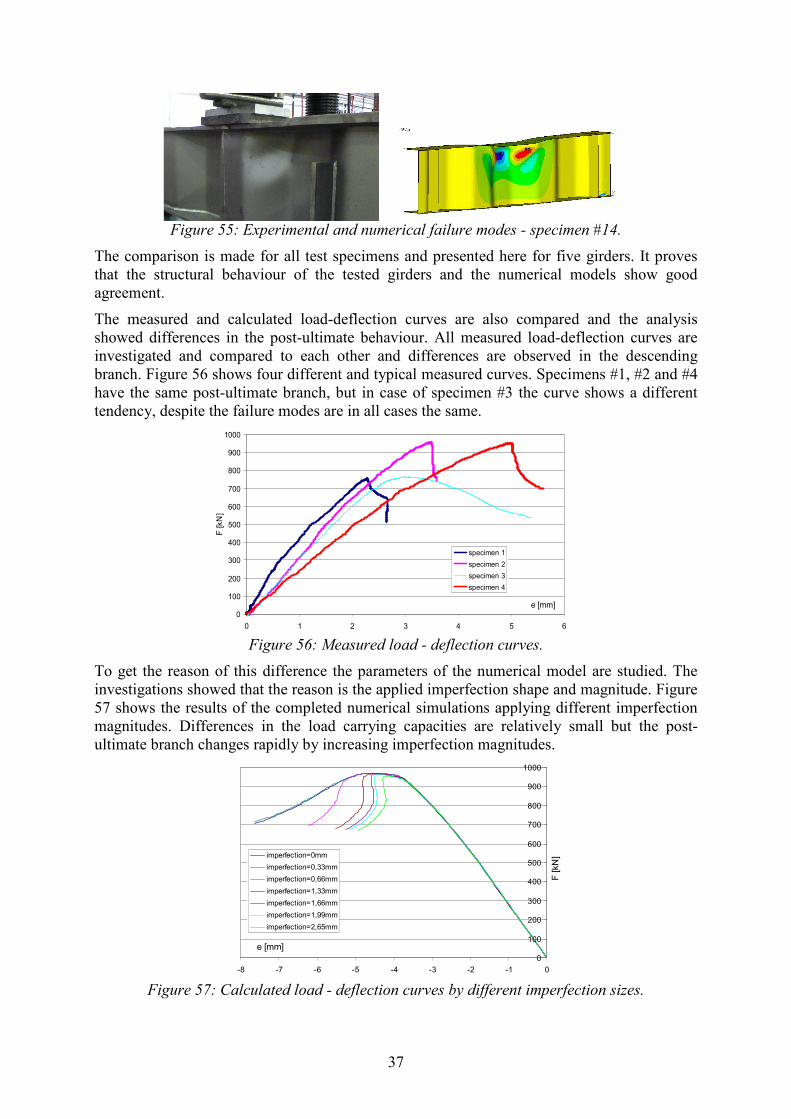
37
Figure 55: Experimental and numerical failure modes - specimen #14.
The comparison is made for all test specimens and presented here for five girders. It proves
that the structural behaviour of the tested girders and the numerical models show good
agreement.
The measured and calculated load-deflection curves are also compared and the analysis
showed differences in the post-ultimate behaviour. All measured load-deflection curves are
investigated and compared to each other and differences are observed in the descending
branch. Figure 56 shows four different and typical measured curves. Specimens #1, #2 and #4
have the same post-ultimate branch, but in case of specimen #3 the curve shows a different
tendency, despite the failure modes are in all cases the same.
0
100
200
300
400
500
600
700
800
900
1000
0 1 2 3 4 5 6
e [mm]
F [kN]
specimen 1
specimen 2
specimen 3
specimen 4
Figure 56: Measured load - deflection curves.
To get the reason of this difference the parameters of the numerical model are studied. The
investigations showed that the reason is the applied imperfection shape and magnitude. Figure
57 shows the results of the completed numerical simulations applying different imperfection
magnitudes. Differences in the load carrying capacities are relatively small but the post-
ultimate branch changes rapidly by increasing imperfection magnitudes.
0
100
200
300
400
500
600
700
800
900
1000
-8 -7 -6 -5 -4 -3 -2 -1 0
e [mm]
F [kN]imperfection=0mm
imperfection=0,33mm
imperfection=0,66mm
imperfection=1,33mm
imperfection=1,66mm
imperfection=1,99mm
imperfection=2,65mm
Figure 57: Calculated load - deflection curves by different imperfection sizes.

38
Figure 58 presents the typical points of two load - deflection diagrams. The solid blue curve
shows a simulation conducted without imperfection and the dotted red line with a relatively
large imperfection magnitude. The applied imperfection shape is the first buckling mode.
Point #1 shows the first yielding in the flange if no imperfection is applied (Fig. 22a). In the
same load step a simultaneous yielding in the flange and web appears if the applied
imperfection is relatively large. The phenomenon is illustrated in Fig. 22b. The difference
between the two structural behaviours is the appearing time of the first yielding in the web. If
the imperfection size is 0, it appears at point #2 and if a large imperfection is applied it
appears at point #1. Points #3 and #4 show the load levels when 2 plastic hinges are
completely developed in the flange, as it is illustrated in Fig. 22c, and points #5 and #6 mean
the load levels when all 4 plastic hinges are developed (Fig. 22d).
0
100
200
300
400
500
600
700
800
900
1000
0 1 2 3 4 5 6 7
e [mm]
F [kN]
imperfection magnitude =0mm
imperfection magnitude =2,65mm
(1)
(2)(3)
(4)
(5)
(6)
Figure 58: Analysis of imperfection size.
Experiments and numerical investigations showed that the imperfection has an important
effect on the structural behaviour in the descending branch. Using an adequate imperfection
shape and magnitude the numerical simulation leads to the same load carrying capacity and to
the same structural behaviour as the tested girders. The comparison of the measured and
calculated load - displacement curves are illustrated in the case of five specimens (Figs. 59-
63). The two solid lines always show the deflection and the lateral displacement measured in
the tests and the dotted lines represent the results of the numerical simulations.
0
100
200
300
400
500
600
700
800
0 1 2 3 4 5 6 7 8
e [mm]
F [kN] .
experimental deflection
experimental lateral displacement
numerical deflection
numerical lateral displacement
Figure 59: Experimental and numerical load - displacement curves, specimen #1.
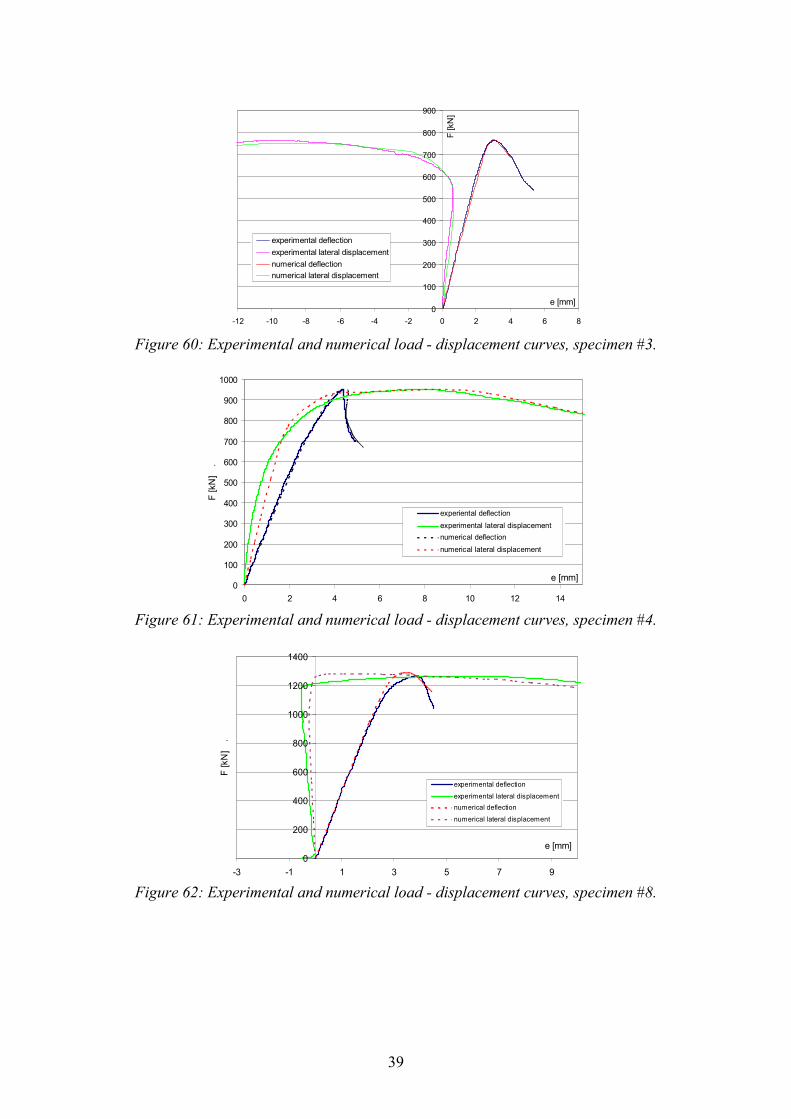
39
0
100
200
300
400
500
600
700
800
900
-12 -10 -8 -6 -4 -2 0 2 4 6 8
e [mm]
F [kN]
experimental deflection
experimental lateral displacement
numerical deflection
numerical lateral displacement
Figure 60: Experimental and numerical load - displacement curves, specimen #3.
0
100
200
300
400
500
600
700
800
900
1000
0 2 4 6 8 10 12 14
e [mm]
F [kN] .
experiental deflection
experimental lateral displacement
numerical deflection
numerical lateral displacement
Figure 61: Experimental and numerical load - displacement curves, specimen #4.
0
200
400
600
800
1000
1200
1400
-3 -1 1 3 5 7 9
e [mm]
F [kN] .
experimental deflection
experimental lateral displacement
numerical deflection
numerical lateral displacement
Figure 62: Experimental and numerical load - displacement curves, specimen #8.
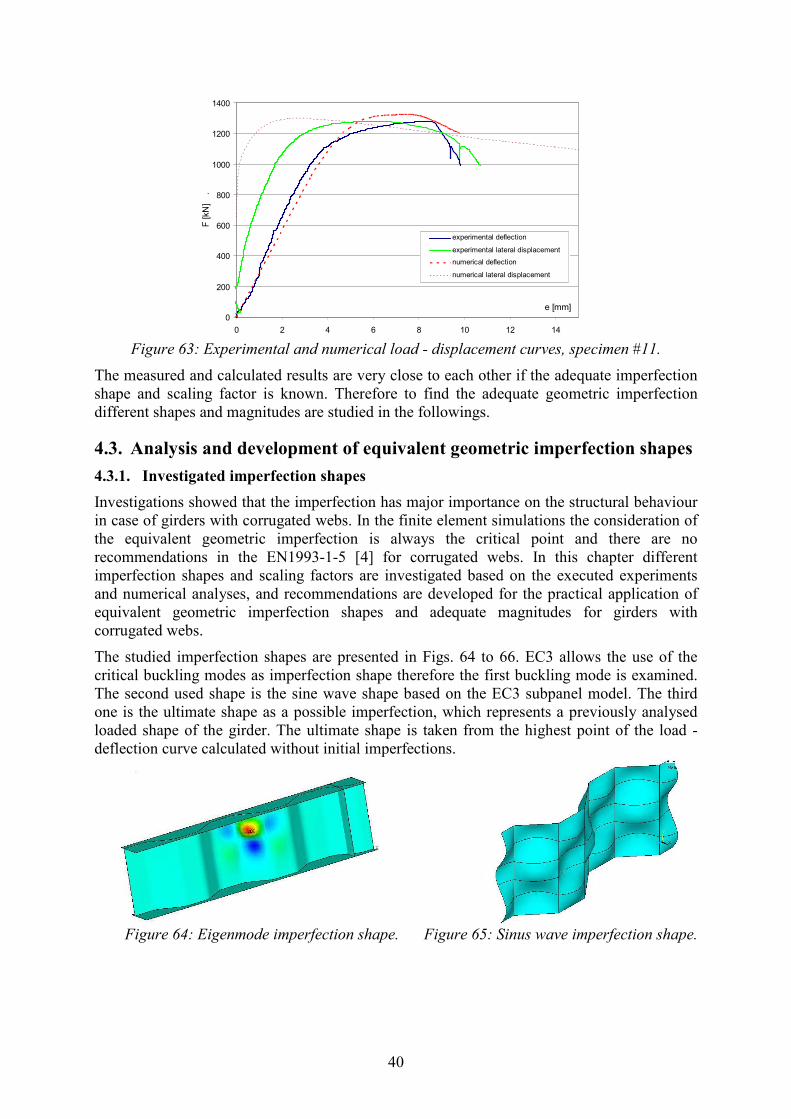
40
0
200
400
600
800
1000
1200
1400
0 2 4 6 8 10 12 14
e [mm]
F [kN] .
experimental deflection
experimental lateral displacement
numerical deflection
numerical lateral displacement
Figure 63: Experimental and numerical load - displacement curves, specimen #11.
The measured and calculated results are very close to each other if the adequate imperfection
shape and scaling factor is known. Therefore to find the adequate geometric imperfection
different shapes and magnitudes are studied in the followings.
4.3. Analysis and development of equivalent geometric imperfection shapes
4.3.1. Investigated imperfection shapes
Investigations showed that the imperfection has major importance on the structural behaviour
in case of girders with corrugated webs. In the finite element simulations the consideration of
the equivalent geometric imperfection is always the critical point and there are no
recommendations in the EN1993-1-5 [4] for corrugated webs. In this chapter different
imperfection shapes and scaling factors are investigated based on the executed experiments
and numerical analyses, and recommendations are developed for the practical application of
equivalent geometric imperfection shapes and adequate magnitudes for girders with
corrugated webs.
The studied imperfection shapes are presented in Figs. 64 to 66. EC3 allows the use of the
critical buckling modes as imperfection shape therefore the first buckling mode is examined.
The second used shape is the sine wave shape based on the EC3 subpanel model. The third
one is the ultimate shape as a possible imperfection, which represents a previously analysed
loaded shape of the girder. The ultimate shape is taken from the highest point of the load -
deflection curve calculated without initial imperfections.
Figure 64: Eigenmode imperfection shape. Figure 65: Sinus wave imperfection shape.
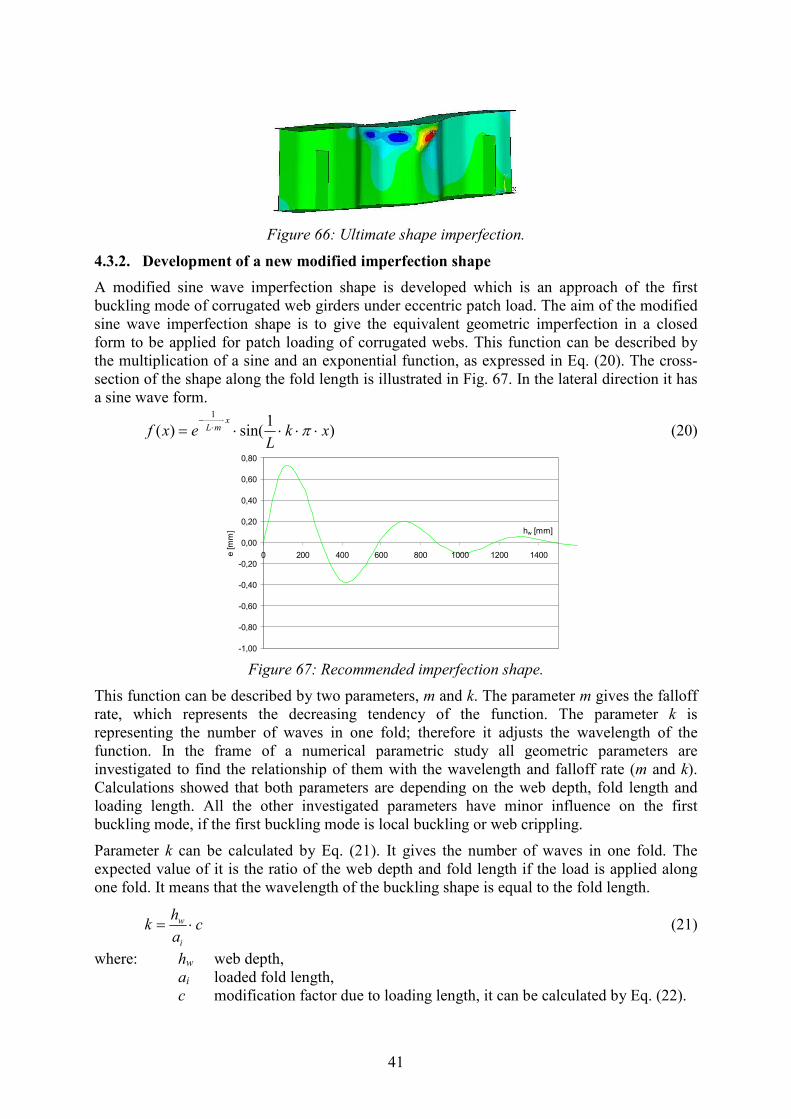
41
Figure 66: Ultimate shape imperfection.
4.3.2. Development of a new modified imperfection shape
A modified sine wave imperfection shape is developed which is an approach of the first
buckling mode of corrugated web girders under eccentric patch load. The aim of the modified
sine wave imperfection shape is to give the equivalent geometric imperfection in a closed
form to be applied for patch loading of corrugated webs. This function can be described by
the multiplication of a sine and an exponential function, as expressed in Eq. (20). The cross-
section of the shape along the fold length is illustrated in Fig. 67. In the lateral direction it has
a sine wave form.
)1
sin()(
1
xkL
exfx
mL ⋅⋅⋅⋅=⋅
⋅−
π (20)
-1,00
-0,80
-0,60
-0,40
-0,20
0,00
0,20
0,40
0,60
0,80
0 200 400 600 800 1000 1200 1400
hw [mm]
e [mm]
Figure 67: Recommended imperfection shape.
This function can be described by two parameters, m and k. The parameter m gives the falloff
rate, which represents the decreasing tendency of the function. The parameter k is
representing the number of waves in one fold; therefore it adjusts the wavelength of the
function. In the frame of a numerical parametric study all geometric parameters are
investigated to find the relationship of them with the wavelength and falloff rate (m and k).
Calculations showed that both parameters are depending on the web depth, fold length and
loading length. All the other investigated parameters have minor influence on the first
buckling mode, if the first buckling mode is local buckling or web crippling.
Parameter k can be calculated by Eq. (21). It gives the number of waves in one fold. The
expected value of it is the ratio of the web depth and fold length if the load is applied along
one fold. It means that the wavelength of the buckling shape is equal to the fold length.
ca
hk
i
w ⋅= (21)
where: hw web depth,
ai loaded fold length,
c modification factor due to loading length, it can be calculated by Eq. (22).

42
Calculations showed that if the applied loading length is smaller, the wavelength of the
buckling mode is also shorter than one fold length, and if the loading length is larger, the
wavelength is also larger, as it is illustrated in Fig. 68.
Figure 68: Buckling wavelengths in case of short and long loading lengths.
According to this observation k should be modified according to the ratio of the loading
length and fold length. The modification factor can be read from the diagram in Fig 69, or it
can be calculated by Eq. (22).
0,6
0,7
0,8
0,9
1
1,1
1,2
1,3
1,4
0 0,2 0,4 0,6 0,8 1 1,2 1,4 1,6 1,8 2ss / a1
c .
a1/tw=100
a1/tw=83
a1/tw=67
a1/tw=50
a1/tw=42
a1/tw=33
proposed approximation
Figure 69: Modification factor c.
95,015,015,2arctan1
+⋅
−⋅=
a
ssc (22)
The falloff rate depends also on the same three parameters as the wavelength. If the ratio of
the web depth and fold length is known, the ratio of the minimum and maximum values
(which are denoted by d) can be read from the diagram of Fig. 70, or it can be calculated by
Eqs. (23) and (24). The ratio of the minimum and maximum values leads to 1, if the web
depth is much longer than the fold length. If the web depth is smaller, the falloff rate of the
buckling mode will be more dominant and the relationship can be expressed by Eqs. (23) and
(24).
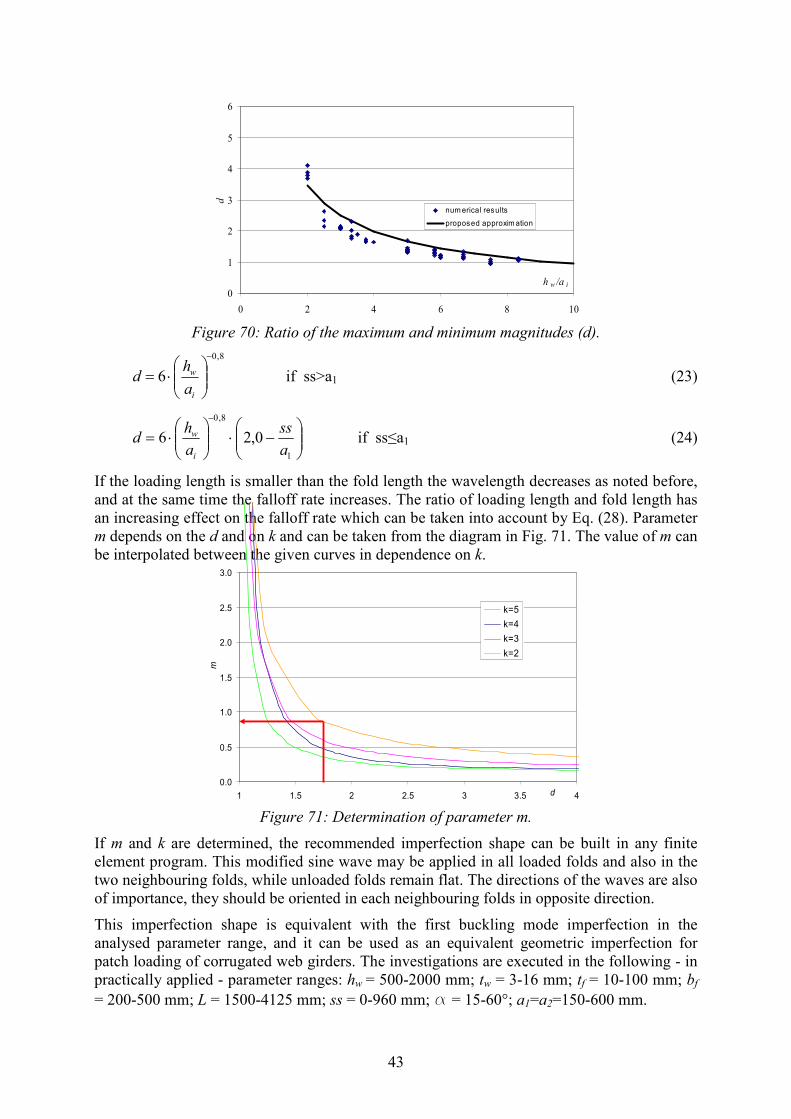
43
0
1
2
3
4
5
6
0 2 4 6 8 10
h w /a i
dnumerical results
proposed approximation
Figure 70: Ratio of the maximum and minimum magnitudes (d).
8,0
6
−
⋅=
i
w
a
hd if ss>a1 (23)
−⋅
⋅=
−
1
8,0
0,26a
ss
a
hd
i
w if ss≤a1 (24)
If the loading length is smaller than the fold length the wavelength decreases as noted before,
and at the same time the falloff rate increases. The ratio of loading length and fold length has
an increasing effect on the falloff rate which can be taken into account by Eq. (28). Parameter
m depends on the d and on k and can be taken from the diagram in Fig. 71. The value of m can
be interpolated between the given curves in dependence on k.
0.0
0.5
1.0
1.5
2.0
2.5
3.0
1 1.5 2 2.5 3 3.5 4d
m
k=5
k=4
k=3
k=2
Figure 71: Determination of parameter m.
If m and k are determined, the recommended imperfection shape can be built in any finite
element program. This modified sine wave may be applied in all loaded folds and also in the
two neighbouring folds, while unloaded folds remain flat. The directions of the waves are also
of importance, they should be oriented in each neighbouring folds in opposite direction.
This imperfection shape is equivalent with the first buckling mode imperfection in the
analysed parameter range, and it can be used as an equivalent geometric imperfection for
patch loading of corrugated web girders. The investigations are executed in the following - in
practically applied - parameter ranges: hw = 500-2000 mm; tw = 3-16 mm; tf = 10-100 mm; bf
= 200-500 mm; L = 1500-4125 mm; ss = 0-960 mm; a = 15-60°; a1=a2=150-600 mm.

44
4.4. Analysis and development of equivalent geometric imperfection
magnitudes
4.4.1. Imperfection sensitivity analysis
Based on the executed tests recommendations are developed for the adequate imperfection
magnitude in the case of all analysed imperfection shapes. Imperfection sensitivity is studied
for all test specimens and numerical calculations are compared to the measured patch loading
resistances. From the intersection points of the calculated and measured resistances the
necessary imperfection magnitudes are determined. The results of the imperfection sensitivity
analysis are shown in the case of two tested girders in Figs. 72 and 73.
1020
1040
1060
1080
1100
1120
1140
1160
1180
-2 -1,5 -1 -0,5 0 0,5 1 1,5 2
imperfection size [mm]
F [kN]
sin(x) shape
1. buckling mode
ultimate shape
experimental result
Figure 72: Imperfection sensitivity diagram - symmetrical case (inclined fold loaded).
Figure 72 shows the imperfection sensitivity analysis if the loaded fold is an inclined one. In
this case the loaded cross-section is symmetric; therefore the imperfection sensitivity diagram
is also symmetrical. The light blue dotted curve shows the imperfection sensitivity if sine
wave shape is used as equivalent geometric imperfection, the dark blue solid curve belongs to
the first buckling mode and the green dotted one to the ultimate shape imperfection. The
diagram shows that the ultimate shape imperfection gives the lowest and the sine wave shape
the largest resistance. The red horizontal line means the measured resistance during the test.
From the intersection points the necessary imperfection magnitude can be determined.
According to this diagram the largest imperfection is needed in the case of the sine wave
shape imperfection and the smallest by the ultimate shape imperfection.
If the parallel fold is loaded the pertinent cross-section is asymmetrical, therefore the
imperfection sensitivity diagram is also asymmetrical. The reason of this is the imperfection
direction.
1000
1050
1100
1150
1200
1250
1300
-2 -1,5 -1 -0,5 0 0,5 1 1,5 2
imperfection size [mm]
F [kN]
ultimate shape
1. buckling mode
sin(x) shape
experimental result
Figure 73: Imperfection sensitivity diagram - asymmetrical case (parallel fold loaded).
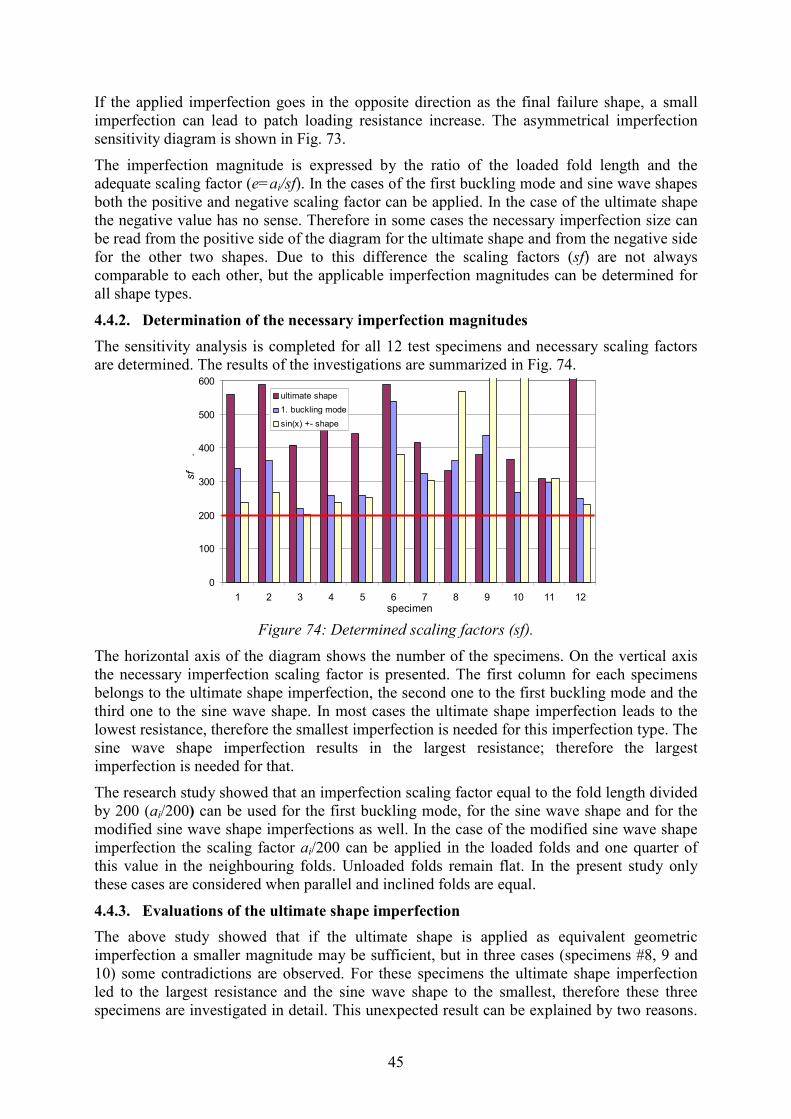
45
If the applied imperfection goes in the opposite direction as the final failure shape, a small
imperfection can lead to patch loading resistance increase. The asymmetrical imperfection
sensitivity diagram is shown in Fig. 73.
The imperfection magnitude is expressed by the ratio of the loaded fold length and the
adequate scaling factor (e=ai/sf). In the cases of the first buckling mode and sine wave shapes
both the positive and negative scaling factor can be applied. In the case of the ultimate shape
the negative value has no sense. Therefore in some cases the necessary imperfection size can
be read from the positive side of the diagram for the ultimate shape and from the negative side
for the other two shapes. Due to this difference the scaling factors (sf) are not always
comparable to each other, but the applicable imperfection magnitudes can be determined for
all shape types.
4.4.2. Determination of the necessary imperfection magnitudes
The sensitivity analysis is completed for all 12 test specimens and necessary scaling factors
are determined. The results of the investigations are summarized in Fig. 74.
0
100
200
300
400
500
600
1 2 3 4 5 6 7 8 9 10 11 12specimen
sf .
ultimate shape
1. buckling mode
sin(x) +- shape
Figure 74: Determined scaling factors (sf).
The horizontal axis of the diagram shows the number of the specimens. On the vertical axis
the necessary imperfection scaling factor is presented. The first column for each specimens
belongs to the ultimate shape imperfection, the second one to the first buckling mode and the
third one to the sine wave shape. In most cases the ultimate shape imperfection leads to the
lowest resistance, therefore the smallest imperfection is needed for this imperfection type. The
sine wave shape imperfection results in the largest resistance; therefore the largest
imperfection is needed for that.
The research study showed that an imperfection scaling factor equal to the fold length divided
by 200 (ai/200) can be used for the first buckling mode, for the sine wave shape and for the
modified sine wave shape imperfections as well. In the case of the modified sine wave shape
imperfection the scaling factor ai/200 can be applied in the loaded folds and one quarter of
this value in the neighbouring folds. Unloaded folds remain flat. In the present study only
these cases are considered when parallel and inclined folds are equal.
4.4.3. Evaluations of the ultimate shape imperfection
The above study showed that if the ultimate shape is applied as equivalent geometric
imperfection a smaller magnitude may be sufficient, but in three cases (specimens #8, 9 and
10) some contradictions are observed. For these specimens the ultimate shape imperfection
led to the largest resistance and the sine wave shape to the smallest, therefore these three
specimens are investigated in detail. This unexpected result can be explained by two reasons.
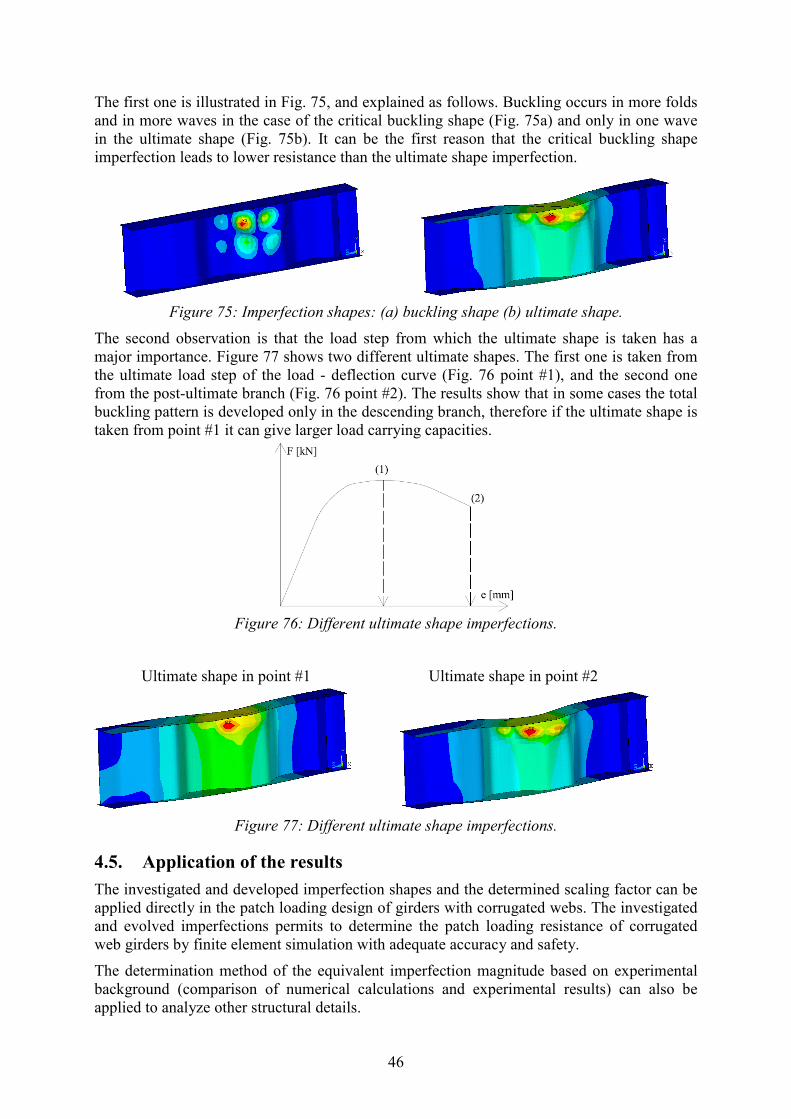
46
The first one is illustrated in Fig. 75, and explained as follows. Buckling occurs in more folds
and in more waves in the case of the critical buckling shape (Fig. 75a) and only in one wave
in the ultimate shape (Fig. 75b). It can be the first reason that the critical buckling shape
imperfection leads to lower resistance than the ultimate shape imperfection.
Figure 75: Imperfection shapes: (a) buckling shape (b) ultimate shape.
The second observation is that the load step from which the ultimate shape is taken has a
major importance. Figure 77 shows two different ultimate shapes. The first one is taken from
the ultimate load step of the load - deflection curve (Fig. 76 point #1), and the second one
from the post-ultimate branch (Fig. 76 point #2). The results show that in some cases the total
buckling pattern is developed only in the descending branch, therefore if the ultimate shape is
taken from point #1 it can give larger load carrying capacities.
Figure 76: Different ultimate shape imperfections.
Ultimate shape in point #1 Ultimate shape in point #2
Figure 77: Different ultimate shape imperfections.
4.5. Application of the results
The investigated and developed imperfection shapes and the determined scaling factor can be
applied directly in the patch loading design of girders with corrugated webs. The investigated
and evolved imperfections permits to determine the patch loading resistance of corrugated
web girders by finite element simulation with adequate accuracy and safety.
The determination method of the equivalent imperfection magnitude based on experimental
background (comparison of numerical calculations and experimental results) can also be
applied to analyze other structural details.
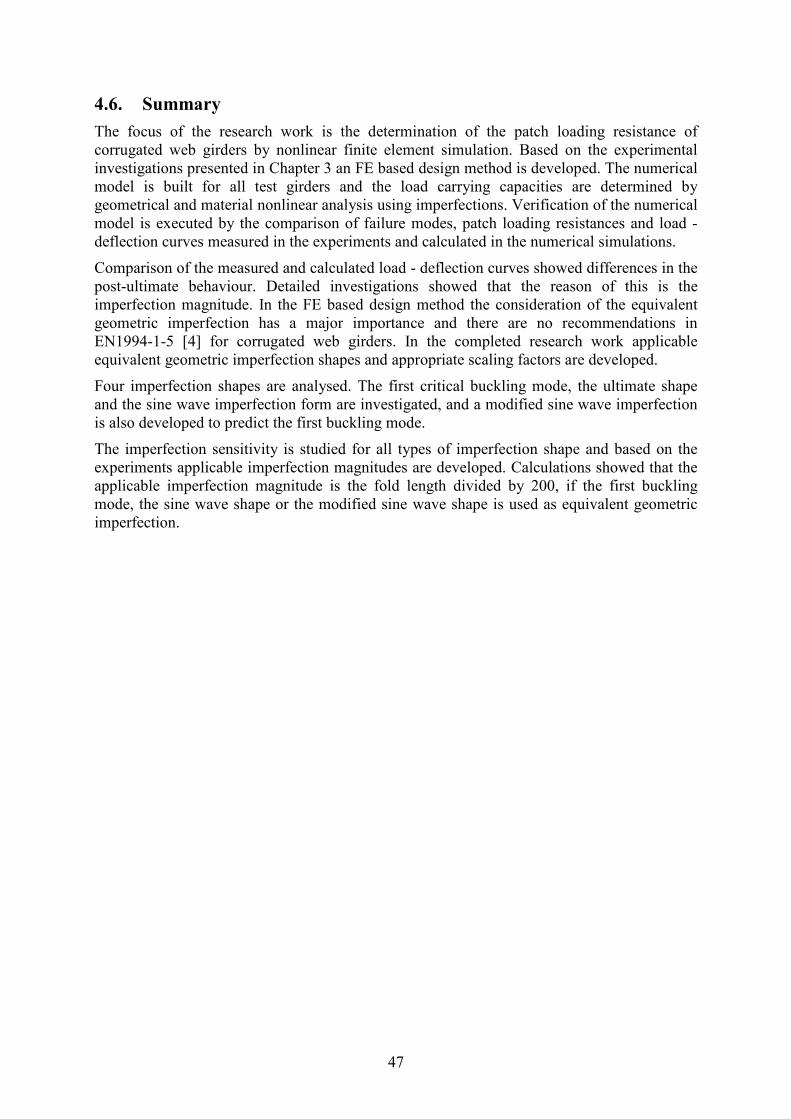
47
4.6. Summary
The focus of the research work is the determination of the patch loading resistance of
corrugated web girders by nonlinear finite element simulation. Based on the experimental
investigations presented in Chapter 3 an FE based design method is developed. The numerical
model is built for all test girders and the load carrying capacities are determined by
geometrical and material nonlinear analysis using imperfections. Verification of the numerical
model is executed by the comparison of failure modes, patch loading resistances and load -
deflection curves measured in the experiments and calculated in the numerical simulations.
Comparison of the measured and calculated load - deflection curves showed differences in the
post-ultimate behaviour. Detailed investigations showed that the reason of this is the
imperfection magnitude. In the FE based design method the consideration of the equivalent
geometric imperfection has a major importance and there are no recommendations in
EN1994-1-5 [4] for corrugated web girders. In the completed research work applicable
equivalent geometric imperfection shapes and appropriate scaling factors are developed.
Four imperfection shapes are analysed. The first critical buckling mode, the ultimate shape
and the sine wave imperfection form are investigated, and a modified sine wave imperfection
is also developed to predict the first buckling mode.
The imperfection sensitivity is studied for all types of imperfection shape and based on the
experiments applicable imperfection magnitudes are developed. Calculations showed that the
applicable imperfection magnitude is the fold length divided by 200, if the first buckling
mode, the sine wave shape or the modified sine wave shape is used as equivalent geometric
imperfection.

48
5. Patch loading resistance considering the loading width and
eccentricities
5.1. General
Eccentric patch loading is a research field where only a few investigations are conducted till
now, however during launching of the bridge structure eccentricities in the patch load are
unavoidable in practice. There is no standard design method to determine the resistance
reduction due to eccentricities and only a few investigations and research recommendations
can be found in the literature dealing with this topic even for flat web girders. There are no
available investigations dealing with corrugated web girders therefore a comprehensive
parametric study is executed in the frame of this thesis what is detailed in this Chapter. The
eccentric loading and the used notations are shown in Fig. 78.
Figure 78: Eccentric patch loading of corrugated web girders.
5.2. Review of previous investigations and research aims
In the last decades researchers investigated only scarcely this research field. All the previous
investigations are conducted on steel girders with flat webs and there are no available
investigations dealing with corrugated web girders. This Chapter gives a short overview about
the available research studies and their results. The applicability of these results is studied
from the point of view of bridge structures and corrugated web girders.
a. Research at the University of Stuttgart (1979)
Experimental research in the field of eccentric patch loading was started by Oxfort and Weber
in 1979 [23]. 6 tests were conducted on flat web I-girders and the effect of the eccentric patch
loading was studied. In the experiments the flange rotated along its longitudinal axis, and
therefore it ensured a softer support for the web plate. Due to the softer support conditions the
web buckled at a lower ultimate load level. Experiments showed that the resistance decrease
did not depend significantly on the flange size and the longitudinal web stiffener had a much
smaller efficiency in case of eccentric loading.
b. Research at the University of Maine (1988-1990)
Elgaaly and his team conducted a comprehensive experimental program on 35 steel I-girders
with flat webs under eccentric patch loading between 1988 and 1990 [24]-[26]. The
investigated parameters in the experiments are the loading mode (loading plate or loading
rod), the tf/tw, L/hw and e/bf ratios. Based on the experimental results the following conclusions
are published. If the load was applied through a loading plate (Fig. 79/a.), the failure mode
was in all cases web crippling and the eccentricity issued a relatively small effect on the load
carrying capacity. If the load was introduced through a loading rod, where the loading width
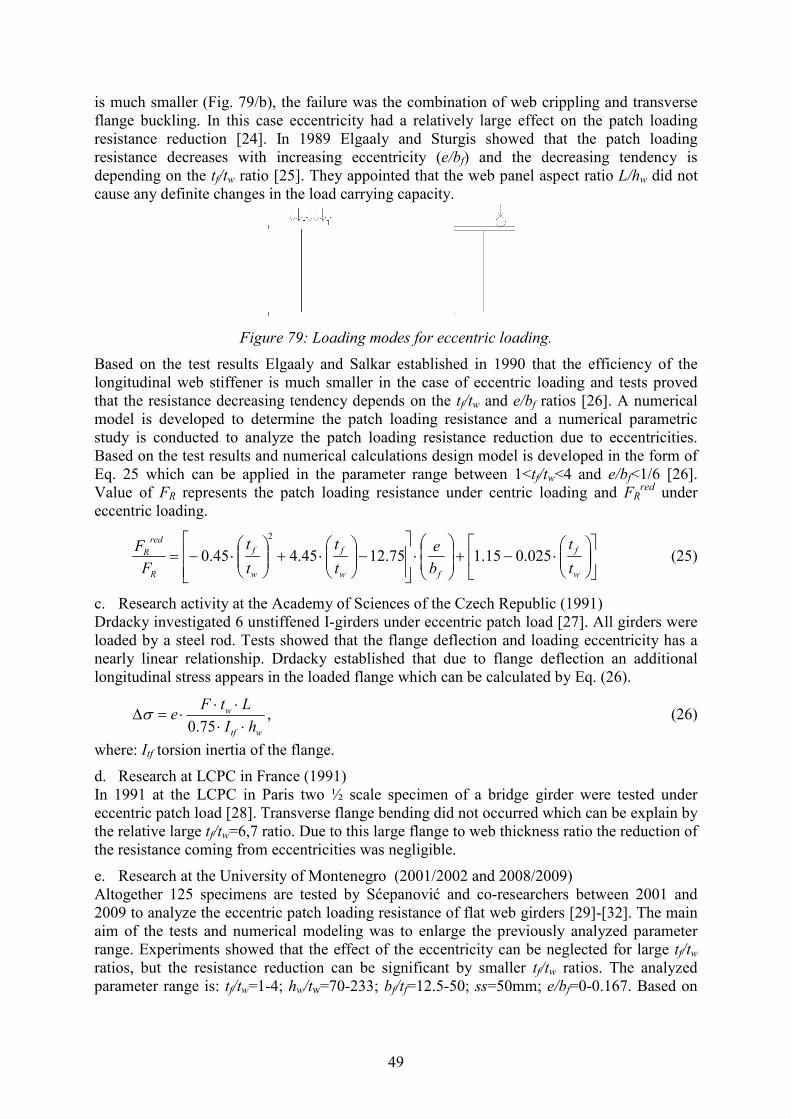
49
is much smaller (Fig. 79/b), the failure was the combination of web crippling and transverse
flange buckling. In this case eccentricity had a relatively large effect on the patch loading
resistance reduction [24]. In 1989 Elgaaly and Sturgis showed that the patch loading
resistance decreases with increasing eccentricity (e/bf) and the decreasing tendency is
depending on the tf/tw ratio [25]. They appointed that the web panel aspect ratio L/hw did not
cause any definite changes in the load carrying capacity.
Figure 79: Loading modes for eccentric loading.
Based on the test results Elgaaly and Salkar established in 1990 that the efficiency of the
longitudinal web stiffener is much smaller in the case of eccentric loading and tests proved
that the resistance decreasing tendency depends on the tf/tw and e/bf ratios [26]. A numerical
model is developed to determine the patch loading resistance and a numerical parametric
study is conducted to analyze the patch loading resistance reduction due to eccentricities.
Based on the test results and numerical calculations design model is developed in the form of
Eq. 25 which can be applied in the parameter range between 1<tf/tw<4 and e/bf<1/6 [26].
Value of FR represents the patch loading resistance under centric loading and FRred
under
eccentric loading.
⋅−+
⋅
−
⋅+
⋅−=
w
f
fw
f
w
f
R
red
R
t
t
b
e
t
t
t
t
F
F025.015.175.1245.445.0
2
(25)
c. Research activity at the Academy of Sciences of the Czech Republic (1991)
Drdacky investigated 6 unstiffened I-girders under eccentric patch load [27]. All girders were
loaded by a steel rod. Tests showed that the flange deflection and loading eccentricity has a
nearly linear relationship. Drdacky established that due to flange deflection an additional
longitudinal stress appears in the loaded flange which can be calculated by Eq. (26).
wtf
w
hI
LtFe
⋅⋅⋅⋅
⋅=∆75.0
σ , (26)
where: Itf torsion inertia of the flange.
d. Research at LCPC in France (1991)
In 1991 at the LCPC in Paris two ½ scale specimen of a bridge girder were tested under
eccentric patch load [28]. Transverse flange bending did not occurred which can be explain by
the relative large tf/tw=6,7 ratio. Due to this large flange to web thickness ratio the reduction of
the resistance coming from eccentricities was negligible.
e. Research at the University of Montenegro (2001/2002 and 2008/2009)
Altogether 125 specimens are tested by Sćepanović and co-researchers between 2001 and
2009 to analyze the eccentric patch loading resistance of flat web girders [29]-[32]. The main
aim of the tests and numerical modeling was to enlarge the previously analyzed parameter
range. Experiments showed that the effect of the eccentricity can be neglected for large tf/tw
ratios, but the resistance reduction can be significant by smaller tf/tw ratios. The analyzed
parameter range is: tf/tw=1-4; hw/tw=70-233; bf/tf=12.5-50; ss=50mm; e/bf=0-0.167. Based on

50
the test results numerical model was developed and the design method of Elgaaly et al. [26]
was further investigated and enhanced in the form of Eq. (27).
⋅−+
⋅
−
⋅+
⋅−=
w
f
fw
f
w
f
R
red
R
t
t
b
e
t
t
t
t
F
F0025.000.167.760.332.0
2
(27)
f. Evaluation of the previous studies and research aims
Previous studies showed if the transverse load is applied through a wide loading plate the
eccentricity has a negligible effect. If the loading width is small the eccentricity can lead to a
significant reduction of the patch loading resistance due to the flange torsion along its
longitudinal axis in case of I-girders with flat webs. Experiments showed that the effect of the
eccentricity by smaller tf/tw ratio is much larger than by larger tf/tw ratio. Taken this effect into
account Elgaaly et al. [26] developed an empirical design formula based on numerous test
results and numerical calculations. This design proposal was further investigated and
improved by Sćepanović et al. [32] based on a large number of test results. A comprehensive
literature overview in this topic can be found in [33].
Evaluating the previous studies considering the corrugated web girders the following
conclusions can be drawn. Only girders with flat webs were studied till now and there are no
available investigations dealing with corrugated web girders, therefore the main aim of the
current research activity is the extension of the research for corrugated web girders. In most of
the previous tests only short loading length was analyzed, however in case of bridges longer
loading lengths are usually applied.
Before analyzing the eccentricity the effect of the loading width is investigated. It should be
smaller than the flange width if eccentric load is introduced. Reduced loading width indicates
a reduction in the patch loading resistance as well, what should be considered in the design.
No investigations are available dealing with the effect of the loading width in the literature,
therefore a numerical parametric study is completed in this topic. Based on the numerical
calculations the parameters which have influence on the patch loading resistance are
separately investigated, tendencies of the results are determined and design proposal is
developed.
In the frame of a second numerical parametric study the patch loading reduction due to
loading eccentricities is analyzed. Based on the numerical calculations the structural
behaviour of corrugated web girders is studied. Observations and conclusions of the
numerical parametric study are summarized and a design method is proposed to determine the
patch loading resistance under eccentric loading.
5.3. Numerical modelling and structural behaviour
Calculations are executed on the same numerical model which are introduced in Chapter 4.
The applied finite element, the used material model and support conditions are the same as
detailed previously.
Figure 80: Finite element model.

51
The applied finite element mesh has the same density as in the case of the previous models
which are verified based on the experimental background. The applied equivalent geometric
imperfection in the nonlinear simulation is the recently determined (Sections 4.3. and 4.4.)
eigenform imperfection shape and magnitude. The finite element mesh of the numerical
model is shown in Fig. 80.
The structural behaviour and failure mechanism are studied under three different loading
conditions. These are centric patch loading along the whole flange width, along a smaller
loading width and under eccentric loading. Load-deflection and load-horizontal displacement
diagrams are studied and compared in the three analyzed cases in Fig. 81. Left side of the
diagram shows the load-deflection and the right side the load and horizontal displacement
relationships measured at the parallel web fold 100 mm below the load introduction place.
0
500
1000
1500
2000
2500
3000
3500
4000
4500
5000
0 0.5 1 1.5 2 2.5 3 3.5 4 4.5 5
ey [mm]
F [kN]
centric patch loading along full
flange widthcentric patch loading with loading
width ssa=0.5 bf eccentric patch loading with
e/bf=0.25
1
1
1
24
2
2
3
3
4
4
3
0
500
1000
1500
2000
2500
3000
3500
4000
4500
5000
-25 -20 -15 -10 -5 0 5
ex [mm]
F [kN]
centric patch loading along full
flange width
centric patch loading with
loading width ssa= 0.5 bf
eccentric patch loading with
e/bf=0.25
1
1
1
2
2
3
34
4
24 3
load – deflection diagram load – lateral displacement diagram
Figure 81: Comparison of the different loading conditions.
The blue thick curves represent the structural behaviour under centric patch load introduced
along the whole flange width. This is the previously investigated and determined structural
behaviour presented and detailed in Sections 2.4.1. ; 3.3. and 4.2. The marked points have the
same meaning as presented before. Point #1 means first yielding in the flange or in the web.
Point #2 presents the situation where 2 plastic hinges in the flange and a continuous yield line
in the web is developed. Point #3 is the starting point of the 3. and 4. plastic hinge
developments in the flange, and they are completely developed at Point #4.
The thick green curves show the structural behaviour if the applied loading width is smaller
than the flange width. The presented diagram and the observed failure modes proved that
there are no significant differences in the failure mechanism if the applied loading width is
shorter. The tendency of the two curves are the same only the first yielding in the flange and
web plates and the plastic hinge developments evolve at lower load levels. It can be explained
by the fact that if the loading width is narrower the applied load is more concentrated and it
leads to earlier yielding. Ultimate load decreasing degree depends on the degree of
concentricity (ssa/bf)
The red curves show the structural behaviour under eccentric loading. It has a different
character than the another two curves. The linear part of the diagram has the same gradient, it
means that there are no differences in the elastic behaviour but the first yielding occurs at a
lower load level, the load carrying capacity is also smaller and the post-ultimate behaviour
changes as well. The gradient of the post-ultimate branch is smaller than in the first two cases.
To get the reason for it the structural behaviour of the post-ultimate branch is investigated in
details. In the descending branch the 3. and 4. plastic hinges develop and yielding extends to a
large web area. No differences are found in the yield pattern or yield extension in the web
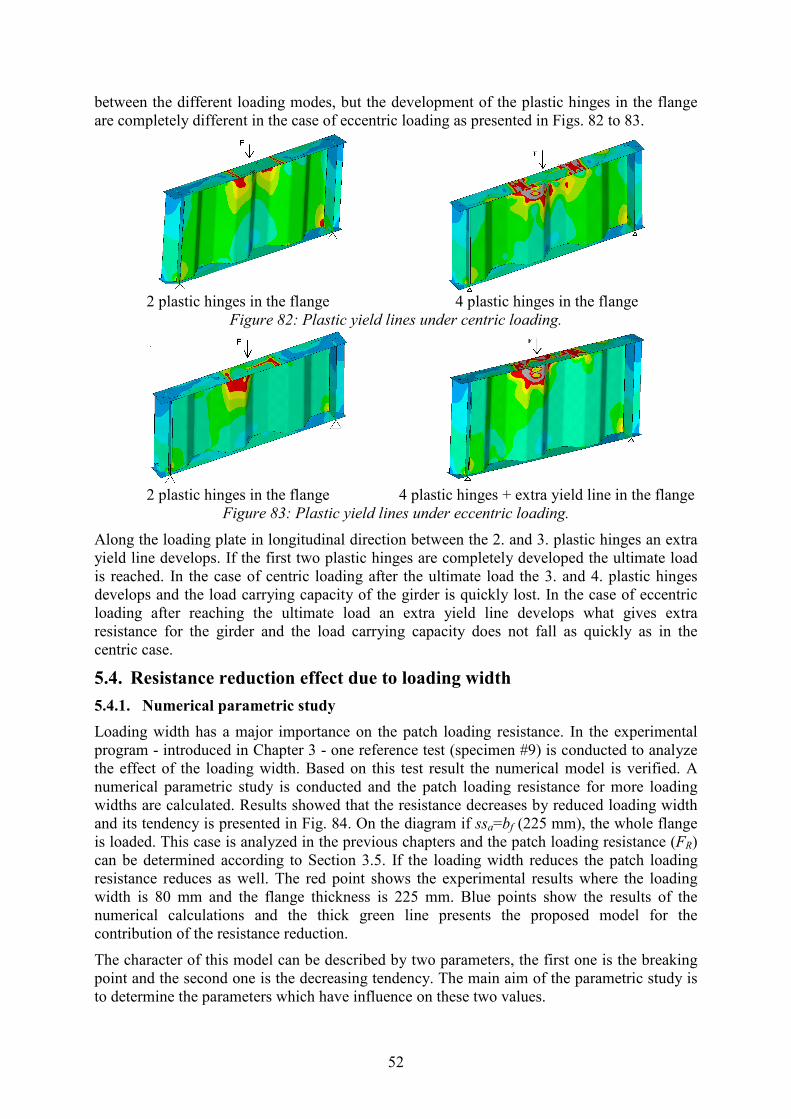
52
between the different loading modes, but the development of the plastic hinges in the flange
are completely different in the case of eccentric loading as presented in Figs. 82 to 83.
2 plastic hinges in the flange 4 plastic hinges in the flange
Figure 82: Plastic yield lines under centric loading.
2 plastic hinges in the flange 4 plastic hinges + extra yield line in the flange
Figure 83: Plastic yield lines under eccentric loading.
Along the loading plate in longitudinal direction between the 2. and 3. plastic hinges an extra
yield line develops. If the first two plastic hinges are completely developed the ultimate load
is reached. In the case of centric loading after the ultimate load the 3. and 4. plastic hinges
develops and the load carrying capacity of the girder is quickly lost. In the case of eccentric
loading after reaching the ultimate load an extra yield line develops what gives extra
resistance for the girder and the load carrying capacity does not fall as quickly as in the
centric case.
5.4. Resistance reduction effect due to loading width
5.4.1. Numerical parametric study
Loading width has a major importance on the patch loading resistance. In the experimental
program - introduced in Chapter 3 - one reference test (specimen #9) is conducted to analyze
the effect of the loading width. Based on this test result the numerical model is verified. A
numerical parametric study is conducted and the patch loading resistance for more loading
widths are calculated. Results showed that the resistance decreases by reduced loading width
and its tendency is presented in Fig. 84. On the diagram if ssa=bf (225 mm), the whole flange
is loaded. This case is analyzed in the previous chapters and the patch loading resistance (FR)
can be determined according to Section 3.5. If the loading width reduces the patch loading
resistance reduces as well. The red point shows the experimental results where the loading
width is 80 mm and the flange thickness is 225 mm. Blue points show the results of the
numerical calculations and the thick green line presents the proposed model for the
contribution of the resistance reduction.
The character of this model can be described by two parameters, the first one is the breaking
point and the second one is the decreasing tendency. The main aim of the parametric study is
to determine the parameters which have influence on these two values.
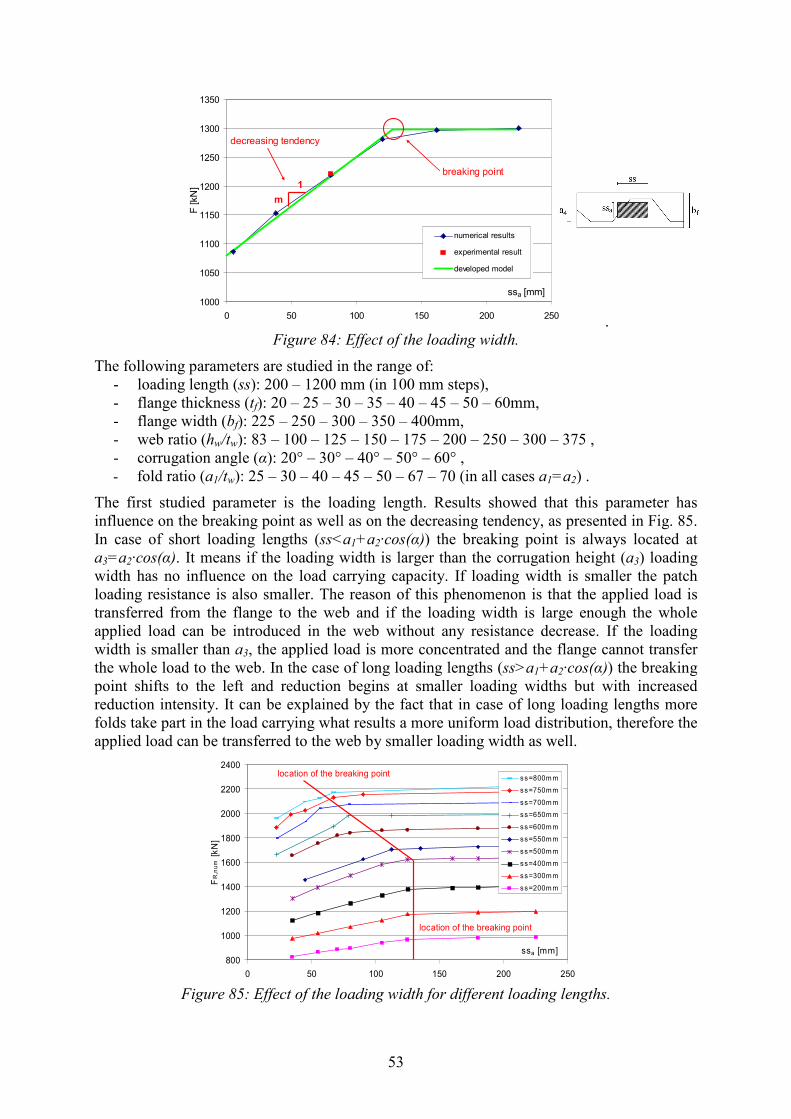
53
1000
1050
1100
1150
1200
1250
1300
1350
0 50 100 150 200 250
ssa [mm]
F [kN]
numerical results
experimental result
developed model
breaking point
decreasing tendency
m
1
.
Figure 84: Effect of the loading width.
The following parameters are studied in the range of:
- loading length (ss): 200 – 1200 mm (in 100 mm steps),
- flange thickness (tf): 20 – 25 – 30 – 35 – 40 – 45 – 50 – 60mm,
- flange width (bf): 225 – 250 – 300 – 350 – 400mm,
- web ratio (hw/tw): 83 – 100 – 125 – 150 – 175 – 200 – 250 – 300 – 375 ,
- corrugation angle (α): 20° – 30° – 40° – 50° – 60° ,
- fold ratio (a1/tw): 25 – 30 – 40 – 45 – 50 – 67 – 70 (in all cases a1=a2) .
The first studied parameter is the loading length. Results showed that this parameter has
influence on the breaking point as well as on the decreasing tendency, as presented in Fig. 85.
In case of short loading lengths (ss<a1+a2·cos(α)) the breaking point is always located at
a3=a2·cos(α). It means if the loading width is larger than the corrugation height (a3) loading
width has no influence on the load carrying capacity. If loading width is smaller the patch
loading resistance is also smaller. The reason of this phenomenon is that the applied load is
transferred from the flange to the web and if the loading width is large enough the whole
applied load can be introduced in the web without any resistance decrease. If the loading
width is smaller than a3, the applied load is more concentrated and the flange cannot transfer
the whole load to the web. In the case of long loading lengths (ss>a1+a2·cos(α)) the breaking
point shifts to the left and reduction begins at smaller loading widths but with increased
reduction intensity. It can be explained by the fact that in case of long loading lengths more
folds take part in the load carrying what results a more uniform load distribution, therefore the
applied load can be transferred to the web by smaller loading width as well.
800
1000
1200
1400
1600
1800
2000
2200
2400
0 50 100 150 200 250
ssa [mm]
FR,num [kN]
ss=800mm
ss=750mm
ss=700mm
ss=650mm
ss=600mm
ss=550mm
ss=500mm
ss=400mm
ss=300mm
ss=200mm
location of the breaking point
location of the breaking point
Figure 85: Effect of the loading width for different loading lengths.
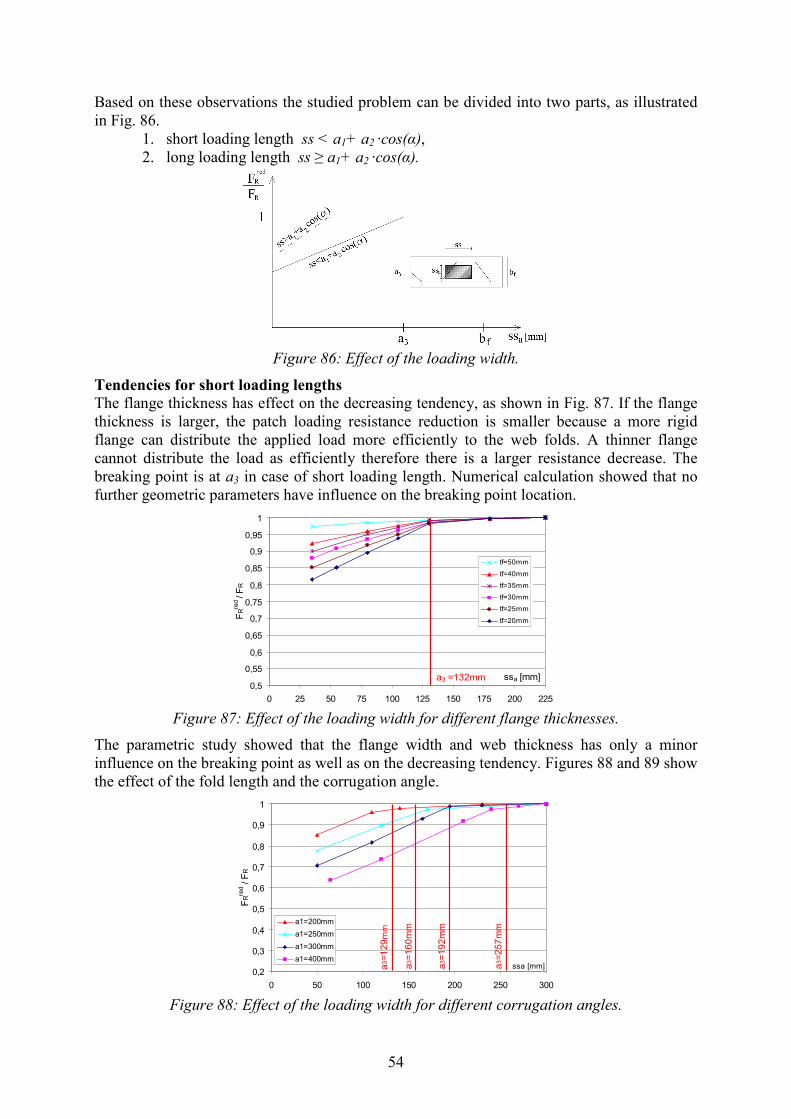
54
Based on these observations the studied problem can be divided into two parts, as illustrated
in Fig. 86.
1. short loading length ss < a1+ a2 ·cos(α),
2. long loading length ss ≥ a1+ a2 ·cos(α).
Figure 86: Effect of the loading width.
Tendencies for short loading lengths
The flange thickness has effect on the decreasing tendency, as shown in Fig. 87. If the flange
thickness is larger, the patch loading resistance reduction is smaller because a more rigid
flange can distribute the applied load more efficiently to the web folds. A thinner flange
cannot distribute the load as efficiently therefore there is a larger resistance decrease. The
breaking point is at a3 in case of short loading length. Numerical calculation showed that no
further geometric parameters have influence on the breaking point location.
0,5
0,55
0,6
0,65
0,7
0,75
0,8
0,85
0,9
0,95
1
0 25 50 75 100 125 150 175 200 225
ssa [mm]
FRred / FR
tf=50mm
tf=40mm
tf=35mm
tf=30mm
tf=25mm
tf=20mm
a3 =132mm
Figure 87: Effect of the loading width for different flange thicknesses.
The parametric study showed that the flange width and web thickness has only a minor
influence on the breaking point as well as on the decreasing tendency. Figures 88 and 89 show
the effect of the fold length and the corrugation angle.
0,2
0,3
0,4
0,5
0,6
0,7
0,8
0,9
1
0 50 100 150 200 250 300
ssa [mm]
FRred / F
R
a1=200mm
a1=250mm
a1=300mm
a1=400mm
a3=129mm
a3=160mm
a3=192mm
a3=257mm
Figure 88: Effect of the loading width for different corrugation angles.
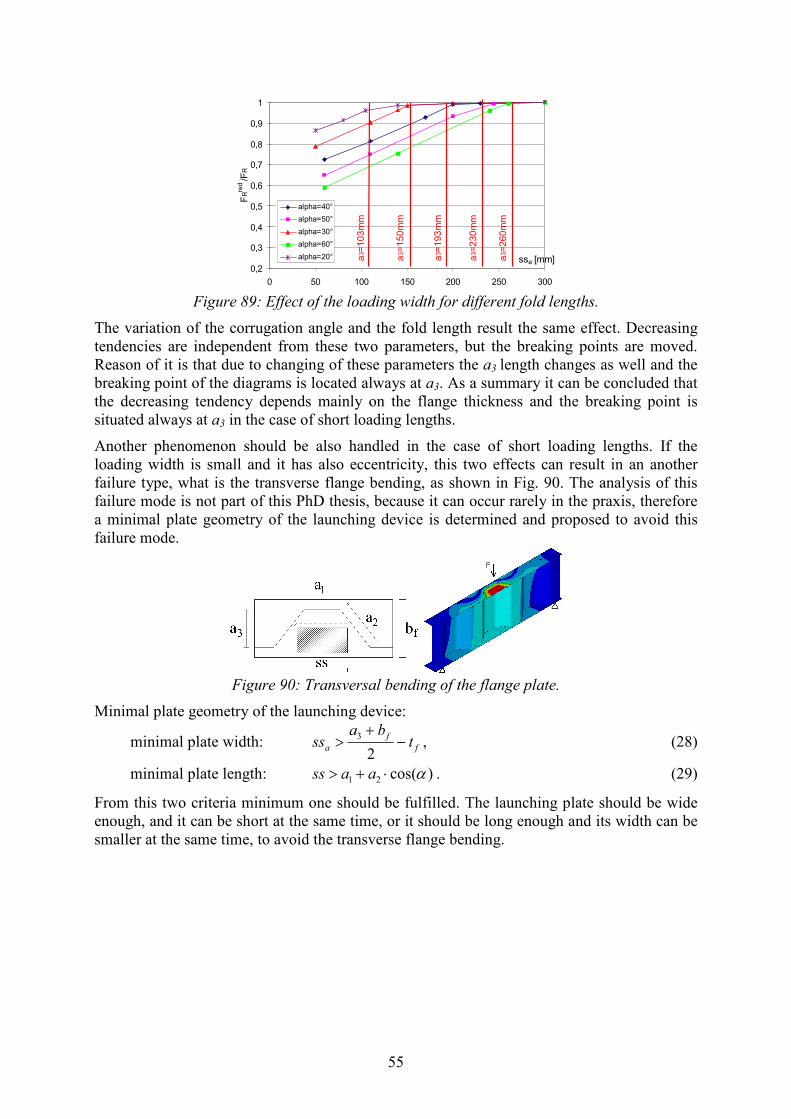
55
0,2
0,3
0,4
0,5
0,6
0,7
0,8
0,9
1
0 50 100 150 200 250 300
ssa [mm]
FRred /F
R
alpha=40°
alpha=50°
alpha=30°
alpha=60°
alpha=20° a3=150mm
a3=103mm
a3=193mm
a3=230mm
a3=260mm
Figure 89: Effect of the loading width for different fold lengths.
The variation of the corrugation angle and the fold length result the same effect. Decreasing
tendencies are independent from these two parameters, but the breaking points are moved.
Reason of it is that due to changing of these parameters the a3 length changes as well and the
breaking point of the diagrams is located always at a3. As a summary it can be concluded that
the decreasing tendency depends mainly on the flange thickness and the breaking point is
situated always at a3 in the case of short loading lengths.
Another phenomenon should be also handled in the case of short loading lengths. If the
loading width is small and it has also eccentricity, this two effects can result in an another
failure type, what is the transverse flange bending, as shown in Fig. 90. The analysis of this
failure mode is not part of this PhD thesis, because it can occur rarely in the praxis, therefore
a minimal plate geometry of the launching device is determined and proposed to avoid this
failure mode.
Figure 90: Transversal bending of the flange plate.
Minimal plate geometry of the launching device:
minimal plate width: f
f
a tba
ss −+
>2
3, (28)
minimal plate length: )cos(21 α⋅+> aass . (29)
From this two criteria minimum one should be fulfilled. The launching plate should be wide
enough, and it can be short at the same time, or it should be long enough and its width can be
smaller at the same time, to avoid the transverse flange bending.
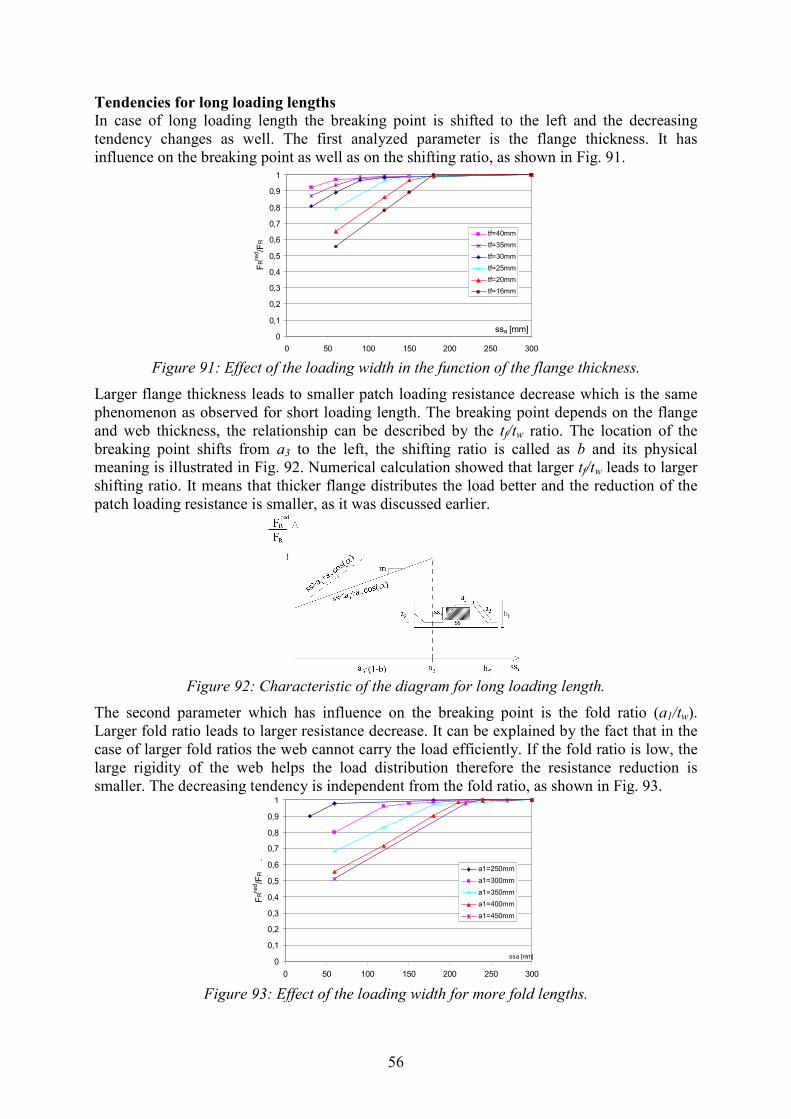
56
Tendencies for long loading lengths
In case of long loading length the breaking point is shifted to the left and the decreasing
tendency changes as well. The first analyzed parameter is the flange thickness. It has
influence on the breaking point as well as on the shifting ratio, as shown in Fig. 91.
0
0,1
0,2
0,3
0,4
0,5
0,6
0,7
0,8
0,9
1
0 50 100 150 200 250 300
ssa [mm]
FRred/F
R
tf=40mm
tf=35mm
tf=30mm
tf=25mm
tf=20mm
tf=16mm
Figure 91: Effect of the loading width in the function of the flange thickness.
Larger flange thickness leads to smaller patch loading resistance decrease which is the same
phenomenon as observed for short loading length. The breaking point depends on the flange
and web thickness, the relationship can be described by the tf/tw ratio. The location of the
breaking point shifts from a3 to the left, the shifting ratio is called as b and its physical
meaning is illustrated in Fig. 92. Numerical calculation showed that larger tf/tw leads to larger
shifting ratio. It means that thicker flange distributes the load better and the reduction of the
patch loading resistance is smaller, as it was discussed earlier.
Figure 92: Characteristic of the diagram for long loading length.
The second parameter which has influence on the breaking point is the fold ratio (a1/tw).
Larger fold ratio leads to larger resistance decrease. It can be explained by the fact that in the
case of larger fold ratios the web cannot carry the load efficiently. If the fold ratio is low, the
large rigidity of the web helps the load distribution therefore the resistance reduction is
smaller. The decreasing tendency is independent from the fold ratio, as shown in Fig. 93.
0
0,1
0,2
0,3
0,4
0,5
0,6
0,7
0,8
0,9
1
0 50 100 150 200 250 300
ssa [mm]
FRred/F
R .
a1=250mm
a1=300mm
a1=350mm
a1=400mm
a1=450mm
Figure 93: Effect of the loading width for more fold lengths.

57
It can be concluded that the decreasing tendency for long loading length is depending only on
the flange thickness as in the case of short loading length. The shifting ratio of the breaking
point from a3 however depends on the tf/tw and a1/tw ratios. The relationship of b, tf/tw and
a1/tw ratios is presented in Fig. 94.
-0.4
-0.2
0.0
0.2
0.4
0.6
0.8
1.0
0 1 2 3 4 5 6 7 8 9 10 11 12
tf/tw
b .
a1/tw=25
a1/tw=30
a1/tw=40
a1/tw=50
a1/tw=75
a1/tw=67
Figure 94: Shifting ratio in the function of fold and flange/web thickness ratio.
5.4.2. Design method development
Based on the results of 330 numerical simulations a design method is developed to consider
the resistance decreasing effect due to reduced loading width. The basis of the design method
is the model what is introduced in Fig. 92. The general form of the proposed design method is
formulated in Eq. (30). The parameters b and m are determined separately for short and long
loading lengths. The relationships between the two loading modes are determined and finally
the parameters are combined in one design method.
[ ]{ }aR
red
R ssbamFF −−⋅−⋅= ⋅ )1(1 3 (30)
where: FR : patch loading resistance if the full flange width is loaded, according to Section
3.5,
m: decreasing tendency,
a3: projected fold length; wave height of the corrugation profile,
b: shifting ratio of the breaking point,
ssa: loading width.
In the case of short loading length the breaking point is always located at a3, therefore the
shifting ratio is zero (b=0). The decreasing tendency for short loading length (m1) is linearly
depending on the flange thickness, as presented in Fig. 95/a and expressed in the form of Eq.
(31).
( ) 3
1 1005.08.2 −⋅⋅−= ftm tf is to be substituted in [mm]. (31)
In the case of long loading length the breaking point is shifted to the left and numerical
calculations showed that the shifting ratio depends on the tf/tw and a1/tw ratios. The results are
presented in the diagram of Fig. 94. For different a1/tw ratios the effect of the tf/tw ratio is
different. One line presented in Fig. 94. can be calculated by Eq. (32) in the function of c,
what depends on the a1/tw ratio, as expressed in Eq. (33).
2.01 −
−⋅=
w
f
t
tcb (32)
1
18
−
⋅=
wt
ac (33)
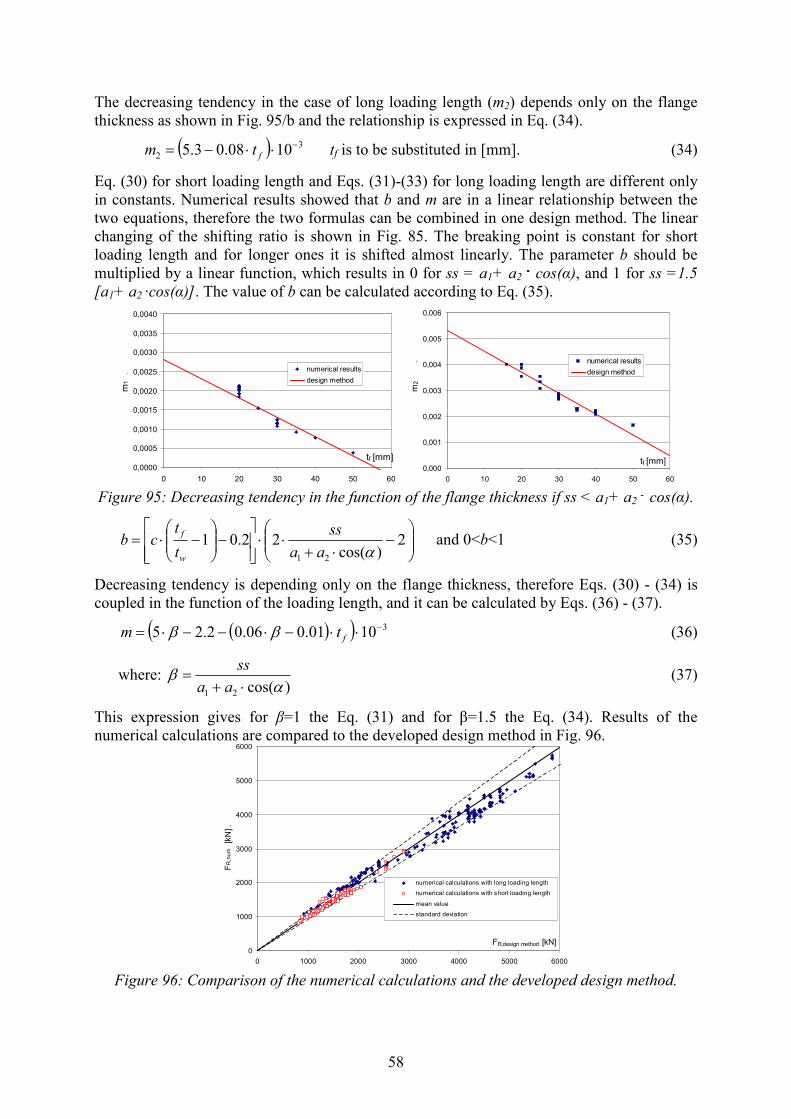
58
The decreasing tendency in the case of long loading length (m2) depends only on the flange
thickness as shown in Fig. 95/b and the relationship is expressed in Eq. (34).
( ) 3
2 1008.03.5 −⋅⋅−= ftm tf is to be substituted in [mm]. (34)
Eq. (30) for short loading length and Eqs. (31)-(33) for long loading length are different only
in constants. Numerical results showed that b and m are in a linear relationship between the
two equations, therefore the two formulas can be combined in one design method. The linear
changing of the shifting ratio is shown in Fig. 85. The breaking point is constant for short
loading length and for longer ones it is shifted almost linearly. The parameter b should be
multiplied by a linear function, which results in 0 for ss = a1+ a2 cos(α), and 1 for ss =1.5
[a1+ a2 ·cos(α)]. The value of b can be calculated according to Eq. (35).
0,0000
0,0005
0,0010
0,0015
0,0020
0,0025
0,0030
0,0035
0,0040
0 10 20 30 40 50 60
tf [mm]
m1 .
numerical results
design method
0,000
0,001
0,002
0,003
0,004
0,005
0,006
0 10 20 30 40 50 60
tf [mm]
m2 . numerical results
design method
Figure 95: Decreasing tendency in the function of the flange thickness if ss < a1+ a2 cos(α).
−
⋅+⋅⋅
−
−⋅= 2
)cos(22.01
21 αaa
ss
t
tcb
w
f and 0<b<1 (35)
Decreasing tendency is depending only on the flange thickness, therefore Eqs. (30) - (34) is
coupled in the function of the loading length, and it can be calculated by Eqs. (36) - (37).
( )( ) 31001.006.02.25 −⋅⋅−⋅−−⋅= ftm ββ (36)
where: )cos(21 α
β⋅+
=aa
ss (37)
This expression gives for β=1 the Eq. (31) and for β=1.5 the Eq. (34). Results of the
numerical calculations are compared to the developed design method in Fig. 96.
0
1000
2000
3000
4000
5000
6000
0 1000 2000 3000 4000 5000 6000
FR,design method [kN]
FR,num [kN] .
numerical calculations with long loading length
numerical calculations with short loading length
mean value
standard deviation
Figure 96: Comparison of the numerical calculations and the developed design method.
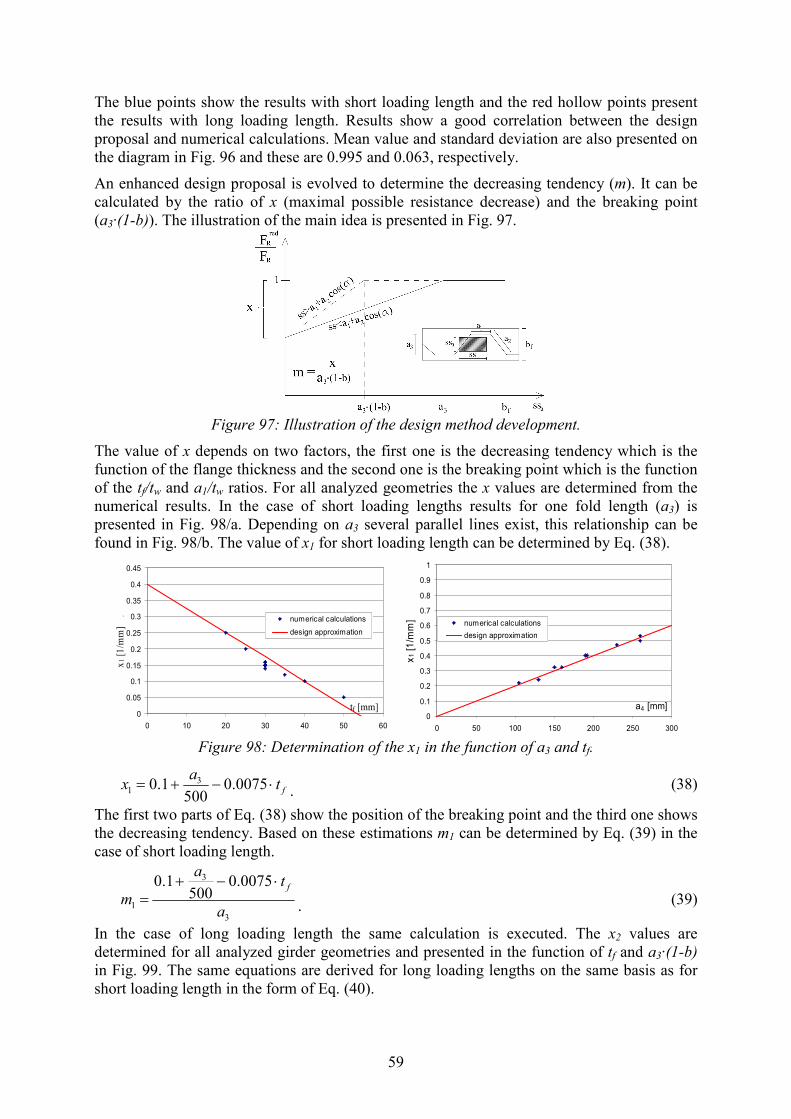
59
The blue points show the results with short loading length and the red hollow points present
the results with long loading length. Results show a good correlation between the design
proposal and numerical calculations. Mean value and standard deviation are also presented on
the diagram in Fig. 96 and these are 0.995 and 0.063, respectively.
An enhanced design proposal is evolved to determine the decreasing tendency (m). It can be
calculated by the ratio of x (maximal possible resistance decrease) and the breaking point
(a3·(1-b)). The illustration of the main idea is presented in Fig. 97.
Figure 97: Illustration of the design method development.
The value of x depends on two factors, the first one is the decreasing tendency which is the
function of the flange thickness and the second one is the breaking point which is the function
of the tf/tw and a1/tw ratios. For all analyzed geometries the x values are determined from the
numerical results. In the case of short loading lengths results for one fold length (a3) is
presented in Fig. 98/a. Depending on a3 several parallel lines exist, this relationship can be
found in Fig. 98/b. The value of x1 for short loading length can be determined by Eq. (38).
0
0.05
0.1
0.15
0.2
0.25
0.3
0.35
0.4
0.45
0 10 20 30 40 50 60
tf [mm]
x1 [
1/m
m]
. numerical calculations
design approximation
0
0.1
0.2
0.3
0.4
0.5
0.6
0.7
0.8
0.9
1
0 50 100 150 200 250 300
a4 [mm]
x1 [1/m
m]
numerical calculations
design approximation
Figure 98: Determination of the x1 in the function of a3 and tf.
fta
x ⋅−+= 0075.0500
1.0 31 . (38)
The first two parts of Eq. (38) show the position of the breaking point and the third one shows
the decreasing tendency. Based on these estimations m1 can be determined by Eq. (39) in the
case of short loading length.
3
3
1
0075.0500
1.0
a
ta
mf⋅−+
= . (39)
In the case of long loading length the same calculation is executed. The x2 values are
determined for all analyzed girder geometries and presented in the function of tf and a3·(1-b)
in Fig. 99. The same equations are derived for long loading lengths on the same basis as for
short loading length in the form of Eq. (40).

60
f3
2 t013.0350
)b1(a4.0x ⋅−
−⋅+= . (40)
The breaking point is expressed by the first two members of Eq. (40) and decreasing tendency
is determined by the third one. As x2 is known the slope of the diagram can be calculated by
Eq. (41).
)1(
013.0350
)1(4.0
3
3
2ba
tba
mf
−⋅
⋅−−⋅
+= . (41)
0.0
0.1
0.2
0.3
0.4
0.5
0.6
0.7
0.8
0.9
1.0
0 10 20 30 40 50 60
tf [mm]
x2 [1/m
m]
.
design approximation
a4(1-b)=150mm
a4(1-b)=180mm
a4(1-b)=120mm
0.0
0.1
0.2
0.3
0.4
0.5
0.6
0.7
0.8
0.9
1.0
0 50 100 150 200 250
a3 (1-b) [mm] x 2
[1/m
m]
numerical calculations
design approximation
Figure 99: Determination of x2 in the function of a3·(1-b) and tf.
Values of m1 and m2 can be also coupled in the function of the loading length on the same
way as detailed before because both equations have the same structure and only the constants
are different. The slope of the decreasing tendency can be expressed by Eqs. (42)-(43).
( )
)1(
0035.0011.0300800
)1(5.06.0
3
3
ba
tba
mf
−⋅
⋅−⋅−⋅−
−⋅+−⋅
=β
ββ
(42)
where: )cos(21 α
β⋅+
=aa
ss (43)
This expression gives for β=1 the Eq. (40) and for β=1.5 the Eq. (42). The value of the
breaking point and the shifting ratio b can de determined by the previously developed
expression Eq. (35). The modified design method is developed only for the decreasing
tendency determination. Results of the numerical calculations are compared to the developed
design method and the comparison is shown in Fig. 100. Diagram proves that this method is
equivalent by the previously developed one and it can be also used for corrugated web girders
with the same reliability. Mean value and standard deviation are 0.991 and 0.064,
respectively.
0
1000
2000
3000
4000
5000
6000
0 1000 2000 3000 4000 5000 6000
FR,design method [kN]
FR,num [kN] .
numerical calculations with long loading length
numerical calculations with short loading length
mean value
standard deviation
Figure 100: Comparison of the numerical results and the enhanced design method.

61
5.5. Resistance reduction due to loading eccentricity
5.5.1. Numerical parametric study
There are no available design recommendations for eccentric patch loading of corrugated web
girders, therefore a comprehensive parametric study is executed in frame of this research to
investigate the parameters which have influence on the patch loading resistance reduction due
to loading eccentricities. This Section introduces the results of the numerical calculations,
their evaluations and conclusions which are built in the design method.
Parameters which are studied in the numerical parametric study are the same as introduced in
the last sections. The studied parameter ranges cover the typical used values of the praxis. The
minimal loading plate size to avoid the transverse flange buckling gives a limit function for
the analyzed loading widths and lengths. These limit functions are introduced in Eqs. (28)-
(29). Investigation in the field of loading eccentricities is also separated into two parts based
on the loading length. If the loading length is short (ss < a1+ a2 cos(α)) the loading width
should be larger than the limit function of Eq. (28). In this case the applied eccentricity can be
small based on the assumption that the introduced load cannot slide down from the loaded
girder. Numerical calculations showed that the resistance reduction due to eccentric loading
remains under 5% in the analyzed parameter range. Conclusion can be drawn that the effect of
the loading eccentricity can be neglected if the loading length is short (ss < a1+ a2·cos(α)) and
the loading width is larger than expressed in Eq. (28). These results are illustrated in Fig. 101.
0
0,2
0,4
0,6
0,8
1
1,2
-0,15 -0,1 -0,05 0 0,05 0,1 0,15
e/bf
FRred2/F
Rred
tf/tw=2,5
tf/tw=2,0
tf/tw=1,5
tf/tw=3,75
tf/tw=3
Figure 101: Effect of the eccentric patch loading in the case of short loading length.
The further results and conclusions are valid for long loading lengths (ss > a1+ a2 cos(α)).
Numerical results showed that the effect of the eccentric patch loading depends on three
parameters in the case of corrugated web girders. The first one is the flange thickness. In the
case of flat web girders the effect was depending on tf/tw ratio according to the literature, but
in the case of corrugated web girders the tw has much smaller effect on the load carrying
capacity. The dominant parameter is the flange thickness. Figure 102 shows the resistance
reduction in the function of tf and tw. The diagram shows that the effect of the eccentricity
reduces with increasing flange thickness. The decreasing tendency is parabolic in the case of
smaller flange thicknesses (tf<20mm). Between 20<tf<40mm the relationship is nearly linear
and for larger flange thicknesses it has a square root function character. The same parametric
study is executed for different web and flange thicknesses (tw=6-8-10-12mm; tf=12-18-20-24-
30-36-40-48-50mm) and all calculation showed the same tendencies.
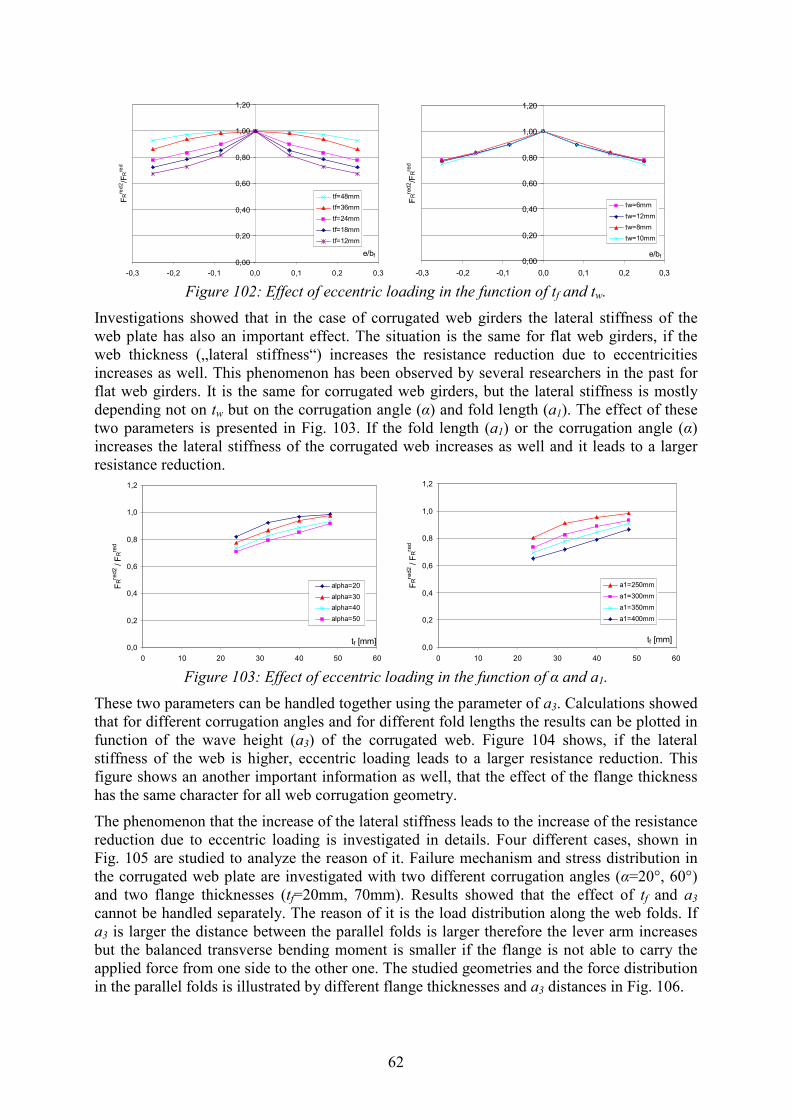
62
0,00
0,20
0,40
0,60
0,80
1,00
1,20
-0,3 -0,2 -0,1 0,0 0,1 0,2 0,3
e/bf
FRred2/F
Rred
tf=48mm
tf=36mm
tf=24mm
tf=18mm
tf=12mm
0,00
0,20
0,40
0,60
0,80
1,00
1,20
-0,3 -0,2 -0,1 0,0 0,1 0,2 0,3
e/bf
FRred2/F
Rred
tw=6mm
tw=12mm
tw=8mm
tw=10mm
Figure 102: Effect of eccentric loading in the function of tf and tw.
Investigations showed that in the case of corrugated web girders the lateral stiffness of the
web plate has also an important effect. The situation is the same for flat web girders, if the
web thickness („lateral stiffness“) increases the resistance reduction due to eccentricities
increases as well. This phenomenon has been observed by several researchers in the past for
flat web girders. It is the same for corrugated web girders, but the lateral stiffness is mostly
depending not on tw but on the corrugation angle (α) and fold length (a1). The effect of these
two parameters is presented in Fig. 103. If the fold length (a1) or the corrugation angle (α)
increases the lateral stiffness of the corrugated web increases as well and it leads to a larger
resistance reduction.
0,0
0,2
0,4
0,6
0,8
1,0
1,2
0 10 20 30 40 50 60
tf [mm]
FRred2 / F
Rred
alpha=20
alpha=30
alpha=40
alpha=50
0,0
0,2
0,4
0,6
0,8
1,0
1,2
0 10 20 30 40 50 60
tf [mm]
FRred2 / F
Rred
a1=250mm
a1=300mm
a1=350mm
a1=400mm
Figure 103: Effect of eccentric loading in the function of α and a1.
These two parameters can be handled together using the parameter of a3. Calculations showed
that for different corrugation angles and for different fold lengths the results can be plotted in
function of the wave height (a3) of the corrugated web. Figure 104 shows, if the lateral
stiffness of the web is higher, eccentric loading leads to a larger resistance reduction. This
figure shows an another important information as well, that the effect of the flange thickness
has the same character for all web corrugation geometry.
The phenomenon that the increase of the lateral stiffness leads to the increase of the resistance
reduction due to eccentric loading is investigated in details. Four different cases, shown in
Fig. 105 are studied to analyze the reason of it. Failure mechanism and stress distribution in
the corrugated web plate are investigated with two different corrugation angles (α=20°, 60°)
and two flange thicknesses (tf=20mm, 70mm). Results showed that the effect of tf and a3
cannot be handled separately. The reason of it is the load distribution along the web folds. If
a3 is larger the distance between the parallel folds is larger therefore the lever arm increases
but the balanced transverse bending moment is smaller if the flange is not able to carry the
applied force from one side to the other one. The studied geometries and the force distribution
in the parallel folds is illustrated by different flange thicknesses and a3 distances in Fig. 106.

63
0,0
0,2
0,4
0,6
0,8
1,0
1,2
0 10 20 30 40 50 60
tf [mm]
FRred2 / F
Rred
a4=257mm
a4=230mm
a4=225mm
a4=193mm
a4=161mm
a4=150mm
Figure 104: Resistance reduction due to eccentric loading in the function of a3.
Figure 105: Investigated geometries.
The first case shows if the a3 distance is relative small a thin flange can also distribute the
applied force between the web folds almost uniformly (F1Ed ≈ F2Ed). If the a3 distance is larger
and the flange thickness is small the loaded web fold has to carry a larger part of the applied
load (F2Ed<<F1Ed) which leads to a resistance decrease. If the flange thickness is larger the
stress distribution along the loaded web folds is more uniform and it leads to a larger patch
loading resistance and the girder has higher efficient against loading eccentricities. The stress
distribution along three web folds are presented in Fig. 106, studying two different a3
distances.
-450
-400
-350
-300
-250
-200
-150
-100
-50
0
0 100 200 300 400 500 600 700 800 900
l [mm]
s [M
Pa] .
alpha=20°
alpha=60°
ba c d
. Figure 106: Stress distribution along three web folds.
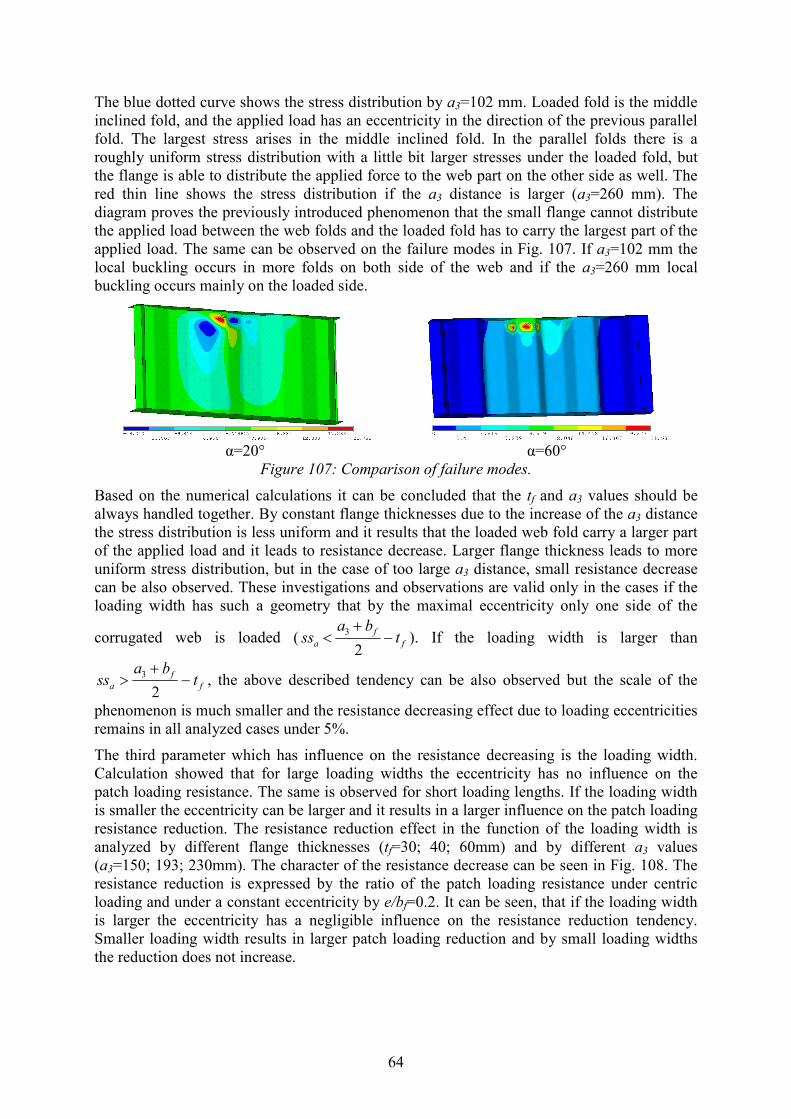
64
The blue dotted curve shows the stress distribution by a3=102 mm. Loaded fold is the middle
inclined fold, and the applied load has an eccentricity in the direction of the previous parallel
fold. The largest stress arises in the middle inclined fold. In the parallel folds there is a
roughly uniform stress distribution with a little bit larger stresses under the loaded fold, but
the flange is able to distribute the applied force to the web part on the other side as well. The
red thin line shows the stress distribution if the a3 distance is larger (a3=260 mm). The
diagram proves the previously introduced phenomenon that the small flange cannot distribute
the applied load between the web folds and the loaded fold has to carry the largest part of the
applied load. The same can be observed on the failure modes in Fig. 107. If a3=102 mm the
local buckling occurs in more folds on both side of the web and if the a3=260 mm local
buckling occurs mainly on the loaded side.
α=20° α=60°
Figure 107: Comparison of failure modes.
Based on the numerical calculations it can be concluded that the tf and a3 values should be
always handled together. By constant flange thicknesses due to the increase of the a3 distance
the stress distribution is less uniform and it results that the loaded web fold carry a larger part
of the applied load and it leads to resistance decrease. Larger flange thickness leads to more
uniform stress distribution, but in the case of too large a3 distance, small resistance decrease
can be also observed. These investigations and observations are valid only in the cases if the
loading width has such a geometry that by the maximal eccentricity only one side of the
corrugated web is loaded ( f
f
a tba
ss −+
<2
3). If the loading width is larger than
f
f
a tba
ss −+
>2
3, the above described tendency can be also observed but the scale of the
phenomenon is much smaller and the resistance decreasing effect due to loading eccentricities
remains in all analyzed cases under 5%.
The third parameter which has influence on the resistance decreasing is the loading width.
Calculation showed that for large loading widths the eccentricity has no influence on the
patch loading resistance. The same is observed for short loading lengths. If the loading width
is smaller the eccentricity can be larger and it results in a larger influence on the patch loading
resistance reduction. The resistance reduction effect in the function of the loading width is
analyzed by different flange thicknesses (tf=30; 40; 60mm) and by different a3 values
(a3=150; 193; 230mm). The character of the resistance decrease can be seen in Fig. 108. The
resistance reduction is expressed by the ratio of the patch loading resistance under centric
loading and under a constant eccentricity by e/bf=0.2. It can be seen, that if the loading width
is larger the eccentricity has a negligible influence on the resistance reduction tendency.
Smaller loading width results in larger patch loading reduction and by small loading widths
the reduction does not increase.
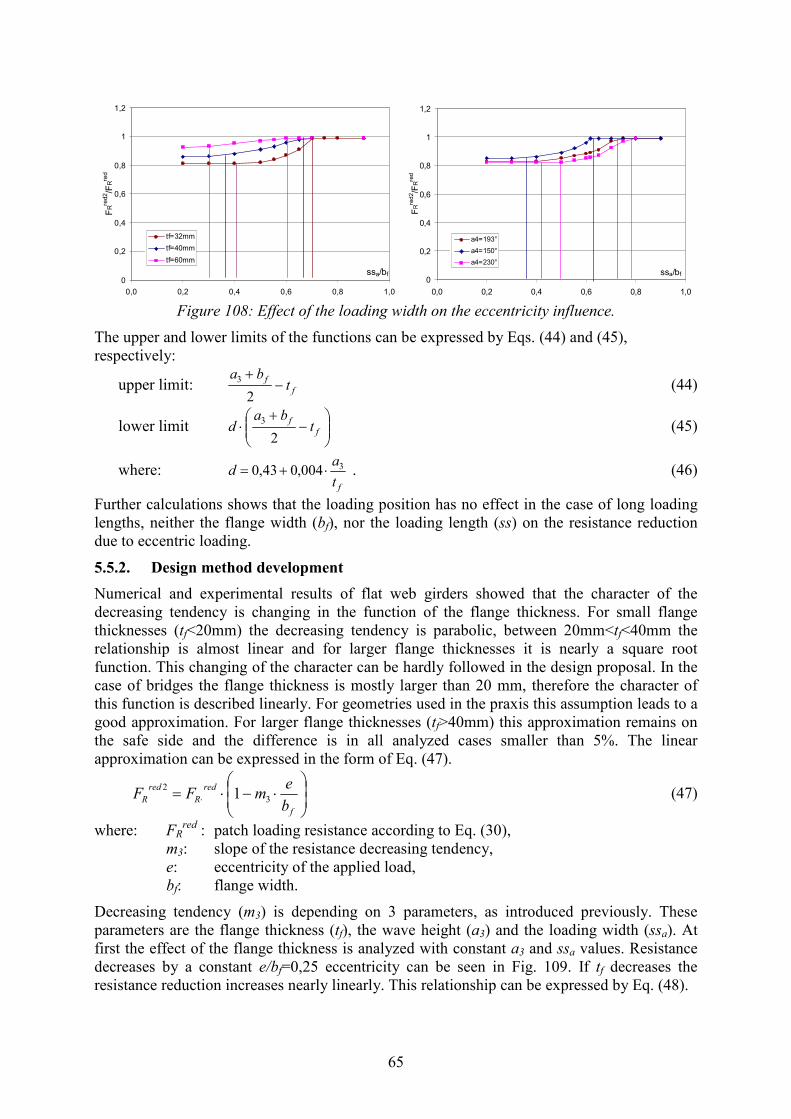
65
0
0,2
0,4
0,6
0,8
1
1,2
0,0 0,2 0,4 0,6 0,8 1,0
ssa/bf
FRred2/F
Rred
tf=32mm
tf=40mm
tf=60mm
0
0,2
0,4
0,6
0,8
1
1,2
0,0 0,2 0,4 0,6 0,8 1,0
ssa/bf
FRred2/F
Rred
a4=193°
a4=150°
a4=230°
Figure 108: Effect of the loading width on the eccentricity influence.
The upper and lower limits of the functions can be expressed by Eqs. (44) and (45),
respectively:
upper limit: f
ft
ba−
+
2
3 (44)
lower limit
−
+⋅ f
ft
bad
2
3 (45)
where: ft
ad 3004,043,0 ⋅+=
. (46)
Further calculations shows that the loading position has no effect in the case of long loading
lengths, neither the flange width (bf), nor the loading length (ss) on the resistance reduction
due to eccentric loading.
5.5.2. Design method development
Numerical and experimental results of flat web girders showed that the character of the
decreasing tendency is changing in the function of the flange thickness. For small flange
thicknesses (tf<20mm) the decreasing tendency is parabolic, between 20mm<tf<40mm the
relationship is almost linear and for larger flange thicknesses it is nearly a square root
function. This changing of the character can be hardly followed in the design proposal. In the
case of bridges the flange thickness is mostly larger than 20 mm, therefore the character of
this function is described linearly. For geometries used in the praxis this assumption leads to a
good approximation. For larger flange thicknesses (tf>40mm) this approximation remains on
the safe side and the difference is in all analyzed cases smaller than 5%. The linear
approximation can be expressed in the form of Eq. (47).
⋅−⋅= ⋅
f
red
R
red
Rb
emFF 3
21 (47)
where: FRred
: patch loading resistance according to Eq. (30),
m3: slope of the resistance decreasing tendency,
e: eccentricity of the applied load,
bf: flange width.
Decreasing tendency (m3) is depending on 3 parameters, as introduced previously. These
parameters are the flange thickness (tf), the wave height (a3) and the loading width (ssa). At
first the effect of the flange thickness is analyzed with constant a3 and ssa values. Resistance
decreases by a constant e/bf=0,25 eccentricity can be seen in Fig. 109. If tf decreases the
resistance reduction increases nearly linearly. This relationship can be expressed by Eq. (48).
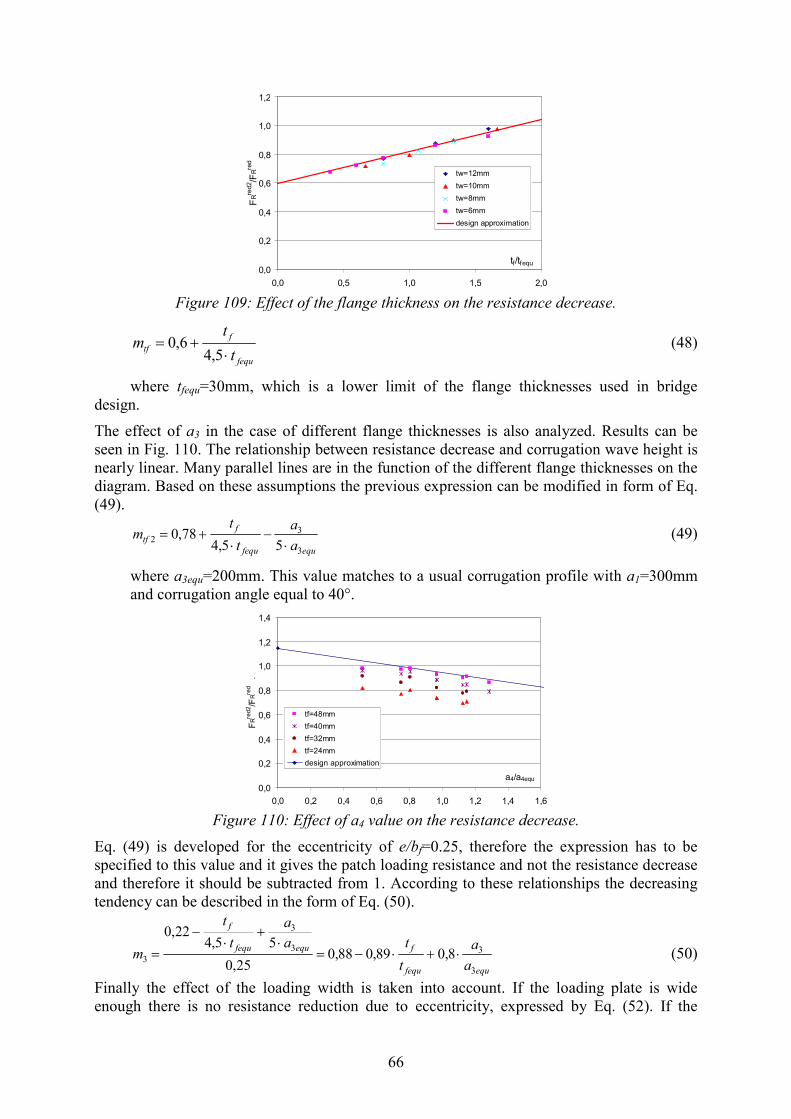
66
0,0
0,2
0,4
0,6
0,8
1,0
1,2
0,0 0,5 1,0 1,5 2,0
tf/tfequ FRred2/F
Rred
tw=12mm
tw=10mm
tw=8mm
tw=6mm
design approximation
Figure 109: Effect of the flange thickness on the resistance decrease.
fequ
f
tft
tm
⋅+=
5,46,0 (48)
where tfequ=30mm, which is a lower limit of the flange thicknesses used in bridge
design.
The effect of a3 in the case of different flange thicknesses is also analyzed. Results can be
seen in Fig. 110. The relationship between resistance decrease and corrugation wave height is
nearly linear. Many parallel lines are in the function of the different flange thicknesses on the
diagram. Based on these assumptions the previous expression can be modified in form of Eq.
(49).
equfequ
f
tfa
a
t
tm
3
32
55,478,0
⋅−
⋅+= (49)
where a3equ=200mm. This value matches to a usual corrugation profile with a1=300mm
and corrugation angle equal to 40°.
0,0
0,2
0,4
0,6
0,8
1,0
1,2
1,4
0,0 0,2 0,4 0,6 0,8 1,0 1,2 1,4 1,6
a4/a4equ
FRred2/F
Rred .
tf=48mm
tf=40mm
tf=32mm
tf=24mm
design approximation
Figure 110: Effect of a4 value on the resistance decrease.
Eq. (49) is developed for the eccentricity of e/bf=0.25, therefore the expression has to be
specified to this value and it gives the patch loading resistance and not the resistance decrease
and therefore it should be subtracted from 1. According to these relationships the decreasing
tendency can be described in the form of Eq. (50).
equfequ
fequfequ
f
a
a
t
ta
a
t
t
m3
33
3
3 8,089,088,025,0
55,422,0
⋅+⋅−=⋅
+⋅
−
=
(50)
Finally the effect of the loading width is taken into account. If the loading plate is wide
enough there is no resistance reduction due to eccentricity, expressed by Eq. (52). If the

67
loading width is small Eq. (54) can be applied. In the transition zone the decreasing tendency
can be determined by Eq. (53) which considers a linear changing due to loading width. The
general design proposal is summarized in Eqs. (51)-(55).
⋅−⋅=
f
red
R
red
Rb
emFF 3
21 (51)
where: 03 =m if: f
f
a tba
ss −+
>2
3 (52)
−
−−+
⋅
⋅+⋅−=
f
af
f
equfequ
f
ta
sstba
a
a
t
tm
2
28,089,088,03
3
3
33 if: f
f
af
ft
basst
bad −
+<<
−
+⋅
22
33
(53)
equ3
3
fequ
f3
a
a8,0
t
t89,088,0m ⋅+⋅−= if:
−
+⋅< f
f
a tba
dss2
3 (54)
where: ft
ad 3004,043,0 ⋅+= (55)
As a summary 250 numerical simulation results are compared to the proposed design method,
and results showed a good agreement. Comparison is presented in Fig. 111. Mean value and
standard deviation is also calculated and these are 1.01 and 0.05, respectively.
0
1000
2000
3000
4000
5000
6000
7000
0 1000 2000 3000 4000 5000 6000 7000
FR,design method [kN]
FR,num [kN] .
numerical calculations
mean value
standard deviation
Figure 111: Comparison of design method with numerical calculations.
5.6. Application of the results
Both developed design methods can be applied directly in the patch loading design of girders
with corrugated webs in the considered parameter range. The patch loading resistance can be
determined by the first proposed design method if the flange is partially loaded along its
flange width. The second design proposal determines the patch loading resistance under
eccentric loading. The determined tendencies and conclusions based on the numerical
parametric studies can also be used in the design of corrugated web girders.
5.7. Summary
The focus of the current research presented in this Chapter is the determination of the patch
loading resistance of corrugated web girders under eccentric transverse loading. Based on the
experimental background introduced in Chapter 3 a numerical model is developed and the
patch loading resistance is determined by nonlinear finite element simulation.
The structural behaviour and failure mechanism are studied under centric patch loading along
the whole flange width, along a smaller loading width and under eccentric loading. Load-
68
deflection and load-horizontal displacement diagrams are studied and compared in the three
analyzed cases. Failure mechanism under the centric loading are the same, only the first
yielding and the plastic hinge developments evolve at lower load levels due to the more
concentrated load introduction. The structural behaviour under eccentric loading has a
different character in the post-ultimate branch than under centric loading. The reason of it is
an extra yield line which develops in the descending branch along the loading plate in
longitudinal direction.
In the frame of numerical parametric studies the resistance decreasing effect due to reduced
loading width and loading eccentricity are investigated. Effect of each investigated geometric
parameters are determined and the resistance decreasing tendencies are appointed. If the
loading width reduces the patch loading resistance reduces as well. The character of the
reduction tendency can be described by two parameters, the first one is the breaking point and
the second one is the decreasing tendency of the resistance decreasing effect. In the case of
short loading length the decreasing tendency depends on the flange thickness and the breaking
point is situated always at a3. In the case of long loading length the decreasing tendency
depends on the flange thickness and the shifting ratio of the breaking point from a3 depends
on the tf/tw and a1/tw ratios. Based on the observed tendencies in the numerical parametric
study a design method is developed which takes the resistance decreasing effect due the
loading width into account.
In the frame of a second numerical parametric study parameters which have influence on the
resistance decreasing effect due to eccentric loading are determined. Numerical calculation
shows that the patch loading resistance decreases with increasing loading eccentricity. The
decreasing tendency is parabolic in the case of small flange thicknesses (tf<20mm). Between
20<tf<40mm the relationship is nearly linear and for larger flange thicknesses it has a square
root function character. Results showed that the effect of the eccentric patch loading depends
on three parameters in the case of corrugated web girders. The first one is the flange
thickness. The results show that the effect of the eccentricity reduces with increasing flange
thickness. In the case of corrugated web girders the lateral stiffness of the web plate has also
an important effect. If the lateral stiffness of the web is higher, eccentric loading leads to a
larger resistance reduction. The third parameter which has influence on the eccentric loading
is the loading width: for large loading widths the eccentricity has no influence on the patch
loading resistance. If the loading width is smaller the eccentricity can be larger and it results
in a larger influence on the patch loading resistance reduction.

69
6. Determination of the partial factor to the developed design
methods
6.1. General
Design methods introduced and developed in the previous chapters determine always the
mean value of the patch loading resistance. In the design of structures engineers calculate with
the design values therefore this Chapter focuses on the determination of the design resistance
levels. All design proposals introduced in this thesis are statistically evaluated. Mean values,
standard deviations and coefficient of variations are determined. Probability distribution
functions are developed and evaluated. EN1990 Annex D [34] gives a detailed determination
method of the partial factor if results are coming from experiments. If the resistance model is
developed based on numerical calculations its specialties can be considered in the statistical
evaluation method. These specialties are taken into account and based on the numerical and
experimental results the partial factors are determined.
6.2. Review of different determination methods of the partial factor
6.2.1. Determination methods according to EN1990 Annex D
EN1990 Annex D (Design assisted by testing) [34] gives a detailed description on the
determination of partial factors, if experimental results are available. There are two different
methods:
- statistical evaluation of a single property (EN1990 Annex D Chapter 7),
- statistical evaluation of a resistance model (EN1990 Annex D Chapter 8).
The first method can be applied if the analysed function depends only on one statistical
property (for example: material properties, geometric data, etc.). The second method can be
applied to determine the partial factor of a resistance model. A short overview about both
methods is given in the following.
Statistical evaluation of a single property (EN1990 Annex D Chapter 7)
This method can be applied to determine the partial factor of a single property. It means that
the studied function has only one statistical variable. The mean value, the standard deviation
and the 5% and 1% fractil values of the probability distribution function can be determined
according to the following expressions. In the case of a normal distribution these values can
be calculated by Eqs. (57)-(58).
characteristic value: ( )xnmeanRk VkFX ⋅−⋅= 1, (57)
design value: ( )xndmeanRd VkFX ⋅−⋅= ,, 1 (58)
where: Vx: coefficient of variation of the design resistance,
FR,mean: mean value of n samples of the design resistance,
kn: characteristic fractile factor
1.64, if β=3,8 and more than 30 experiments are available,
kd,n: design fractile factor
3.04, if β=3,8 and more than 30 experiments are available,
β: reliability index (3,8 for structures with 50 years reference
period in the reliability class RC2).
The partial factor (γM1) can be determined by Eq. (59), as the ratio of the characteristic and
design values.
( )( )xndmeanR
xnmeanR
d
kM
Vk
Vk
X
X
⋅−⋅
⋅−⋅==
,,
,
11F
1Fγ (59)

70
Statistical evaluation of resistance models (EC1990 Annex D Chapter 8)
EN1990 Annex D Chapter 8 [34] gives partial factor determination method if the resistance
model is calibrated by experimental results. This method has 7 steps.
1. Development of the design model.
2. Comparison of experimental and theoretical values. The vertical axis of the Fig. 112
shows the patch loading resistances according to the numerical calculations (FR,num) or
the experimental values (FR,exp). The vertical axis of the diagram illustrates the patch
loading resistances calculated by different design methods (FR,design_method).
Figure 112: Comparison of experimental and theoretical values, from [34].
3. Estimation of the mean value correction factor b.
If the resistance function results in the same values as the experimental or
numerical results, than all of the presented points would lie on a line with a gradient
of 45° (b=1.00). In the practice the points show some scatter giving the errors of
each results. Normally in the practice these points are located around a line which
gradient differs from 45°. The value b takes this difference into account.
∑∑ ⋅
=2
_,
_,,
methoddesignR
methoddesignRnumR
F
FFb (60)
4. Estimation of the coefficient of variation of the errors
If the gradient of the mean line (b) is known, errors of all results can be calculated
and statistically evaluated, as detailed in the following:
error term for each value: imethoddesignR
inumR
iFb
F
,_,
,,
⋅=δ (61)
logarithm of the error terms: ( )ii δln=∆ (62)
mean value of logarithm of the error terms: ∑=
∆⋅=∆n
i
in 1
1 (63)
standard deviation of the error terms: ( )∑=
∆ ∆−∆⋅−
=n
i
in
s1
22
1
1 (64)
coefficient of variation of the error terms: ( ) 1exp2 −= ∆sVδ (65)
5. Analysis of compatibility
It should be tested, that the mean value, standard deviation and coefficient of
variation are in the whole analysed parameter range approximately equal. It should
be checked that the resistance model works in the whole analyzed parameter range
with the same accuracy. If differences are larger the parameter which has the largest
influence on the scatter should be determined and investigated and the test results
may be split into subsets with respect to this parameters.

71
6. Determination of the coefficients of variation (Vxi) of the basic variables
The investigated resistance model depends on different variables. The coefficient of
variation of the basic variables in the resistance functions is determined in this
point.
7. Determination of the characteristic and design value of the resistance model
From the product of coefficient of variations given in point 4 and 6 the coefficient
of variation of the whole resistance model can be calculated by Eq. (66).
( ) ( ) 1111
222 −
+⋅+= ∏
=
n
j
Xir VVV δ (66)
Alternatively, for small values of Vδ2 and Vxi
2 the approximation of Eq. (67) can be
used.
∑=
⋅+=j
i
Xir VVV1
222
δ (67)
If a large number of tests (n>100) are available, the characteristic and design
resistances can be obtained from Eqs. (68)-(70). 25.0
_,,
QQk
methoddesignRkR eFbF⋅−⋅− ∞⋅⋅= (68)
2
, 5.0
_,,
QQk
methoddesignRdRdeFbF
⋅−⋅− ∞⋅⋅= (69)
where ( )1ln2 += rVQ (70)
k∞ is the value of kn for n→∞ (k∞=1.64),
kd,∞ is the value of kd,n for n→∞ (kd,∞=3.04).
The partial factor can be determined according to Eq. (71).
2,
2
5.0
_,
5.0
_,
,
,
1 QQk
methoddesignR
QQk
methoddesignR
dR
kR
MdeFb
eFb
F
F⋅−⋅−
⋅−⋅−
∞
∞
⋅⋅
⋅⋅==γ (71)
6.2.2. Modifications of the standardized determination method
The determination method of the partial factor according to EN1990 [34] is developed for
evaluation of resistance models based on the experimental results. If the developed resistance
model is based on numerical calculations the determination method of the probability
variables are different from the standardized method. This section introduces the modification
possibilities which are found in the literature.
The first possible modification proposal is found in the diploma thesis of Gabeler [35]
supervised by Mirambell/Chacón, UPC Barcelona and Kuhlmann/Braun, University of
Stuttgart on the topic of statistical evaluation of patch loading resistance models for welded
steel girders. Different design models of the patch loading resistance are investigated and
statistically evaluated. Gabeler used the standardized partial factor determination method
according to EN1990 Annex D [34] with a small modification. The modified method takes
into account that the resistance model is compared to numerical and not to experimental
results. The numerical calculations and the experimental results do not match exactly, there
are always differences. The mean value, standard deviation and coefficient of variation of
these differences are calculated and the results were taken into account in the coefficient of
variation of the whole resistance model by a newly introduced factor called as VFEM. This new
factor is implemented in Eq. (66) in form of Eq. (72).
( ) ( ) ( ) 11112
1
222 −+⋅
+⋅+= ∏
=FEM
n
j
Xir VVVV δ (72)

72
In the literature a detailed description can be found about the determination method of partial
factor for lateral torsional buckling of I-girders, made by Rebelo et al. [36] and L. da Silva et
al. [37]. Basis of the investigation was more than 1000 numerical calculations beside some
experimental results. Since the bases of the investigations were mainly numerical calculations,
the partial factor was separated into two parts as presented in Fig. 113 and in Eq. (73). γm
takes the material uncertainties into account and γRd covers the uncertainties of the resistance
model and the geometric deviations if these are not modeled explicitly. EN1990 [34]
considers the same separation methodology of the partial factor γM.
Figure 113: Separation of the partial factor according to EN1990.
The reason of the separation is, that the numerical model calculates with the given material
properties and geometry exactly, therefore the difference between the numerical and
experimental resistances does not consider their uncertainties and that they should be handled
separately.
Rdm
kR
M
kR
dR
FFF
γγγ ⋅== ,
1
,
,
(73)
γRd was determined for lateral torsional buckling of I-girders in [36] based on numerical
calculations and theoretical resistances, therefore it considers only the uncertainty of the
resistance model. Value of γm was determined separately in another article [37] based on
5000-6000 experimental results on material tests. The γm determination method does not take
the uncertainty of geometry and the finite element model into account.
6.2.3. Evaluation of the literature overview
All three literature sources give determination methods for partial factor, but all of them have
differences. The differences are summarized in Table 8. The first three rows of this table
consists the different methods found in the literature and the last row shows the methodology
used in this thesis. If the resistance model is developed based on experimental results the
separation of the γm and γRd is not reasonable as proposed in EN1990. But the design methods
studied in the current thesis are based mainly on numerical calculations; therefore γm and γRd
are determined separately similar as by Rebelo et al. [36] and L. da Silva et al. [37]. There are
some differences between numerical calculations and experimental results, what is taken into
account by a factor (VFEM) as introduced by Gabeler [35]. The third difference is that the
uncertainties of the geometry are also taken into account, because in the numerical model this
is not considered.
Table 8: Comparison of the different methods Method Based on
experiments
Based on FEM
VFEM developed
Separation of
γRd and γm
Uncertainty of
geometry
EN1990 Annex D � - - �
Gabeler - � - �
Rebelo et al - - � -
used method in
this thesis
- � � �
It seems important that all effects which are basically of importance in γM should be taken into
account. These are the followings:
- uncertainty of resistance model,
- uncertainty of material properties,

73
- uncertainty of geometry,
- uncertainty of numerical model.
All of these effects are taken into account in the determination of the partial factors to the
resistance models developed and introduced in the previous chapters (Chapter 3 and 5). All
three resistance models are investigated and statistically evaluated. At first the value of the γRd
is calculated by the single property method to get a rough estimation about the probability
distribution function of the design proposals and about the mean values and standard
deviations. Partial factors are also calculated to get a comparison background to the
evaluation of the resistance model method. The calculation with the single property method is
a rough estimation, therefore γRd is calculated by the multiple property method as well
according to EN1990 Annex D Chapter 8 [34] supplemented by the modifications presented
in Table 8, which takes all possible uncertainties into account.
The studied resistance models give the mean value of the patch loading resistances and not the
characteristic value. Therefore the ratio of the mean and design values is determined what is
signed by γRd* and it can be calculated in the form of Eq. (74).
2,
2, 5.05.0
_,
_,
,
,* 1QQkQQk
methoddesignR
methoddesignR
dR
meanR
Rddd eeFb
Fb
F
F
⋅−⋅−⋅−⋅− ∞∞=
⋅⋅
⋅==γ (74)
The mean value of the patch loading resistance calculated by the proposed design proposals
doesn’t coincide with the patch loading resistances of the numerical calculations or the
experimental values. This misalignment is expressed by the mean value correction factor b
and it can be taken into account in the partial factor γRd**
according to Eq. (75).
2, 5.0
*** 1
QQk
RdRd
debb ⋅−⋅− ∞⋅==
γγ (75)
After determination of γRd**
the value of γm is also determined, to allow to calculate the γM1**
(Eq. 76). The partial factor of the material uncertainties (γm) does not depend on design
methods, it is only depending on material properties, therefore it is taken here from literature.
mRdM γγγ ⋅= ****
1 (76)
6.3. Determination of partial factor of model uncertainties - γRd**
6.3.1. Background databases for the statistical evaluation
Three different design proposals are developed in the previous chapters of this thesis. General
closed forms are collected in Eqs. (77)-(79). The first equation gives the patch loading
resistance of corrugated web girders (FR) if the whole flange is loaded along the flange width.
The second one takes the effect of the loading width into account (FRred
) and the third one
considers the resistance reduction effect due to load eccentricities (FRred2
). The used notations
are introduced in the previous chapters.
αδδ kssftftMnF ywwywwplfR ⋅⋅⋅⋅+⋅⋅⋅⋅⋅= 2 (77)
[ ]{ }aR
red
R ssbamFF −−⋅⋅−⋅= )1(1 4 (78)
⋅−⋅=
f
red
R
red
Rb
emFF 3
21 (79)
The separation of these design models is important, because they depend on each other, it
means that the second design method refers to the first one and the third to the second one.
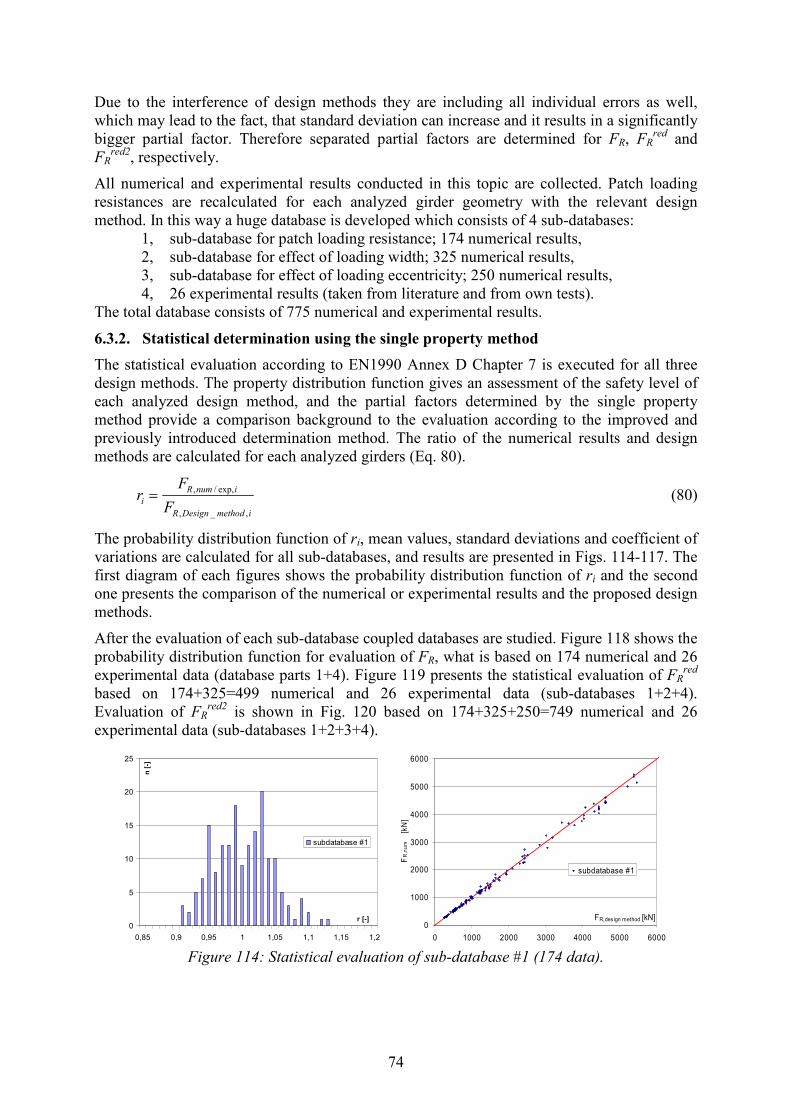
74
Due to the interference of design methods they are including all individual errors as well,
which may lead to the fact, that standard deviation can increase and it results in a significantly
bigger partial factor. Therefore separated partial factors are determined for FR, FRred
and
FRred2
, respectively.
All numerical and experimental results conducted in this topic are collected. Patch loading
resistances are recalculated for each analyzed girder geometry with the relevant design
method. In this way a huge database is developed which consists of 4 sub-databases:
1, sub-database for patch loading resistance; 174 numerical results,
2, sub-database for effect of loading width; 325 numerical results,
3, sub-database for effect of loading eccentricity; 250 numerical results,
4, 26 experimental results (taken from literature and from own tests).
The total database consists of 775 numerical and experimental results.
6.3.2. Statistical determination using the single property method
The statistical evaluation according to EN1990 Annex D Chapter 7 is executed for all three
design methods. The property distribution function gives an assessment of the safety level of
each analyzed design method, and the partial factors determined by the single property
method provide a comparison background to the evaluation according to the improved and
previously introduced determination method. The ratio of the numerical results and design
methods are calculated for each analyzed girders (Eq. 80).
imethodDesignR
inumR
iF
Fr
,_,
exp,/,= (80)
The probability distribution function of ri, mean values, standard deviations and coefficient of
variations are calculated for all sub-databases, and results are presented in Figs. 114-117. The
first diagram of each figures shows the probability distribution function of ri and the second
one presents the comparison of the numerical or experimental results and the proposed design
methods.
After the evaluation of each sub-database coupled databases are studied. Figure 118 shows the
probability distribution function for evaluation of FR, what is based on 174 numerical and 26
experimental data (database parts 1+4). Figure 119 presents the statistical evaluation of FRred
based on 174+325=499 numerical and 26 experimental data (sub-databases 1+2+4).
Evaluation of FRred2
is shown in Fig. 120 based on 174+325+250=749 numerical and 26
experimental data (sub-databases 1+2+3+4).
0
5
10
15
20
25
0,85 0,9 0,95 1 1,05 1,1 1,15 1,2
r [-]
n [-]
subdatabase #1
0
1000
2000
3000
4000
5000
6000
0 1000 2000 3000 4000 5000 6000
FR,design method [kN]
FR,num [kN]
subdatabase #1
Figure 114: Statistical evaluation of sub-database #1 (174 data).
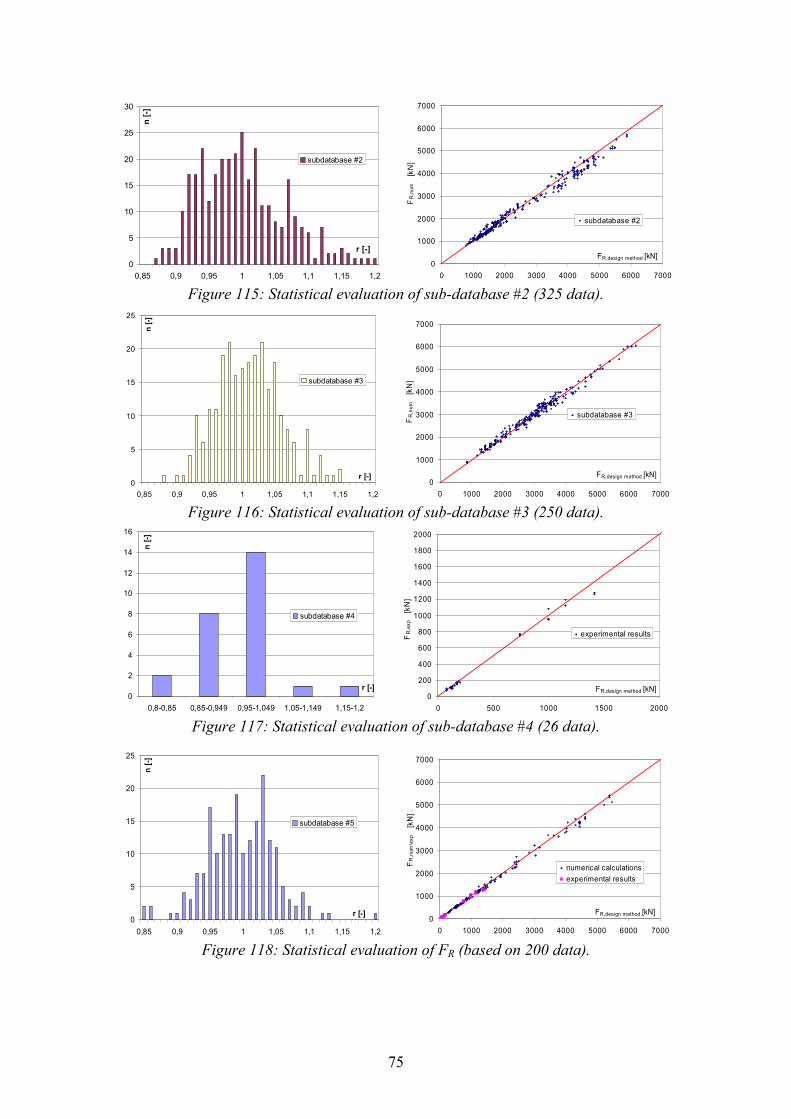
75
0
5
10
15
20
25
30
0,85 0,9 0,95 1 1,05 1,1 1,15 1,2
r [-]
n [-]
subdatabase #2
0
1000
2000
3000
4000
5000
6000
7000
0 1000 2000 3000 4000 5000 6000 7000
FR,design method [kN]
FR,num [kN]
subdatabase #2
Figure 115: Statistical evaluation of sub-database #2 (325 data).
0
5
10
15
20
25
0,85 0,9 0,95 1 1,05 1,1 1,15 1,2
r [-]
n [-]
subdatabase #3
0
1000
2000
3000
4000
5000
6000
7000
0 1000 2000 3000 4000 5000 6000 7000
FR,design method [kN]
FR,num [kN]
subdatabase #3
Figure 116: Statistical evaluation of sub-database #3 (250 data).
0
2
4
6
8
10
12
14
16
0,8-0,85 0,85-0,949 0,95-1,049 1,05-1,149 1,15-1,2
r [-]
n [-]
subdatabase #4
0
200
400
600
800
1000
1200
1400
1600
1800
2000
0 500 1000 1500 2000
FR,design method [kN]
FR,exp [kN] .
experimental results
Figure 117: Statistical evaluation of sub-database #4 (26 data).
0
5
10
15
20
25
0,85 0,9 0,95 1 1,05 1,1 1,15 1,2
r [-]
n [-]
subdatabase #5
0
1000
2000
3000
4000
5000
6000
7000
0 1000 2000 3000 4000 5000 6000 7000
FR,design method [kN]
FR,num/exp [kN] .
numerical calculations
experimental results
Figure 118: Statistical evaluation of FR (based on 200 data).
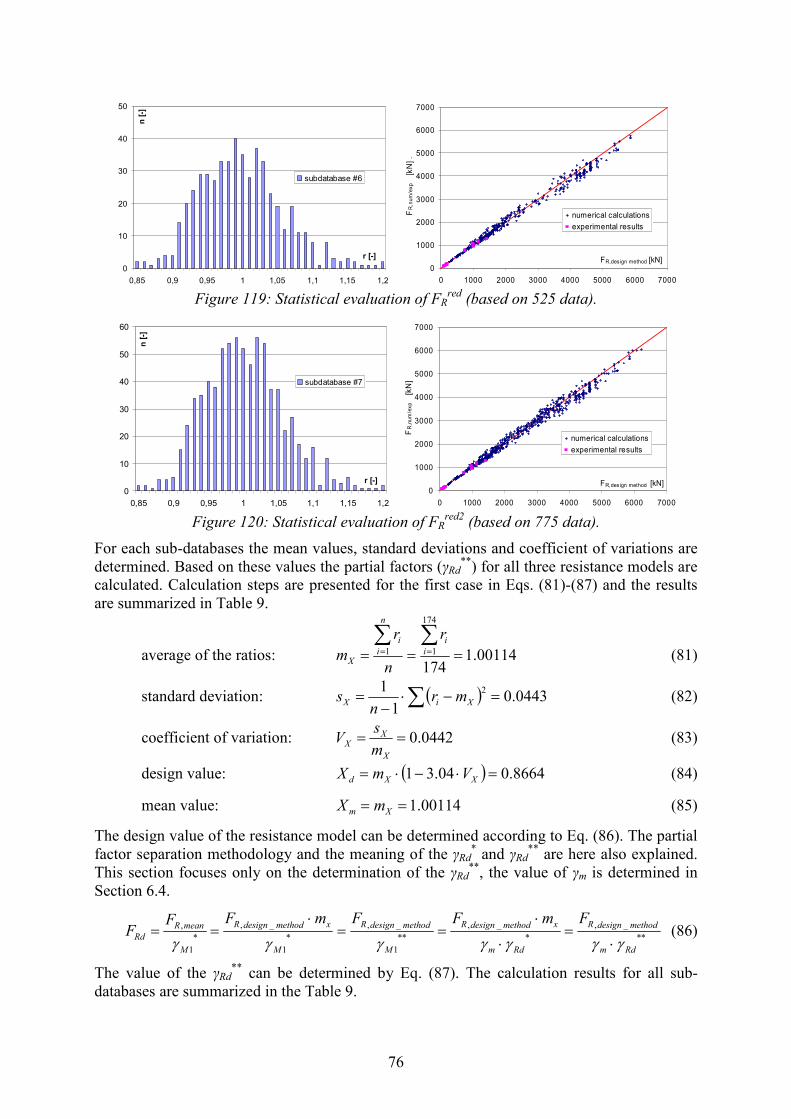
76
0
10
20
30
40
50
0,85 0,9 0,95 1 1,05 1,1 1,15 1,2
r [-]
n [-]
subdatabase #6
0
1000
2000
3000
4000
5000
6000
7000
0 1000 2000 3000 4000 5000 6000 7000
FR,design method [kN]
FR,num/exp [kN] .
numerical calculations
experimental results
Figure 119: Statistical evaluation of FR
red (based on 525 data).
0
10
20
30
40
50
60
0,85 0,9 0,95 1 1,05 1,1 1,15 1,2
r [-]
n [-]
subdatabase #7
0
1000
2000
3000
4000
5000
6000
7000
0 1000 2000 3000 4000 5000 6000 7000
FR,design method [kN]
FR,num/exp [kN]
numerical calculations
experimental results
Figure 120: Statistical evaluation of FR
red2 (based on 775 data).
For each sub-databases the mean values, standard deviations and coefficient of variations are
determined. Based on these values the partial factors (γRd**
) for all three resistance models are
calculated. Calculation steps are presented for the first case in Eqs. (81)-(87) and the results
are summarized in Table 9.
average of the ratios: 00114.1174
174
11 ===∑∑== i
i
n
i
i
X
r
n
r
m (81)
standard deviation: ( )∑ =−⋅−
= 0443.01
1 2
XiX mrn
s (82)
coefficient of variation: 0442.0==X
XX
m
sV (83)
design value: ( ) 8664.004.31 =⋅−⋅= XXd VmX (84)
mean value: 00114.1== Xm mX (85)
The design value of the resistance model can be determined according to Eq. (86). The partial
factor separation methodology and the meaning of the γRd* and γRd
** are here also explained.
This section focuses only on the determination of the γRd**
, the value of γm is determined in
Section 6.4.
**
_,
*
_,
**
1
_,
*
1
_,
*
1
,
Rdm
methoddesignR
Rdm
xmethoddesignR
M
methoddesignR
M
xmethoddesignR
M
meanR
Rd
FmFFmFFF
γγγγγγγ ⋅=
⋅
⋅==
⋅== (86)
The value of the γRd**
can be determined by Eq. (87). The calculation results for all sub-
databases are summarized in the Table 9.
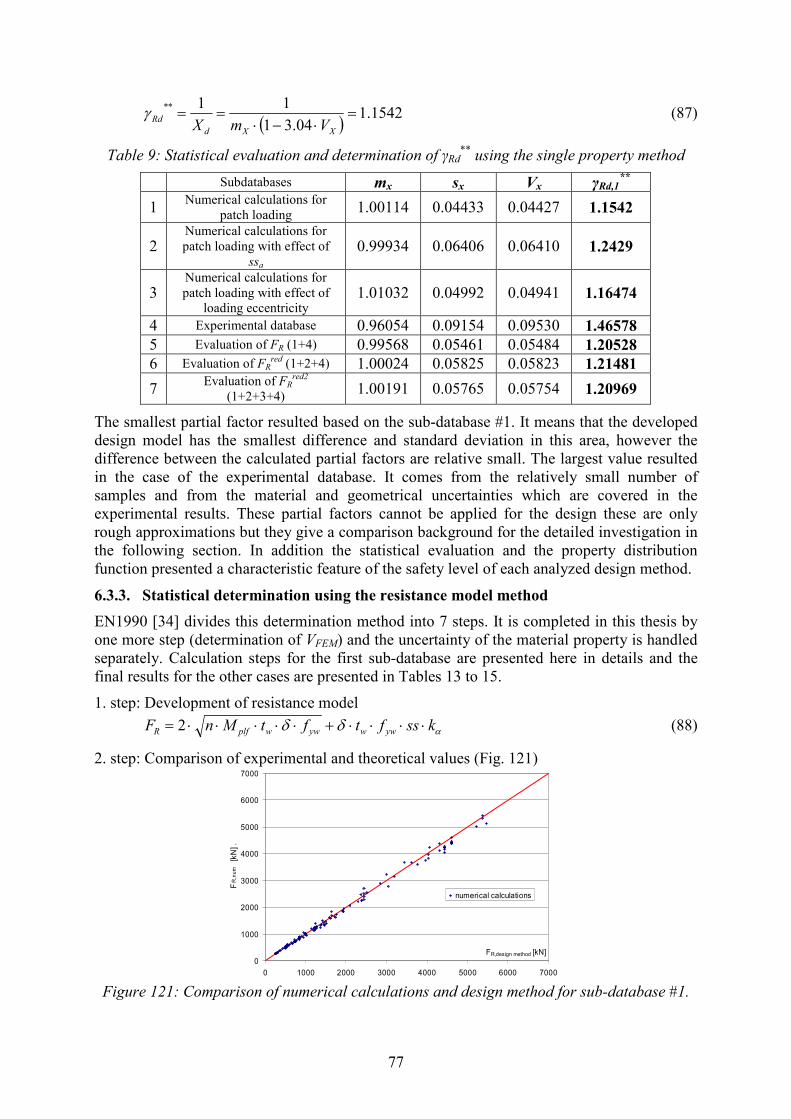
77
( )
1542.104.31
11** =⋅−⋅
==XXd
RdVmX
γ (87)
Table 9: Statistical evaluation and determination of γRd**
using the single property method
Subdatabases mx sx Vx γRd,1**
1 Numerical calculations for
patch loading 1.00114 0.04433 0.04427 1.1542
2 Numerical calculations for
patch loading with effect of
ssa 0.99934 0.06406 0.06410 1.2429
3 Numerical calculations for
patch loading with effect of
loading eccentricity 1.01032 0.04992 0.04941 1.16474
4 Experimental database 0.96054 0.09154 0.09530 1.46578
5 Evaluation of FR (1+4) 0.99568 0.05461 0.05484 1.20528
6 Evaluation of FRred
(1+2+4) 1.00024 0.05825 0.05823 1.21481
7 Evaluation of FR
red2
(1+2+3+4) 1.00191 0.05765 0.05754 1.20969
The smallest partial factor resulted based on the sub-database #1. It means that the developed
design model has the smallest difference and standard deviation in this area, however the
difference between the calculated partial factors are relative small. The largest value resulted
in the case of the experimental database. It comes from the relatively small number of
samples and from the material and geometrical uncertainties which are covered in the
experimental results. These partial factors cannot be applied for the design these are only
rough approximations but they give a comparison background for the detailed investigation in
the following section. In addition the statistical evaluation and the property distribution
function presented a characteristic feature of the safety level of each analyzed design method.
6.3.3. Statistical determination using the resistance model method
EN1990 [34] divides this determination method into 7 steps. It is completed in this thesis by
one more step (determination of VFEM) and the uncertainty of the material property is handled
separately. Calculation steps for the first sub-database are presented here in details and the
final results for the other cases are presented in Tables 13 to 15.
1. step: Development of resistance model
αδδ kssftftMnF ywwywwplfR ⋅⋅⋅⋅+⋅⋅⋅⋅⋅= 2 (88)
2. step: Comparison of experimental and theoretical values (Fig. 121)
0
1000
2000
3000
4000
5000
6000
7000
0 1000 2000 3000 4000 5000 6000 7000
FR,design method [kN]
FR,num [kN] .
numerical calculations
Figure 121: Comparison of numerical calculations and design method for sub-database #1.
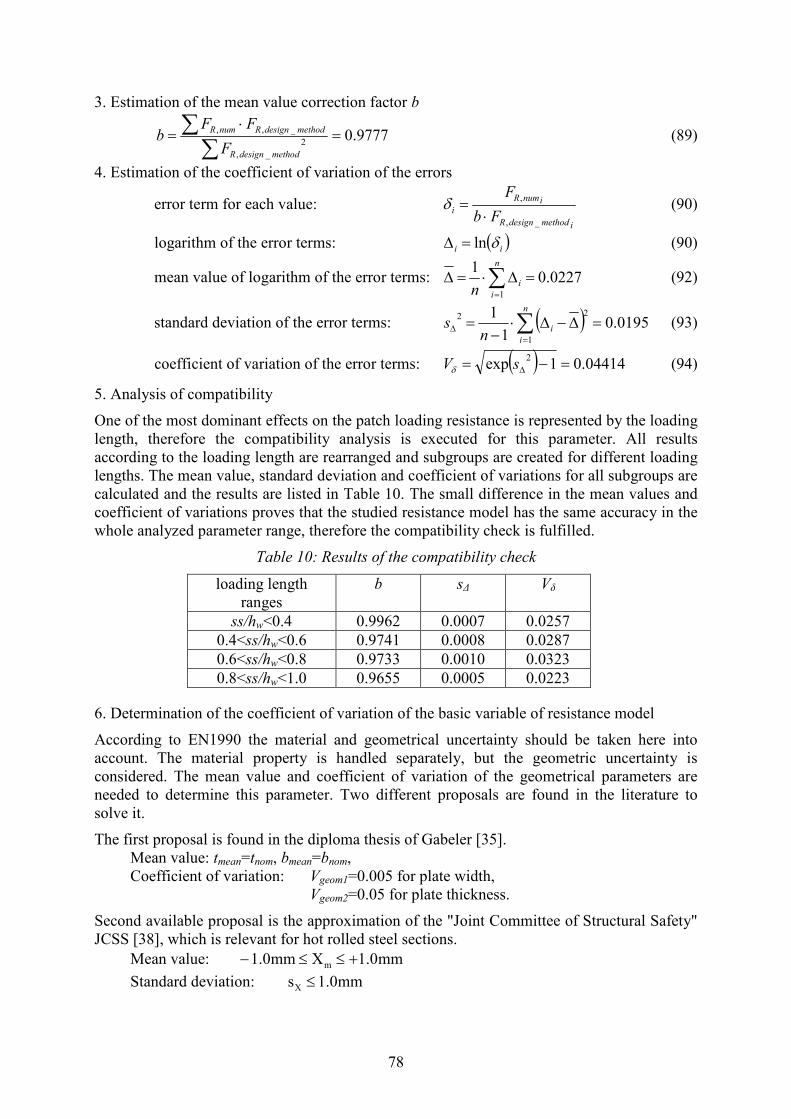
78
3. Estimation of the mean value correction factor b
9777.02
_,
_,, =⋅
=∑
∑methoddesignR
methoddesignRnumR
F
FFb (89)
4. Estimation of the coefficient of variation of the errors
error term for each value:
imethoddesignR
inumR
iFb
F
_,
,
⋅=δ (90)
logarithm of the error terms: ( )ii δln=∆ (90)
mean value of logarithm of the error terms: 0227.01
1
=∆⋅=∆ ∑=
n
i
in
(92)
standard deviation of the error terms: ( ) 0195.01
1
1
22 =∆−∆⋅−
= ∑=
∆
n
i
in
s (93)
coefficient of variation of the error terms: ( ) 04414.01exp2 =−= ∆sVδ (94)
5. Analysis of compatibility
One of the most dominant effects on the patch loading resistance is represented by the loading
length, therefore the compatibility analysis is executed for this parameter. All results
according to the loading length are rearranged and subgroups are created for different loading
lengths. The mean value, standard deviation and coefficient of variations for all subgroups are
calculated and the results are listed in Table 10. The small difference in the mean values and
coefficient of variations proves that the studied resistance model has the same accuracy in the
whole analyzed parameter range, therefore the compatibility check is fulfilled.
Table 10: Results of the compatibility check
loading length
ranges
b s∆ Vδ
ss/hw<0.4 0.9962 0.0007 0.0257
0.4<ss/hw<0.6 0.9741 0.0008 0.0287
0.6<ss/hw<0.8 0.9733 0.0010 0.0323
0.8<ss/hw<1.0 0.9655 0.0005 0.0223
6. Determination of the coefficient of variation of the basic variable of resistance model
According to EN1990 the material and geometrical uncertainty should be taken here into
account. The material property is handled separately, but the geometric uncertainty is
considered. The mean value and coefficient of variation of the geometrical parameters are
needed to determine this parameter. Two different proposals are found in the literature to
solve it.
The first proposal is found in the diploma thesis of Gabeler [35].
Mean value: tmean=tnom, bmean=bnom,
Coefficient of variation: Vgeom1=0.005 for plate width,
Vgeom2=0.05 for plate thickness.
Second available proposal is the approximation of the "Joint Committee of Structural Safety"
JCSS [38], which is relevant for hot rolled steel sections.
Mean value: mm0.1Xmm0.1 m +≤≤−
Standard deviation: mm0.1sX ≤
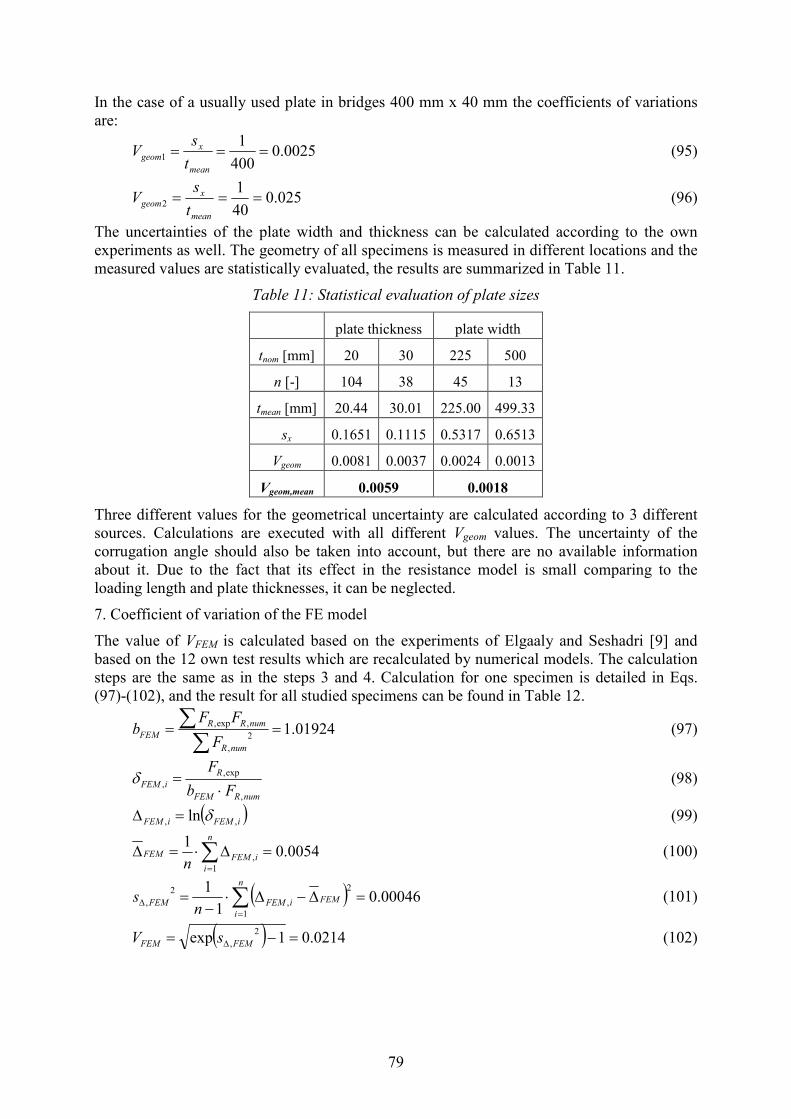
79
In the case of a usually used plate in bridges 400 mm x 40 mm the coefficients of variations
are:
0025.0400
11 ===
mean
xgeom
t
sV (95)
025.040
12 ===
mean
xgeom
t
sV (96)
The uncertainties of the plate width and thickness can be calculated according to the own
experiments as well. The geometry of all specimens is measured in different locations and the
measured values are statistically evaluated, the results are summarized in Table 11.
Table 11: Statistical evaluation of plate sizes
plate thickness plate width
tnom [mm] 20 30 225 500
n [-] 104 38 45 13
tmean [mm] 20.44 30.01 225.00 499.33
sx 0.1651 0.1115 0.5317 0.6513
Vgeom 0.0081 0.0037 0.0024 0.0013
Vgeom,mean 0.0059 0.0018
Three different values for the geometrical uncertainty are calculated according to 3 different
sources. Calculations are executed with all different Vgeom values. The uncertainty of the
corrugation angle should also be taken into account, but there are no available information
about it. Due to the fact that its effect in the resistance model is small comparing to the
loading length and plate thicknesses, it can be neglected.
7. Coefficient of variation of the FE model
The value of VFEM is calculated based on the experiments of Elgaaly and Seshadri [9] and
based on the 12 own test results which are recalculated by numerical models. The calculation
steps are the same as in the steps 3 and 4. Calculation for one specimen is detailed in Eqs.
(97)-(102), and the result for all studied specimens can be found in Table 12.
01924.12
,
,exp, ==∑∑
numR
numRR
FEMF
FFb
(97)
numRFEM
R
iFEMFb
F
,
exp,
, ⋅=δ (98)
( )iFEMiFEM ,, ln δ=∆ (99)
0054.01
1
, =∆⋅=∆ ∑=
n
i
iFEMFEM
n (100)
( ) 00046.01
1
1
2
,
2
, =∆−∆⋅−
= ∑=
∆
n
i
FEMiFEMFEMn
s (101)
( ) 0214.01exp
2
, =−= ∆ FEMFEM sV (102)
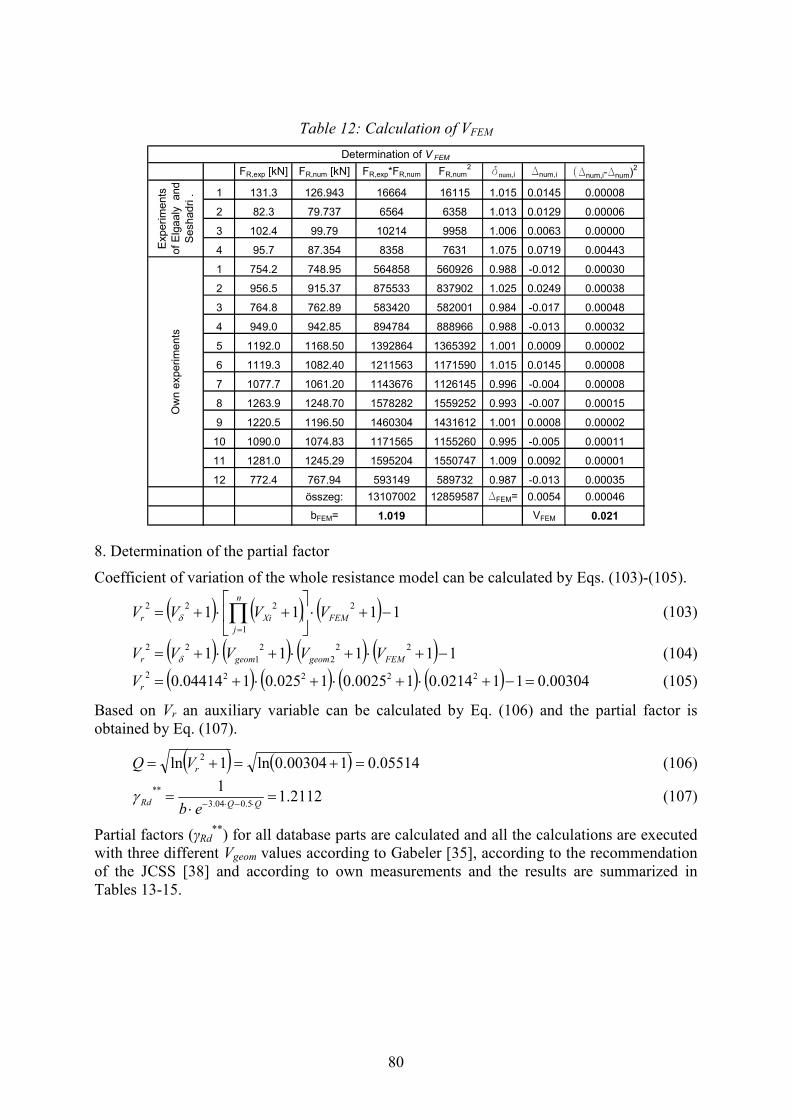
80
Table 12: Calculation of VFEM
FR,exp [kN] FR,num [kN] FR,exp*FR,num FR,num2 dnum,i Dnum,i (Dnum,i-Dnum)
2
1 131.3 126.943 16664 16115 1.015 0.0145 0.00008
2 82.3 79.737 6564 6358 1.013 0.0129 0.00006
3 102.4 99.79 10214 9958 1.006 0.0063 0.00000
4 95.7 87.354 8358 7631 1.075 0.0719 0.00443
1 754.2 748.95 564858 560926 0.988 -0.012 0.00030
2 956.5 915.37 875533 837902 1.025 0.0249 0.00038
3 764.8 762.89 583420 582001 0.984 -0.017 0.00048
4 949.0 942.85 894784 888966 0.988 -0.013 0.00032
5 1192.0 1168.50 1392864 1365392 1.001 0.0009 0.00002
6 1119.3 1082.40 1211563 1171590 1.015 0.0145 0.00008
7 1077.7 1061.20 1143676 1126145 0.996 -0.004 0.00008
8 1263.9 1248.70 1578282 1559252 0.993 -0.007 0.00015
9 1220.5 1196.50 1460304 1431612 1.001 0.0008 0.00002
10 1090.0 1074.83 1171565 1155260 0.995 -0.005 0.00011
11 1281.0 1245.29 1595204 1550747 1.009 0.0092 0.00001
12 772.4 767.94 593149 589732 0.987 -0.013 0.00035
összeg: 13107002 12859587 DFEM= 0.0054 0.00046
bFEM= 1.019 VFEM 0.021
Own experiments
Experiments
of Elgaaly and
Seshadri .
Determination of V FEM
8. Determination of the partial factor
Coefficient of variation of the whole resistance model can be calculated by Eqs. (103)-(105).
( ) ( ) ( ) 1111
2
1
222 −+⋅
+⋅+= ∏
=FEM
n
j
Xir VVVV δ (103)
( ) ( ) ( ) ( ) 11111
22
2
2
1
22 −+⋅+⋅+⋅+= FEMgeomgeomr VVVVV δ (104)
( ) ( ) ( ) ( ) 00304.0110214.010025.01025.0104414.0 22222 =−+⋅+⋅+⋅+=rV (105)
Based on Vr an auxiliary variable can be calculated by Eq. (106) and the partial factor is
obtained by Eq. (107).
( ) ( ) 05514.0100304.0ln1ln2 =+=+= rVQ (106)
2112.11
5.004.3
** =⋅
=⋅−⋅− QQRd
ebγ (107)
Partial factors (γRd**
) for all database parts are calculated and all the calculations are executed
with three different Vgeom values according to Gabeler [35], according to the recommendation
of the JCSS [38] and according to own measurements and the results are summarized in
Tables 13-15.

81
Table 13: Determination of γRd**
based on Vgeom
according to the recommendation of the JCSS (2000) [38]
Subdatabases b Vδ Vr γRd,2**
1 Numerical calculations for patch
loading 0.9777 0.04414 0.05514 1.211
2 Numerical calculations for patch
loading with effect of ssa 0.9722 0.06319 0.07132 1.280
3 Numerical calculations for patch
loading with effect of loading
eccentricity 1.0022 0.04903 0.05913 1.196
4 Experimental database 0.9680 0.0982 0.0982 1.383
5 Evaluation of FR (1+4) 0.9775 0.0556 0.0646 1.248
6 Evaluation of FRred
(1+2+4) 0.9733 0.0604 0.0689 1.269
7 Evaluation of FRred2
(1+2+3+4) 0.9851 0.0569 0.0672 1.242
Table 14: Determination of γRd**
based on Vgeom according to Gabeler [35]
Subdatabases b Vδ Vr γRd,3**
1 Numerical calculations for patch
loading 0.9777 0.04414 0.07028 1.269
2 Numerical calculations for patch
loading with effect of ssa 0.9722 0.06319 0.08360 1.330
3 Numerical calculations for patch
loading with effect of loading
eccentricity 1.0022 0.04903 0.07345 1.250
4 Experimental database 0.9680 0.0982 0.0982 1.383
5 Evaluation of FR (1+4) 0.9775 0.0556 0.07797 1.300
6 Evaluation of FRred
(1+2+4) 0.9733 0.0604 0.08152 1.320
7 Evaluation of FRred2
(1+2+3+4) 0.9851 0.0569 0.07890 1.294
Table 15: Determination of γRd**
based on Vgeom calculated by own tests
Subdatabases b Vδ Vr γRd,4**
1 Numerical calculations for patch
loading 0.9777 0.04414 0.04945 1.190
2 Numerical calculations for patch
loading with effect of ssa 0.9722 0.06319 0.06702 1.264
3 Numerical calculations for patch
loading with effect of loading
eccentricity 1.0022 0.04903 0.05386 1.177
4 Experimental database 0.9680 0.0982 0.0982 1.383
5 Evaluation of FR (1+4) 0.9775 0.0556 0.05987 1.229
6 Evaluation of FRred
(1+2+4) 0.9733 0.0604 0.06441 1.252
7 Evaluation of FRred2
(1+2+3+4) 0.9851 0.0569 0.06110 1.224
6.3.4. Comparison and evaluation of the results
The comparison of the results are summarized in Table 16. Columns 3 to 6 consists of the
results calculated in Sections 6.3.2. and 6.3.3. In the last three rows ratios of the partial factors
are calculated and presented to compare the different methods.

82
Table 16: Calculated γRd**
values according to different approximations Resistance model method Comparison Single
property
method
[34]
Vgeom
according to
JCSS [37]
Vgeom acc. to
Gabeler [35]
Vgeom acc. to
own
measurements
Subdatabases
γRd,1**
γRd,2**
γRd,3**
γRd,4**
γRd,3**
/
γRd,4**
γRd,1**
/
γRd,4**
γRd,1**
/
γRd,2**
1 Numerical calculations
for patch loading 1.154 1.211 1.269 1.190 1.066 0.970 0.953
2
Numerical calculations
for patch loading with
effect of ssa
1.243 1.280 1.330 1.264 1.052 0.983 0.971
3
Numerical calculations
for patch loading with
effect of loading
eccentricity
1.165 1.196 1.250 1.177 1.062 0.990 0.974
4 Experimental database 1.466 1.383 1.383 1.383 1.00 1.060 1.060
5 Evaluation of FR (1+4) 1.205 1.248 1.300 1.229 1.058 0.981 0.966
6 Evaluation of FR
red
(1+2+4) 1.215 1.269 1.320 1.252 1.054 0.971 0.957
7 Evaluation of FR
red2
(1+2+3+4) 1.210 1.242 1.294 1.224 1.057 0.989 0.974
Based on the comparison of the results the following conclusions can be drawn:
1. The single property method leads in all cases to the smallest partial factor (γRd,1**
) except of
the pure experimental results (4), but due to the small number of experiments reliable
conclusion cannot be drawn for that.
2. From the resistance model method based on different coefficients of variations, the lowest
partial factor resulted in γRd,4**
which is calculated by Vgeom according to own measurement.
The proposal of Gabeler resulted in the largest value (γRd,3**
). The ratio of these two
calculation methods are listed in the column 7 of Table 16. Differences are between 5 to 7%.
3. Calculation with Vgeom according to the recommendation of the JCSS leads to a medium
value in between the previous two calculations. By this method the question arises for which
plate size the values Vgeom1 and Vgeom2 should be calculated. In the current calculations an
average plate size of bridges is used.
4. Column 8 in Table 16 consists of the comparison of γRd,1**
and γRd,4**
. Maximal difference
is 3%. Column 9 shows the comparison of γRd,1**
and γRd,2**
, with a maximal difference of 5%.
The results prove that the single property and resistance model methods are not far from each
other, if calculations are based on a good calibrated numerical model (VFEM is small) and the
uncertainties of the geometric parameters (Vgeom) are also small.
5. The single property method gives an assessment of the statistical properties of the design
methods and it leads to a good approximation of the partial factors. The resistance model
method takes more uncertainties into account therefore it is a more complex and accurate
method.
6.4. Determination of partial factor of the material properties - γm
To determinate γM1**
the partial factor of the material properties (γm) is calculated. The value
of γm depends on the material uncertainties and it does not depend on the resistance model,
therefore this value is taken from the literature according to Eq. (108) from [37].
( )fymy
nomy
yd
nomy
mVf
f
f
f
⋅−⋅==
64.11,
,,γ , (108)
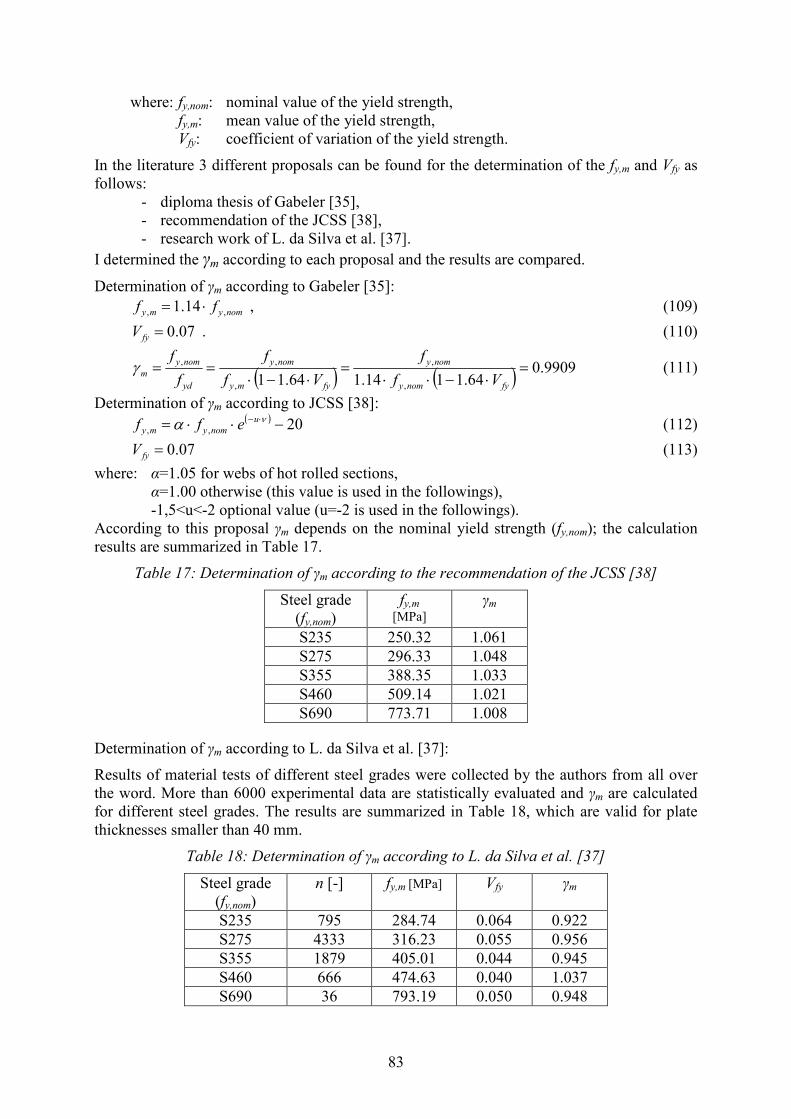
83
where: fy,nom: nominal value of the yield strength,
fy,m: mean value of the yield strength,
Vfy: coefficient of variation of the yield strength.
In the literature 3 different proposals can be found for the determination of the fy,m and Vfy as
follows:
- diploma thesis of Gabeler [35],
- recommendation of the JCSS [38],
- research work of L. da Silva et al. [37].
I determined the γm according to each proposal and the results are compared.
Determination of γm according to Gabeler [35]:
nomymy ff ,, 14.1 ⋅= , (109)
07.0=fyV . (110)
( ) ( ) 9909.064.1114.164.11 ,
,
,
,, =⋅−⋅⋅
=⋅−⋅
==fynomy
nomy
fymy
nomy
yd
nomy
mVf
f
Vf
f
f
fγ
(111)
Determination of γm according to JCSS [38]:
( ) 20,, −⋅⋅= ⋅− να u
nomymy eff (112)
07.0=fyV (113)
where: α=1.05 for webs of hot rolled sections,
α=1.00 otherwise (this value is used in the followings),
-1,5<u<-2 optional value (u=-2 is used in the followings).
According to this proposal γm depends on the nominal yield strength (fy,nom); the calculation
results are summarized in Table 17.
Table 17: Determination of γm according to the recommendation of the JCSS [38]
Steel grade
(fy,nom)
fy,m
[MPa] γm
S235 250.32 1.061
S275 296.33 1.048
S355 388.35 1.033
S460 509.14 1.021
S690 773.71 1.008
Determination of γm according to L. da Silva et al. [37]:
Results of material tests of different steel grades were collected by the authors from all over
the word. More than 6000 experimental data are statistically evaluated and γm are calculated
for different steel grades. The results are summarized in Table 18, which are valid for plate
thicknesses smaller than 40 mm.
Table 18: Determination of γm according to L. da Silva et al. [37]
Steel grade
(fy,nom)
n [-] fy,m [MPa] Vfy γm
S235 795 284.74 0.064 0.922
S275 4333 316.23 0.055 0.956
S355 1879 405.01 0.044 0.945
S460 666 474.63 0.040 1.037
S690 36 793.19 0.050 0.948

84
Evaluation of the results show that differences between γm values calculated by different
proposals is quite small. According to the approximation of Gabeler [35] γm does not depend
on the yield strength. According to proposal of JCSS [38] increasing fy results in a decrease of
γm. Statistical evaluation of the huge number of experiments did not confirm this assumption
and the trend of γm with the yield strength is not clear according to the experiments. The
proposal of the JCSS [38] lead almost in all cases to the largest partial factor, therefore
staying on the safe side these values of γm are used in the followings.
6.5. Determination of the partial factor - γM1**
The partial factor (γM1**
) can be calculated as the product of γm and γRd**
according to Eq.
(114).
****
1 RdmM γγγ ⋅= (114)
The results are summarized in Table 19, where the value of the γm depends on the steel grade
of the applied material. The tendency of the results is unchanged by the multiplication of γm,
therefore conclusions introduced in Section 6.3.4. are also here valid. Results of the resistance
model method using the recommendations of the JCSS [38] are proposed for application,
because this method is the most accurate and the recommendations of the JCSS are based on
the largest research background. Results showed that the differences between the different
subdatabases are small, especially in case of the subdatabases #5, #6 and #7. Therefore a
uniform partial factor is recommended for all the three design methods, which is equally
assumed by 1.27 γm. As the standardized partial factor γM1=1.1 for bridges is defined in
EN1993-2 [39], therefore the calculated values are integrated in the resistance model. The
modified resistance models are summarized in Eqs. (115) to (118).
1MK
ywwywwplf
**
1M
R
new,Rd
kssftftMn2FF
γ⋅γ
⋅⋅⋅⋅δ+⋅δ⋅⋅⋅⋅=
γ=
α , (115)
[ ]{ }
1MK
a4R
**
1M
red
Rred
new,Rd
ss)b1(am1FFF
γ⋅γ−−⋅⋅−⋅
=γ
= , (116)
1MK
f
3
red
R
**
1M
2red
R2red
new,Rd
b
em1F
FF
γ⋅γ
⋅−⋅
=γ
= , (117)
where γM1=1.1
m
1M
mK 155.1
27.1γ⋅=
γγ⋅
=γ . (118)
The values of the γK are calculated for the different steel grades in the Table 19.
Table 19: Determination of γK to different steel grades
Steel grade
(fy,nom)
γm γK
S235 1.061 1.225
S275 1.048 1.210
S355 1.033 1.193
S460 1.021 1.179
S690 1.008 1.164

85
6.6. Summary
Design methods introduced in the previous chapters determine the mean value of the patch
loading resistances. To be able to determine the design resistances the developed design
proposals are statistically evaluated and partial factors are derived. The determination method
of the partial factor according to EN1990 [34] is developed for evaluation of resistance
models based on experimental results. If the investigated resistance model is developed based
on numerical calculations the specialities in the uncertainties have to be taken into account.
This Chapter introduces modification possibilities in the partial factor determination method
which are found in the literature. All effects which are basically built in γM are considered in
the determination of the partial factors to the investigated resistance models, which are the
uncertainties of the resistance model, material properties, geometry, and the numerical model.
If the resistance model is developed based on numerical calculations the separation of the γm
and γRd is used, because the numerical model does not consider the material and geometrical
uncertainties. There are also some differences between numerical calculations and the
experimental results, what is taken by a factor (VFEM) into account. The third difference is that
the uncertainty of the geometry is also considered, since the numerical model does not
consider it.
At first all three resistance models are statistically investigated using the single property
method in order to get an estimation about the probability distribution function of the design
proposals and about the mean values and standard deviations. These partial factors lead also
to a comparison background to the evaluation by the resistance model method. The partial
factors are calculated also by the multiple property method according to EN1990 Annex D
Chapter 8 supplemented by the modifications introduced above.
The results show that the single property method gives a characterization about the statistical
properties of the design methods and leads to a good approximation. The resistance model
method takes more uncertainties into account therefore it is a more complex and accurate
method. The results prove that the single property and resistance model methods are not far
from each other, if the resistance model is developed based on a calibrated numerical model
(VFEM is small) and the uncertainties of the geometric parameters (Vgeom) are also small.
Finally partial factors for all the tree proposed resistance models are derived and
recommended to used it in the design.

86
7. Interaction between shear and transverse force
7.1. General
In the practice during launching of a bridge structure large shear and transverse force can be
introduced at the same cross section as shown in Fig. 5. In this case the corrugated web is
loaded by large shear and transverse forces, so that the interaction should be considered in the
design. In case of bridge structures, which have mostly high webs, the main part of the shear
resistance comes from the contribution of the web. Bridges which are erected by incremental
launching have mostly thick webs and long loading lengths at the launching device, therefore
the main part of the patch loading resistance comes also from the web contribution. In case of
corrugated web girders it is especially true because due to the corrugation profile the web
contribution in the patch loading and in the shear resistance is increased. Due to the enlarged
role of the web in both resistances the interaction of shear and patch loading of corrugated
web girders should be investigated.
The interaction behaviour of steel girders subjected to combined shear and patch loading was
studied only scarcely by researchers in the past. No considerations of the interaction is made
in standards neither for flat web nor for corrugated web girders. Therefore the aim of the
current research is to study the interaction behaviour of corrugated web girders under
combined shear and patch loading. A comprehensive parametric study is conducted in this
topic, the structural behaviour of the analyzed girders are investigated and the transition
between the shear and patch loading failure modes are studied. Effect of each parameters on
the interaction behaviour are analyzed and tendencies are determined. Results are compared to
the previously developed interaction curves and a new design interaction equation is
proposed.
7.2. Review of previous investigations
7.2.1. General
Because only one paper is available for corrugated web girders [9] the literature overview is
done in the field of flat web girders. All studies on the interaction between shear and patch
loading have in common that the combined load is subdivided into two basic load cases
(“pure patch loading” and “pure shear force”). Figure 122 shows the separation methodology.
Basis of the separation is that the shear stresses due to “pure patch load” are already included
in the patch loading resistance model and a reduction of the load carrying capacity is caused
only by the additional shear stresses coming from “pure shear force”.
Figure 122: Subdivision of the combined load into two basic load cases [7].
7.2.2. Previous investigations on flat web girders
A compact literature overview can be found in [7] about the shear and patch loading
interaction of flat web girders made by Kuhlmann and Braun. A short summary about all the
available previously developed interaction curves are listed and compared in this section. The
first available experimental investigation in this topic is made by Elgaaly in the 1970s [40].
Zoetemeier conducted special experiments on hot-rolled I-girders in 1980 [41]. Experimental
research activity is continued by Oxfort and Weber on 3 welded test specimens in 1981 [42].
In 2000 Roberts and Shahabian made experiments on 24 welded I-girders and developed an
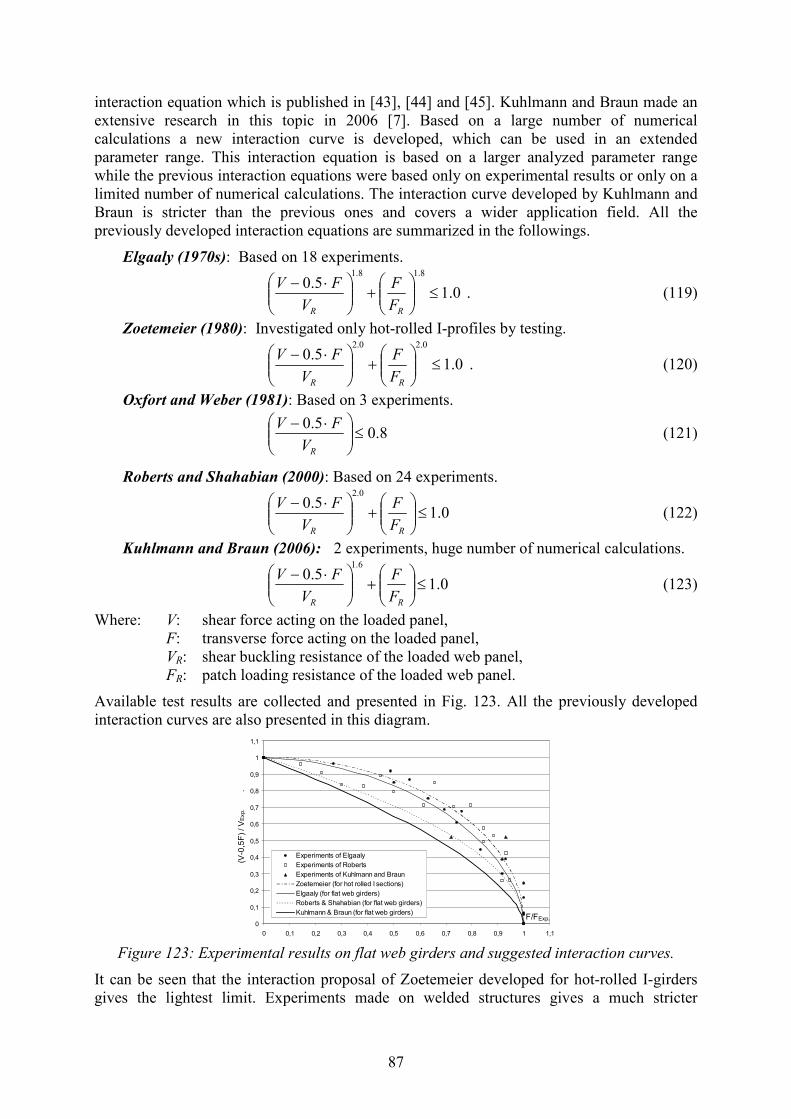
87
interaction equation which is published in [43], [44] and [45]. Kuhlmann and Braun made an
extensive research in this topic in 2006 [7]. Based on a large number of numerical
calculations a new interaction curve is developed, which can be used in an extended
parameter range. This interaction equation is based on a larger analyzed parameter range
while the previous interaction equations were based only on experimental results or only on a
limited number of numerical calculations. The interaction curve developed by Kuhlmann and
Braun is stricter than the previous ones and covers a wider application field. All the
previously developed interaction equations are summarized in the followings.
Elgaaly (1970s): Based on 18 experiments.
0.15.0
8.18.1
≤
+
⋅−
RR F
F
V
FV . (119)
Zoetemeier (1980): Investigated only hot-rolled I-profiles by testing.
0.15.0
0.20.2
≤
+
⋅−
RR F
F
V
FV . (120)
Oxfort and Weber (1981): Based on 3 experiments.
8.05.0
≤
⋅−
RV
FV (121)
Roberts and Shahabian (2000): Based on 24 experiments.
0.15.0
0.2
≤
+
⋅−
RR F
F
V
FV (122)
Kuhlmann and Braun (2006): 2 experiments, huge number of numerical calculations.
0.15.0
6.1
≤
+
⋅−
RR F
F
V
FV (123)
Where: V: shear force acting on the loaded panel,
F: transverse force acting on the loaded panel,
VR: shear buckling resistance of the loaded web panel,
FR: patch loading resistance of the loaded web panel.
Available test results are collected and presented in Fig. 123. All the previously developed
interaction curves are also presented in this diagram.
0
0,1
0,2
0,3
0,4
0,5
0,6
0,7
0,8
0,9
1
1,1
0 0,1 0,2 0,3 0,4 0,5 0,6 0,7 0,8 0,9 1 1,1
F/FExp.
(V-0
,5F
) /
VE
xp
.
.
Experiments of Elgaaly
Experiments of Roberts
Experiments of Kuhlmann and Braun
Zoetemeier (for hot rolled I sections)
Elgaaly (for flat web girders)
Roberts & Shahabian (for flat web girders)
Kuhlmann & Braun (for flat web girders)
Figure 123: Experimental results on flat web girders and suggested interaction curves.
It can be seen that the interaction proposal of Zoetemeier developed for hot-rolled I-girders
gives the lightest limit. Experiments made on welded structures gives a much stricter
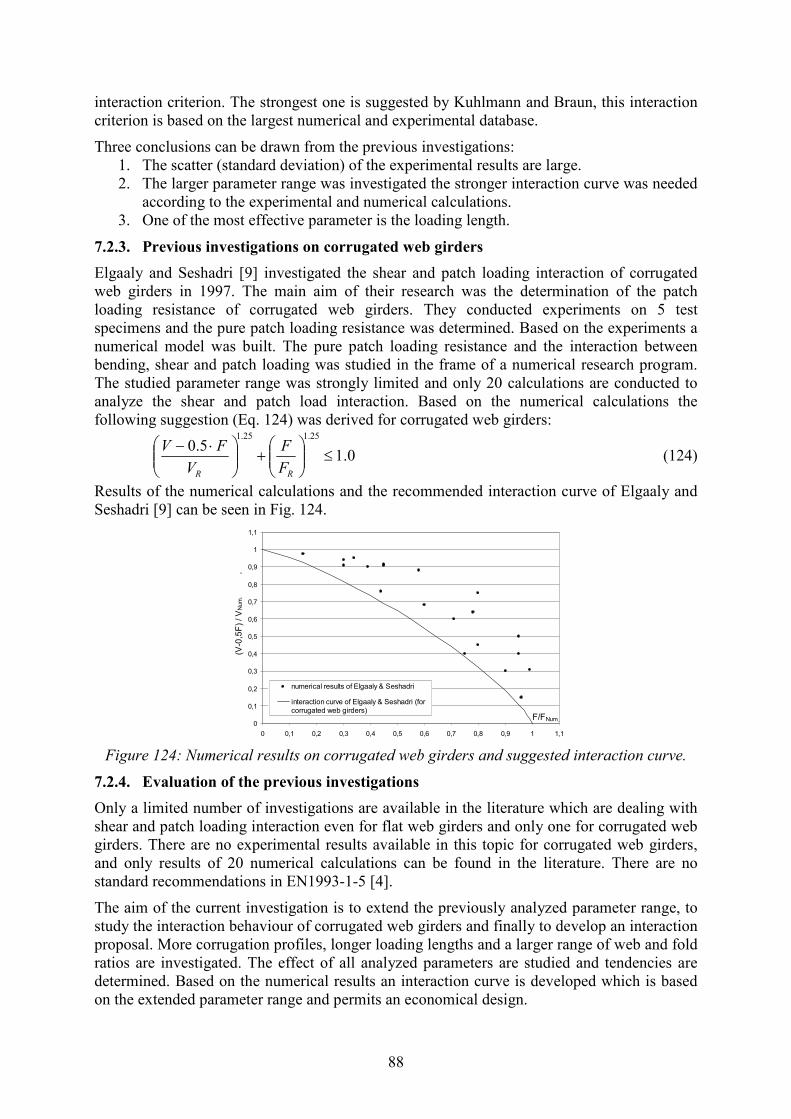
88
interaction criterion. The strongest one is suggested by Kuhlmann and Braun, this interaction
criterion is based on the largest numerical and experimental database.
Three conclusions can be drawn from the previous investigations:
1. The scatter (standard deviation) of the experimental results are large.
2. The larger parameter range was investigated the stronger interaction curve was needed
according to the experimental and numerical calculations.
3. One of the most effective parameter is the loading length.
7.2.3. Previous investigations on corrugated web girders
Elgaaly and Seshadri [9] investigated the shear and patch loading interaction of corrugated
web girders in 1997. The main aim of their research was the determination of the patch
loading resistance of corrugated web girders. They conducted experiments on 5 test
specimens and the pure patch loading resistance was determined. Based on the experiments a
numerical model was built. The pure patch loading resistance and the interaction between
bending, shear and patch loading was studied in the frame of a numerical research program.
The studied parameter range was strongly limited and only 20 calculations are conducted to
analyze the shear and patch load interaction. Based on the numerical calculations the
following suggestion (Eq. 124) was derived for corrugated web girders:
0.15.0
25.125.1
≤
+
⋅−
RR F
F
V
FV (124)
Results of the numerical calculations and the recommended interaction curve of Elgaaly and
Seshadri [9] can be seen in Fig. 124.
0
0,1
0,2
0,3
0,4
0,5
0,6
0,7
0,8
0,9
1
1,1
0 0,1 0,2 0,3 0,4 0,5 0,6 0,7 0,8 0,9 1 1,1
F/FNum.
(V-0
,5F
) /
VN
um
.
.
numerical results of Elgaaly & Seshadri
interaction curve of Elgaaly & Seshadri (for
corrugated web girders)
Figure 124: Numerical results on corrugated web girders and suggested interaction curve.
7.2.4. Evaluation of the previous investigations
Only a limited number of investigations are available in the literature which are dealing with
shear and patch loading interaction even for flat web girders and only one for corrugated web
girders. There are no experimental results available in this topic for corrugated web girders,
and only results of 20 numerical calculations can be found in the literature. There are no
standard recommendations in EN1993-1-5 [4].
The aim of the current investigation is to extend the previously analyzed parameter range, to
study the interaction behaviour of corrugated web girders and finally to develop an interaction
proposal. More corrugation profiles, longer loading lengths and a larger range of web and fold
ratios are investigated. The effect of all analyzed parameters are studied and tendencies are
determined. Based on the numerical results an interaction curve is developed which is based
on the extended parameter range and permits an economical design.

89
7.3. Numerical investigations
7.3.1. General
Panels loaded by combined patch load and shear force can be classified into four classes
according to [7]. The schematic overview of the subdivision is illustrated in Fig. 125. The
basis of the classification is the different V1/V2 ratio.
Figure 125: Subdivision of panels loaded with combined shear and patch load [7].
Case “a” shows the pure patch loading situation if the girder is loaded along a small part of
the flange. In this case V1 and V2 forces are equal, and the V1/ V2 ratio is equal to -1.
Case “b” corresponds to the patch loading situation with an interacting shear force. The
dominant effect is the patch load and the shear force makes the V1 and V2 reaction force
distribution asymmetrical. The ratio of V1/V2 varies between 0 and -1.
Case ”c” represents the loading situation if the shear force is dominant and an interacting
patch loading is also applied on the structure. In this case the shear force diagram does not
change sign and the ratio of the V1 and V2 changes between 0 and 1.
Case “d” shows the situation of pure shear without patch loading. The ratio of the V1/V2
forces is equal to 1.
This classification does not mean four independent classes of the structural behaviour of the
loaded panel. In the first class (pure patch loading) the failure mode is web crippling. In class
"d" (pure shear force) the failure mode is shear buckling of the web. In the interaction zone
there is a uniform transition between these two failure modes.
7.3.2. Numerical model development and verification
Numerical calculations are executed on the same finite element model which is introduced in
Chapter 4. The applied finite element, the used material model and support conditions are the
same as detailed previously. The used finite element mesh has the same density as in the case
of the previous models which are verified based on experimental background introduced
in Chapter 3.
The subdivision of the problem shown in Fig. 125 suggests, that it is sufficient if only half of
the girder (only one web panel) is modelled (Fig. 126) using symmetry conditions.
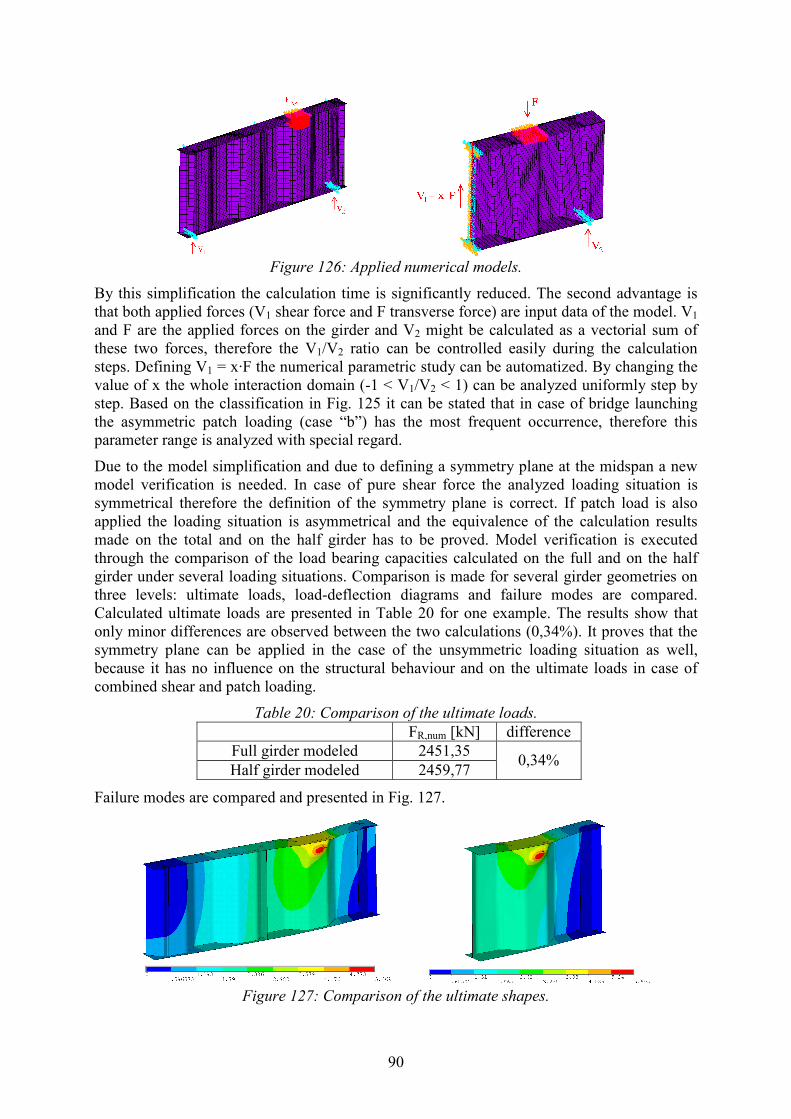
90
Figure 126: Applied numerical models.
By this simplification the calculation time is significantly reduced. The second advantage is
that both applied forces (V1 shear force and F transverse force) are input data of the model. V1
and F are the applied forces on the girder and V2 might be calculated as a vectorial sum of
these two forces, therefore the V1/V2 ratio can be controlled easily during the calculation
steps. Defining V1 = x·F the numerical parametric study can be automatized. By changing the
value of x the whole interaction domain (-1 < V1/V2 < 1) can be analyzed uniformly step by
step. Based on the classification in Fig. 125 it can be stated that in case of bridge launching
the asymmetric patch loading (case “b”) has the most frequent occurrence, therefore this
parameter range is analyzed with special regard.
Due to the model simplification and due to defining a symmetry plane at the midspan a new
model verification is needed. In case of pure shear force the analyzed loading situation is
symmetrical therefore the definition of the symmetry plane is correct. If patch load is also
applied the loading situation is asymmetrical and the equivalence of the calculation results
made on the total and on the half girder has to be proved. Model verification is executed
through the comparison of the load bearing capacities calculated on the full and on the half
girder under several loading situations. Comparison is made for several girder geometries on
three levels: ultimate loads, load-deflection diagrams and failure modes are compared.
Calculated ultimate loads are presented in Table 20 for one example. The results show that
only minor differences are observed between the two calculations (0,34%). It proves that the
symmetry plane can be applied in the case of the unsymmetric loading situation as well,
because it has no influence on the structural behaviour and on the ultimate loads in case of
combined shear and patch loading.
Table 20: Comparison of the ultimate loads.
FR,num [kN] difference
Full girder modeled 2451,35
Half girder modeled 2459,77 0,34%
Failure modes are compared and presented in Fig. 127.
Figure 127: Comparison of the ultimate shapes.

91
It can be seen that the ultimate shapes and failure modes are the same, and the symmetry
plane does not change the failure mode in the cases of the analyzed models. The results prove
that both models show the same structural behaviour and failure load. It means that this
modelling simplification can be used to analyze the interaction of shear and transverse force
of corrugated web girders.
7.3.3. Structural behaviour
To obtain the structural behaviour of the shear and patch loading interaction, different failure
modes under pure patch loading, pure shear force and combined loading are analyzed and
compared to each other. The comparison is presented in Fig. 128. In the case of pure patch
loading the failure mode is local web crippling (case V1/V2=-1), in the case of pure shear
force the failure mode is shear buckling of the web (case V1/V2=1). In the interaction zone a
uniform transition between the two failure modes can be observed, and no strict limit can be
drawn between the two failure modes.
V1/V2=-1 V1/V2=0
V1/V2=0.5 V1/V2=0.86
V1/V2=1.00
Figure 128: Comparison of different failure modes.
The lateral displacements in the loaded web folds are analyzed under different loading
conditions. Figures 129 and 130 show the lateral displacements along the web height in a
parallel and in an inclined fold, respectively. In the case of pure web crippling there is only
one peak in the diagrams under the loaded flange (V1/V2=-1). In the case of pure shear force
(V1/V2=1) the maximal lateral displacement is at the position of the tension band. In the
interaction range coming from pure patch loading to the pure shear force the effect of the
shear buckling is more dominant. In the case of asymmetric patch loading (-1<V1/V2≤0) there

92
are two peaks on the diagrams, one belongs to web crippling and one to the tension band of
the shear buckling. In the case of 0<V1/V2<1,0 the shear buckling is more dominant and only
one peak can be seen on the diagrams.
0
125
250
375
500
625
750
875
1000
1125
1250
-0,8 -0,6 -0,4 -0,2 0 0,2 0,4 0,6 0,8 1 1,2 1,4
e [mm]
hw
[m
m]
.
V1/V2=-1
V1/V2=0
V1/V2=0.5
V1/V2=0.86
V1/V2=1
local buckling
shear buckling
(tension band)
interaction
Figure 129: Comparison of the lateral displacements – parallel fold.
0
125
250
375
500
625
750
875
1000
1125
1250
-1,5 -1 -0,5 0 0,5 1 1,5 2 2,5
e [mm]
hw
[m
m]
.
V1/V2=-1
V1/V2=0.5
V1/V2=0.86
V1/V2=1
local buckling
shear buckling
(tension band)
interaction
local buckling
tension band
Figure 130: Comparison of the lateral displacements – inclined fold.
7.3.4. Evaluation of the results and development of interaction curves
In the frame of the numerical parametric study the interaction between shear and patch
loading is investigated. In the case of all analyzed girder geometry the ratio of F and V1 is
changed. At first the pure patch loading and shear buckling resistances are determined and the
observed failure modes are studied. After it 7-8 calculations are executed with different F and
V1 ratios for each geometry. By this way about 10 calculations are conducted in average for
each girder geometry, and in total 370 calculations are executed. By this study the analyzed
parameter range of Elgaaly and Seshadri [9] is extended as follows:
- hw/tw : 100 - 125 - 150 - 200 - 250
- a1/tw : 15 - 20 - 25 - 30 - 35
- α : 20° - 30° - 40° - 60°
- ss/hw : 0.2 - 0.4 - 0.5 - 0.6 - 0.8
The obtained results, together with Elgaaly´s numerical calculations are presented in two
diagrams. The evaluation of the results is implemented by two different ways. The first (Fig.
131) is completed using the above mentioned method with subdivision of the combined
loading situation according to Fig. 122.
The horizontal axis of the diagram shows the transverse force divided by the patch loading
resistance. The vertical axis shows the subdivided shear force divided by the shear buckling
resistance of the web panel. Figure 131 shows that the given interaction curve of Kuhlmann
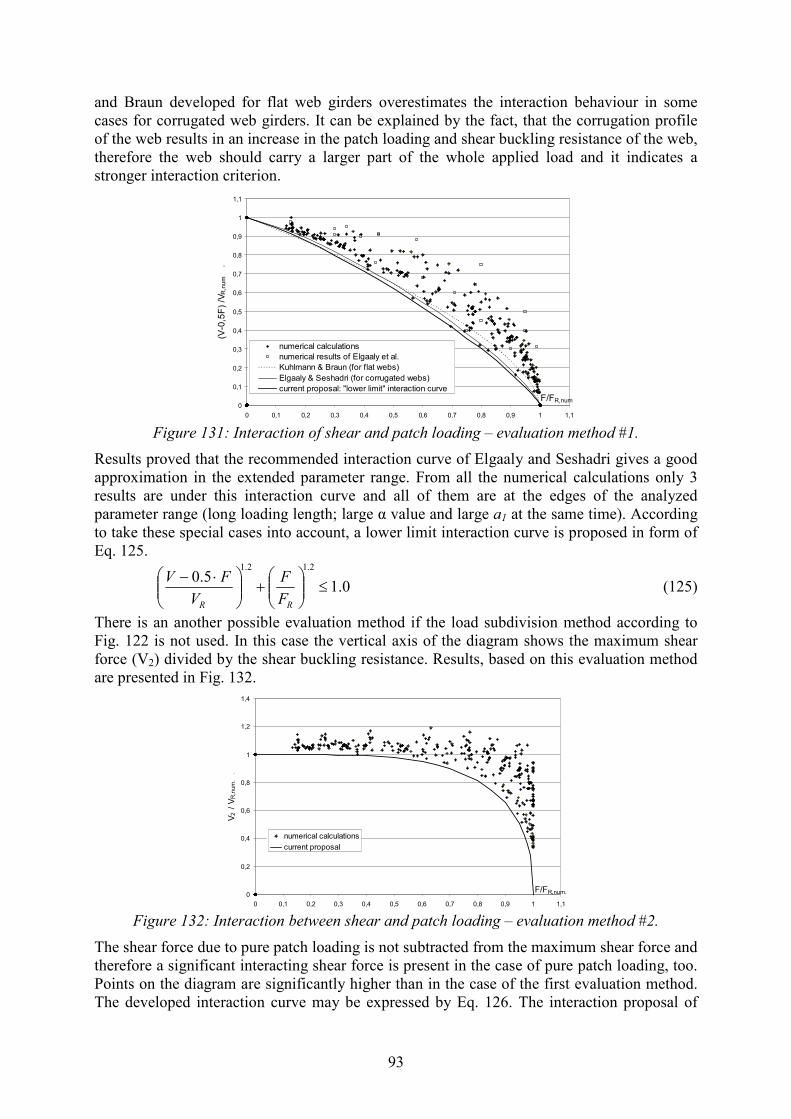
93
and Braun developed for flat web girders overestimates the interaction behaviour in some
cases for corrugated web girders. It can be explained by the fact, that the corrugation profile
of the web results in an increase in the patch loading and shear buckling resistance of the web,
therefore the web should carry a larger part of the whole applied load and it indicates a
stronger interaction criterion.
0
0,1
0,2
0,3
0,4
0,5
0,6
0,7
0,8
0,9
1
1,1
0 0,1 0,2 0,3 0,4 0,5 0,6 0,7 0,8 0,9 1 1,1
F/FR,num
(V-0
,5F
) /V
R,n
um
.
numerical calculations
numerical results of Elgaaly et al.
Kuhlmann & Braun (for flat webs)
Elgaaly & Seshadri (for corrugated webs)
current proposal: "lower limit" interaction curve
Figure 131: Interaction of shear and patch loading – evaluation method #1.
Results proved that the recommended interaction curve of Elgaaly and Seshadri gives a good
approximation in the extended parameter range. From all the numerical calculations only 3
results are under this interaction curve and all of them are at the edges of the analyzed
parameter range (long loading length; large α value and large a1 at the same time). According
to take these special cases into account, a lower limit interaction curve is proposed in form of
Eq. 125.
0.15.0
2.12.1
≤
+
⋅−
RR F
F
V
FV (125)
There is an another possible evaluation method if the load subdivision method according to
Fig. 122 is not used. In this case the vertical axis of the diagram shows the maximum shear
force (V2) divided by the shear buckling resistance. Results, based on this evaluation method
are presented in Fig. 132.
0
0,2
0,4
0,6
0,8
1
1,2
1,4
0 0,1 0,2 0,3 0,4 0,5 0,6 0,7 0,8 0,9 1 1,1
F/FR,num.
V2
/
VR
,nu
m.
.
numerical calculations
current proposal
Figure 132: Interaction between shear and patch loading – evaluation method #2.
The shear force due to pure patch loading is not subtracted from the maximum shear force and
therefore a significant interacting shear force is present in the case of pure patch loading, too.
Points on the diagram are significantly higher than in the case of the first evaluation method.
The developed interaction curve may be expressed by Eq. 126. The interaction proposal of
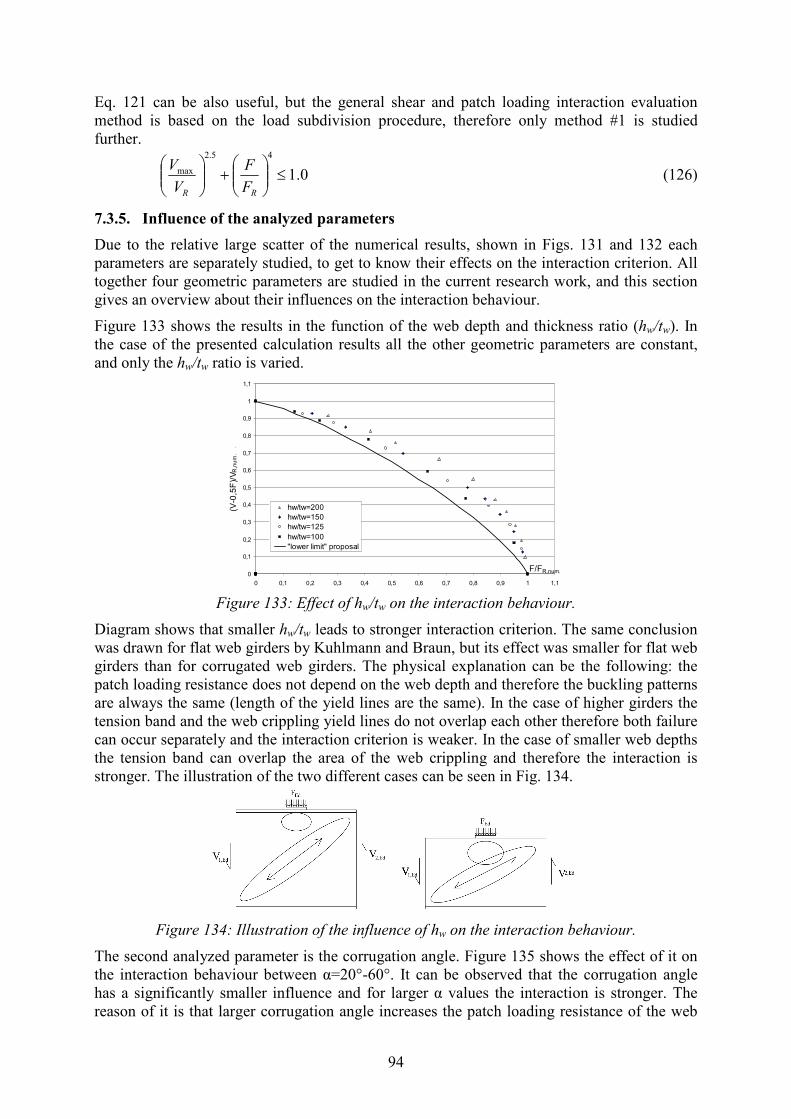
94
Eq. 121 can be also useful, but the general shear and patch loading interaction evaluation
method is based on the load subdivision procedure, therefore only method #1 is studied
further.
0.1
45.2
max ≤
+
RR F
F
V
V (126)
7.3.5. Influence of the analyzed parameters
Due to the relative large scatter of the numerical results, shown in Figs. 131 and 132 each
parameters are separately studied, to get to know their effects on the interaction criterion. All
together four geometric parameters are studied in the current research work, and this section
gives an overview about their influences on the interaction behaviour.
Figure 133 shows the results in the function of the web depth and thickness ratio (hw/tw). In
the case of the presented calculation results all the other geometric parameters are constant,
and only the hw/tw ratio is varied.
0
0,1
0,2
0,3
0,4
0,5
0,6
0,7
0,8
0,9
1
1,1
0 0,1 0,2 0,3 0,4 0,5 0,6 0,7 0,8 0,9 1 1,1
F/FR,num.
(V-0
,5F
)/V
R,n
um
.
.
hw/tw=200
hw/tw=150
hw/tw=125
hw/tw=100
"lower limit" proposal
Figure 133: Effect of hw/tw on the interaction behaviour.
Diagram shows that smaller hw/tw leads to stronger interaction criterion. The same conclusion
was drawn for flat web girders by Kuhlmann and Braun, but its effect was smaller for flat web
girders than for corrugated web girders. The physical explanation can be the following: the
patch loading resistance does not depend on the web depth and therefore the buckling patterns
are always the same (length of the yield lines are the same). In the case of higher girders the
tension band and the web crippling yield lines do not overlap each other therefore both failure
can occur separately and the interaction criterion is weaker. In the case of smaller web depths
the tension band can overlap the area of the web crippling and therefore the interaction is
stronger. The illustration of the two different cases can be seen in Fig. 134.
Figure 134: Illustration of the influence of hw on the interaction behaviour.
The second analyzed parameter is the corrugation angle. Figure 135 shows the effect of it on
the interaction behaviour between α=20°-60°. It can be observed that the corrugation angle
has a significantly smaller influence and for larger α values the interaction is stronger. The
reason of it is that larger corrugation angle increases the patch loading resistance of the web

95
panel. The patch loading resistance of the flange remains the same, therefore a larger part of
the total patch load is carried from the web and with coexisting shear force it leads to
resistance decrease. The absolute resistance of the girder is larger for larger corrugation
angles, only the interaction is moderately stronger.
0
0,1
0,2
0,3
0,4
0,5
0,6
0,7
0,8
0,9
1
1,1
0 0,1 0,2 0,3 0,4 0,5 0,6 0,7 0,8 0,9 1 1,1
F/FR,num.
(V-0
,5F
)/V
R,n
um
.
.
alpha=60°
alpha=40°
alpha=30°
alpha=20°
"lower limit" proposal
Figure 135: Effect of α on the interaction behaviour.
The third analyzed parameter is the fold width and thickness ratio (a1/tw). The effect of this
parameter is also relatively small, as presented in Fig. 136. It is in the same order of
magnitude as the corrugation angle.
0
0,1
0,2
0,3
0,4
0,5
0,6
0,7
0,8
0,9
1
1,1
0 0,1 0,2 0,3 0,4 0,5 0,6 0,7 0,8 0,9 1 1,1
F/FR,num.
(V-0
,5F
)/V
R,n
um
.
.
a1/tw=35a1/tw=30a1/tw=25a1/tw=20a1/tw=15"lower limit" proposal
Figure 136: Effect of the a1/tw on the interaction behaviour.
The fourth analyzed parameter is the loading length, its influence is presented in Fig. 137.
Investigations showed that this parameter is the most dominant, and it results in the largest
influence on the interaction behaviour. Larger loading length leads to stronger interaction
criterion. The same was observed by Kuhlmann and Braun for flat web girders.
0
0,1
0,2
0,3
0,4
0,5
0,6
0,7
0,8
0,9
1
1,1
0 0,1 0,2 0,3 0,4 0,5 0,6 0,7 0,8 0,9 1 1,1
F/FR,num.
(V-0
,5F
)/V
R,n
um
.
.
ss/hw=0,2
ss/hw=0,5
ss/hw=0,8
"lower limit" proposal
Figure 137: Effect of ss/hw on the interaction behaviour.

96
It can be explained by the same reason as before, that larger loading length increases the patch
loading resistance of the web. It means that the web carries a larger part from the total patch
loading resistance and with coexisting shear force it results stronger interaction. This
observation is significant in the development of the design interaction curve. The three
analyzed parameters showed that the interaction criteria depends on the ratio of flange and
web patch loading resistance. If the flange can carry a larger part of the applied load, the
smaller part should be carried from the web and it can be more efficient against the combined
loading situation. If the flange can carry only a smaller part of the applied load, the web
carries more and it results in a resistance decrease.
Based on this assumption the evaluation of the results is executed in the function of the FR,w/
FR,fl ratio (web to flange patch loading resistance). The ratio of the flange and web patch
loading resistances are calculated based on the design proposal developed by Kuhlmann and
Braun and modified and finalized in the current research introduced in Sections 2.5.2. and 3.4.
The ratio of the web and flange patch loading resistances are calculated by Eqs. (18) and (19)
for all analyzed girder. All the calculated results are characterized by this ratio and evaluation
is made in the function of it. Results showed that if the FR,w/FR,fl ratio is larger, the interaction
criteria is stronger, as shown in Fig. 138. A ”lower limit” interaction curve can be given
which is on the safe side for all analyzed girder geometries, but it is uneconomical in some
cases. Based on the assumption that the interaction criteria depends on the FR,w/FR,fl ratio, a
”moving” interaction curve is also developed, what always matches to the analyzed girder
geometry. It can be expressed in the form of Eq. (127).
0.15.0
≤
+
⋅−b
R
a
R F
F
V
FV (127)
Numerical calculations showed that the results are nearly symmetrical on a line beginning
from zero with a gradient of 45°, therefore indexes a and b can be set to equal (a=b) with a
good approximation. Previous investigations of Elgaaly and Seshadri also proved this
assumption.
0
0,1
0,2
0,3
0,4
0,5
0,6
0,7
0,8
0,9
1
1,1
0 0,1 0,2 0,3 0,4 0,5 0,6 0,7 0,8 0,9 1 1,1
F/FR,num
(V-0
,5F
) /
VR
,nu
m
.
F R,w / F R,fl=1,00
F R,w / F R,fl=2,0
F R,w / F R,fl=2,6
F R,w / F R,fl=3,2
F R,w / F R,fl=3,75
current proposal (a=1.6)
current proposal (a=1.4)
current proposal (a=1.3)
current proposal (a=1.25)
current proposal (a=1.2)
Figure 138: Effect of Fu,w/Fu,fl ratio on the interaction behaviour.
Figure 138 shows the applicable interaction curves for different FR,w/FR,fl ratios, and indexes
are noted on the diagram. The lowest index is 1.2, stronger interaction is not needed in the
analyzed parameter range. If the web and flange resistance ratio is smaller, the exponent of
the interaction equation can be larger. Applicable exponents are presented in the function of
FR,w/FR,fl in Fig. 139. Relationship can be approximated by an exponential function and the
shear and patch loading interaction can be calculated by Eq. (128).
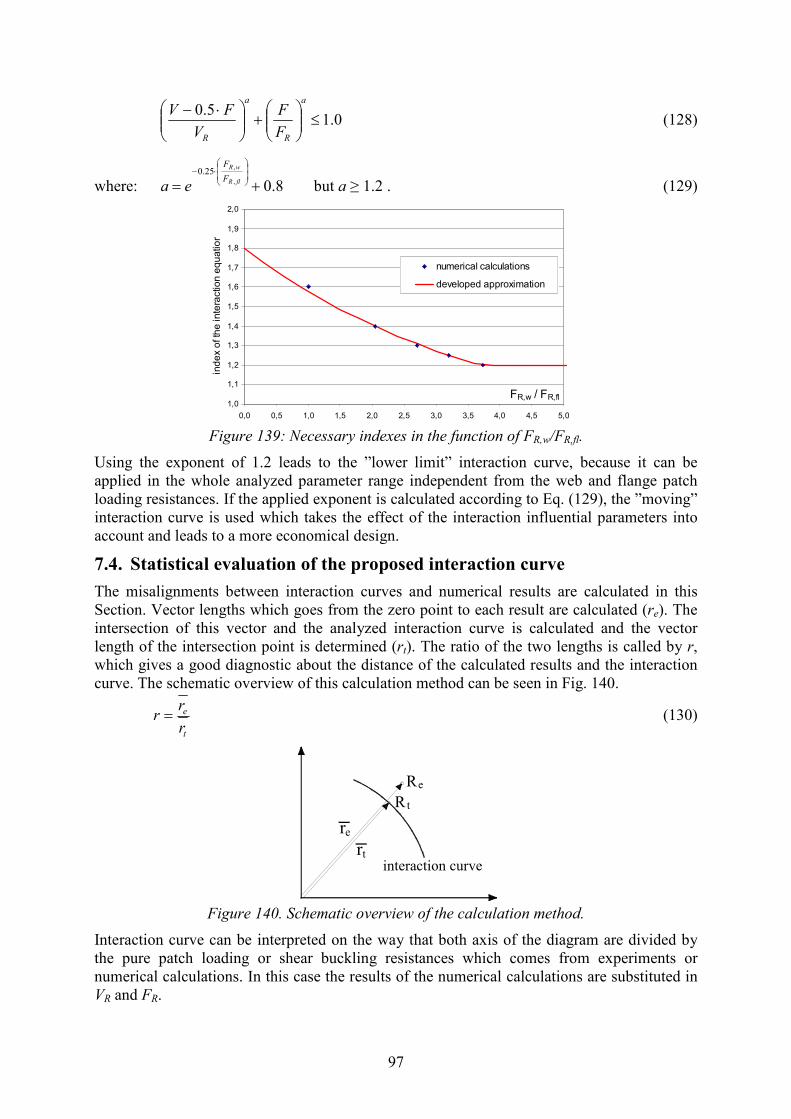
97
0.15.0
≤
+
⋅−a
R
a
R F
F
V
FV (128)
where: 8.0,
,25.0
+=
⋅−
flR
wR
F
F
ea
but a ≥ 1.2 . (129)
1,0
1,1
1,2
1,3
1,4
1,5
1,6
1,7
1,8
1,9
2,0
0,0 0,5 1,0 1,5 2,0 2,5 3,0 3,5 4,0 4,5 5,0
FR,w / FR,fl
ind
ex
of
the
in
tera
cti
on
eq
ua
tio
n
numerical calculations
developed approximation
Figure 139: Necessary indexes in the function of FR,w/FR,fl.
Using the exponent of 1.2 leads to the ”lower limit” interaction curve, because it can be
applied in the whole analyzed parameter range independent from the web and flange patch
loading resistances. If the applied exponent is calculated according to Eq. (129), the ”moving”
interaction curve is used which takes the effect of the interaction influential parameters into
account and leads to a more economical design.
7.4. Statistical evaluation of the proposed interaction curve
The misalignments between interaction curves and numerical results are calculated in this
Section. Vector lengths which goes from the zero point to each result are calculated (re). The
intersection of this vector and the analyzed interaction curve is calculated and the vector
length of the intersection point is determined (rt). The ratio of the two lengths is called by r,
which gives a good diagnostic about the distance of the calculated results and the interaction
curve. The schematic overview of this calculation method can be seen in Fig. 140.
t
e
r
rr = (130)
Re
R t
re
rtinteraction curve
Figure 140. Schematic overview of the calculation method.
Interaction curve can be interpreted on the way that both axis of the diagram are divided by
the pure patch loading or shear buckling resistances which comes from experiments or
numerical calculations. In this case the results of the numerical calculations are substituted in
VR and FR.

98
0.15.0
,,
≤
+
⋅−a
numR
a
numR F
F
V
FV
(131)
Results of all numerical calculations and proposed interaction curve of Elgaaly and Seshadri
and the ”lower limit” interaction curve are shown in Fig. 141.
0
0,1
0,2
0,3
0,4
0,5
0,6
0,7
0,8
0,9
1
1,1
0 0,1 0,2 0,3 0,4 0,5 0,6 0,7 0,8 0,9 1 1,1
F/FR,num
(V-0
,5F
) /V
R,n
um
.
numerical calculations
numerical results of Elgaaly et al.
Elgaaly & Seshadri (for corrugated webs)
current proposal: "lower limit" interaction curve
Figure 141: Interaction by numerical resistances of VR,num and FR,num .
The r values are calculated for all numerical results, where pure patch loading and shear
resistances are taken from the numerical calculations (VR,num and FR,num). Mean value,
standard deviation, coefficient of variation, 5% fractile and minimum and maximum values of
r are calculated and listed in Table 21. The calculation is executed based on the interaction
curve of Elgaaly and Seshadri, based on the currently proposed ”lower limit”, and ”moving”
interaction curve.
Table 21: Statistical evaluation based on the resistances of VR_Ansys and FR_Ansys .
Interaction curve
of Elgaaly et al
Current proposal
„lower limit“
Current proposal
„moving limit“
Mean value 1.071 1.086 1.042
Standard deviation 0.066 0.073 0.038
Coeff. of variation 0.062 0.067 0.037
5% lower fractile 0.963 0.967 0.979
5% upper fractile 1.179 1.206 1.105
maximum 1.350 1.381 1.145
minimum 0.980 1.000 0.986
Results show that the mean value of the r is the nearest to 1.00 in case of the moving
interaction curve and the standard deviation is also here the smallest. It means that this
interaction curve gives the best approach of the numerical calculations. Table 21 shows that
the proposed „lower limit“ interaction curve gives a slightly stronger interaction criteria, and
this curve can be applied for all girder geometry in the analyzed parameter range.

99
7.5. Conclusions
In the frame of the presented research work the combined shear and patch loading of girders
with corrugated steel web is analyzed. In advance the previous experiments, numerical
investigations and existing interaction curves are studied. Only one investigation is available
in the literature dealing with this interaction type for corrugated web girders and it was
focused only on a narrow parameter range and no experiments were executed. Therefore the
focus of the current research is the determination of the shear and patch loading interaction
behaviour of corrugated web girders by nonlinear finite element simulation for an extended
parameter range.
Based on previous patch loading experiments conducted at the Budapest University of
Technology and Economics a finite element model is developed and verified for all test
specimens. The load carrying capacities are determined by geometrical and material nonlinear
analysis using imperfections. Based on the verified numerical model a parametric study is
executed to investigate the shear and patch loading interaction behaviour of corrugated web
girders in a large parameter range.
The analyzed parameters are the web depth and thickness, the corrugation angle, the fold and
loading lengths. The effect of each parameters on the interaction behaviour is analyzed and
tendencies are determined. Results are compared to the previously developed interaction
curves and a new design interaction equation is proposed which is applicable for corrugated
web girders in the analyzed parameter range. The analyzed parameters showed that the
interaction criteria depends significantly on the ratio of the flange and web patch loading
resistances. If the flange can carry a larger part of the applied load, the smaller part should be
carried from the web and it can be more efficient against the combined loading situation. If
the flange can carry only a smaller part of the applied load, the web carries more and it results
in a stronger interaction criteria.
Using the lowest developed index in the interaction equation (1.2), it leads to a „lower limit“
interaction curve, and it can be applied in the whole analyzed parameter range independent
from the web and flange patch loading resistances. If the applied index is calculated according
to the currently developed relationship, the „moving“ interaction curve is used which takes
the effect of the interaction influential parameters into account and leads to a more
economical design.
Interaction of bending moment and transverse force is also an important aspect of the load
bearing capacity as proved by several researchers in the past [45], [46], [48], [49] and [50].
Mainly the flanges are responsible to carry the bending moments and at the same time flanges
can have an important role in the patch loading resistance as well, especially in case of
bridges where the flanges are relative thick. Therefore the interaction of these two effects, or
the interaction of all three effects (bending moment, shear and transverse forces) should be
also considered in the design. In the current research the interaction of shear and transverse
force is investigated, the interaction with bending moment is the subject of future
investigations.

100
8. Summary and conclusions
8.1. New scientific results
Results of the presented research work is summarised in the following new scientific results.
8.1.1. The thesis of the dissertation in English
Thesis 1.
I identified the geometric parameters which have influence on the patch loading resistance
and I determined the behavioural tendencies of them by nonlinear finite analysis.
a, I developed a numerical database where the patch loading resistance of
trapezoidally corrugated web girders is determined in a parameter range what is
typical for bridges.
b, I determined and characterised the failure modes which can be local buckling of
the folds or global bucking of the whole web.
c, I determined the relationships between the patch loading resistance and the loading
length, local web ratio, corrugation angle, flange width, flange thickness, loading
width and the loading eccentricities if the failure mode is local buckling of the
corrugated web.
Publications linked to the thesis: [1], [5], [6], [7].
Thesis 2.
A modified analytical design method is developed to determine the patch loading resistance of
girders with corrugated webs in the cooperation between the University of Stuttgart, Institute
of Structural Design and BME Department of Structural Engineering. The design method
development is based on experimentally verified finite element simulations and on
experimental results taken from literature. The following part of the thesis focuses only on my
research results.
a, I investigated the previously developed design models and I determined that the
design method of Kähönen gave the best approach in the analysed parameter range
if the failure mode is local buckling of the corrugated web.
b, I extended the design method to take the effect of the load introduction width, and
the loading eccentricities into account. I developed and determined the parameter
range of the application for the proposed design methods.
c, The developed design methods are statistically evaluated and partial factors are
derived to determine the design resistance level.
d, I determined the constructional rules to avoid the local transverse flange bending
failure mode.
Publications linked to the thesis: [1], [10].
Thesis 3.
I designed and executed an experimental research program on 12 large scale test specimens to
determine the patch loading resistance of girders with corrugated webs.
a, I analysed and described the observed failure modes and structural behaviours in
the function of the investigated parameters.

101
b, I determined that the patch loading resistance is depending also on the flange and
web thickness ratio (tf/tw) and the tendency of it is clarified.
c, I modified the resistance model developed by Braun and Kuhlmann based on the
experimental results.
Publications linked to the thesis: [1], [2].
Thesis 4.
I developed a finite element based design method to determine the patch loading resistance of
girders with corrugated web.
a, I determined the effect of the equivalent geometric imperfection on the structural
behaviour (stiffness, patch loading resistance, post-ultimate behaviour and failure
modes).
b, I analysed three different imperfection shapes and I determined their effects on the
structural behaviour. I developed a new equivalent geometric imperfection shape
which is based on the first local buckling mode and what can be given in a closed
form equation.
c, I determined the proposed scaling factor of the equivalent geometric imperfection
shape based on the imperfection sensitivity analysis and the experimental results.
Publications linked to the thesis: [2], [9].
Thesis 5.
I developed an interaction equation to determine the resistance of the corrugated web girders
under combined shear and transverse forces.
a, I proved that the interaction proposal of Elgaaly and Seshadri gives a good "lower
limit" interaction approximation for corrugated web girders in a larger parameter
range than they analysed.
b, I developed and introduced an "moving" interaction equation which takes the
girder geometry and the loading conditions also into account, therefore it leads to a
more economic design.
Publication linked to the thesis: [3].

102
8.1.2. The thesis of the dissertation in Hungarian
1. tézis
Meghatároztam azokat a geometriai paramétereket, melyek befolyásolják a trapézgerincő
tartók beroppanási ellenállását és meghatároztam ezek hatását a szerkezeti viselkedésre
nemlineáris végeselemes analízis alapján.
a, Kidolgoztam egy adatbázist, mely a trapézgerincő tartók beroppanási ellenállási
értékeit tartalmazza a hídszerkezetekre jellemzı paraméter-tartományban.
b, Meghatároztam a keresztirányú erı hatására létrejövı lehetséges tönkremeneteli
módokat, mely lehet az egyes lemezmezık lokális horpadása, valamint a teljes
gerinclemez globális horpadása.
c, Meghatároztam a beroppanási ellenállás és a vizsgált paraméterek közti
összefüggéseket, ha a tönkremenetel módja a gerinclemez lokális horpadása. A
vizsgált paraméterek az erıbevezetési hossz, a lemezmezı szélesség/vastagság
aránya, a hajlítási szög, az övlemez szélessége és vastagsága, valamint az
erıbevezetés szélessége és a külpontosság.
A tézishez kapcsolódó publikációk: [1], [5], [6], [7].
2. tézis
A trapézlemez gerincő tartók beroppanási ellenállásának meghatározására egy módosított
méretezési eljárás lett kidolgozva a BME Hidak és Szerkezetek Tanszéke és a Stuttgarti
Egyetem Konstruktion und Entwurf Tanszékének együttmőködésében. A méretezési eljárás
szakirodalmi kísérleteken és a kísérletek által verifikált numerikus számítások alapján lett
kidolgozva. A tézis a témakörben elvégzett saját kutatási eredményeket foglalja össze.
a, Megvizsgáltam és elemeztem a korábban kidolgozott trapézgerincő tartók
beroppanási ellenállását meghatározó méretezési eljárásokat, és megállapítottam,
hogy Kähönen méretezési eljárása adja a legjobb eredményt a vizsgált
paramétertartományban, ha a tönkremeneteli mód a gerinclemez lokális horpadása.
b, Kiegészítettem a méretezési módszert az erıbevezetési szélesség teherbírást
befolyásoló hatásának, valamint az erıbevezetés külpontosságából származó
teherbíráscsökkenés figyelembe vételével. Kidolgoztam és meghatároztam a
kidolgozott méretezési módszerek alkalmazási tartományát.
c, A méretezési eljárás eredményeit statisztikailag kiértékeltem és meghatároztam az
alkalmazandó parciális tényezı értékét az ellenállás tervezési szintjének
meghatározásához.
d, Megadtam azokat a szerkesztési szabályokat, melyek alkalmazásával a lokális
keresztirányú övhajlítási tönkremenetel elkerülhetı.
A tézishez kapcsolódó publikációk: [1], [10].
3. tézis
Megterveztem és végrehajtottam egy kísérleti programot trapézlemez gerincő tartók
beroppanási ellenállásának meghatározására 12 nagy léptékő próbatesten.
a, Meghatároztam és jellemeztem a kísérletben tapasztalt tönkremeneteli módokat és
szerkezeti viselkedéseket a vizsgált paraméterek függvényében.
b, Megállapítottam, hogy a beroppanási ellenállásban az övlemez ellenállása függ az
öv- és gerinclemez vastagságának arányától (tf/tw) is, és a köztük lévı összefüggést
meghatároztam.

103
c, A kísérletek alapján a Braun és Kuhlmann által kidolgozott méretezési eljárást
pontosítottam.
A tézishez kapcsolódó publikációk: [1], [2].
4. tézis
Kidolgoztam egy végeselem alapú méretezési eljárást trapézgerincő tartók beroppanási
ellenállásának meghatározására.
a, Meghatároztam a helyettesítı geometriai imperfekció hatását a szerkezeti
viselkedésre (a merevségre, a beroppanási ellenállásra, a leszálló ágra, valamint a
tönkremeneteli módra).
b, Három különbözı imperfekciós alakot vizsgáltam és meghatároztam a hatásukat a
szerkezeti viselkedésre. Egy módosított alakot dolgoztam ki a helyettesítı
geometriai imperfekció felvételére, mely a lokális horpadáshoz tartozó sajátalakon
alapszik és zárt képlet formájában megadható.
c, Az imperfekcióérzékenységi vizsgálat és a kísérleti eredmények alapján ajánlást
dolgoztam ki a helyettesítı geometriai imperfekció nagyságának felvételére.
A tézishez kapcsolódó publikációk: [2], [9].
5. tézis
Interakciós görbét dolgoztam ki a koncentrált keresztirányú erı és nyíróerı kölcsönhatásának
figyelembe vételétre.
a, Igazoltam, hogy az Elgaaly és Seshadri által kidolgozott ajánlás a nyírás és a
koncentrált keresztirányú erı interakciójának figyelembe vételére egy jó közelítést
ad egy, az általuk vizsgált paramétertartománynál sokkal szélesebb tartományban
is.
b, Kidolgoztam és bevezettem egy u.n. „mozgó” interakciós görbét, mely figyelembe
veszi az interakciót befolyásoló geometriai paraméterek hatását és a tartó terhelési
viszonyát, mely eredményeként gazdaságosabb tervezést tesz lehetıvé.
A tézishez kapcsolódó publikáció: [3].
104
8.2. Publications on the subject of the thesis
International journal papers
1. B. Kövesdi, B. Braun, U. Kuhlmann, L. Dunai: „Patch loading resistance of girders with
corrugated webs”, Journal of Constructional Steel Research. (accepted for publication)
2. B. Kövesdi, L. Dunai: „Determination of the patch loading resistance of girders with
corrugated webs using nonlinear finite element analysis”, Computers and Structures. (submitted for publication)
3. B. Kövesdi, U. Kuhlmann, L. Dunai: „Combined shear and patch loading of girders with
corrugated webs”, Periodica Polytechnica - Civil Engineering. (accepted for
publication)
Hungarian journal papers
4. B. Kövesdi, L. Dunai: „Trapézlemez gerincő tartók fáradási viselkedése – kísérleti
vizsgálat ”, MAGÉSZ Acélszerkezetek, VI. évfolyam, 1. szám, pp. 38-43, 2009.
International conference papers
5. U. Kuhlmann, B. Braun, B. Kövesdi: „The patch loading resistance of girders with
corrugated webs”, Proceedings of the Fifth International Conference on Coupled
Instabilities in Metal Structures CIMS2008, Volume 1, June 23-25, 2008, Sydney,
Australia, pp. 309-316, 2008. ISBN 978-0-646-49439-5.
6. B. Kövesdi, B. Braun, U. Kuhlmann, L. Dunai: „Enhanced design method for the patch
loading resistance of girders with corrugated webs”, Proceedings of the 5th European
Conference on Steel and Composite Structures, EUROSTEEL 2008, Volume B,
September 3-5, 2008, Graz, Austria, pp. 1155-1160. ISBN 92-0147-000-90.
7. B. Kövesdi: „Model development for determination of the patch loading resistance of
hybrid girders with corrugated webs”, Proceedings of the 7th International PhD
Symposium in Civil Engineering, September 11-13, 2008, Stuttgart, Germany, full
paper on CD, pp.39-48.
8. B. Kövesdi, L. Dunai: „Experimental fatigue analysis of girders with corrugated web”,
Proceedings of the 25th Danubia-Adria Symposium on Advances in Experimental
Mechanics, September 24-27, 2008, Ceske Budejovice (Budweis) and Cesky Krumlov,
Czech Republic, pp. 127-128. ISBN 978-80-01-04162-8.
9. B. Kövesdi, L. Dunai: „Determination of the patch loading resistance of girders with
corrugated webs using nonlinear finite element analysis”, Proceedings of the Twelfth
International Conference on Civil, Structural and Environmental Engineering
Computing, September 1-4, 2009, Funchal, Portugal, Stirlingshire: Civil-Comp Press,
18 p. Paper No. 16. ISBN:978-1-905088-32-4.
10. B. Kövesdi, L. Dunai, U. Kuhlmann: „Analysis and design of corrugated web girders
under eccentric patch loading”, Proceeding of the 8th International PhD Symposium in
Civil Engineering, June 20-23, 2010, Lyngby, Denmark, pp. 159-164. ISBN
9788778773012.

105
Presentations
1. „Trapézlemez gerincő hibrid hidak beroppanásvizsgálatának numerikus modellezése”,
VII. ANSYS Conference, April 17, 2008, Budapest, Hungary.
2. „Enhanced design method for the patch loading resistance of girders with corrugated
webs” 5th European Conference on Steel and Composite Structures, EUROSTEEL
2008, September 3-5, 2008, Graz, Austria,
3. „Model development for determination of the patch loading resistance of hybrid girders
with corrugated webs”, 7th International PhD Symposium in Civil Engineering,
September 11-13, 2008, Stuttgart, Germany.
4. „Experimental fatigue analysis of girders with corrugated web”, 25th Danubia-Adria
Symposium on Advances in Experimental Mechanics, September 24-27, 2008, Ceske
Budejovice (Budweis) and Cesky Krumlov, Czech Republic.
5. „Trapézlemez gerincő tartók vizsgálata”, PhD Seminar at the BME Department of
Structural Engineering, October 7, 2008, Budapest, Hungary.
6. „Trapézlemez gerincő tartók beroppanásvizsgálata”, PhD Seminar at the BME
Department of Structural Engineering, March 24, 2009, Budapest, Hungary.
7. „Imperfections for use with corrugated webs”, 8th Official Meeting of ECCS-TWG 8.3,
April 24, 2009, Stuttgart, Germany.
8. „Lokale Krafteinleitung in Trägern mit trapezförmig profillierten Stegen”, Workshop
Presentation at the University of Stuttgart, Institute of Structural Design, October 26,
2009, Germany.
9. „Beroppanás és nyírás interakciójának vizsgálata trapézgerincő tartókon”, PhD Seminar
at the BME Department of Structural Engineering, March 5, 2010, Budapest, Hungary.
10. „Combined shear and patch loading of girders with corrugated webs”, 10th Official
Meeting of ECCS-TWG 8.3, April 30, 2010, Cottbus, Germany.

106
8.3. Proposal for further study
On the bases of the results presented in the thesis the research is planed to be extended on the
following way:
The actually developed design method of the patch loading resistance does not consider the
possible interaction of the different effects acting on the loaded girder. Separated interaction
equation is developed in this thesis for combined shear and transverse force, but the
interaction of the bending moment and transverse force and the interaction of all the three
effects could be investigated. Interaction of the combined bending and transverse force should
be especially investigated because the bending moment can reduce significantly the flange
contribution in the patch loading resistance.
The presented results, evaluations and conclusions in this thesis can be appiled only for
girders with trapezoidally corrugated web. Investigations could be extended for sinusoidally
corrugated web girders. The patch loading failure mechanism and structural behaviour of both
structure types are the same, therefore the patch loading resistance model and the developed
interaction criterias could have the same bases.
Further research topic could be the investigation of the effect of the concrete deck on the
patch loading resistance. It is possible that the launching of the bridge structure is executed by
finished conrete decks. In this case the concrete deck takes part in the patch loading resistance
and the ultimate load can be increased. The magnitude of this resistance increase could be
studied.
107
References
[1] http://www.psmic.co.jp/ps_english/gijyutu
[2] http://de.structurae.de/structures/data/index.cfm?ID=s0000849
[3] U. Kuhlmann, B. Braun: „Berechnungs- und Konstruktionsgrundlagen für sandwichähnliche Verbundträger mit Trapezstegen im Brückenbau”, Part of the Final Report, Project No. P 645, Forschungsvereinigung Stahlanwendung (FOSTA), Düsseldorf, Germany, 2008.
[4] EN 1993-1-5:2005; EUROCODE 3: Design of steel structures Part 1-5: Plated structural elements.
[5] A. Kähönen: „Zur Einleitung von Einzellasten in I-Träger mit trapezförmig profilierten Stegen”, Stahlbau 57, No. 8, pp.250-252, 1988.
[6] L. Davaine: „I-girders launching – Influence of load eccentricity”, COMBRI project, RFCS Contract RFS-CR-03018, Document COMBRI-Report-SETRA-001, 2007.
[7] U. Kuhlmann, B. Braun: „Combined Shear- and Patch Loading: Numerical Studies and Development of an Interaction Equation”, COMBRI project, RFCS Contract RFS-CR-03018, Document COMBRI-Report-USTUTT-002, 2006.
[8] L. Leiva-Aravena, B. Edlund: „Buckling of trapezoidally corrugated webs”, Proceedings of the ECCS Colloquium on Stability of Plates and Shells. Ghent, Belgium, 1987.
[9] M. Elgaaly, A. Seshadri: „Girders with corrugated webs under partial compressive edge loading”, Journal of Structural Engineering, No. 6, pp.783-791, 1997.
[10] R. Luo, B. Edlund: „Ultimate strength of girders with trapezoidally corrugated webs under patch loading”, Thin-Walled Structures, Vol. 123, No. 6, pp.135-156, 1996.
[11] T.M. Roberts, K.C. Rockey: „A mechanism solution for predicting the collapse loads of slender plate girders when subjected to in-plate patch loading”, Proc. Instn. Civil Engineers, Vol. 67, No. 2, pp.155-175, 1979.
[12] B. Kövesdi, B. Braun, U. Kuhlmann, L. Dunai: „Enhanced design method for the patch loading resistance of girders with corrugated webs”, Proceedings of the 5th European Conference on Steel and Composite Structures, EUROSTEEL 2008, Volume B, September 3-5, 2008, Graz, Austria, pp.1155-1160.
[13] ANSYS® v10.0, Canonsburg, Pennsylvania, USA. [14] Kövesdi B. „The patch loading resistance of corrugated steel webs used in bridge
building”, Diploma Thesis. Cooperation between the Institute of Structural Design, University of Stuttgart, Germany and Department of Structural Engineering, Budapest University of Technology and Economics, Hungary, 2007.
[15] L.G. Vigh: „Virtual and real test based analysis and design of non-conventional thin-walled metal structures”, PhD thesis, Budapest University of Technology and Economics, p. 128, Budapest, Hungary, 2006.
[16] L.G. Vigh, L. Dunai: „Finite element modelling and analysis of bolted joints of 3D tubular structures”, Computers & Structures, Vol. 82, pp.2173-2187, 2004.
[17] L.G. Vigh, L. Dunai: „Advanced stability analysis of regular stiffened plates and complex plated elements”, keynote lecture, Proc. SDSS 2010 International Colloquium on Stability and Ductility of Steel Structures, September 8-10, 2010, Rio de Janeiro, Brasil. (in press)
[18] L. Pavlovčič, A. Detzel, U. Kuhlmann, D. Beg: „Shear resistance of longitudinally stiffened panels - Part 1: Tests and numerical analysis of imperfections”, Journal of Constructional Steel Research, No. 63, pp.337-350, 2007.
108
[19] H. Degée, A Detzel, U. Kuhlmann: „Interaction of global and local buckling in welded RHS compression members”, Journal of Constructional Steel Research, No. 64, pp.755-765, 2008.
[20] R. Chacón, E. Mirambell, E. Real: „Influence of designer-assumed initial conditions on the numerical modelling of steel plate girders subjected to patch loading”, Thin-walled structures, No. 47, pp.391-402, 2009.
[21] D. Dubina, V. Ungureanu: „Effect of imperfections on numerical simulation of instability behaviour of cold-formed steel members”, Thin-walled structures, No. 40, pp.239-262, 2002.
[22] E. Maiorana, C. Pellegrino, C. Modena: „Imperfections in steel girders with and without perforations under patch loading”, Journal of Constructional Steel Research, No. 65, pp.1121-1129, 2009.
[23] J. Oxfort: „Versuche zum Beul- und Krüppelverhalten von unversteiften Trägerstegbleche unter zentrischen und excentrischen Einzellasten auf dem Obergurt”, Stahlbau, No. 10, pp.309-312, 1983.
[24] M. Elgaaly, W. Nunan: „Behaviour of rolled section web under eccentric edge compressive loads”, Journal of Structural Engineering, ASCE, Vol. 115, No. 7, July 1989.
[25] M. Elgaaly, R. Salkar: „Behaviour of webs under eccentric compressive edge loads”, Proc. of IUTAM Symposium on Contact Loading and Local Effects in thin-walled plated and shell structures, Prague, 1990.
[26] M. Elgaaly, R. Salkar, M. Eash: „Webs under compressive edge loads”, Research transformed into practice, pp. 591-600, 1995.
[27] M. Drdacky: „On two particular problems of plate girder webs under partial edge loads”, Journal of Constructional Steel Research, Vol. 20, pp.183-190, 1991.
[28] J. Raoul, I. Schaller, J.N. Theillout: „Tests of buckling of panels subjected to in-plane patch loading”, Proceeding of IUTAM Symposium on Contact Loading and Local Effects in thin-walled plated and shell structures, Prague, 1990.
[29] D. Lučić, B. Šćepanović: „Experimantal investigation on locally pressed I-beam subjected to eccentric patch loading”, Journal of Constructional Steel Research. Vol. 60, pp.525-534, 2004.
[30] D. Lucic: „Experimental research on I-girders subjected to eccentric patch loading”, Journal of Constructional Steel Research, Vol. 59, pp.1147-1157, 2003.
[31] B. Sćepanović, S. Aleksic, D. Lucic: „An experimental research "ekscentro 2007" - experimental testing of eccentrically patch loaded steel I-girders”, Proceedings of the 5th European Conference on Steel and Composite Structures, EUROSTEEL 2008, Volume B, September 3-5, 2008, Graz, Austria, pp.1149-1154.
[32] B. Šćepanović, L.M. Gil-Martín, E. Hernández-Montes, M. Aschheim, D. Lučić: „Ultimate strength of I-girders under eccentric patch loading: Derivation of a new strength reduction coefficient”, Engineering Structures, Vol. 31, pp.1403-1413, 2009.
[33] L. Davaine: „Competitive steel and composite bridges by improved steel plated structures: I-girders launching; Influence of load eccentricity”, COMBRI project, RFCS Contract RFS-CR-03018, Document COMBRI-Report-SETRA-001, 2006.
[34] EN 1990:2001; EUROCODE: Basis of structural design. [35] L. Gabeler: „Statistical Evaluation of Patch Loading Resistance Models for Welded
Steel Girders”, Diploma Thesis. University of Stuttgart, Institut of Structural Design, Germany, 2009.
[36] C. Rebelo, N. Lopes, S.L. da Silva, D. Nethercot, P.M.M. Vila Real: „Statistical evaluation of the lateral-torsional buckling resistance of steel I beams, Part 1: Variability

109
of the Eurocode 3 resistance model”, Journal of Constructional Steel Research, Vol. 65, pp.818-831, 2009.
[37] S.L. da Silva, C. Rebelo, D. Nethercot, L. Marques, R. Simoes, P.M.M Vila Real: „Statistical evaluation of the lateral-torsional buckling resistance of steel I beams, Part 2: Variability of steel properties”, Journal of Constructional Steel Research, Vol. 65, pp.832-849, 2009.
[38] http://www.jcss.ethz.ch/publications/PMC/RESISTANCES/DIMEN00.PDF [39] EN 1993-2:2006; EUROCODE 3: Design of steel structures Part 2: Steel bridges. [40] M. Elgaaly: „Failure of thin-walled members under patch loading and shear”,
Proceedings of the 3th International Conference on Cold Formed Steel Structures, University of Missouri-Rolla, Montana, USA, pp.357-381, 1975.
[41] P. Zoetemeijer: „The influence of normal-, bending- and shear stresses on the ultimate compression force exerted laterally to European rolled sections”, Report 6-80-5, Department of Civil Engineering, Delft University of Technology, Delft, 1980.
[42] J. Oxfort, N. Weber: „Versuche zum Stegblechbeulen bei Einzellasteinleitung und Biegung oder Querkraft”, Bericht 7/1981, Institut für Stahlbau und Holzbau, Universität Stuttgart, 1981.
[43] T.M. Roberts, F. Shahabian: „Design procedures for combined shear and patch loading”, Proceedings of the Institution of Civil Engineers, Structures & Buildings, pp.219-225, August, 2000.
[44] F. Shahabian, T.M. Roberts: „Combined Shear-and-Patch loading of plate girders”, Journal of Structural Engineering, No. 3, pp.316-321, 2000.
[45] T.M. Roberts, F. Shahabian: „Ultimate resistance of slender web panels to combined bending shear and patch loading”, Journal of Constructional Steel Research, No. 57, pp.779-790, 2001.
[46] P. Granath, A Thorsson, B. Edlund: „I-shaped steel girders subjected to bending moment and travelling patch loading”, Journal of Structural Engineering, No. 54, pp.409-421, 2000.
[47] E. Maiorana, C. Pellegrino, C. Modena: „Linear buckling analysis of unstiffened plates subjected to both patch load and bending moment”, Journal of Constructional Steel Research, No. 30, pp.3731-3738, 2008.
[48] C. Graciano, E. Casanova: „Ultimate strength of longitudinally stiffened I-girder webs subjected to combined patch loading and bending”, Journal of Constructional Steel Research, No. 61, pp.93-111, 2005.
[49] L.G. Vigh: „Influence of flange-to-web connection on the patch load resistance of I-beams”, Proc. SDSS 2010 International Colloquium on Stability and Ductility of Steel Structures, September 8-10, 2010, Rio de Janeiro, Brasil. (in press)
[50] T.M. Roberts, F. Shahabian: „Ultimate resistance of slender web panels to combined bending, shear and patch loading”, Journal of Constructional Steel Research, No. 57(7), pp.779-790, 2001.