Embed Size (px)
Citation preview
Phase Segregation in Cerium-Lanthanum Solid Solutions
V. Belliere,† G. Joorst,† O. Stephan,‡ F. M. F. de Groot,† and B. M. Weckhuysen*,†
Inorganic Chemistry and Catalysis, Department of Chemistry, Utrecht UniVersity, Sorbonnelaan 16,3584 CA Utrecht, The Netherlands, and Laboratoire de Physique des Solides, UniVersiteParis-Sud,91405 Orsay Ce´dex, France
ReceiVed: February 10, 2006; In Final Form: March 29, 2006
Electron energy-loss spectroscopy (EELS) in combination with scanning transmission electron microscopy(STEM) reveals that the La enrichment at the surface of cerium-lanthanum solid solutions is an averagedeffect and that segregation occurs in a mixed oxide phase. This separation occurs within a crystalline particle,where the dopant-rich phase is located at the surface of the dopant-deficient phase. The limiting structureappears to be a solid solution with a La fraction ofx ) 0.6 in the bulk andx ) 0.75 at the surface. Up to aLa fraction of 0.6, this phase will coexist with a lanthanum-type structure in different proportions dependingon the dopant amount. STEM-EELS appears to be a powerful technique to clarify the existence of a multiphasesystem, and it shows that XRF, XPS, and XRD measure averaged results and do not show the phase complexityof the solids.
Introduction
Cerium-lanthanum-based compounds have become keycomponents in the formulation of several commercial materials.They are widely used as catalysts for reducing CO, hydrocar-bons, and NOx emissions from gasoline engines;1-4 for sootoxidation;5 and as electrolyte materials of solid oxide fuel cells6
but also as sorbents for desulfurization processes.7 In the fieldof environmental catalysis, lanthanum oxide is well-known assurface stabilizer of supports based on alumina and zirconia,8,9
while the catalytic activities of pure and doped cerium havebeen associated with, for instance, interstitial oxides,10,11latticeoxygen atoms,12,13structural defects,14,15basicity of surfaces,16
and redox activity.3,9,17,18 In most of these studies, catalyticactivities have been reported as a function of the bulk composi-tion of cerium-lanthanum mixed oxides, and only a few studieshave focused on correlating catalytic activities to both bulk andsurface composition.18,19 It appeared that the activity dependson the mixed oxide composition, which implies that the resultswill be different whether they are expressed as a function ofthe chemical composition of the bulk or of the surface.
Cerium crystallizes in the cubic fluorite structure, with cationsin 8-fold and anions in 4-fold coordination. Lanthanum crystal-lizes in the A-type hexagonal structure and consists of layered[LaO]nn+ cations separated by discrete layers of O2- anions togive La a 7-fold coordination. The layers of [LaO]n
n+ are formedfrom edge-sharing [OLa]4 tetrahedra disposed in a two-dimensional hexagonal array perpendicular to thec-axis. Mixedcerium-lanthanum oxides, Ce1-xLaxO2-x/2, form solid solutionsin either the fluorite or the A-type lanthanum oxide structure.However, these systems are much more complex than usuallythought. Solubility limits for lanthanum oxide are usually quotedbetween 40 and 70%.20,21 Wilkes and co-workers have shownthat, with cerium-lanthanum mixed oxides prepared by aprecipitation method, over the major part of the composition
range, up tox ) 0.6 lanthanum forms a solid solution in cerium;abovex ) 0.9, cerium forms a solid solution in lanthanum;and the range betweenx ) 0.6 andx ) 0.9 results in theformation of mixed phases.22 Lanthanum and cerium exhibitpreferential segregation to the surface of their solid solutionsin cerium and lanthanum, respectively. This phenomenon hasbeen attributed to changes in segregation energy with surfacecoverage because of solute-solute interactions.23 However,these conclusions result in a statistical-mechanical model, andno phase characterization in the intermediate range was possible.
Electron energy-loss spectroscopy (EELS) in combinationwith scanning transmission electron microscopy (STEM) offersa unique opportunity to correlate spectroscopic information withdetailed structural knowledge of a material.24,25In STEM-EELS,a quasi-monochromatic beam of electrons is incident on thesample, and the energy loss of the beam through the materialis measured. The data provide detailed information about thechemical composition via the acquired core level EELS spectra,whereas the STEM images accurately map the material understudy. STEM-EELS allows us to construct elemental andchemical (valence) maps with a spatial resolution of 0.5 nm.
The goal of the present contribution is to evidence the surfacesegregation of lanthanum and cerium ions in cerium-lanthanumsolid solutions and to identify the phases in the intermediaterange. For this purpose, a series of cerium-lanthanum materials,Ce1-xLaxO2-x/2, has been prepared to the complete range ofcompositions and characterized by several techniques. Com-bining bulk and surface characterization techniques as well astechniques providing information on the long-range order andlocal order allows a detailed characterization of these promisingsolids. This has led to a better understanding of their structureand surface properties.
Experimental Procedures
Synthesis.A series of Ce1-xLaxO2-x/2 solid solutions, wherex ) 0, 0.05, 0.1, 0.2, 0.4, 0.5, 0.6, 0.7, 0.8, 0.9, and 1, wasprepared by solid-state reaction. Cerium(III) nitrate hexahydrate(Ce(NO3)3‚6H2O, 99.5%, Acros Organics) and lanthanum(III)
* Corresponding author. Phone:+31 30 253 4328; fax:+31 30 2511027; e-mail: [email protected].
† Utrecht University.‡ UniversiteParis-Sud.
9984 J. Phys. Chem. B2006,110,9984-9990
10.1021/jp060882+ CCC: $33.50 © 2006 American Chemical SocietyPublished on Web 05/03/2006
nitrate hexahydrate (La(NO3)3‚6H2O, 98%+, Acros Organics)were mechanically mixed according to the desired compositionand calcined under air at 1273 K for 2 h (heating rate of 10K/min).
Characterization. X-ray fluorescence (XRF) data wereobtained using a LAB 2000 from Spectro Analytical Instrumentsto determine the elemental bulk composition. Raman spectrawere recorded with a Kaiser RXN Optical Spectrometerequipped with a holographic notch filter and transmissiongrating, a CCD camera, and 532 nm laser for excitation. Allspectra were recorded with a data point resolution of 2 cm-1
and were measured in air at room temperature.X-ray powder diffraction (XRD) data were collected for all
samples at room temperature with a Bruker-Nonius PDS 120powder diffractometer system, equipped with a position sensitivegas-filled detector of 120°2θ, using cobalt KR1 radiation (λ )1.78897 Å). Scans were measured over a 1 h period andcompared with standard library patterns for phase analysis. Thestandards SRM1976 (alumina), SRM675 (mica), and SRM640(silicon) were used for calibration. Lattice parameters werecalculated and averaged over four peaks (i.e., (111), (200), (220),and (311)) using the cubic model.
The X-ray photoelectron spectroscopy (XPS) analysis wasperformed to determine the surface composition. The data wereobtained with a Vacuum Generators XPS system, using aCLAM-2 hemispherical analyzer for electron detection. Non-monochromatic Al KR X-ray radiation was used for excitingthe photoelectron spectra using an anode current of 20 mA at10 keV. The pass energy of the analyzer was set at 50 eV. Thesurvey scan was taken with a pass energy of 100 eV. Lanthanumand cerium were quantified by measurement of the element-characteristic peak (Ce3d and La3d) areas following subtractionof a Shirley-type background. Relative sensitivities for theelements were calculated taking into account the photoelectroncross-section, angular asymmetry parameter, energy dependenceof the inelastic mean free path, and transmission of the energyanalyzer.
Scanning transmission electron microscopy (STEM) electronenergy-loss spectroscopy (EELS) measurements were performedin Orsay (France) with a 100 keV STEM instrument (VG HB501) equipped with a field emission electron source. Mountedon the STEM instrument was a parallel electron energy-lossspectrometer (Gatan 666) optically coupled to a CCD cameragenerating an EELS spectrum with a 0.5-0.7 eV energyresolution and 0.5 nm spatial resolution within a typicalacquisition time down to 1 ms per pixel.24 The oxygen K edgeas well as the cerium and lanthanum M4,5 (3d) edges weremonitored. The solids were first sonicated in ethanol and thendropped on a holey amorphous carbon film supported on acopper grid. After the sample was scanned, appropriate areaswere selected for the measurement of detailed 2-D STEM-EELSimages. An energy range of 15 eV has been used to quantifythe EELS spectra (i.e., at the La M5 edge (832-847 eV) and atthe Ce M4 edge (902-917 eV)).
Results and Discussion
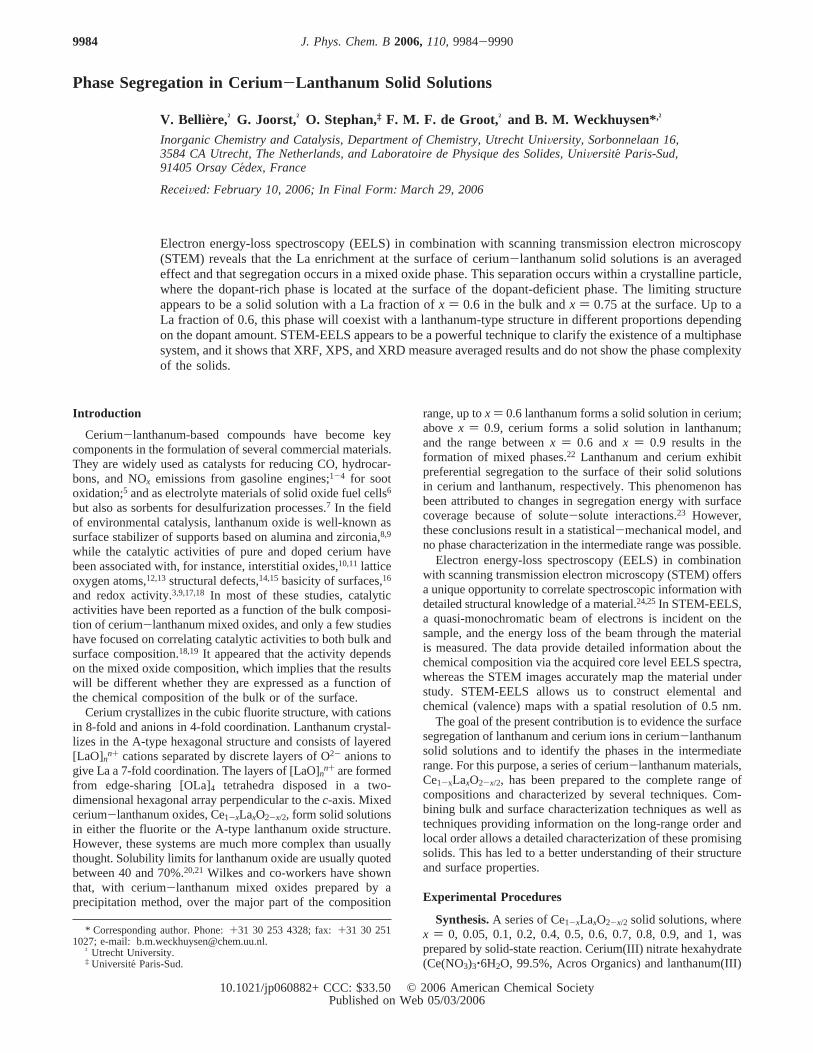
Figure 1 presents the Raman spectra of the whole cerium-lanthanum mixed oxide in the range of 360-520 cm-1. It canbe noticed that cerium and lanthanum have both one charac-teristic Raman band. For cerium, the Raman band at 462 cm-1
is the only one allowed a lattice mode (F2g) of fluorite metaldioxides.26 This band is attributed to a symmetrical stretchingvibration of the Ce-O8 vibration unit, which is sensitive to anydisorder in the oxygen sublattice. According to the literature,
A-type lanthanum Raman spectra have three characteristic bandsat frequencies around 107 cm-1 (ν4(Eg)), 195 cm-1 (ν2(A1 g)),and 408 cm-1 (ν3(Eg) + ν1(A1g)).27,28 The band at 107 cm-1 isoften obscured by intense Rayleigh light. Thus, as shown inFigure 1, the pure lanthanum spectrum presents one Raman bandat a frequency of 405 cm-1, which is attributed to a torsionalskeleton mode of hexagonal units. Doping cerium with La3+
cations results in a decrease of the cerium Raman band intensitywith a logical increase of the lanthanum Raman band. Moreover,the cerium Raman bands shift to lower frequencies (from 462cm-1 (x ) 0) to 450 cm-1 (x ) 0.8)) with the dopant rise. Thislower frequencies shift of cerium bands indicates that ceriumbonds become weaker with the insertion of La3+ into theirlattice. Thus, the La3+ insertion in cerium results in the formationof cerium-lanthanum solid solutions and the deformation ofits structure. This can be attributed to the difference in thecationic radii: La3+, 103.2 pm and Ce4+, 87 pm.
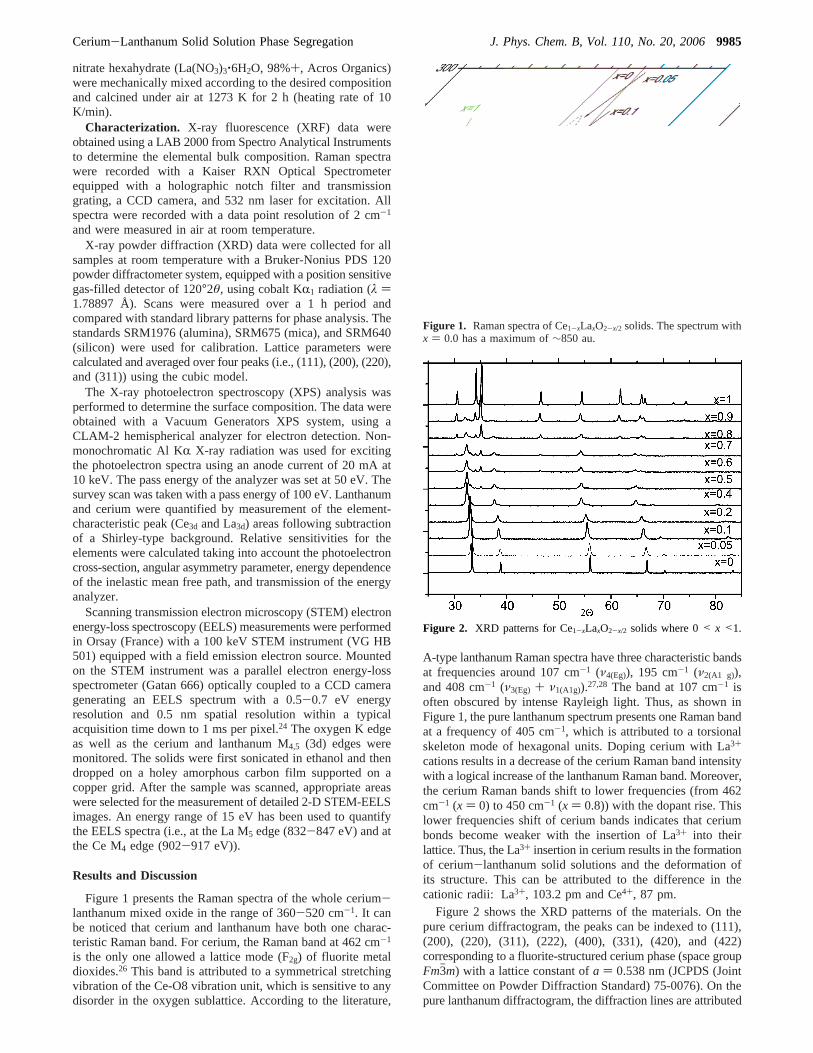
Figure 2 shows the XRD patterns of the materials. On thepure cerium diffractogram, the peaks can be indexed to (111),(200), (220), (311), (222), (400), (331), (420), and (422)corresponding to a fluorite-structured cerium phase (space groupFm3hm) with a lattice constant ofa ) 0.538 nm (JCPDS (JointCommittee on Powder Diffraction Standard) 75-0076). On thepure lanthanum diffractogram, the diffraction lines are attributed
Figure 1. Raman spectra of Ce1-xLaxO2-x/2 solids. The spectrum withx ) 0.0 has a maximum of∼850 au.
Figure 2. XRD patterns for Ce1-xLaxO2-x/2 solids where 0< x <1.
Cerium-Lanthanum Solid Solution Phase Segregation J. Phys. Chem. B, Vol. 110, No. 20, 20069985
to the hexagonal structure of lanthanum oxide (space groupP3hm1) with lattice constants ofa ) 0.3945 nm andc ) 0.6151nm (JCPDS 02-0688). The first peaks can be indexed to (100),(002), (101), (102), (110), (103), (200), (201), (004), and (202).Therefore, cerium and lanthanum present face-centered cubic(fcc) and hexagonal close-packed (hcp) structures, respectively.
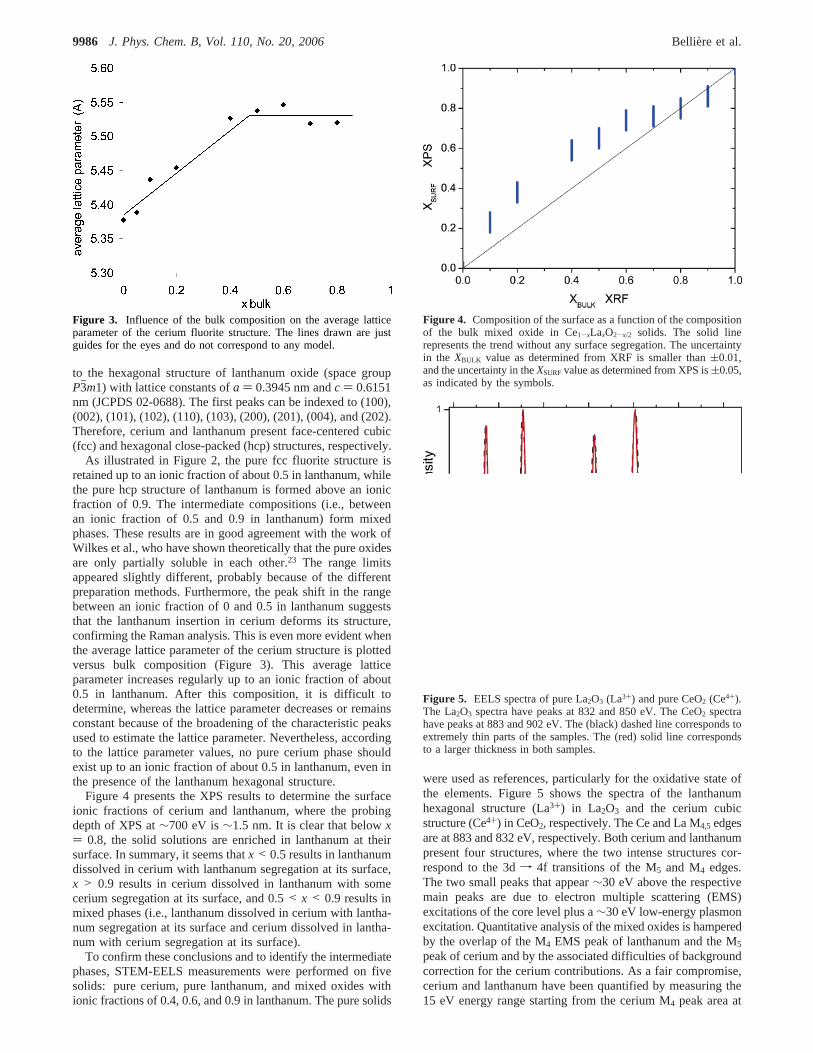
As illustrated in Figure 2, the pure fcc fluorite structure isretained up to an ionic fraction of about 0.5 in lanthanum, whilethe pure hcp structure of lanthanum is formed above an ionicfraction of 0.9. The intermediate compositions (i.e., betweenan ionic fraction of 0.5 and 0.9 in lanthanum) form mixedphases. These results are in good agreement with the work ofWilkes et al., who have shown theoretically that the pure oxidesare only partially soluble in each other.23 The range limitsappeared slightly different, probably because of the differentpreparation methods. Furthermore, the peak shift in the rangebetween an ionic fraction of 0 and 0.5 in lanthanum suggeststhat the lanthanum insertion in cerium deforms its structure,confirming the Raman analysis. This is even more evident whenthe average lattice parameter of the cerium structure is plottedversus bulk composition (Figure 3). This average latticeparameter increases regularly up to an ionic fraction of about0.5 in lanthanum. After this composition, it is difficult todetermine, whereas the lattice parameter decreases or remainsconstant because of the broadening of the characteristic peaksused to estimate the lattice parameter. Nevertheless, accordingto the lattice parameter values, no pure cerium phase shouldexist up to an ionic fraction of about 0.5 in lanthanum, even inthe presence of the lanthanum hexagonal structure.
Figure 4 presents the XPS results to determine the surfaceionic fractions of cerium and lanthanum, where the probingdepth of XPS at∼700 eV is∼1.5 nm. It is clear that belowx) 0.8, the solid solutions are enriched in lanthanum at theirsurface. In summary, it seems thatx < 0.5 results in lanthanumdissolved in cerium with lanthanum segregation at its surface,x > 0.9 results in cerium dissolved in lanthanum with somecerium segregation at its surface, and 0.5< x < 0.9 results inmixed phases (i.e., lanthanum dissolved in cerium with lantha-num segregation at its surface and cerium dissolved in lantha-num with cerium segregation at its surface).
To confirm these conclusions and to identify the intermediatephases, STEM-EELS measurements were performed on fivesolids: pure cerium, pure lanthanum, and mixed oxides withionic fractions of 0.4, 0.6, and 0.9 in lanthanum. The pure solids
were used as references, particularly for the oxidative state ofthe elements. Figure 5 shows the spectra of the lanthanumhexagonal structure (La3+) in La2O3 and the cerium cubicstructure (Ce4+) in CeO2, respectively. The Ce and La M4,5 edgesare at 883 and 832 eV, respectively. Both cerium and lanthanumpresent four structures, where the two intense structures cor-respond to the 3df 4f transitions of the M5 and M4 edges.The two small peaks that appear∼30 eV above the respectivemain peaks are due to electron multiple scattering (EMS)excitations of the core level plus a∼30 eV low-energy plasmonexcitation. Quantitative analysis of the mixed oxides is hamperedby the overlap of the M4 EMS peak of lanthanum and the M5
peak of cerium and by the associated difficulties of backgroundcorrection for the cerium contributions. As a fair compromise,cerium and lanthanum have been quantified by measuring the15 eV energy range starting from the cerium M4 peak area at
Figure 3. Influence of the bulk composition on the average latticeparameter of the cerium fluorite structure. The lines drawn are justguides for the eyes and do not correspond to any model.
Figure 4. Composition of the surface as a function of the compositionof the bulk mixed oxide in Ce1-xLaxO2-x/2 solids. The solid linerepresents the trend without any surface segregation. The uncertaintyin the XBULK value as determined from XRF is smaller than(0.01,and the uncertainty in theXSURFvalue as determined from XPS is(0.05,as indicated by the symbols.
Figure 5. EELS spectra of pure La2O3 (La3+) and pure CeO2 (Ce4+).The La2O3 spectra have peaks at 832 and 850 eV. The CeO2 spectrahave peaks at 883 and 902 eV. The (black) dashed line corresponds toextremely thin parts of the samples. The (red) solid line correspondsto a larger thickness in both samples.
9986 J. Phys. Chem. B, Vol. 110, No. 20, 2006 Belliere et al.
902 eV (that has no contribution from lanthanum) and startingfrom the lanthanum M5 peak area at 832 eV. A backgroundsubtraction has been done for lanthanum contributions only.Relative sensitivities for the elements were calculated takinginto account their cross-sections.
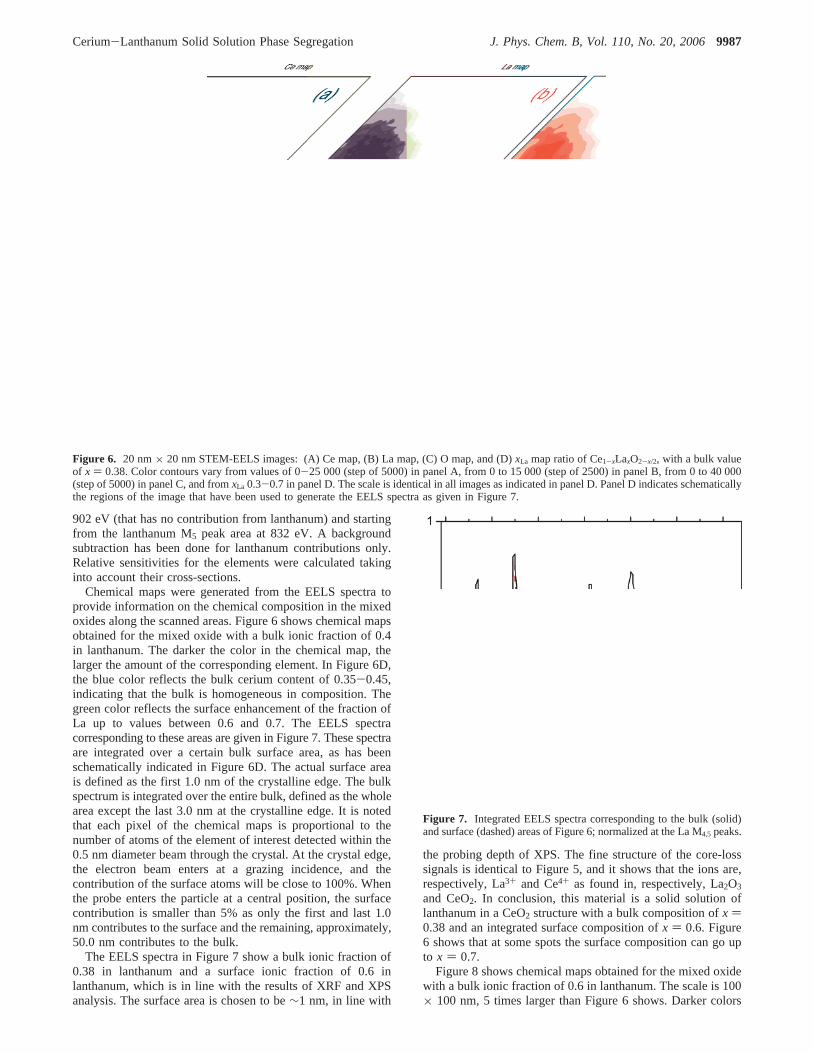
Chemical maps were generated from the EELS spectra toprovide information on the chemical composition in the mixedoxides along the scanned areas. Figure 6 shows chemical mapsobtained for the mixed oxide with a bulk ionic fraction of 0.4in lanthanum. The darker the color in the chemical map, thelarger the amount of the corresponding element. In Figure 6D,the blue color reflects the bulk cerium content of 0.35-0.45,indicating that the bulk is homogeneous in composition. Thegreen color reflects the surface enhancement of the fraction ofLa up to values between 0.6 and 0.7. The EELS spectracorresponding to these areas are given in Figure 7. These spectraare integrated over a certain bulk surface area, as has beenschematically indicated in Figure 6D. The actual surface areais defined as the first 1.0 nm of the crystalline edge. The bulkspectrum is integrated over the entire bulk, defined as the wholearea except the last 3.0 nm at the crystalline edge. It is notedthat each pixel of the chemical maps is proportional to thenumber of atoms of the element of interest detected within the0.5 nm diameter beam through the crystal. At the crystal edge,the electron beam enters at a grazing incidence, and thecontribution of the surface atoms will be close to 100%. Whenthe probe enters the particle at a central position, the surfacecontribution is smaller than 5% as only the first and last 1.0nm contributes to the surface and the remaining, approximately,50.0 nm contributes to the bulk.
The EELS spectra in Figure 7 show a bulk ionic fraction of0.38 in lanthanum and a surface ionic fraction of 0.6 inlanthanum, which is in line with the results of XRF and XPSanalysis. The surface area is chosen to be∼1 nm, in line with
the probing depth of XPS. The fine structure of the core-losssignals is identical to Figure 5, and it shows that the ions are,respectively, La3+ and Ce4+ as found in, respectively, La2O3
and CeO2. In conclusion, this material is a solid solution oflanthanum in a CeO2 structure with a bulk composition ofx )0.38 and an integrated surface composition ofx ) 0.6. Figure6 shows that at some spots the surface composition can go upto x ) 0.7.
Figure 8 shows chemical maps obtained for the mixed oxidewith a bulk ionic fraction of 0.6 in lanthanum. The scale is 100× 100 nm, 5 times larger than Figure 6 shows. Darker colors
Figure 6. 20 nm× 20 nm STEM-EELS images: (A) Ce map, (B) La map, (C) O map, and (D)xLa map ratio of Ce1-xLaxO2-x/2, with a bulk valueof x ) 0.38. Color contours vary from values of 0-25 000 (step of 5000) in panel A, from 0 to 15 000 (step of 2500) in panel B, from 0 to 40 000(step of 5000) in panel C, and fromxLa 0.3-0.7 in panel D. The scale is identical in all images as indicated in panel D. Panel D indicates schematicallythe regions of the image that have been used to generate the EELS spectra as given in Figure 7.
Figure 7. Integrated EELS spectra corresponding to the bulk (solid)and surface (dashed) areas of Figure 6; normalized at the La M4,5 peaks.
Cerium-Lanthanum Solid Solution Phase Segregation J. Phys. Chem. B, Vol. 110, No. 20, 20069987
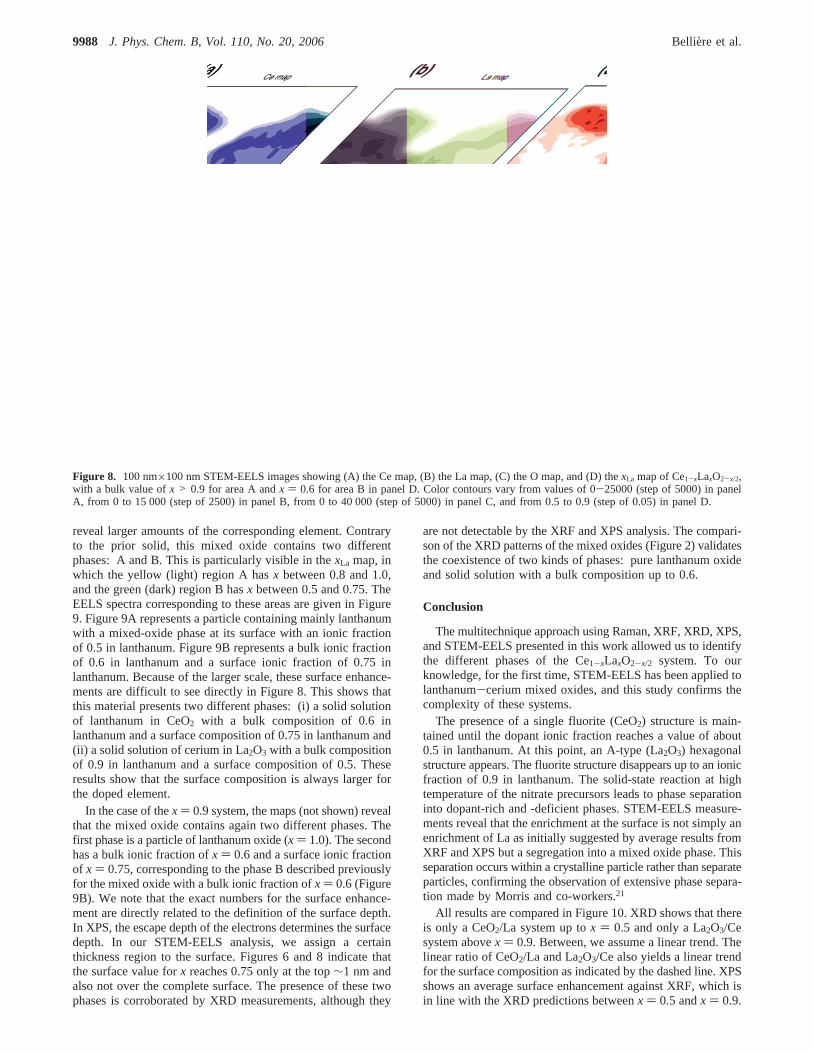
reveal larger amounts of the corresponding element. Contraryto the prior solid, this mixed oxide contains two differentphases: A and B. This is particularly visible in thexLa map, inwhich the yellow (light) region A hasx between 0.8 and 1.0,and the green (dark) region B hasx between 0.5 and 0.75. TheEELS spectra corresponding to these areas are given in Figure9. Figure 9A represents a particle containing mainly lanthanumwith a mixed-oxide phase at its surface with an ionic fractionof 0.5 in lanthanum. Figure 9B represents a bulk ionic fractionof 0.6 in lanthanum and a surface ionic fraction of 0.75 inlanthanum. Because of the larger scale, these surface enhance-ments are difficult to see directly in Figure 8. This shows thatthis material presents two different phases: (i) a solid solutionof lanthanum in CeO2 with a bulk composition of 0.6 inlanthanum and a surface composition of 0.75 in lanthanum and(ii) a solid solution of cerium in La2O3 with a bulk compositionof 0.9 in lanthanum and a surface composition of 0.5. Theseresults show that the surface composition is always larger forthe doped element.
In the case of thex ) 0.9 system, the maps (not shown) revealthat the mixed oxide contains again two different phases. Thefirst phase is a particle of lanthanum oxide (x ) 1.0). The secondhas a bulk ionic fraction ofx ) 0.6 and a surface ionic fractionof x ) 0.75, corresponding to the phase B described previouslyfor the mixed oxide with a bulk ionic fraction ofx ) 0.6 (Figure9B). We note that the exact numbers for the surface enhance-ment are directly related to the definition of the surface depth.In XPS, the escape depth of the electrons determines the surfacedepth. In our STEM-EELS analysis, we assign a certainthickness region to the surface. Figures 6 and 8 indicate thatthe surface value forx reaches 0.75 only at the top∼1 nm andalso not over the complete surface. The presence of these twophases is corroborated by XRD measurements, although they
are not detectable by the XRF and XPS analysis. The compari-son of the XRD patterns of the mixed oxides (Figure 2) validatesthe coexistence of two kinds of phases: pure lanthanum oxideand solid solution with a bulk composition up to 0.6.
Conclusion
The multitechnique approach using Raman, XRF, XRD, XPS,and STEM-EELS presented in this work allowed us to identifythe different phases of the Ce1-xLaxO2-x/2 system. To ourknowledge, for the first time, STEM-EELS has been applied tolanthanum-cerium mixed oxides, and this study confirms thecomplexity of these systems.
The presence of a single fluorite (CeO2) structure is main-tained until the dopant ionic fraction reaches a value of about0.5 in lanthanum. At this point, an A-type (La2O3) hexagonalstructure appears. The fluorite structure disappears up to an ionicfraction of 0.9 in lanthanum. The solid-state reaction at hightemperature of the nitrate precursors leads to phase separationinto dopant-rich and -deficient phases. STEM-EELS measure-ments reveal that the enrichment at the surface is not simply anenrichment of La as initially suggested by average results fromXRF and XPS but a segregation into a mixed oxide phase. Thisseparation occurs within a crystalline particle rather than separateparticles, confirming the observation of extensive phase separa-tion made by Morris and co-workers.21
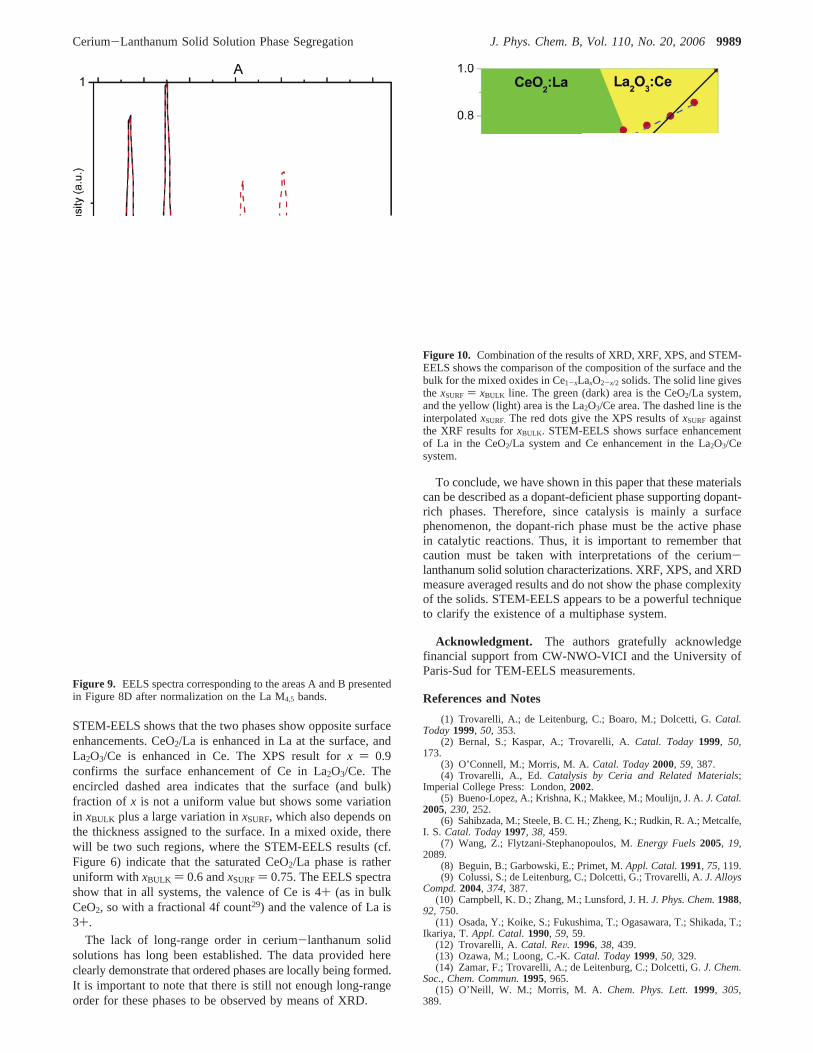
All results are compared in Figure 10. XRD shows that thereis only a CeO2/La system up tox ) 0.5 and only a La2O3/Cesystem abovex ) 0.9. Between, we assume a linear trend. Thelinear ratio of CeO2/La and La2O3/Ce also yields a linear trendfor the surface composition as indicated by the dashed line. XPSshows an average surface enhancement against XRF, which isin line with the XRD predictions betweenx ) 0.5 andx ) 0.9.
Figure 8. 100 nm×100 nm STEM-EELS images showing (A) the Ce map, (B) the La map, (C) the O map, and (D) thexLa map of Ce1-xLaxO2-x/2,with a bulk value ofx > 0.9 for area A andx ) 0.6 for area B in panel D. Color contours vary from values of 0-25000 (step of 5000) in panelA, from 0 to 15 000 (step of 2500) in panel B, from 0 to 40 000 (step of 5000) in panel C, and from 0.5 to 0.9 (step of 0.05) in panel D.
9988 J. Phys. Chem. B, Vol. 110, No. 20, 2006 Belliere et al.
STEM-EELS shows that the two phases show opposite surfaceenhancements. CeO2/La is enhanced in La at the surface, andLa2O3/Ce is enhanced in Ce. The XPS result forx ) 0.9confirms the surface enhancement of Ce in La2O3/Ce. Theencircled dashed area indicates that the surface (and bulk)fraction of x is not a uniform value but shows some variationin xBULK plus a large variation inxSURF, which also depends onthe thickness assigned to the surface. In a mixed oxide, therewill be two such regions, where the STEM-EELS results (cf.Figure 6) indicate that the saturated CeO2/La phase is ratheruniform with xBULK ) 0.6 andxSURF) 0.75. The EELS spectrashow that in all systems, the valence of Ce is 4+ (as in bulkCeO2, so with a fractional 4f count29) and the valence of La is3+.
The lack of long-range order in cerium-lanthanum solidsolutions has long been established. The data provided hereclearly demonstrate that ordered phases are locally being formed.It is important to note that there is still not enough long-rangeorder for these phases to be observed by means of XRD.
To conclude, we have shown in this paper that these materialscan be described as a dopant-deficient phase supporting dopant-rich phases. Therefore, since catalysis is mainly a surfacephenomenon, the dopant-rich phase must be the active phasein catalytic reactions. Thus, it is important to remember thatcaution must be taken with interpretations of the cerium-lanthanum solid solution characterizations. XRF, XPS, and XRDmeasure averaged results and do not show the phase complexityof the solids. STEM-EELS appears to be a powerful techniqueto clarify the existence of a multiphase system.
Acknowledgment. The authors gratefully acknowledgefinancial support from CW-NWO-VICI and the University ofParis-Sud for TEM-EELS measurements.
References and Notes
(1) Trovarelli, A.; de Leitenburg, C.; Boaro, M.; Dolcetti, G.Catal.Today1999, 50, 353.
(2) Bernal, S.; Kaspar, A.; Trovarelli, A.Catal. Today1999, 50,173.
(3) O’Connell, M.; Morris, M. A.Catal. Today2000, 59, 387.(4) Trovarelli, A., Ed. Catalysis by Ceria and Related Materials;
Imperial College Press: London,2002.(5) Bueno-Lopez, A.; Krishna, K.; Makkee, M.; Moulijn, J. A.J. Catal.
2005, 230, 252.(6) Sahibzada, M.; Steele, B. C. H.; Zheng, K.; Rudkin, R. A.; Metcalfe,
I. S. Catal. Today1997, 38, 459.(7) Wang, Z.; Flytzani-Stephanopoulos, M.Energy Fuels2005, 19,
2089.(8) Beguin, B.; Garbowski, E.; Primet, M.Appl. Catal.1991, 75, 119.(9) Colussi, S.; de Leitenburg, C.; Dolcetti, G.; Trovarelli, A.J. Alloys
Compd.2004, 374, 387.(10) Campbell, K. D.; Zhang, M.; Lunsford, J. H.J. Phys. Chem.1988,
92, 750.(11) Osada, Y.; Koike, S.; Fukushima, T.; Ogasawara, T.; Shikada, T.;
Ikariya, T. Appl. Catal.1990, 59, 59.(12) Trovarelli, A.Catal. ReV. 1996, 38, 439.(13) Ozawa, M.; Loong, C.-K.Catal. Today1999, 50, 329.(14) Zamar, F.; Trovarelli, A.; de Leitenburg, C.; Dolcetti, G.J. Chem.
Soc., Chem. Commun.1995, 965.(15) O’Neill, W. M.; Morris, M. A. Chem. Phys. Lett.1999, 305,
389.
Figure 9. EELS spectra corresponding to the areas A and B presentedin Figure 8D after normalization on the La M4,5 bands.
Figure 10. Combination of the results of XRD, XRF, XPS, and STEM-EELS shows the comparison of the composition of the surface and thebulk for the mixed oxides in Ce1-xLaxO2-x/2 solids. The solid line givesthe xSURF ) xBULK line. The green (dark) area is the CeO2/La system,and the yellow (light) area is the La2O3/Ce area. The dashed line is theinterpolatedxSURF. The red dots give the XPS results ofxSURF againstthe XRF results forxBULK. STEM-EELS shows surface enhancementof La in the CeO2/La system and Ce enhancement in the La2O3/Cesystem.
Cerium-Lanthanum Solid Solution Phase Segregation J. Phys. Chem. B, Vol. 110, No. 20, 20069989
(16) Choudhary, V. R.; Rane, V. H.J. Catal.1991, 130, 411.(17) Hattori, T.; Inoko, J.-I.; Murukami, Y.J. Catal.1976, 42, 60.(18) Wilkes, M. F.; Hayden, P.; Bhattacharya, A. K.J. Catal. 2003,
219, 286.(19) Wilkes, M. F.; Hayden, P.; Bhattacharya, A. K.J. Catal. 2003,
219, 295.(20) Mogensen, M.; Sammes, N. M.; Tompsett, G. A.Solid State Ionics
2000, 129, 63.(21) Ryan, K. M.; McGrath, J. P.; Farrell, R. A.; O’Neill, W. M.; Barnes,
C. J.; Morris, M. A.J. Phys.: Condens. Matter2003, 15, L49.(22) Wilkes, M. F.; Hayden, P.; Bhattacharya, A. K.J. Catal. 2003,
219, 305.(23) Wilkes, M. F.; Hayden, P.; Bhattacharya, A. K.Appl. Surf. Sci.
2003, 206, 12.
(24) Stephan, O.; Gloter, A.; Imhoff, D.; Kociak, M.; Mory, C.; Suenaga,K.; Tence, M.; Colliex, C.Surf. ReV. Lett. 2000, 7, 475.
(25) Wang, Z. L.AdV. Mater. 2003, 15, 1497.
(26) McBride, J. R.; Hass, K. C.; Poindexter, B. D.; Weber, W. H.J.Appl. Phys.1994, 76, 2435.
(27) Boldish, S. I.; White, W. B.Spectrochim. Acta, Part A1979, 35,1235.
(28) Weckhuysen, B. M.; Rosynek, M. P.; Lunsford, J. H.Phys. Chem.Chem. Phys.1999, 1, 3157.
(29) Butorin, S. M.; Mancini, D. C.; Guo, J.-H.; Wassdahl, N.; Nordgren,J.; Nakazawa, M.; Tanaka, S.; Uozumi, T.; Kotani, A.; Ma, Y.; Myano, K.E.; Karlin, B. A.; Shuh, D. K.Phys. ReV. Lett. 1996, 77, 574.
9990 J. Phys. Chem. B, Vol. 110, No. 20, 2006 Belliere et al.