Embed Size (px)
Citation preview
Mit wegweisenden Therapien komplexen Erkrankungen begegnen.
Zulassungsinhaberin: sanofi-aventis (schweiz) ag 3, route de Montfleury 1214 Vernier
Kontakt: [email protected] www.sanofigenzyme.ch
Zusammenfassung
Ausgewertet wurden die Daten von 193 Patienten mit fortgeschrittenem CSCC aus der Phase-II-Studie. Das mediane Follow-up betrug 15,7 Monate.1
Baseline-Charakteristika1
• Medianes Alter: 72 Jahre
• ECOG-1 bei 55,4 % der Patienten (107 von 193)
• Kutane Plattenepithelkarzinome im Kopf-Hals-Bereich (inkl. Ohr und Schläfe) bei 67,9 % derPatienten (131 von 193)
• Metastasierte Plattenepithelkarzinome bei 59,6 % der Patienten (115 von 193)
• Lokal fortgeschrittene Plattenepithelkarzinome bei 40,4 % der Patienten (78 von 193)
• Patienten mit Cemiplimab als First-Line-Therapie: 66,3 % (128 von 193)
• Patienten mit systemischer Vortherapie: 33,7 % (65 von 193)
Wirksamkeit1
• Ansprechrate (ORR): 46,1 % – davon 16,1 % mit Komplettansprechen (CR)
• Nach 24 Monaten zeigten noch 69,4 % der Patienten (95 % CI: 55,6 – 79,6) ein Ansprechen(nach Kaplan-Meier-Schätzung).
• Die mediane Ansprechdauer (DOR) wurde noch nicht erreicht.
• Das mediane progressionsfreie Überleben (PFS) betrug 18,4 Monate.
• Das mediane Gesamtüberleben (OS) wurde noch nicht erreicht.
Verträglichkeit1
• Auftreten von therapiebedingten Nebenwirkungen (TEAE) jeden Grades: 99,5 % der Patienten(192 von 193)
• Häufigste TEAE (alle Grade): Fatigue (34,7 %; 67 von 193), Diarrhö (27,5 %; 53 von 193) undÜbelkeit (23,8 %; 46 von 193)
• TEAE grösser oder gleich Grad 3: 48,7 % der Patienten (94 von 193); die häufigsten davonwaren Hypertension (4,7 %; 9 von 193), Anämie und Cellulitis (jeweils 4,1 %; 8 von 193);(siehe für alle Punkte Tabelle 3)
Fazit• Cemiplimab erzielt bei Patienten mit fortgeschrittenem CSCC eine objektive Ansprechrate von 46,1 %.
• Da die mediane Ansprechdauer (DOR) nach einem weiteren Jahr noch nicht erreicht wurde, deutetdie Analyse auf eine zunehmend klinisch bedeutsame Ansprechdauer mit Cemiplimab hin.
1. Rischin, D. et al. Phase 2 Study of Cemiplimab in Patients with Advanced Cutaneous Squamous Cell Carcinoma (CSCC): Longer Follow-Up (presented at ASCO 2020). 2. https://clinicaltrials.gov/ct2/show/NCT02760498 – Aufruf Stand 28.05.2020. 3. https://clinicaltrials.gov/ct2/show/NCT03132636 – Aufruf Stand 28.05.2020. 4. https://clinicaltrials.gov/ct2/show/NCT03088540?term=REGN2810&draw=2 – Aufruf Stand 28.05.2020. 5. https://clinicaltrials.gov/ct2/show/NCT03257267?term=REGN2810&rank=6 – Aufruf Stand 28.05.2020.
Danny Rischin,1 Nikhil I. Khushalani,2 Chrysalyne D. Schmults,3 Alexander Guminski,4 Anne Lynn S. Chang,5 Karl D. Lewis,6 Annette M. Lim,1 Leonel Hernandez-Aya,7 Brett G.M. Hughes,8 Dirk Schadendorf,9 Axel Hauschild,10 Elizabeth Stankevich,11 Jocelyn Booth,11 Suk-Young Yoo,11 Zhen Chen,12 Emmanuel Okoye,13 Israel Lowy,12 Matthew G. Fury,12 Michael R. Migden14
1Department of Medical Oncology, Peter MacCallum Cancer Centre, Melbourne, Australia; 2Department of Cutaneous Oncology, Moffitt Cancer Center, Tampa, FL, USA; 3Department of Dermatology, Brigham and Women’s Hospital, Harvard Medical School, Boston, MA, USA; 4Department of Medical Oncology, Royal North Shore Hospital, St Leonards, Australia; 5Department of Dermatology, Stanford University School of Medicine, Redwood City, CA, USA; 6University of Colorado Denver, School of Medicine, Aurora, CO, USA; 7Division of Medical Oncology, Department of Medicine, Washington University School of Medicine, St Louis, MO, USA; 8Royal Brisbane & Women’s Hospital and University of Queensland, Brisbane, Australia; 9University Hospital Essen, Essen and German Cancer Consortium, Essen, Germany; 10Schleswig-Holstein University Hospital, Kiel, Germany; 11Regeneron Pharmaceuticals, Inc., Basking Ridge, NJ, USA; 12Regeneron Pharmaceuticals, Inc., Tarrytown, NY, USA; 13Regeneron Pharmaceuticals, Inc., London, UK; 14Departments of Dermatology and Head and Neck Surgery, University of Texas MD Anderson Cancer Center, Houston, TX, USA
Phase II Study of Cemiplimab in Patients with Advanced Cutaneous Squamous Cell Carcinoma (CSCC): Longer Follow-Up
POSTER-PRÄSENTATION
Rischin et al, Phase 2 Study of Cemiplimab in Patients with Advanced Cutaneous Squamous Cell Carcinoma (CSCC): Longer Follow-Up, presented at ASCO 2020.
This content is made available for your personal use, educational advancement, or professional development. Unauthorized reproduction is prohibited. For permission to re-use for commercial or other purposes, please contact [email protected]. MA
T-CH
-200
1808
-1.0
– 08/2
020
ASCO- Update2020
Libtayo® Konzentrat zur Herstellung einer Infusionslösung. W: Cemiplimab. I: Monotherapie zur Behandlung von Patienten mit metastasiertem kutanem Plattenepithelkarzinom oder lokal fortgeschrittenem kutanem Plattenepithelkarzinom, die für eine kurative Operation oder kurative Strahlentherapie nicht in Betracht kommen. D: 350 mg alle 3 Wochen als i.v. Infusion über einen Zeitraum von 30 Minuten für maximal 2 Jahre. KI: Überempfindlichkeit gegenüber dem Wirkstoff oder einem der Hilfsstoffe. VM: Schwerwiegende und tödlich verlaufende immunvermittelte Reaktionen wurden beobachtet. Bei Verdacht auf immunvermittelte Nebenwirkungen ist der Patient zu untersuchen und die Behandlung mit Cemiplimab vorübergehend zu unterbrechen oder dauerhaft abzusetzen. Cemiplimab kann schwere oder lebensbedrohliche infusionsbedingte Reaktionen verursachen. Patienten sind auf Anzeichen und Symptome infusionsbedingter Reaktion zu überwachen und ggf durch Anpassung der Behandlung sowie Gabe von Kortikosteroiden zu behandeln. Bei Transplantatempfängern kann das Abstossungsrisiko erhöht sein, daher sorgfältige Nutzen/Risiko-Abwägung. Embryofetale Toxizität wurde im Tierversuch nachgewiesen; Anwendung in der Schwangerschaft oder bei Frauen im gebärfähigen Alter ohne zuverlässige Verhütung nur bei eindeutiger Indikation. NW: Kutane Nebenwirkungen (Ausschlag, Pruritus), infusionsbedingte Reaktionen, Störungen der Schilddrüsenfunktion, Pneumonitis, Stomatitis, Hepatitis, Erhöhung der Leberwerte, Fatigue, Diarrhö, Arthralgie, muskuloskelettale Schmerzen, Arthritis, erhöhtes Kreatin im Blut. P: Libtayo 350 mg/ 7 ml: Karton mit 1 Durchstechflache zur einmaligen Anwendung. AK: A. Zul-Inh.: sanofi-aventis (schweiz) ag, 1214 Vernier/GE. Stand Info.: Mai 2020. (MAT-CH-2001046-1.0 / 06/2020). Weitere Informationen entnehmen Sie bitte der Fachinformation unter www.swissmedicinfo.ch.
See poster #382 reporting post hoc analysis of health-related quality of life in the same patient population presented in this poster. Also see poster #433 that provides the design and rationale of a Phase 3, randomized, double-blind study of adjuvant cemiplimab versus placebo post-surgery and radiation in patients with high-risk CSCC.
References1. Que SKT et al. J Am Acad Dermatol. 2018;78:237–247.2. Cranmer LD et al. Oncologist. 2010;15:1320–1328.3. National Comprehensive Cancer Network. NCCN Clinical
practice guidelines in oncology: squamous cell skin cancer(Version 2.2019). 2018. Available at: https://www.nccn.org/professionals/physician_gls/pdf/squamous.pdf. [AccessedMarch 20, 2020].
4. Karia PS et al. J Clin Oncol. 2014;32:327–334.5. Weinberg AS et al. Dermatol Surg. 2007;33:885–899.
6. Schmults CD et al. JAMA Dermatol. 2013;149:541–547.7. Cowey C et al. Cancer Med. 2020 [in press].8. Burova E et al. Mol Cancer Ther. 2017;16:861–870.9. Migden MR et al. Lancet Oncol. 2020;21:294–305.
10. Migden MR et al. N Engl J Med. 2018;379:341–351.11. Rischin D et al. Poster presented at Maui Dermatology
Conference, January 25–29, 2020. 12. Eisenhauer EA et al. Eur J Cancer. 2009;45:228–247.
AcknowledgmentsThe authors would like to thank the patients, their families, all other investigators, and all investigational site members involved in this study.The study was funded by Regeneron Pharmaceuticals, Inc., and Sanofi. Medical writing support and typesetting was provided by KateCarolan, PhD, of Prime, Knutsford, UK, funded by Regeneron Pharmaceuticals, Inc.and Sanofi.For any questions or comments, please contact Dr Danny Rischin, [email protected]
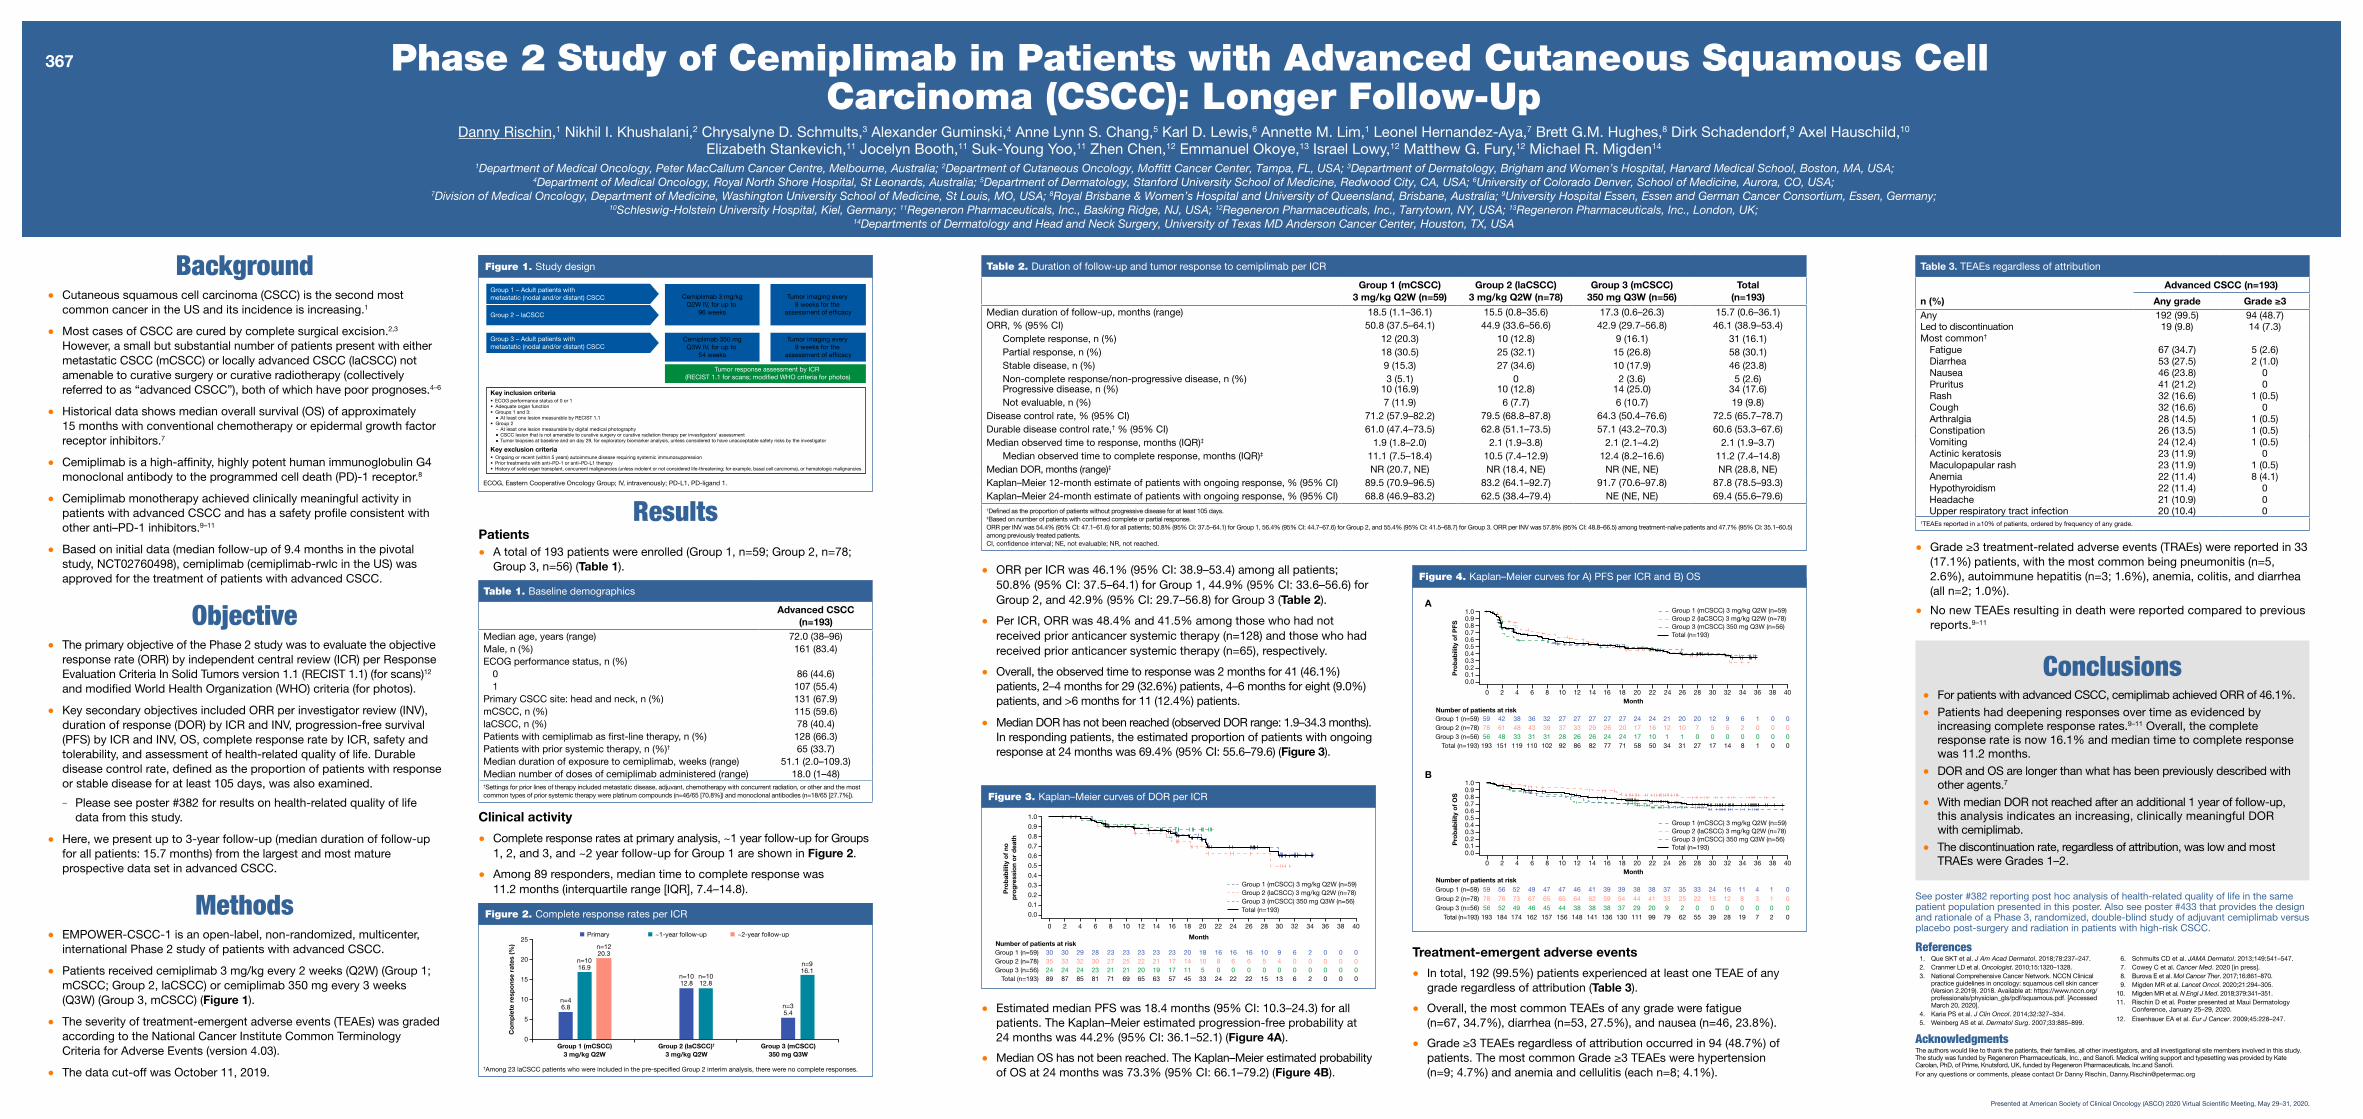
Conclusions• For patients with advanced CSCC, cemiplimab achieved ORR of 46.1%.
• Patients had deepening responses over time as evidenced byincreasing complete response rates.9–11 Overall, the completeresponse rate is now 16.1% and median time to complete responsewas 11.2 months.
• DOR and OS are longer than what has been previously described withother agents.7
• With median DOR not reached after an additional 1 year of follow-up,this analysis indicates an increasing, clinically meaningful DORwith cemiplimab.
• The discontinuation rate, regardless of attribution, was low and mostTRAEs were Grades 1–2.
Background• Cutaneous squamous cell carcinoma (CSCC) is the second most
common cancer in the US and its incidence is increasing.1
• Most cases of CSCC are cured by complete surgical excision.2,3 However, a small but substantial number of patients present with either metastatic CSCC (mCSCC) or locally advanced CSCC (laCSCC) not amenable to curative surgery or curative radiotherapy (collectively referred to as “advanced CSCC”), both of which have poor prognoses.4–6
• Historical data shows median overall survival (OS) of approximately 15 months with conventional chemotherapy or epidermal growth factor receptor inhibitors.7
• Cemiplimab is a high-affinity, highly potent human immunoglobulin G4 monoclonal antibody to the programmed cell death (PD)-1 receptor.8
• Cemiplimab monotherapy achieved clinically meaningful activity in patients with advanced CSCC and has a safety profile consistent with other anti–PD-1 inhibitors.9–11
• Based on initial data (median follow-up of 9.4 months in the pivotal study, NCT02760498), cemiplimab (cemiplimab-rwlc in the US) was approved for the treatment of patients with advanced CSCC.
Objective• The primary objective of the Phase 2 study was to evaluate the objective
response rate (ORR) by independent central review (ICR) per Response Evaluation Criteria In Solid Tumors version 1.1 (RECIST 1.1) (for scans)12 and modified World Health Organization (WHO) criteria (for photos).
• Key secondary objectives included ORR per investigator review (INV), duration of response (DOR) by ICR and INV, progression-free survival (PFS) by ICR and INV, OS, complete response rate by ICR, safety and tolerability, and assessment of health-related quality of life. Durable disease control rate, defined as the proportion of patients with response or stable disease for at least 105 days, was also examined.
- Please see poster #382 for results on health-related quality of life data from this study.
• Here, we present up to 3-year follow-up (median duration of follow-up for all patients: 15.7 months) from the largest and most mature prospective data set in advanced CSCC.
Methods• EMPOWER-CSCC-1 is an open-label, non-randomized, multicenter,
international Phase 2 study of patients with advanced CSCC.
• Patients received cemiplimab 3 mg/kg every 2 weeks (Q2W) (Group 1; mCSCC; Group 2, laCSCC) or cemiplimab 350 mg every 3 weeks (Q3W) (Group 3, mCSCC) (Figure 1).
• The severity of treatment-emergent adverse events (TEAEs) was graded according to the National Cancer Institute Common Terminology Criteria for Adverse Events (version 4.03).
• The data cut-off was October 11, 2019.
Presented at American Society of Clinical Oncology (ASCO) 2020 Virtual Scientific Meeting, May 29–31, 2020.
Group 1 – Adult patients with metastatic (nodal and/or distant) CSCC Cemiplimab 3 mg/kg
Q2W IV, for up to 96 weeks
Cemiplimab 350 mgQ3W IV, for up to
54 weeks
Tumor response assessment by ICR (RECIST 1.1 for scans; modified WHO criteria for photos)
Tumor imaging every 8 weeks for the
assessment of efficacy
Tumor imaging every 9 weeks for the
assessment of efficacy
Group 3 – Adult patients with metastatic (nodal and/or distant) CSCC
Group 2 – laCSCC
Key inclusion criteria• ECOG performance status of 0 or 1• Adequate organ function• Groups 1 and 3:
At least one lesion measurable by RECIST 1.1 • Group 2
At least one lesion measurable by digital medical photographyCSCC lesion that is not amenable to curative surgery or curative radiation therapy per investigators’ assessmentTumor biopsies at baseline and on day 29, for exploratory biomarker analysis, unless considered to have unacceptable safety risks by the investigator
Key exclusion criteria• Ongoing or recent (within 5 years) autoimmune disease requiring systemic immunosuppression• Prior treatments with anti–PD-1 or anti–PD-L1 therapy• History of solid organ transplant, concurrent malignancies (unless indolent or not considered life-threatening; for example, basal cell carcinoma), or hematologic malignancies
Figure 1. Study design
ECOG, Eastern Cooperative Oncology Group; IV, intravenously; PD-L1, PD-ligand 1.
Phase 2 Study of Cemiplimab in Patients with Advanced Cutaneous Squamous Cell Carcinoma (CSCC): Longer Follow-Up
Danny Rischin,1 Nikhil I. Khushalani,2 Chrysalyne D. Schmults,3 Alexander Guminski,4 Anne Lynn S. Chang,5 Karl D. Lewis,6 Annette M. Lim,1 Leonel Hernandez-Aya,7 Brett G.M. Hughes,8 Dirk Schadendorf,9 Axel Hauschild,10
Elizabeth Stankevich,11 Jocelyn Booth,11 Suk-Young Yoo,11 Zhen Chen,12 Emmanuel Okoye,13 Israel Lowy,12 Matthew G. Fury,12 Michael R. Migden14
1Department of Medical Oncology, Peter MacCallum Cancer Centre, Melbourne, Australia; 2Department of Cutaneous Oncology, Moffitt Cancer Center, Tampa, FL, USA; 3Department of Dermatology, Brigham and Women’s Hospital, Harvard Medical School, Boston, MA, USA; 4Department of Medical Oncology, Royal North Shore Hospital, St Leonards, Australia; 5Department of Dermatology, Stanford University School of Medicine, Redwood City, CA, USA; 6University of Colorado Denver, School of Medicine, Aurora, CO, USA;
7Division of Medical Oncology, Department of Medicine, Washington University School of Medicine, St Louis, MO, USA; 8Royal Brisbane & Women’s Hospital and University of Queensland, Brisbane, Australia; 9University Hospital Essen, Essen and German Cancer Consortium, Essen, Germany; 10Schleswig-Holstein University Hospital, Kiel, Germany; 11Regeneron Pharmaceuticals, Inc., Basking Ridge, NJ, USA; 12Regeneron Pharmaceuticals, Inc., Tarrytown, NY, USA; 13Regeneron Pharmaceuticals, Inc., London, UK;
14Departments of Dermatology and Head and Neck Surgery, University of Texas MD Anderson Cancer Center, Houston, TX, USA
ResultsPatients• A total of 193 patients were enrolled (Group 1, n=59; Group 2, n=78;
Group 3, n=56) (Table 1).
Table 1. Baseline demographics
Advanced CSCC(n=193)
Median age, years (range) 72.0 (38–96)Male, n (%) 161 (83.4)ECOG performance status, n (%)
0 86 (44.6)1 107 (55.4)
Primary CSCC site: head and neck, n (%) 131 (67.9)mCSCC, n (%) 115 (59.6)laCSCC, n (%) 78 (40.4)Patients with cemiplimab as first-line therapy, n (%) 128 (66.3)Patients with prior systemic therapy, n (%)† 65 (33.7)Median duration of exposure to cemiplimab, weeks (range) 51.1 (2.0–109.3)Median number of doses of cemiplimab administered (range) 18.0 (1–48)†Settings for prior lines of therapy included metastatic disease, adjuvant, chemotherapy with concurrent radiation, or other and the most common types of prior systemic therapy were platinum compounds (n=46/65 [70.8%]) and monoclonal antibodies (n=18/65 [27.7%]).
Table 2. Duration of follow-up and tumor response to cemiplimab per ICR
Group 1 (mCSCC)3 mg/kg Q2W (n=59)
Group 2 (laCSCC)3 mg/kg Q2W (n=78)
Group 3 (mCSCC)350 mg Q3W (n=56)
Total(n=193)
Median duration of follow-up, months (range) 18.5 (1.1–36.1) 15.5 (0.8–35.6) 17.3 (0.6–26.3) 15.7 (0.6–36.1)ORR, % (95% CI) 50.8 (37.5–64.1) 44.9 (33.6–56.6) 42.9 (29.7–56.8) 46.1 (38.9–53.4)
Complete response, n (%) 12 (20.3) 10 (12.8) 9 (16.1) 31 (16.1)Partial response, n (%) 18 (30.5) 25 (32.1) 15 (26.8) 58 (30.1)Stable disease, n (%) 9 (15.3) 27 (34.6) 10 (17.9) 46 (23.8)Non-complete response/non-progressive disease, n (%) 3 (5.1) 0 2 (3.6) 5 (2.6)Progressive disease, n (%) 10 (16.9) 10 (12.8) 14 (25.0) 34 (17.6)Not evaluable, n (%) 7 (11.9) 6 (7.7) 6 (10.7) 19 (9.8)
Disease control rate, % (95% CI) 71.2 (57.9–82.2) 79.5 (68.8–87.8) 64.3 (50.4–76.6) 72.5 (65.7–78.7)Durable disease control rate,† % (95% CI) 61.0 (47.4–73.5) 62.8 (51.1–73.5) 57.1 (43.2–70.3) 60.6 (53.3–67.6)Median observed time to response, months (IQR)‡ 1.9 (1.8–2.0) 2.1 (1.9–3.8) 2.1 (2.1–4.2) 2.1 (1.9–3.7)
Median observed time to complete response, months (IQR)‡ 11.1 (7.5–18.4) 10.5 (7.4–12.9) 12.4 (8.2–16.6) 11.2 (7.4–14.8)Median DOR, months (range)‡ NR (20.7, NE) NR (18.4, NE) NR (NE, NE) NR (28.8, NE)Kaplan–Meier 12-month estimate of patients with ongoing response, % (95% CI) 89.5 (70.9–96.5) 83.2 (64.1–92.7) 91.7 (70.6–97.8) 87.8 (78.5–93.3)Kaplan–Meier 24-month estimate of patients with ongoing response, % (95% CI) 68.8 (46.9–83.2) 62.5 (38.4–79.4) NE (NE, NE) 69.4 (55.6–79.6)†Defined as the proportion of patients without progressive disease for at least 105 days.‡Based on number of patients with confirmed complete or partial response.ORR per INV was 54.4% (95% CI: 47.1–61.6) for all patients; 50.8% (95% CI: 37.5–64.1) for Group 1, 56.4% (95% CI: 44.7–67.6) for Group 2, and 55.4% (95% CI: 41.5–68.7) for Group 3. ORR per INV was 57.8% (95% CI: 48.8–66.5) among treatment-naïve patients and 47.7% (95% CI: 35.1–60.5)among previously treated patients.CI, confidence interval; NE, not evaluable; NR, not reached.
Table 3. TEAEs regardless of attribution
Advanced CSCC (n=193)
n (%) Any grade Grade ≥3Any 192 (99.5) 94 (48.7)Led to discontinuation 19 (9.8) 14 (7.3)Most common†
Fatigue 67 (34.7) 5 (2.6)Diarrhea 53 (27.5) 2 (1.0)Nausea 46 (23.8) 0Pruritus 41 (21.2) 0Rash 32 (16.6) 1 (0.5)Cough 32 (16.6) 0Arthralgia 28 (14.5) 1 (0.5)Constipation 26 (13.5) 1 (0.5)Vomiting 24 (12.4) 1 (0.5)Actinic keratosis 23 (11.9) 0Maculopapular rash 23 (11.9) 1 (0.5)Anemia 22 (11.4) 8 (4.1)Hypothyroidism 22 (11.4) 0Headache 21 (10.9) 0Upper respiratory tract infection 20 (10.4) 0
†TEAEs reported in ≥10% of patients, ordered by frequency of any grade.
367
• ORR per ICR was 46.1% (95% CI: 38.9–53.4) among all patients; 50.8% (95% CI: 37.5–64.1) for Group 1, 44.9% (95% CI: 33.6–56.6) for Group 2, and 42.9% (95% CI: 29.7–56.8) for Group 3 (Table 2).
• Per ICR, ORR was 48.4% and 41.5% among those who had not received prior anticancer systemic therapy (n=128) and those who had received prior anticancer systemic therapy (n=65), respectively.
• Overall, the observed time to response was 2 months for 41 (46.1%)patients, 2–4 months for 29 (32.6%) patients, 4–6 months for eight (9.0%)patients, and >6 months for 11 (12.4%) patients.
• Median DOR has not been reached (observed DOR range: 1.9–34.3 months).In responding patients, the estimated proportion of patients with ongoingresponse at 24 months was 69.4% (95% CI: 55.6–79.6) (Figure 3).
Treatment-emergent adverse events
• In total, 192 (99.5%) patients experienced at least one TEAE of any grade regardless of attribution (Table 3).
• Overall, the most common TEAEs of any grade were fatigue (n=67, 34.7%), diarrhea (n=53, 27.5%), and nausea (n=46, 23.8%).
• Grade ≥3 TEAEs regardless of attribution occurred in 94 (48.7%) of patients. The most common Grade ≥3 TEAEs were hypertension (n=9; 4.7%) and anemia and cellulitis (each n=8; 4.1%).
Clinical activity
• Complete response rates at primary analysis, ~1 year follow-up for Groups 1, 2, and 3, and ~2 year follow-up for Group 1 are shown in Figure 2.
• Among 89 responders, median time to complete response was 11.2 months (interquartile range [IQR], 7.4–14.8).
• Estimated median PFS was 18.4 months (95% CI: 10.3–24.3) for all patients. The Kaplan–Meier estimated progression-free probability at 24 months was 44.2% (95% CI: 36.1–52.1) (Figure 4A).
• Median OS has not been reached. The Kaplan–Meier estimated probabilityof OS at 24 months was 73.3% (95% CI: 66.1–79.2) (Figure 4B).
Figure 3. Kaplan–Meier curves of DOR per ICR
1.0
0.9
0.8
0.7
0.6
0.5
0.4
0.3
0.2
0.1
0.0
0 2 4 6 8 10 12 14 16 18 20 22 24 26 28 30 32 34 36 38 40P
rob
abili
ty o
f no
p
rog
ress
ion
or
dea
thMonth
Number of patients at risk30 30 29 28 23 23 23 23 23 20 18 16 16 16 10 9 6 2 0 0 0Group 1 (n=59)35 33 32 30 27 25 22 21 17 14 10 8 6 6 5 4 0 0 0 0 0Group 2 (n=78)24 24 24 23 21 21 20 19 17 11 5 0 0 0 0 0 0 0 0 0 0Group 3 (n=56)
Total (n=193) 89 87 85 81 71 69 65 63 57 45 33 24 22 22 15 13 6 2 0 0 0
Group 1 (mCSCC) 3 mg/kg Q2W (n=59)Group 2 (laCSCC) 3 mg/kg Q2W (n=78)Group 3 (mCSCC) 350 mg Q3W (n=56)Total (n=193)Figure 2. Complete response rates per ICR
25
20
15
10
5
0
Co
mp
lete
res
po
nse
rate
s (%
)
Group 1 (mCSCC)3 mg/kg Q2W
Group 2 (laCSCC)†
3 mg/kg Q2WGroup 3 (mCSCC)
350 mg Q3W
n=1012.8
n=35.4
n=46.8
n=1016.9
n=1220.3
n=1012.8
n=916.1
Primary ~1-year follow-up ~2-year follow-up
Figure 4. Kaplan–Meier curves for A) PFS per ICR and B) OS
Group 1 (mCSCC) 3 mg/kg Q2W (n=59)Group 2 (laCSCC) 3 mg/kg Q2W (n=78)Group 3 (mCSCC) 350 mg Q3W (n=56)Total (n=193)
1.00.90.80.70.60.50.40.30.20.10.0
0 2 4 6 8 10 12 14 16 18 20 22 24 26 28 30 32 34 36 38 40
Pro
bab
ility
of
OS
MonthNumber of patients at risk
59 56 52 49 47 46 41 39 39 38 38 37 35 33 24 16 11 4 1 0Group 1 (n=59) 4778 76 73 67 65 64 62 59 54 44 41 33 25 22 15 12 8 3 1 0Group 2 (n=78) 6556 52 49 46 45 38 38 38 37 29 20 9 2 0 0 0 0 0 0 0Group 3 (n=56) 44
Total (n=193) 193 184 174 162 157 156 148 141 136 130 111 99 79 62 55 39 28 19 7 2 0
B
Group 1 (mCSCC) 3 mg/kg Q2W (n=59)Group 2 (laCSCC) 3 mg/kg Q2W (n=78)Group 3 (mCSCC) 350 mg Q3W (n=56)Total (n=193)
1.00.90.80.70.60.50.40.30.20.10.0
0 2 4 6 8 10 12 14 16 18 20 22 24 26 28 30 32 34 36 38 40
Pro
bab
ility
of
PFS
MonthNumber of patients at risk
59 42 38 36 32 27 27 27 27 27 24 24 21 20 20 12 9 6 1 0 0Group 1 (n=59)78 61 48 43 39 37 33 29 26 20 17 16 12 10 7 5 5 2 0 0 0Group 2 (n=78)56 48 33 31 31 28 26 26 24 24 17 10 1 1 0 0 0 0 0 0 0Group 3 (n=56)193 151 119 110 102 92 86 82 77 71 58 50 34 31 27 17 14 8 1 0 0Total (n=193)
A
• Grade ≥3 treatment-related adverse events (TRAEs) were reported in 33 (17.1%) patients, with the most common being pneumonitis (n=5, 2.6%), autoimmune hepatitis (n=3; 1.6%), anemia, colitis, and diarrhea (all n=2; 1.0%).
• No new TEAEs resulting in death were reported compared to previousreports.9–11
†Among 23 laCSCC patients who were included in the pre-specified Group 2 interim analysis, there were no complete responses.
See poster #382 reporting post hoc analysis of health-related quality of life in the same patient population presented in this poster. Also see poster #433 that provides the design and rationale of a Phase 3, randomized, double-blind study of adjuvant cemiplimab versus placebo post-surgery and radiation in patients with high-risk CSCC.
References1. Que SKT et al. J Am Acad Dermatol. 2018;78:237–247.2. Cranmer LD et al. Oncologist. 2010;15:1320–1328.3. National Comprehensive Cancer Network. NCCN Clinical
practice guidelines in oncology: squamous cell skin cancer(Version 2.2019). 2018. Available at: https://www.nccn.org/professionals/physician_gls/pdf/squamous.pdf. [AccessedMarch 20, 2020].
4. Karia PS et al. J Clin Oncol. 2014;32:327–334.5. Weinberg AS et al. Dermatol Surg. 2007;33:885–899.
6. Schmults CD et al. JAMA Dermatol. 2013;149:541–547.7. Cowey C et al. Cancer Med. 2020 [in press].8. Burova E et al. Mol Cancer Ther. 2017;16:861–870.9. Migden MR et al. Lancet Oncol. 2020;21:294–305.
10. Migden MR et al. N Engl J Med. 2018;379:341–351.11. Rischin D et al. Poster presented at Maui Dermatology
Conference, January 25–29, 2020. 12. Eisenhauer EA et al. Eur J Cancer. 2009;45:228–247.
AcknowledgmentsThe authors would like to thank the patients, their families, all other investigators, and all investigational site members involved in this study.The study was funded by Regeneron Pharmaceuticals, Inc., and Sanofi. Medical writing support and typesetting was provided by KateCarolan, PhD, of Prime, Knutsford, UK, funded by Regeneron Pharmaceuticals, Inc.and Sanofi.For any questions or comments, please contact Dr Danny Rischin, [email protected]
Conclusions• For patients with advanced CSCC, cemiplimab achieved ORR of 46.1%.
• Patients had deepening responses over time as evidenced byincreasing complete response rates.9–11 Overall, the completeresponse rate is now 16.1% and median time to complete responsewas 11.2 months.
• DOR and OS are longer than what has been previously described withother agents.7
• With median DOR not reached after an additional 1 year of follow-up,this analysis indicates an increasing, clinically meaningful DORwith cemiplimab.
• The discontinuation rate, regardless of attribution, was low and mostTRAEs were Grades 1–2.
Background• Cutaneous squamous cell carcinoma (CSCC) is the second most
common cancer in the US and its incidence is increasing.1
• Most cases of CSCC are cured by complete surgical excision.2,3
However, a small but substantial number of patients present with eithermetastatic CSCC (mCSCC) or locally advanced CSCC (laCSCC) notamenable to curative surgery or curative radiotherapy (collectivelyreferred to as “advanced CSCC”), both of which have poor prognoses.4–6
• Historical data shows median overall survival (OS) of approximately 15 months with conventional chemotherapy or epidermal growth factor receptor inhibitors.7
• Cemiplimab is a high-affinity, highly potent human immunoglobulin G4 monoclonal antibody to the programmed cell death (PD)-1 receptor.8
• Cemiplimab monotherapy achieved clinically meaningful activity in patients with advanced CSCC and has a safety profile consistent with other anti–PD-1 inhibitors.9–11
• Based on initial data (median follow-up of 9.4 months in the pivotal study, NCT02760498), cemiplimab (cemiplimab-rwlc in the US) was approved for the treatment of patients with advanced CSCC.
Objective• The primary objective of the Phase 2 study was to evaluate the objective
response rate (ORR) by independent central review (ICR) per Response Evaluation Criteria In Solid Tumors version 1.1 (RECIST 1.1) (for scans)12
and modified World Health Organization (WHO) criteria (for photos).
• Key secondary objectives included ORR per investigator review (INV), duration of response (DOR) by ICR and INV, progression-free survival (PFS) by ICR and INV, OS, complete response rate by ICR, safety and tolerability, and assessment of health-related quality of life. Durable disease control rate, defined as the proportion of patients with response or stable disease for at least 105 days, was also examined.
- Please see poster #382 for results on health-related quality of life data from this study.
• Here, we present up to 3-year follow-up (median duration of follow-up for all patients: 15.7 months) from the largest and most mature prospective data set in advanced CSCC.
Methods• EMPOWER-CSCC-1 is an open-label, non-randomized, multicenter,
international Phase 2 study of patients with advanced CSCC.
• Patients received cemiplimab 3 mg/kg every 2 weeks (Q2W) (Group 1; mCSCC; Group 2, laCSCC) or cemiplimab 350 mg every 3 weeks (Q3W) (Group 3, mCSCC) (Figure 1).
• The severity of treatment-emergent adverse events (TEAEs) was graded according to the National Cancer Institute Common Terminology Criteria for Adverse Events (version 4.03).
• The data cut-off was October 11, 2019.
Presented at American Society of Clinical Oncology (ASCO) 2020 Virtual Scientific Meeting, May 29–31, 2020.
Group 1 – Adult patients with metastatic (nodal and/or distant) CSCC Cemiplimab 3 mg/kg
Q2W IV, for up to 96 weeks
Cemiplimab 350 mgQ3W IV, for up to
54 weeks
Tumor response assessment by ICR (RECIST 1.1 for scans; modified WHO criteria for photos)
Tumor imaging every 8 weeks for the
assessment of efficacy
Tumor imaging every 9 weeks for the
assessment of efficacy
Group 3 – Adult patients with metastatic (nodal and/or distant) CSCC
Group 2 – laCSCC
Key inclusion criteria• ECOG performance status of 0 or 1• Adequate organ function• Groups 1 and 3:
At least one lesion measurable by RECIST 1.1 • Group 2
At least one lesion measurable by digital medical photographyCSCC lesion that is not amenable to curative surgery or curative radiation therapy per investigators’ assessmentTumor biopsies at baseline and on day 29, for exploratory biomarker analysis, unless considered to have unacceptable safety risks by the investigator
Key exclusion criteria• Ongoing or recent (within 5 years) autoimmune disease requiring systemic immunosuppression• Prior treatments with anti–PD-1 or anti–PD-L1 therapy• History of solid organ transplant, concurrent malignancies (unless indolent or not considered life-threatening; for example, basal cell carcinoma), or hematologic malignancies
Figure 1. Study design
ECOG, Eastern Cooperative Oncology Group; IV, intravenously; PD-L1, PD-ligand 1.
Phase 2 Study of Cemiplimab in Patients with Advanced Cutaneous Squamous Cell Carcinoma (CSCC): Longer Follow-Up
Danny Rischin,1 Nikhil I. Khushalani,2 Chrysalyne D. Schmults,3 Alexander Guminski,4 Anne Lynn S. Chang,5 Karl D. Lewis,6 Annette M. Lim,1 Leonel Hernandez-Aya,7 Brett G.M. Hughes,8 Dirk Schadendorf,9 Axel Hauschild,10
Elizabeth Stankevich,11 Jocelyn Booth,11 Suk-Young Yoo,11 Zhen Chen,12 Emmanuel Okoye,13 Israel Lowy,12 Matthew G. Fury,12 Michael R. Migden14
1Department of Medical Oncology, Peter MacCallum Cancer Centre, Melbourne, Australia; 2Department of Cutaneous Oncology, Moffitt Cancer Center, Tampa, FL, USA; 3Department of Dermatology, Brigham and Women’s Hospital, Harvard Medical School, Boston, MA, USA; 4Department of Medical Oncology, Royal North Shore Hospital, St Leonards, Australia; 5Department of Dermatology, Stanford University School of Medicine, Redwood City, CA, USA; 6University of Colorado Denver, School of Medicine, Aurora, CO, USA;
7Division of Medical Oncology, Department of Medicine, Washington University School of Medicine, St Louis, MO, USA; 8Royal Brisbane & Women’s Hospital and University of Queensland, Brisbane, Australia; 9University Hospital Essen, Essen and German Cancer Consortium, Essen, Germany; 10Schleswig-Holstein University Hospital, Kiel, Germany; 11Regeneron Pharmaceuticals, Inc., Basking Ridge, NJ, USA; 12Regeneron Pharmaceuticals, Inc., Tarrytown, NY, USA; 13Regeneron Pharmaceuticals, Inc., London, UK;
14Departments of Dermatology and Head and Neck Surgery, University of Texas MD Anderson Cancer Center, Houston, TX, USA
ResultsPatients• A total of 193 patients were enrolled (Group 1, n=59; Group 2, n=78;
Group 3, n=56) (Table 1).
Table 1. Baseline demographics
Advanced CSCC(n=193)
Median age, years (range) 72.0 (38–96)Male, n (%) 161 (83.4)ECOG performance status, n (%)
0 86 (44.6)1 107 (55.4)
Primary CSCC site: head and neck, n (%) 131 (67.9)mCSCC, n (%) 115 (59.6)laCSCC, n (%) 78 (40.4)Patients with cemiplimab as first-line therapy, n (%) 128 (66.3)Patients with prior systemic therapy, n (%)† 65 (33.7)Median duration of exposure to cemiplimab, weeks (range) 51.1 (2.0–109.3)Median number of doses of cemiplimab administered (range) 18.0 (1–48)†Settings for prior lines of therapy included metastatic disease, adjuvant, chemotherapy with concurrent radiation, or other and the mostcommon types of prior systemic therapy were platinum compounds (n=46/65 [70.8%]) and monoclonal antibodies (n=18/65 [27.7%]).
Table 2. Duration of follow-up and tumor response to cemiplimab per ICR
Group 1 (mCSCC)3 mg/kg Q2W (n=59)
Group 2 (laCSCC)3 mg/kg Q2W (n=78)
Group 3 (mCSCC)350 mg Q3W (n=56)
Total (n=193)
Median duration of follow-up, months (range) 18.5 (1.1–36.1) 15.5 (0.8–35.6) 17.3 (0.6–26.3) 15.7 (0.6–36.1)ORR, % (95% CI) 50.8 (37.5–64.1) 44.9 (33.6–56.6) 42.9 (29.7–56.8) 46.1 (38.9–53.4)
Complete response, n (%) 12 (20.3) 10 (12.8) 9 (16.1) 31 (16.1)Partial response, n (%) 18 (30.5) 25 (32.1) 15 (26.8) 58 (30.1)Stable disease, n (%) 9 (15.3) 27 (34.6) 10 (17.9) 46 (23.8)Non-complete response/non-progressive disease, n (%) 3 (5.1) 0 2 (3.6) 5 (2.6)Progressive disease, n (%) 10 (16.9) 10 (12.8) 14 (25.0) 34 (17.6)Not evaluable, n (%) 7 (11.9) 6 (7.7) 6 (10.7) 19 (9.8)
Disease control rate, % (95% CI) 71.2 (57.9–82.2) 79.5 (68.8–87.8) 64.3 (50.4–76.6) 72.5 (65.7–78.7)Durable disease control rate,† % (95% CI) 61.0 (47.4–73.5) 62.8 (51.1–73.5) 57.1 (43.2–70.3) 60.6 (53.3–67.6)Median observed time to response, months (IQR)‡ 1.9 (1.8–2.0) 2.1 (1.9–3.8) 2.1 (2.1–4.2) 2.1 (1.9–3.7)
Median observed time to complete response, months (IQR)‡ 11.1 (7.5–18.4) 10.5 (7.4–12.9) 12.4 (8.2–16.6) 11.2 (7.4–14.8)Median DOR, months (range)‡ NR (20.7, NE) NR (18.4, NE) NR (NE, NE) NR (28.8, NE)Kaplan–Meier 12-month estimate of patients with ongoing response, % (95% CI) 89.5 (70.9–96.5) 83.2 (64.1–92.7) 91.7 (70.6–97.8) 87.8 (78.5–93.3)Kaplan–Meier 24-month estimate of patients with ongoing response, % (95% CI) 68.8 (46.9–83.2) 62.5 (38.4–79.4) NE (NE, NE) 69.4 (55.6–79.6)†Defined as the proportion of patients without progressive disease for at least 105 days.
‡Based on number of patients with confirmed complete or partial response.
ORR per INV was 54.4% (95% CI: 47.1–61.6) for all patients; 50.8% (95% CI: 37.5–64.1) for Group 1, 56.4% (95% CI: 44.7–67.6) for Group 2, and 55.4% (95% CI: 41.5–68.7) for Group 3. ORR per INV was 57.8% (95% CI: 48.8–66.5) among treatment-naïve patients and 47.7% (95% CI: 35.1–60.5) among previously treated patients.CI, confidence interval; NE, not evaluable; NR, not reached.
Table 3. TEAEs regardless of attribution
Advanced CSCC (n=193)
n (%) Any grade Grade ≥3Any 192 (99.5) 94 (48.7)Led to discontinuation 19 (9.8) 14 (7.3)Most common†
Fatigue 67 (34.7) 5 (2.6)Diarrhea 53 (27.5) 2 (1.0)Nausea 46 (23.8) 0Pruritus 41 (21.2) 0Rash 32 (16.6) 1 (0.5)Cough 32 (16.6) 0Arthralgia 28 (14.5) 1 (0.5)Constipation 26 (13.5) 1 (0.5)Vomiting 24 (12.4) 1 (0.5)Actinic keratosis 23 (11.9) 0Maculopapular rash 23 (11.9) 1 (0.5)Anemia 22 (11.4) 8 (4.1)Hypothyroidism 22 (11.4) 0Headache 21 (10.9) 0Upper respiratory tract infection 20 (10.4) 0
†TEAEs reported in ≥10% of patients, ordered by frequency of any grade.
367
• ORR per ICR was 46.1% (95% CI: 38.9–53.4) among all patients; 50.8% (95% CI: 37.5–64.1) for Group 1, 44.9% (95% CI: 33.6–56.6) for Group 2, and 42.9% (95% CI: 29.7–56.8) for Group 3 (Table 2).
• Per ICR, ORR was 48.4% and 41.5% among those who had not received prior anticancer systemic therapy (n=128) and those who had received prior anticancer systemic therapy (n=65), respectively.
• Overall, the observed time to response was 2 months for 41 (46.1%) patients, 2–4 months for 29 (32.6%) patients, 4–6 months for eight (9.0%) patients, and >6 months for 11 (12.4%) patients.
• Median DOR has not been reached (observed DOR range: 1.9–34.3 months). In responding patients, the estimated proportion of patients with ongoing response at 24 months was 69.4% (95% CI: 55.6–79.6) (Figure 3).
Treatment-emergent adverse events
• In total, 192 (99.5%) patients experienced at least one TEAE of any grade regardless of attribution (Table 3).
• Overall, the most common TEAEs of any grade were fatigue (n=67, 34.7%), diarrhea (n=53, 27.5%), and nausea (n=46, 23.8%).
• Grade ≥3 TEAEs regardless of attribution occurred in 94 (48.7%) of patients. The most common Grade ≥3 TEAEs were hypertension (n=9; 4.7%) and anemia and cellulitis (each n=8; 4.1%).
Clinical activity
• Complete response rates at primary analysis, ~1 year follow-up for Groups1, 2, and 3, and ~2 year follow-up for Group 1 are shown in Figure 2.
• Among 89 responders, median time to complete response was 11.2 months (interquartile range [IQR], 7.4–14.8).
• Estimated median PFS was 18.4 months (95% CI: 10.3–24.3) for all patients. The Kaplan–Meier estimated progression-free probability at 24 months was 44.2% (95% CI: 36.1–52.1) (Figure 4A).
• Median OS has not been reached. The Kaplan–Meier estimated probability of OS at 24 months was 73.3% (95% CI: 66.1–79.2) (Figure 4B).
Figure 3. Kaplan–Meier curves of DOR per ICR
1.0
0.9
0.8
0.7
0.6
0.5
0.4
0.3
0.2
0.1
0.0
0 2 4 6 8 10 12 14 16 18 20 22 24 26 28 30 32 34 36 38 40
Pro
bab
ility
of
no
pro
gre
ssio
n o
r d
eath
MonthNumber of patients at risk
30 30 29 28 23 23 23 23 23 20 18 16 16 16 10 9 6 2 0 0 0Group 1 (n=59)35 33 32 30 27 25 22 21 17 14 10 8 6 6 5 4 0 0 0 0 0Group 2 (n=78)24 24 24 23 21 21 20 19 17 11 5 0 0 0 0 0 0 0 0 0 0Group 3 (n=56)
Total (n=193) 89 87 85 81 71 69 65 63 57 45 33 24 22 22 15 13 6 2 0 0 0
Group 1 (mCSCC) 3 mg/kg Q2W (n=59)Group 2 (laCSCC) 3 mg/kg Q2W (n=78)Group 3 (mCSCC) 350 mg Q3W (n=56)Total (n=193)Figure 2. Complete response rates per ICR
25
20
15
10
5
0
Co
mp
lete
res
po
nse
rate
s (%
)
Group 1 (mCSCC)3 mg/kg Q2W
Group 2 (laCSCC)†
3 mg/kg Q2WGroup 3 (mCSCC)
350 mg Q3W
n=1012.8
n=35.4
n=46.8
n=1016.9
n=1220.3
n=1012.8
n=916.1
Primary ~1-year follow-up ~2-year follow-up
Figure 4. Kaplan–Meier curves for A) PFS per ICR and B) OS
Group 1 (mCSCC) 3 mg/kg Q2W (n=59)Group 2 (laCSCC) 3 mg/kg Q2W (n=78)Group 3 (mCSCC) 350 mg Q3W (n=56)Total (n=193)
1.00.90.80.70.60.50.40.30.20.10.0
0 2 4 6 8 10 12 14 16 18 20 22 24 26 28 30 32 34 36 38 40
Pro
bab
ility
of
OS
MonthNumber of patients at risk
59 56 52 49 47 46 41 39 39 38 38 37 35 33 24 16 11 4 1 0Group 1 (n=59) 4778 76 73 67 65 64 62 59 54 44 41 33 25 22 15 12 8 3 1 0Group 2 (n=78) 6556 52 49 46 45 38 38 38 37 29 20 9 2 0 0 0 0 0 0 0Group 3 (n=56) 44
Total (n=193) 193 184 174 162 157 156 148 141 136 130 111 99 79 62 55 39 28 19 7 2 0
B
Group 1 (mCSCC) 3 mg/kg Q2W (n=59)Group 2 (laCSCC) 3 mg/kg Q2W (n=78)Group 3 (mCSCC) 350 mg Q3W (n=56)Total (n=193)
1.00.90.80.70.60.50.40.30.20.10.0
0 2 4 6 8 10 12 14 16 18 20 22 24 26 28 30 32 34 36 38 40
Pro
bab
ility
of
PFS
MonthNumber of patients at risk
59 42 38 36 32 27 27 27 27 27 24 24 21 20 20 12 9 6 1 0 0Group 1 (n=59)78 61 48 43 39 37 33 29 26 20 17 16 12 10 7 5 5 2 0 0 0Group 2 (n=78)56 48 33 31 31 28 26 26 24 24 17 10 1 1 0 0 0 0 0 0 0Group 3 (n=56)193 151 119 110 102 92 86 82 77 71 58 50 34 31 27 17 14 8 1 0 0Total (n=193)
A
• Grade ≥3 treatment-related adverse events (TRAEs) were reported in 33 (17.1%) patients, with the most common being pneumonitis (n=5, 2.6%), autoimmune hepatitis (n=3; 1.6%), anemia, colitis, and diarrhea (all n=2; 1.0%).
• No new TEAEs resulting in death were reported compared to previousreports.9–11
†Among 23 laCSCC patients who were included in the pre-specified Group 2 interim analysis, there were no complete responses.
See poster #382 reporting post hoc analysis of health-related quality of life in the same patient population presented in this poster. Also see poster #433 that provides the design and rationale of a Phase 3, randomized, double-blind study of adjuvant cemiplimab versus placebo post-surgery and radiation in patients with high-risk CSCC.
References1. Que SKT et al. J Am Acad Dermatol. 2018;78:237–247.2. Cranmer LD et al. Oncologist. 2010;15:1320–1328.3. National Comprehensive Cancer Network. NCCN Clinical
practice guidelines in oncology: squamous cell skin cancer (Version 2.2019). 2018. Available at: https://www.nccn.org/professionals/physician_gls/pdf/squamous.pdf. [Accessed March 20, 2020].
4. Karia PS et al. J Clin Oncol. 2014;32:327–334.5. Weinberg AS et al. Dermatol Surg. 2007;33:885–899.
6. Schmults CD et al. JAMA Dermatol. 2013;149:541–547.7. Cowey C et al. Cancer Med. 2020 [in press].8. Burova E et al. Mol Cancer Ther. 2017;16:861–870.9. Migden MR et al. Lancet Oncol. 2020;21:294–305.
10. Migden MR et al. N Engl J Med. 2018;379:341–351.11. Rischin D et al. Poster presented at Maui Dermatology
Conference, January 25–29, 2020. 12. Eisenhauer EA et al. Eur J Cancer. 2009;45:228–247.
AcknowledgmentsThe authors would like to thank the patients, their families, all other investigators, and all investigational site members involved in this study. The study was funded by Regeneron Pharmaceuticals, Inc., and Sanofi. Medical writing support and typesetting was provided by Kate Carolan, PhD, of Prime, Knutsford, UK, funded by Regeneron Pharmaceuticals, Inc.and Sanofi.For any questions or comments, please contact Dr Danny Rischin, [email protected]
Conclusions• For patients with advanced CSCC, cemiplimab achieved ORR of 46.1%.
• Patients had deepening responses over time as evidenced by increasing complete response rates.9–11 Overall, the complete response rate is now 16.1% and median time to complete response was 11.2 months.
• DOR and OS are longer than what has been previously described with other agents.7
• With median DOR not reached after an additional 1 year of follow-up, this analysis indicates an increasing, clinically meaningful DOR with cemiplimab.
• The discontinuation rate, regardless of attribution, was low and most TRAEs were Grades 1–2.
Background• Cutaneous squamous cell carcinoma (CSCC) is the second most
common cancer in the US and its incidence is increasing.1
• Most cases of CSCC are cured by complete surgical excision.2,3
However, a small but substantial number of patients present with eithermetastatic CSCC (mCSCC) or locally advanced CSCC (laCSCC) notamenable to curative surgery or curative radiotherapy (collectivelyreferred to as “advanced CSCC”), both of which have poor prognoses.4–6
• Historical data shows median overall survival (OS) of approximately 15 months with conventional chemotherapy or epidermal growth factor receptor inhibitors.7
• Cemiplimab is a high-affinity, highly potent human immunoglobulin G4 monoclonal antibody to the programmed cell death (PD)-1 receptor.8
• Cemiplimab monotherapy achieved clinically meaningful activity in patients with advanced CSCC and has a safety profile consistent with other anti–PD-1 inhibitors.9–11
• Based on initial data (median follow-up of 9.4 months in the pivotal study, NCT02760498), cemiplimab (cemiplimab-rwlc in the US) was approved for the treatment of patients with advanced CSCC.
Objective• The primary objective of the Phase 2 study was to evaluate the objective
response rate (ORR) by independent central review (ICR) per Response Evaluation Criteria In Solid Tumors version 1.1 (RECIST 1.1) (for scans)12
and modified World Health Organization (WHO) criteria (for photos).
• Key secondary objectives included ORR per investigator review (INV), duration of response (DOR) by ICR and INV, progression-free survival (PFS) by ICR and INV, OS, complete response rate by ICR, safety and tolerability, and assessment of health-related quality of life. Durable disease control rate, defined as the proportion of patients with response or stable disease for at least 105 days, was also examined.
- Please see poster #382 for results on health-related quality of life data from this study.
• Here, we present up to 3-year follow-up (median duration of follow-up for all patients: 15.7 months) from the largest and most mature prospective data set in advanced CSCC.
Methods• EMPOWER-CSCC-1 is an open-label, non-randomized, multicenter,
international Phase 2 study of patients with advanced CSCC.
• Patients received cemiplimab 3 mg/kg every 2 weeks (Q2W) (Group 1; mCSCC; Group 2, laCSCC) or cemiplimab 350 mg every 3 weeks (Q3W) (Group 3, mCSCC) (Figure 1).
• The severity of treatment-emergent adverse events (TEAEs) was graded according to the National Cancer Institute Common Terminology Criteria for Adverse Events (version 4.03).
• The data cut-off was October 11, 2019.
Presented at American Society of Clinical Oncology (ASCO) 2020 Virtual Scientific Meeting, May 29–31, 2020.
Group 1 – Adult patients with metastatic (nodal and/or distant) CSCC Cemiplimab 3 mg/kg
Q2W IV, for up to 96 weeks
Cemiplimab 350 mgQ3W IV, for up to
54 weeks
Tumor response assessment by ICR (RECIST 1.1 for scans; modified WHO criteria for photos)
Tumor imaging every 8 weeks for the
assessment of efficacy
Tumor imaging every 9 weeks for the
assessment of efficacy
Group 3 – Adult patients with metastatic (nodal and/or distant) CSCC
Group 2 – laCSCC
Key inclusion criteria• ECOG performance status of 0 or 1• Adequate organ function• Groups 1 and 3:
At least one lesion measurable by RECIST 1.1 • Group 2
At least one lesion measurable by digital medical photographyCSCC lesion that is not amenable to curative surgery or curative radiation therapy per investigators’ assessmentTumor biopsies at baseline and on day 29, for exploratory biomarker analysis, unless considered to have unacceptable safety risks by the investigator
Key exclusion criteria• Ongoing or recent (within 5 years) autoimmune disease requiring systemic immunosuppression• Prior treatments with anti–PD-1 or anti–PD-L1 therapy• History of solid organ transplant, concurrent malignancies (unless indolent or not considered life-threatening; for example, basal cell carcinoma), or hematologic malignancies
Figure 1. Study design
ECOG, Eastern Cooperative Oncology Group; IV, intravenously; PD-L1, PD-ligand 1.
Phase 2 Study of Cemiplimab in Patients with Advanced Cutaneous Squamous Cell Carcinoma (CSCC): Longer Follow-Up
Danny Rischin,1 Nikhil I. Khushalani,2 Chrysalyne D. Schmults,3 Alexander Guminski,4 Anne Lynn S. Chang,5 Karl D. Lewis,6 Annette M. Lim,1 Leonel Hernandez-Aya,7 Brett G.M. Hughes,8 Dirk Schadendorf,9 Axel Hauschild,10
Elizabeth Stankevich,11 Jocelyn Booth,11 Suk-Young Yoo,11 Zhen Chen,12 Emmanuel Okoye,13 Israel Lowy,12 Matthew G. Fury,12 Michael R. Migden14
1Department of Medical Oncology, Peter MacCallum Cancer Centre, Melbourne, Australia; 2Department of Cutaneous Oncology, Moffitt Cancer Center, Tampa, FL, USA; 3Department of Dermatology, Brigham and Women’s Hospital, Harvard Medical School, Boston, MA, USA; 4Department of Medical Oncology, Royal North Shore Hospital, St Leonards, Australia; 5Department of Dermatology, Stanford University School of Medicine, Redwood City, CA, USA; 6University of Colorado Denver, School of Medicine, Aurora, CO, USA;
7Division of Medical Oncology, Department of Medicine, Washington University School of Medicine, St Louis, MO, USA; 8Royal Brisbane & Women’s Hospital and University of Queensland, Brisbane, Australia; 9University Hospital Essen, Essen and German Cancer Consortium, Essen, Germany; 10Schleswig-Holstein University Hospital, Kiel, Germany; 11Regeneron Pharmaceuticals, Inc., Basking Ridge, NJ, USA; 12Regeneron Pharmaceuticals, Inc., Tarrytown, NY, USA; 13Regeneron Pharmaceuticals, Inc., London, UK;
14Departments of Dermatology and Head and Neck Surgery, University of Texas MD Anderson Cancer Center, Houston, TX, USA
ResultsPatients• A total of 193 patients were enrolled (Group 1, n=59; Group 2, n=78;
Group 3, n=56) (Table 1).
Table 1. Baseline demographics
Advanced CSCC(n=193)
Median age, years (range) 72.0 (38–96)Male, n (%) 161 (83.4)ECOG performance status, n (%)
0 86 (44.6)1 107 (55.4)
Primary CSCC site: head and neck, n (%) 131 (67.9)mCSCC, n (%) 115 (59.6)laCSCC, n (%) 78 (40.4)Patients with cemiplimab as first-line therapy, n (%) 128 (66.3)Patients with prior systemic therapy, n (%)† 65 (33.7)Median duration of exposure to cemiplimab, weeks (range) 51.1 (2.0–109.3)Median number of doses of cemiplimab administered (range) 18.0 (1–48)†Settings for prior lines of therapy included metastatic disease, adjuvant, chemotherapy with concurrent radiation, or other and the mostcommon types of prior systemic therapy were platinum compounds (n=46/65 [70.8%]) and monoclonal antibodies (n=18/65 [27.7%]).
Table 2. Duration of follow-up and tumor response to cemiplimab per ICR
Group 1 (mCSCC)3 mg/kg Q2W (n=59)
Group 2 (laCSCC)3 mg/kg Q2W (n=78)
Group 3 (mCSCC)350 mg Q3W (n=56)
Total(n=193)
Median duration of follow-up, months (range) 18.5 (1.1–36.1) 15.5 (0.8–35.6) 17.3 (0.6–26.3) 15.7 (0.6–36.1)ORR, % (95% CI) 50.8 (37.5–64.1) 44.9 (33.6–56.6) 42.9 (29.7–56.8) 46.1 (38.9–53.4)
Complete response, n (%) 12 (20.3) 10 (12.8) 9 (16.1) 31 (16.1)Partial response, n (%) 18 (30.5) 25 (32.1) 15 (26.8) 58 (30.1)Stable disease, n (%) 9 (15.3) 27 (34.6) 10 (17.9) 46 (23.8)Non-complete response/non-progressive disease, n (%) 3 (5.1) 0 2 (3.6) 5 (2.6)Progressive disease, n (%) 10 (16.9) 10 (12.8) 14 (25.0) 34 (17.6)Not evaluable, n (%) 7 (11.9) 6 (7.7) 6 (10.7) 19 (9.8)
Disease control rate, % (95% CI) 71.2 (57.9–82.2) 79.5 (68.8–87.8) 64.3 (50.4–76.6) 72.5 (65.7–78.7)Durable disease control rate,† % (95% CI) 61.0 (47.4–73.5) 62.8 (51.1–73.5) 57.1 (43.2–70.3) 60.6 (53.3–67.6)Median observed time to response, months (IQR)‡ 1.9 (1.8–2.0) 2.1 (1.9–3.8) 2.1 (2.1–4.2) 2.1 (1.9–3.7)
Median observed time to complete response, months (IQR)‡ 11.1 (7.5–18.4) 10.5 (7.4–12.9) 12.4 (8.2–16.6) 11.2 (7.4–14.8)Median DOR, months (range)‡ NR (20.7, NE) NR (18.4, NE) NR (NE, NE) NR (28.8, NE)Kaplan–Meier 12-month estimate of patients with ongoing response, % (95% CI) 89.5 (70.9–96.5) 83.2 (64.1–92.7) 91.7 (70.6–97.8) 87.8 (78.5–93.3)Kaplan–Meier 24-month estimate of patients with ongoing response, % (95% CI) 68.8 (46.9–83.2) 62.5 (38.4–79.4) NE (NE, NE) 69.4 (55.6–79.6)†Defined as the proportion of patients without progressive disease for at least 105 days.‡Based on number of patients with confirmed complete or partial response.ORR per INV was 54.4% (95% CI: 47.1–61.6) for all patients; 50.8% (95% CI: 37.5–64.1) for Group 1, 56.4% (95% CI: 44.7–67.6) for Group 2, and 55.4% (95% CI: 41.5–68.7) for Group 3. ORR per INV was 57.8% (95% CI: 48.8–66.5) among treatment-naïve patients and 47.7% (95% CI: 35.1–60.5)among previously treated patients.CI, confidence interval; NE, not evaluable; NR, not reached.
Table 3. TEAEs regardless of attribution
Advanced CSCC (n=193)
n (%) Any grade Grade ≥3Any 192 (99.5) 94 (48.7)Led to discontinuation 19 (9.8) 14 (7.3)Most common†
Fatigue 67 (34.7) 5 (2.6)Diarrhea 53 (27.5) 2 (1.0)Nausea 46 (23.8) 0Pruritus 41 (21.2) 0Rash 32 (16.6) 1 (0.5)Cough 32 (16.6) 0Arthralgia 28 (14.5) 1 (0.5)Constipation 26 (13.5) 1 (0.5)Vomiting 24 (12.4) 1 (0.5)Actinic keratosis 23 (11.9) 0Maculopapular rash 23 (11.9) 1 (0.5)Anemia 22 (11.4) 8 (4.1)Hypothyroidism 22 (11.4) 0Headache 21 (10.9) 0Upper respiratory tract infection 20 (10.4) 0
†TEAEs reported in ≥10% of patients, ordered by frequency of any grade.
367
• ORR per ICR was 46.1% (95% CI: 38.9–53.4) among all patients; 50.8% (95% CI: 37.5–64.1) for Group 1, 44.9% (95% CI: 33.6–56.6) for Group 2, and 42.9% (95% CI: 29.7–56.8) for Group 3 (Table 2).
• Per ICR, ORR was 48.4% and 41.5% among those who had not received prior anticancer systemic therapy (n=128) and those who had received prior anticancer systemic therapy (n=65), respectively.
• Overall, the observed time to response was 2 months for 41 (46.1%)patients, 2–4 months for 29 (32.6%) patients, 4–6 months for eight (9.0%)patients, and >6 months for 11 (12.4%) patients.
• Median DOR has not been reached (observed DOR range: 1.9–34.3 months).In responding patients, the estimated proportion of patients with ongoingresponse at 24 months was 69.4% (95% CI: 55.6–79.6) (Figure 3).
Treatment-emergent adverse events
• In total, 192 (99.5%) patients experienced at least one TEAE of any grade regardless of attribution (Table 3).
• Overall, the most common TEAEs of any grade were fatigue (n=67, 34.7%), diarrhea (n=53, 27.5%), and nausea (n=46, 23.8%).
• Grade ≥3 TEAEs regardless of attribution occurred in 94 (48.7%) of patients. The most common Grade ≥3 TEAEs were hypertension (n=9; 4.7%) and anemia and cellulitis (each n=8; 4.1%).
Clinical activity
• Complete response rates at primary analysis, ~1 year follow-up for Groups1, 2, and 3, and ~2 year follow-up for Group 1 are shown in Figure 2.
• Among 89 responders, median time to complete response was 11.2 months (interquartile range [IQR], 7.4–14.8).
• Estimated median PFS was 18.4 months (95% CI: 10.3–24.3) for all patients. The Kaplan–Meier estimated progression-free probability at 24 months was 44.2% (95% CI: 36.1–52.1) (Figure 4A).
• Median OS has not been reached. The Kaplan–Meier estimated probabilityof OS at 24 months was 73.3% (95% CI: 66.1–79.2) (Figure 4B).
Figure 3. Kaplan–Meier curves of DOR per ICR
1.0
0.9
0.8
0.7
0.6
0.5
0.4
0.3
0.2
0.1
0.0
0 2 4 6 8 10 12 14 16 18 20 22 24 26 28 30 32 34 36 38 40
Pro
bab
ility
of
no
pro
gre
ssio
n o
r d
eath
MonthNumber of patients at risk
30 30 29 28 23 23 23 23 23 20 18 16 16 16 10 9 6 2 0 0 0Group 1 (n=59)35 33 32 30 27 25 22 21 17 14 10 8 6 6 5 4 0 0 0 0 0Group 2 (n=78)24 24 24 23 21 21 20 19 17 11 5 0 0 0 0 0 0 0 0 0 0Group 3 (n=56)
Total (n=193) 89 87 85 81 71 69 65 63 57 45 33 24 22 22 15 13 6 2 0 0 0
Group 1 (mCSCC) 3 mg/kg Q2W (n=59)Group 2 (laCSCC) 3 mg/kg Q2W (n=78)Group 3 (mCSCC) 350 mg Q3W (n=56)Total (n=193)Figure 2. Complete response rates per ICR
25
20
15
10
5
0
Co
mp
lete
res
po
nse
rate
s (%
)
Group 1 (mCSCC)3 mg/kg Q2W
Group 2 (laCSCC)†
3 mg/kg Q2WGroup 3 (mCSCC)
350 mg Q3W
n=1012.8
n=35.4
n=46.8
n=1016.9
n=1220.3
n=1012.8
n=916.1
Primary ~1-year follow-up ~2-year follow-up
Figure 4. Kaplan–Meier curves for A) PFS per ICR and B) OS
Group 1 (mCSCC) 3 mg/kg Q2W (n=59)Group 2 (laCSCC) 3 mg/kg Q2W (n=78)Group 3 (mCSCC) 350 mg Q3W (n=56)Total (n=193)
1.00.90.80.70.60.50.40.30.20.10.0
0 2 4 6 8 10 12 14 16 18 20 22 24 26 28 30 32 34 36 38 40
Pro
bab
ility
of
OS
MonthNumber of patients at risk
59 56 52 49 47 46 41 39 39 38 38 37 35 33 24 16 11 4 1 0Group 1 (n=59) 4778 76 73 67 65 64 62 59 54 44 41 33 25 22 15 12 8 3 1 0Group 2 (n=78) 6556 52 49 46 45 38 38 38 37 29 20 9 2 0 0 0 0 0 0 0Group 3 (n=56) 44
Total (n=193) 193 184 174 162 157 156 148 141 136 130 111 99 79 62 55 39 28 19 7 2 0
B
Group 1 (mCSCC) 3 mg/kg Q2W (n=59)Group 2 (laCSCC) 3 mg/kg Q2W (n=78)Group 3 (mCSCC) 350 mg Q3W (n=56)Total (n=193)
1.00.90.80.70.60.50.40.30.20.10.0
0 2 4 6 8 10 12 14 16 18 20 22 24 26 28 30 32 34 36 38 40
Pro
bab
ility
of
PFS
MonthNumber of patients at risk
59 42 38 36 32 27 27 27 27 27 24 24 21 20 20 12 9 6 1 0 0Group 1 (n=59)78 61 48 43 39 37 33 29 26 20 17 16 12 10 7 5 5 2 0 0 0Group 2 (n=78)56 48 33 31 31 28 26 26 24 24 17 10 1 1 0 0 0 0 0 0 0Group 3 (n=56)193 151 119 110 102 92 86 82 77 71 58 50 34 31 27 17 14 8 1 0 0Total (n=193)
A
• Grade ≥3 treatment-related adverse events (TRAEs) were reported in 33 (17.1%) patients, with the most common being pneumonitis (n=5, 2.6%), autoimmune hepatitis (n=3; 1.6%), anemia, colitis, and diarrhea (all n=2; 1.0%).
• No new TEAEs resulting in death were reported compared to previous reports.9–11
†Among 23 laCSCC patients who were included in the pre-specified Group 2 interim analysis, there were no complete responses.
See poster #382 reporting post hoc analysis of health-related quality of life in the same patient population presented in this poster. Also see poster #433 that provides the design and rationale of a Phase 3, randomized, double-blind study of adjuvant cemiplimab versus placebo post-surgery and radiation in patients with high-risk CSCC.
References1. Que SKT et al. J Am Acad Dermatol. 2018;78:237–247.2. Cranmer LD et al. Oncologist. 2010;15:1320–1328.3. National Comprehensive Cancer Network. NCCN Clinical
practice guidelines in oncology: squamous cell skin cancer(Version 2.2019). 2018. Available at: https://www.nccn.org/professionals/physician_gls/pdf/squamous.pdf. [AccessedMarch 20, 2020].
4. Karia PS et al. J Clin Oncol. 2014;32:327–334.5. Weinberg AS et al. Dermatol Surg. 2007;33:885–899.
6. Schmults CD et al. JAMA Dermatol. 2013;149:541–547.7. Cowey C et al. Cancer Med. 2020 [in press].8. Burova E et al. Mol Cancer Ther. 2017;16:861–870.9. Migden MR et al. Lancet Oncol. 2020;21:294–305.
10. Migden MR et al. N Engl J Med. 2018;379:341–351.11. Rischin D et al. Poster presented at Maui Dermatology
Conference, January 25–29, 2020. 12. Eisenhauer EA et al. Eur J Cancer. 2009;45:228–247.
AcknowledgmentsThe authors would like to thank the patients, their families, all other investigators, and all investigational site members involved in this study.The study was funded by Regeneron Pharmaceuticals, Inc., and Sanofi. Medical writing support and typesetting was provided by KateCarolan, PhD, of Prime, Knutsford, UK, funded by Regeneron Pharmaceuticals, Inc.and Sanofi.For any questions or comments, please contact Dr Danny Rischin, [email protected]
Conclusions• For patients with advanced CSCC, cemiplimab achieved ORR of 46.1%.
• Patients had deepening responses over time as evidenced byincreasing complete response rates.9–11 Overall, the completeresponse rate is now 16.1% and median time to complete responsewas 11.2 months.
• DOR and OS are longer than what has been previously described withother agents.7
• With median DOR not reached after an additional 1 year of follow-up,this analysis indicates an increasing, clinically meaningful DORwith cemiplimab.
• The discontinuation rate, regardless of attribution, was low and mostTRAEs were Grades 1–2.
Background• Cutaneous squamous cell carcinoma (CSCC) is the second most
common cancer in the US and its incidence is increasing.1
• Most cases of CSCC are cured by complete surgical excision.2,3
However, a small but substantial number of patients present with eithermetastatic CSCC (mCSCC) or locally advanced CSCC (laCSCC) notamenable to curative surgery or curative radiotherapy (collectivelyreferred to as “advanced CSCC”), both of which have poor prognoses.4–6
• Historical data shows median overall survival (OS) of approximately 15 months with conventional chemotherapy or epidermal growth factor receptor inhibitors.7
• Cemiplimab is a high-affinity, highly potent human immunoglobulin G4 monoclonal antibody to the programmed cell death (PD)-1 receptor.8
• Cemiplimab monotherapy achieved clinically meaningful activity in patients with advanced CSCC and has a safety profile consistent with other anti–PD-1 inhibitors.9–11
• Based on initial data (median follow-up of 9.4 months in the pivotal study, NCT02760498), cemiplimab (cemiplimab-rwlc in the US) was approved for the treatment of patients with advanced CSCC.
Objective• The primary objective of the Phase 2 study was to evaluate the objective
response rate (ORR) by independent central review (ICR) per Response Evaluation Criteria In Solid Tumors version 1.1 (RECIST 1.1) (for scans)12
and modified World Health Organization (WHO) criteria (for photos).
• Key secondary objectives included ORR per investigator review (INV), duration of response (DOR) by ICR and INV, progression-free survival (PFS) by ICR and INV, OS, complete response rate by ICR, safety and tolerability, and assessment of health-related quality of life. Durable disease control rate, defined as the proportion of patients with response or stable disease for at least 105 days, was also examined.
- Please see poster #382 for results on health-related quality of life data from this study.
• Here, we present up to 3-year follow-up (median duration of follow-up for all patients: 15.7 months) from the largest and most mature prospective data set in advanced CSCC.
Methods• EMPOWER-CSCC-1 is an open-label, non-randomized, multicenter,
international Phase 2 study of patients with advanced CSCC.
• Patients received cemiplimab 3 mg/kg every 2 weeks (Q2W) (Group 1; mCSCC; Group 2, laCSCC) or cemiplimab 350 mg every 3 weeks (Q3W) (Group 3, mCSCC) (Figure 1).
• The severity of treatment-emergent adverse events (TEAEs) was graded according to the National Cancer Institute Common Terminology Criteria for Adverse Events (version 4.03).
• The data cut-off was October 11, 2019.
Presented at American Society of Clinical Oncology (ASCO) 2020 Virtual Scientific Meeting, May 29–31, 2020.
Group 1 – Adult patients with metastatic (nodal and/or distant) CSCC Cemiplimab 3 mg/kg
Q2W IV, for up to 96 weeks
Cemiplimab 350 mgQ3W IV, for up to
54 weeks
Tumor response assessment by ICR (RECIST 1.1 for scans; modified WHO criteria for photos)
Tumor imaging every 8 weeks for the
assessment of efficacy
Tumor imaging every 9 weeks for the
assessment of efficacy
Group 3 – Adult patients with metastatic (nodal and/or distant) CSCC
Group 2 – laCSCC
Key inclusion criteria• ECOG performance status of 0 or 1• Adequate organ function• Groups 1 and 3:
At least one lesion measurable by RECIST 1.1 • Group 2
At least one lesion measurable by digital medical photographyCSCC lesion that is not amenable to curative surgery or curative radiation therapy per investigators’ assessmentTumor biopsies at baseline and on day 29, for exploratory biomarker analysis, unless considered to have unacceptable safety risks by the investigator
Key exclusion criteria• Ongoing or recent (within 5 years) autoimmune disease requiring systemic immunosuppression• Prior treatments with anti–PD-1 or anti–PD-L1 therapy• History of solid organ transplant, concurrent malignancies (unless indolent or not considered life-threatening; for example, basal cell carcinoma), or hematologic malignancies
Figure 1. Study design
ECOG, Eastern Cooperative Oncology Group; IV, intravenously; PD-L1, PD-ligand 1.
Phase 2 Study of Cemiplimab in Patients with Advanced Cutaneous Squamous Cell Carcinoma (CSCC): Longer Follow-Up
Danny Rischin,1 Nikhil I. Khushalani,2 Chrysalyne D. Schmults,3 Alexander Guminski,4 Anne Lynn S. Chang,5 Karl D. Lewis,6 Annette M. Lim,1 Leonel Hernandez-Aya,7 Brett G.M. Hughes,8 Dirk Schadendorf,9 Axel Hauschild,10
Elizabeth Stankevich,11 Jocelyn Booth,11 Suk-Young Yoo,11 Zhen Chen,12 Emmanuel Okoye,13 Israel Lowy,12 Matthew G. Fury,12 Michael R. Migden14
1Department of Medical Oncology, Peter MacCallum Cancer Centre, Melbourne, Australia; 2Department of Cutaneous Oncology, Moffitt Cancer Center, Tampa, FL, USA; 3Department of Dermatology, Brigham and Women’s Hospital, Harvard Medical School, Boston, MA, USA; 4Department of Medical Oncology, Royal North Shore Hospital, St Leonards, Australia; 5Department of Dermatology, Stanford University School of Medicine, Redwood City, CA, USA; 6University of Colorado Denver, School of Medicine, Aurora, CO, USA;
7Division of Medical Oncology, Department of Medicine, Washington University School of Medicine, St Louis, MO, USA; 8Royal Brisbane & Women’s Hospital and University of Queensland, Brisbane, Australia; 9University Hospital Essen, Essen and German Cancer Consortium, Essen, Germany; 10Schleswig-Holstein University Hospital, Kiel, Germany; 11Regeneron Pharmaceuticals, Inc., Basking Ridge, NJ, USA; 12Regeneron Pharmaceuticals, Inc., Tarrytown, NY, USA; 13Regeneron Pharmaceuticals, Inc., London, UK;
14Departments of Dermatology and Head and Neck Surgery, University of Texas MD Anderson Cancer Center, Houston, TX, USA
ResultsPatients• A total of 193 patients were enrolled (Group 1, n=59; Group 2, n=78;
Group 3, n=56) (Table 1).
Table 1. Baseline demographics
Advanced CSCC(n=193)
Median age, years (range) 72.0 (38–96)Male, n (%) 161 (83.4)ECOG performance status, n (%)
0 86 (44.6)1 107 (55.4)
Primary CSCC site: head and neck, n (%) 131 (67.9)mCSCC, n (%) 115 (59.6)laCSCC, n (%) 78 (40.4)Patients with cemiplimab as first-line therapy, n (%) 128 (66.3)Patients with prior systemic therapy, n (%)† 65 (33.7)Median duration of exposure to cemiplimab, weeks (range) 51.1 (2.0–109.3)Median number of doses of cemiplimab administered (range) 18.0 (1–48)†Settings for prior lines of therapy included metastatic disease, adjuvant, chemotherapy with concurrent radiation, or other and the mostcommon types of prior systemic therapy were platinum compounds (n=46/65 [70.8%]) and monoclonal antibodies (n=18/65 [27.7%]).
Table 2. Duration of follow-up and tumor response to cemiplimab per ICR
Group 1 (mCSCC)3 mg/kg Q2W (n=59)
Group 2 (laCSCC)3 mg/kg Q2W (n=78)
Group 3 (mCSCC)350 mg Q3W (n=56)
Total(n=193)
Median duration of follow-up, months (range) 18.5 (1.1–36.1) 15.5 (0.8–35.6) 17.3 (0.6–26.3) 15.7 (0.6–36.1)ORR, % (95% CI) 50.8 (37.5–64.1) 44.9 (33.6–56.6) 42.9 (29.7–56.8) 46.1 (38.9–53.4)
Complete response, n (%) 12 (20.3) 10 (12.8) 9 (16.1) 31 (16.1)Partial response, n (%) 18 (30.5) 25 (32.1) 15 (26.8) 58 (30.1)Stable disease, n (%) 9 (15.3) 27 (34.6) 10 (17.9) 46 (23.8)Non-complete response/non-progressive disease, n (%) 3 (5.1) 0 2 (3.6) 5 (2.6)Progressive disease, n (%) 10 (16.9) 10 (12.8) 14 (25.0) 34 (17.6)Not evaluable, n (%) 7 (11.9) 6 (7.7) 6 (10.7) 19 (9.8)
Disease control rate, % (95% CI) 71.2 (57.9–82.2) 79.5 (68.8–87.8) 64.3 (50.4–76.6) 72.5 (65.7–78.7)Durable disease control rate,† % (95% CI) 61.0 (47.4–73.5) 62.8 (51.1–73.5) 57.1 (43.2–70.3) 60.6 (53.3–67.6)Median observed time to response, months (IQR)‡ 1.9 (1.8–2.0) 2.1 (1.9–3.8) 2.1 (2.1–4.2) 2.1 (1.9–3.7)
Median observed time to complete response, months (IQR)‡ 11.1 (7.5–18.4) 10.5 (7.4–12.9) 12.4 (8.2–16.6) 11.2 (7.4–14.8)Median DOR, months (range)‡ NR (20.7, NE) NR (18.4, NE) NR (NE, NE) NR (28.8, NE)Kaplan–Meier 12-month estimate of patients with ongoing response, % (95% CI) 89.5 (70.9–96.5) 83.2 (64.1–92.7) 91.7 (70.6–97.8) 87.8 (78.5–93.3)Kaplan–Meier 24-month estimate of patients with ongoing response, % (95% CI) 68.8 (46.9–83.2) 62.5 (38.4–79.4) NE (NE, NE) 69.4 (55.6–79.6)†Defined as the proportion of patients without progressive disease for at least 105 days.‡Based on number of patients with confirmed complete or partial response.ORR per INV was 54.4% (95% CI: 47.1–61.6) for all patients; 50.8% (95% CI: 37.5–64.1) for Group 1, 56.4% (95% CI: 44.7–67.6) for Group 2, and 55.4% (95% CI: 41.5–68.7) for Group 3. ORR per INV was 57.8% (95% CI: 48.8–66.5) among treatment-naïve patients and 47.7% (95% CI: 35.1–60.5)among previously treated patients.CI, confidence interval; NE, not evaluable; NR, not reached.
Table 3. TEAEs regardless of attribution
Advanced CSCC (n=193)
n (%) Any grade Grade ≥3Any 192 (99.5) 94 (48.7)Led to discontinuation 19 (9.8) 14 (7.3)Most common†
Fatigue 67 (34.7) 5 (2.6)Diarrhea 53 (27.5) 2 (1.0)Nausea 46 (23.8) 0Pruritus 41 (21.2) 0Rash 32 (16.6) 1 (0.5)Cough 32 (16.6) 0Arthralgia 28 (14.5) 1 (0.5)Constipation 26 (13.5) 1 (0.5)Vomiting 24 (12.4) 1 (0.5)Actinic keratosis 23 (11.9) 0Maculopapular rash 23 (11.9) 1 (0.5)Anemia 22 (11.4) 8 (4.1)Hypothyroidism 22 (11.4) 0Headache 21 (10.9) 0Upper respiratory tract infection 20 (10.4) 0
†TEAEs reported in ≥10% of patients, ordered by frequency of any grade.
367
• ORR per ICR was 46.1% (95% CI: 38.9–53.4) among all patients; 50.8% (95% CI: 37.5–64.1) for Group 1, 44.9% (95% CI: 33.6–56.6) for Group 2, and 42.9% (95% CI: 29.7–56.8) for Group 3 (Table 2).
• Per ICR, ORR was 48.4% and 41.5% among those who had not received prior anticancer systemic therapy (n=128) and those who had received prior anticancer systemic therapy (n=65), respectively.
• Overall, the observed time to response was 2 months for 41 (46.1%)patients, 2–4 months for 29 (32.6%) patients, 4–6 months for eight (9.0%)patients, and >6 months for 11 (12.4%) patients.
• Median DOR has not been reached (observed DOR range: 1.9–34.3 months).In responding patients, the estimated proportion of patients with ongoingresponse at 24 months was 69.4% (95% CI: 55.6–79.6) (Figure 3).
Treatment-emergent adverse events
• In total, 192 (99.5%) patients experienced at least one TEAE of any grade regardless of attribution (Table 3).
• Overall, the most common TEAEs of any grade were fatigue (n=67, 34.7%), diarrhea (n=53, 27.5%), and nausea (n=46, 23.8%).
• Grade ≥3 TEAEs regardless of attribution occurred in 94 (48.7%) of patients. The most common Grade ≥3 TEAEs were hypertension (n=9; 4.7%) and anemia and cellulitis (each n=8; 4.1%).
Clinical activity
• Complete response rates at primary analysis, ~1 year follow-up for Groups1, 2, and 3, and ~2 year follow-up for Group 1 are shown in Figure 2.
• Among 89 responders, median time to complete response was 11.2 months (interquartile range [IQR], 7.4–14.8).
• Estimated median PFS was 18.4 months (95% CI: 10.3–24.3) for all patients. The Kaplan–Meier estimated progression-free probability at 24 months was 44.2% (95% CI: 36.1–52.1) (Figure 4A).
• Median OS has not been reached. The Kaplan–Meier estimated probabilityof OS at 24 months was 73.3% (95% CI: 66.1–79.2) (Figure 4B).
Figure 3. Kaplan–Meier curves of DOR per ICR
1.0
0.9
0.8
0.7
0.6
0.5
0.4
0.3
0.2
0.1
0.0
0 2 4 6 8 10 12 14 16 18 20 22 24 26 28 30 32 34 36 38 40
Pro
bab
ility
of
no
pro
gre
ssio
n o
r d
eath
MonthNumber of patients at risk
30 30 29 28 23 23 23 23 23 20 18 16 16 16 10 9 6 2 0 0 0Group 1 (n=59)35 33 32 30 27 25 22 21 17 14 10 8 6 6 5 4 0 0 0 0 0Group 2 (n=78)24 24 24 23 21 21 20 19 17 11 5 0 0 0 0 0 0 0 0 0 0Group 3 (n=56)
Total (n=193) 89 87 85 81 71 69 65 63 57 45 33 24 22 22 15 13 6 2 0 0 0
Group 1 (mCSCC) 3 mg/kg Q2W (n=59)Group 2 (laCSCC) 3 mg/kg Q2W (n=78)Group 3 (mCSCC) 350 mg Q3W (n=56)Total (n=193)Figure 2. Complete response rates per ICR
25
20
15
10
5
0
Co
mp
lete
res
po
nse
rate
s (%
)
Group 1 (mCSCC)3 mg/kg Q2W
Group 2 (laCSCC)†
3 mg/kg Q2WGroup 3 (mCSCC)
350 mg Q3W
n=1012.8
n=35.4
n=46.8
n=1016.9
n=1220.3
n=1012.8
n=916.1
Primary ~1-year follow-up ~2-year follow-up
Figure 4. Kaplan–Meier curves for A) PFS per ICR and B) OS
Group 1 (mCSCC) 3 mg/kg Q2W (n=59)Group 2 (laCSCC) 3 mg/kg Q2W (n=78)Group 3 (mCSCC) 350 mg Q3W (n=56)Total (n=193)
1.00.90.80.70.60.50.40.30.20.10.0
0 2 4 6 8 10 12 14 16 18 20 22 24 26 28 30 32 34 36 38 40
Pro
bab
ility
of
OS
MonthNumber of patients at risk
59 56 52 49 47 46 41 39 39 38 38 37 35 33 24 16 11 4 1 0Group 1 (n=59) 4778 76 73 67 65 64 62 59 54 44 41 33 25 22 15 12 8 3 1 0Group 2 (n=78) 6556 52 49 46 45 38 38 38 37 29 20 9 2 0 0 0 0 0 0 0Group 3 (n=56) 44
Total (n=193) 193 184 174 162 157 156 148 141 136 130 111 99 79 62 55 39 28 19 7 2 0
B
Group 1 (mCSCC) 3 mg/kg Q2W (n=59)Group 2 (laCSCC) 3 mg/kg Q2W (n=78)Group 3 (mCSCC) 350 mg Q3W (n=56)Total (n=193)
1.00.90.80.70.60.50.40.30.20.10.0
0 2 4 6 8 10 12 14 16 18 20 22 24 26 28 30 32 34 36 38 40
Pro
bab
ility
of
PFS
MonthNumber of patients at risk
59 42 38 36 32 27 27 27 27 27 24 24 21 20 20 12 9 6 1 0 0Group 1 (n=59)78 61 48 43 39 37 33 29 26 20 17 16 12 10 7 5 5 2 0 0 0Group 2 (n=78)56 48 33 31 31 28 26 26 24 24 17 10 1 1 0 0 0 0 0 0 0Group 3 (n=56)193 151 119 110 102 92 86 82 77 71 58 50 34 31 27 17 14 8 1 0 0Total (n=193)
A
• Grade ≥3 treatment-related adverse events (TRAEs) were reported in 33 (17.1%) patients, with the most common being pneumonitis (n=5, 2.6%), autoimmune hepatitis (n=3; 1.6%), anemia, colitis, and diarrhea (all n=2; 1.0%).
• No new TEAEs resulting in death were reported compared to previousreports.9–11
†Among 23 laCSCC patients who were included in the pre-specified Group 2 interim analysis, there were no complete responses.
See poster #382 reporting post hoc analysis of health-related quality of life in the same patient population presented in this poster. Also see poster #433 that provides the design and rationale of a Phase 3, randomized, double-blind study of adjuvant cemiplimab versus placebo post-surgery and radiation in patients with high-risk CSCC.
References1. Que SKT et al. J Am Acad Dermatol. 2018;78:237–247.2. Cranmer LD et al. Oncologist. 2010;15:1320–1328.3. National Comprehensive Cancer Network. NCCN Clinical
practice guidelines in oncology: squamous cell skin cancer (Version 2.2019). 2018. Available at: https://www.nccn.org/professionals/physician_gls/pdf/squamous.pdf. [Accessed March 20, 2020].
4. Karia PS et al. J Clin Oncol. 2014;32:327–334.5. Weinberg AS et al. Dermatol Surg. 2007;33:885–899.
6. Schmults CD et al. JAMA Dermatol. 2013;149:541–547.7. Cowey C et al. Cancer Med. 2020 [in press].8. Burova E et al. Mol Cancer Ther. 2017;16:861–870.9. Migden MR et al. Lancet Oncol. 2020;21:294–305.
10. Migden MR et al. N Engl J Med. 2018;379:341–351.11. Rischin D et al. Poster presented at Maui Dermatology
Conference, January 25–29, 2020. 12. Eisenhauer EA et al. Eur J Cancer. 2009;45:228–247.
AcknowledgmentsThe authors would like to thank the patients, their families, all other investigators, and all investigational site members involved in this study. The study was funded by Regeneron Pharmaceuticals, Inc., and Sanofi. Medical writing support and typesetting was provided by Kate Carolan, PhD, of Prime, Knutsford, UK, funded by Regeneron Pharmaceuticals, Inc.and Sanofi.For any questions or comments, please contact Dr Danny Rischin, [email protected]
Conclusions• For patients with advanced CSCC, cemiplimab achieved ORR of 46.1%.
• Patients had deepening responses over time as evidenced byincreasing complete response rates.9–11 Overall, the complete response rate is now 16.1% and median time to complete response was 11.2 months.
• DOR and OS are longer than what has been previously described with other agents.7
• With median DOR not reached after an additional 1 year of follow-up, this analysis indicates an increasing, clinically meaningful DOR with cemiplimab.
• The discontinuation rate, regardless of attribution, was low and most TRAEs were Grades 1–2.
Background• Cutaneous squamous cell carcinoma (CSCC) is the second most
common cancer in the US and its incidence is increasing.1
• Most cases of CSCC are cured by complete surgical excision.2,3 However, a small but substantial number of patients present with either metastatic CSCC (mCSCC) or locally advanced CSCC (laCSCC) not amenable to curative surgery or curative radiotherapy (collectively referred to as “advanced CSCC”), both of which have poor prognoses.4–6
• Historical data shows median overall survival (OS) of approximately 15 months with conventional chemotherapy or epidermal growth factor receptor inhibitors.7
• Cemiplimab is a high-affinity, highly potent human immunoglobulin G4 monoclonal antibody to the programmed cell death (PD)-1 receptor.8
• Cemiplimab monotherapy achieved clinically meaningful activity in patients with advanced CSCC and has a safety profile consistent with other anti–PD-1 inhibitors.9–11
• Based on initial data (median follow-up of 9.4 months in the pivotal study, NCT02760498), cemiplimab (cemiplimab-rwlc in the US) was approved for the treatment of patients with advanced CSCC.
Objective• The primary objective of the Phase 2 study was to evaluate the objective
response rate (ORR) by independent central review (ICR) per Response Evaluation Criteria In Solid Tumors version 1.1 (RECIST 1.1) (for scans)12 and modified World Health Organization (WHO) criteria (for photos).
• Key secondary objectives included ORR per investigator review (INV), duration of response (DOR) by ICR and INV, progression-free survival (PFS) by ICR and INV, OS, complete response rate by ICR, safety and tolerability, and assessment of health-related quality of life. Durable disease control rate, defined as the proportion of patients with response or stable disease for at least 105 days, was also examined.
- Please see poster #382 for results on health-related quality of life data from this study.
• Here, we present up to 3-year follow-up (median duration of follow-up for all patients: 15.7 months) from the largest and most mature prospective data set in advanced CSCC.
Methods• EMPOWER-CSCC-1 is an open-label, non-randomized, multicenter,
international Phase 2 study of patients with advanced CSCC.
• Patients received cemiplimab 3 mg/kg every 2 weeks (Q2W) (Group 1; mCSCC; Group 2, laCSCC) or cemiplimab 350 mg every 3 weeks (Q3W) (Group 3, mCSCC) (Figure 1).
• The severity of treatment-emergent adverse events (TEAEs) was graded according to the National Cancer Institute Common Terminology Criteria for Adverse Events (version 4.03).
• The data cut-off was October 11, 2019.
Presented at American Society of Clinical Oncology (ASCO) 2020 Virtual Scientific Meeting, May 29–31, 2020.
Group 1 – Adult patients with metastatic (nodal and/or distant) CSCC Cemiplimab 3 mg/kg
Q2W IV, for up to 96 weeks
Cemiplimab 350 mgQ3W IV, for up to
54 weeks
Tumor response assessment by ICR (RECIST 1.1 for scans; modified WHO criteria for photos)
Tumor imaging every 8 weeks for the
assessment of efficacy
Tumor imaging every 9 weeks for the
assessment of efficacy
Group 3 – Adult patients with metastatic (nodal and/or distant) CSCC
Group 2 – laCSCC
Key inclusion criteria• ECOG performance status of 0 or 1• Adequate organ function• Groups 1 and 3:
At least one lesion measurable by RECIST 1.1 • Group 2
At least one lesion measurable by digital medical photographyCSCC lesion that is not amenable to curative surgery or curative radiation therapy per investigators’ assessmentTumor biopsies at baseline and on day 29, for exploratory biomarker analysis, unless considered to have unacceptable safety risks by the investigator
Key exclusion criteria• Ongoing or recent (within 5 years) autoimmune disease requiring systemic immunosuppression• Prior treatments with anti–PD-1 or anti–PD-L1 therapy• History of solid organ transplant, concurrent malignancies (unless indolent or not considered life-threatening; for example, basal cell carcinoma), or hematologic malignancies
Figure 1. Study design
ECOG, Eastern Cooperative Oncology Group; IV, intravenously; PD-L1, PD-ligand 1.
Phase 2 Study of Cemiplimab in Patients with Advanced Cutaneous Squamous Cell Carcinoma (CSCC): Longer Follow-Up
Danny Rischin,1 Nikhil I. Khushalani,2 Chrysalyne D. Schmults,3 Alexander Guminski,4 Anne Lynn S. Chang,5 Karl D. Lewis,6 Annette M. Lim,1 Leonel Hernandez-Aya,7 Brett G.M. Hughes,8 Dirk Schadendorf,9 Axel Hauschild,10 Elizabeth Stankevich,11 Jocelyn Booth,11 Suk-Young Yoo,11 Zhen Chen,12 Emmanuel Okoye,13 Israel Lowy,12 Matthew G. Fury,12 Michael R. Migden14
1Department of Medical Oncology, Peter MacCallum Cancer Centre, Melbourne, Australia; 2Department of Cutaneous Oncology, Moffitt Cancer Center, Tampa, FL, USA; 3Department of Dermatology, Brigham and Women’s Hospital, Harvard Medical School, Boston, MA, USA; 4Department of Medical Oncology, Royal North Shore Hospital, St Leonards, Australia; 5Department of Dermatology, Stanford University School of Medicine, Redwood City, CA, USA; 6University of Colorado Denver, School of Medicine, Aurora, CO, USA;
7Division of Medical Oncology, Department of Medicine, Washington University School of Medicine, St Louis, MO, USA; 8Royal Brisbane & Women’s Hospital and University of Queensland, Brisbane, Australia; 9University Hospital Essen, Essen and German Cancer Consortium, Essen, Germany; 10Schleswig-Holstein University Hospital, Kiel, Germany; 11Regeneron Pharmaceuticals, Inc., Basking Ridge, NJ, USA; 12Regeneron Pharmaceuticals, Inc., Tarrytown, NY, USA; 13Regeneron Pharmaceuticals, Inc., London, UK;
14Departments of Dermatology and Head and Neck Surgery, University of Texas MD Anderson Cancer Center, Houston, TX, USA
ResultsPatients• A total of 193 patients were enrolled (Group 1, n=59; Group 2, n=78;
Group 3, n=56) (Table 1).
Table 1. Baseline demographics
Advanced CSCC(n=193)
Median age, years (range) 72.0 (38–96)Male, n (%) 161 (83.4)ECOG performance status, n (%)
0 86 (44.6)1 107 (55.4)
Primary CSCC site: head and neck, n (%) 131 (67.9)mCSCC, n (%) 115 (59.6)laCSCC, n (%) 78 (40.4)Patients with cemiplimab as first-line therapy, n (%) 128 (66.3)Patients with prior systemic therapy, n (%)† 65 (33.7)Median duration of exposure to cemiplimab, weeks (range) 51.1 (2.0–109.3)Median number of doses of cemiplimab administered (range) 18.0 (1–48)†Settings for prior lines of therapy included metastatic disease, adjuvant, chemotherapy with concurrent radiation, or other and the most common types of prior systemic therapy were platinum compounds (n=46/65 [70.8%]) and monoclonal antibodies (n=18/65 [27.7%]).
Table 2. Duration of follow-up and tumor response to cemiplimab per ICR
Group 1 (mCSCC)3 mg/kg Q2W (n=59)
Group 2 (laCSCC)3 mg/kg Q2W (n=78)
Group 3 (mCSCC)350 mg Q3W (n=56)
Total(n=193)
Median duration of follow-up, months (range) 18.5 (1.1–36.1) 15.5 (0.8–35.6) 17.3 (0.6–26.3) 15.7 (0.6–36.1)ORR, % (95% CI) 50.8 (37.5–64.1) 44.9 (33.6–56.6) 42.9 (29.7–56.8) 46.1 (38.9–53.4)
Complete response, n (%) 12 (20.3) 10 (12.8) 9 (16.1) 31 (16.1)Partial response, n (%) 18 (30.5) 25 (32.1) 15 (26.8) 58 (30.1)Stable disease, n (%) 9 (15.3) 27 (34.6) 10 (17.9) 46 (23.8)Non-complete response/non-progressive disease, n (%) 3 (5.1) 0 2 (3.6) 5 (2.6)Progressive disease, n (%) 10 (16.9) 10 (12.8) 14 (25.0) 34 (17.6)Not evaluable, n (%) 7 (11.9) 6 (7.7) 6 (10.7) 19 (9.8)
Disease control rate, % (95% CI) 71.2 (57.9–82.2) 79.5 (68.8–87.8) 64.3 (50.4–76.6) 72.5 (65.7–78.7)Durable disease control rate,† % (95% CI) 61.0 (47.4–73.5) 62.8 (51.1–73.5) 57.1 (43.2–70.3) 60.6 (53.3–67.6)Median observed time to response, months (IQR)‡ 1.9 (1.8–2.0) 2.1 (1.9–3.8) 2.1 (2.1–4.2) 2.1 (1.9–3.7)
Median observed time to complete response, months (IQR)‡ 11.1 (7.5–18.4) 10.5 (7.4–12.9) 12.4 (8.2–16.6) 11.2 (7.4–14.8)Median DOR, months (range)‡ NR (20.7, NE) NR (18.4, NE) NR (NE, NE) NR (28.8, NE)Kaplan–Meier 12-month estimate of patients with ongoing response, % (95% CI) 89.5 (70.9–96.5) 83.2 (64.1–92.7) 91.7 (70.6–97.8) 87.8 (78.5–93.3)Kaplan–Meier 24-month estimate of patients with ongoing response, % (95% CI) 68.8 (46.9–83.2) 62.5 (38.4–79.4) NE (NE, NE) 69.4 (55.6–79.6)†Defined as the proportion of patients without progressive disease for at least 105 days.
‡Based on number of patients with confirmed complete or partial response.ORR per INV was 54.4% (95% CI: 47.1–61.6) for all patients; 50.8% (95% CI: 37.5–64.1) for Group 1, 56.4% (95% CI: 44.7–67.6) for Group 2, and 55.4% (95% CI: 41.5–68.7) for Group 3. ORR per INV was 57.8% (95% CI: 48.8–66.5) among treatment-naïve patients and 47.7% (95% CI: 35.1–60.5) among previously treated patients.CI, confidence interval; NE, not evaluable; NR, not reached.
Table 3. TEAEs regardless of attribution
Advanced CSCC (n=193)
n (%) Any grade Grade ≥3Any 192 (99.5) 94 (48.7)Led to discontinuation 19 (9.8) 14 (7.3)Most common†
Fatigue 67 (34.7) 5 (2.6)Diarrhea 53 (27.5) 2 (1.0)Nausea 46 (23.8) 0Pruritus 41 (21.2) 0Rash 32 (16.6) 1 (0.5)Cough 32 (16.6) 0Arthralgia 28 (14.5) 1 (0.5)Constipation 26 (13.5) 1 (0.5)Vomiting 24 (12.4) 1 (0.5)Actinic keratosis 23 (11.9) 0Maculopapular rash 23 (11.9) 1 (0.5)Anemia 22 (11.4) 8 (4.1)Hypothyroidism 22 (11.4) 0Headache 21 (10.9) 0Upper respiratory tract infection 20 (10.4) 0
†TEAEs reported in ≥10% of patients, ordered by frequency of any grade.
367
• ORR per ICR was 46.1% (95% CI: 38.9–53.4) among all patients; 50.8% (95% CI: 37.5–64.1) for Group 1, 44.9% (95% CI: 33.6–56.6) for Group 2, and 42.9% (95% CI: 29.7–56.8) for Group 3 (Table 2).
• Per ICR, ORR was 48.4% and 41.5% among those who had not received prior anticancer systemic therapy (n=128) and those who had received prior anticancer systemic therapy (n=65), respectively.
• Overall, the observed time to response was 2 months for 41 (46.1%) patients, 2–4 months for 29 (32.6%) patients, 4–6 months for eight (9.0%) patients, and >6 months for 11 (12.4%) patients.
• Median DOR has not been reached (observed DOR range: 1.9–34.3 months). In responding patients, the estimated proportion of patients with ongoing response at 24 months was 69.4% (95% CI: 55.6–79.6) (Figure 3).
Treatment-emergent adverse events
• In total, 192 (99.5%) patients experienced at least one TEAE of any grade regardless of attribution (Table 3).
• Overall, the most common TEAEs of any grade were fatigue (n=67, 34.7%), diarrhea (n=53, 27.5%), and nausea (n=46, 23.8%).
• Grade ≥3 TEAEs regardless of attribution occurred in 94 (48.7%) of patients. The most common Grade ≥3 TEAEs were hypertension (n=9; 4.7%) and anemia and cellulitis (each n=8; 4.1%).
Clinical activity
• Complete response rates at primary analysis, ~1 year follow-up for Groups1, 2, and 3, and ~2 year follow-up for Group 1 are shown in Figure 2.
• Among 89 responders, median time to complete response was 11.2 months (interquartile range [IQR], 7.4–14.8).
• Estimated median PFS was 18.4 months (95% CI: 10.3–24.3) for all patients. The Kaplan–Meier estimated progression-free probability at 24 months was 44.2% (95% CI: 36.1–52.1) (Figure 4A).
• Median OS has not been reached. The Kaplan–Meier estimated probability of OS at 24 months was 73.3% (95% CI: 66.1–79.2) (Figure 4B).
Figure 3. Kaplan–Meier curves of DOR per ICR
1.0
0.9
0.8
0.7
0.6
0.5
0.4
0.3
0.2
0.1
0.0
0 2 4 6 8 10 12 14 16 18 20 22 24 26 28 30 32 34 36 38 40
Pro
bab
ility
of
no
pro
gre
ssio
n o
r d
eath
MonthNumber of patients at risk
30 30 29 28 23 23 23 23 23 20 18 16 16 16 10 9 6 2 0 0 0Group 1 (n=59)35 33 32 30 27 25 22 21 17 14 10 8 6 6 5 4 0 0 0 0 0Group 2 (n=78)24 24 24 23 21 21 20 19 17 11 5 0 0 0 0 0 0 0 0 0 0Group 3 (n=56)
Total (n=193) 89 87 85 81 71 69 65 63 57 45 33 24 22 22 15 13 6 2 0 0 0
Group 1 (mCSCC) 3 mg/kg Q2W (n=59)Group 2 (laCSCC) 3 mg/kg Q2W (n=78)Group 3 (mCSCC) 350 mg Q3W (n=56)Total (n=193)Figure 2. Complete response rates per ICR
25
20
15
10
5
0
Co
mp
lete
res
po
nse
rate
s (%
)
Group 1 (mCSCC)3 mg/kg Q2W
Group 2 (laCSCC)†
3 mg/kg Q2WGroup 3 (mCSCC)
350 mg Q3W
n=1012.8
n=35.4
n=46.8
n=1016.9
n=1220.3
n=1012.8
n=916.1
Primary ~1-year follow-up ~2-year follow-up
Figure 4. Kaplan–Meier curves for A) PFS per ICR and B) OS
Group 1 (mCSCC) 3 mg/kg Q2W (n=59)Group 2 (laCSCC) 3 mg/kg Q2W (n=78)Group 3 (mCSCC) 350 mg Q3W (n=56)Total (n=193)
1.00.90.80.70.60.50.40.30.20.10.0
0 2 4 6 8 10 12 14 16 18 20 22 24 26 28 30 32 34 36 38 40
Pro
bab
ility
of
OS
MonthNumber of patients at risk
59 56 52 49 47 46 41 39 39 38 38 37 35 33 24 16 11 4 1 0Group 1 (n=59) 4778 76 73 67 65 64 62 59 54 44 41 33 25 22 15 12 8 3 1 0Group 2 (n=78) 6556 52 49 46 45 38 38 38 37 29 20 9 2 0 0 0 0 0 0 0Group 3 (n=56) 44
Total (n=193) 193 184 174 162 157 156 148 141 136 130 111 99 79 62 55 39 28 19 7 2 0
B
Group 1 (mCSCC) 3 mg/kg Q2W (n=59)Group 2 (laCSCC) 3 mg/kg Q2W (n=78)Group 3 (mCSCC) 350 mg Q3W (n=56)Total (n=193)
1.00.90.80.70.60.50.40.30.20.10.0
0 2 4 6 8 10 12 14 16 18 20 22 24 26 28 30 32 34 36 38 40
Pro
bab
ility
of
PFS
MonthNumber of patients at risk
59 42 38 36 32 27 27 27 27 27 24 24 21 20 20 12 9 6 1 0 0Group 1 (n=59)78 61 48 43 39 37 33 29 26 20 17 16 12 10 7 5 5 2 0 0 0Group 2 (n=78)56 48 33 31 31 28 26 26 24 24 17 10 1 1 0 0 0 0 0 0 0Group 3 (n=56)193 151 119 110 102 92 86 82 77 71 58 50 34 31 27 17 14 8 1 0 0Total (n=193)
A
• Grade ≥3 treatment-related adverse events (TRAEs) were reported in 33 (17.1%) patients, with the most common being pneumonitis (n=5, 2.6%), autoimmune hepatitis (n=3; 1.6%), anemia, colitis, and diarrhea (all n=2; 1.0%).
• No new TEAEs resulting in death were reported compared to previous reports.9–11
†Among 23 laCSCC patients who were included in the pre-specified Group 2 interim analysis, there were no complete responses.
See poster #382 reporting post hoc analysis of health-related quality of life in the same patient population presented in this poster. Also see poster #433 that provides the design and rationale of a Phase 3, randomized, double-blind study of adjuvant cemiplimab versus placebo post-surgery and radiation in patients with high-risk CSCC.
References1. Que SKT et al. J Am Acad Dermatol. 2018;78:237–247.2. Cranmer LD et al. Oncologist. 2010;15:1320–1328.3. National Comprehensive Cancer Network. NCCN Clinical
practice guidelines in oncology: squamous cell skin cancer (Version 2.2019). 2018. Available at: https://www.nccn.org/professionals/physician_gls/pdf/squamous.pdf. [Accessed March 20, 2020].
4. Karia PS et al. J Clin Oncol. 2014;32:327–334.5. Weinberg AS et al. Dermatol Surg. 2007;33:885–899.
6. Schmults CD et al. JAMA Dermatol. 2013;149:541–547.7. Cowey C et al. Cancer Med. 2020 [in press].8. Burova E et al. Mol Cancer Ther. 2017;16:861–870.9. Migden MR et al. Lancet Oncol. 2020;21:294–305.
10. Migden MR et al. N Engl J Med. 2018;379:341–351.11. Rischin D et al. Poster presented at Maui Dermatology
Conference, January 25–29, 2020. 12. Eisenhauer EA et al. Eur J Cancer. 2009;45:228–247.
AcknowledgmentsThe authors would like to thank the patients, their families, all other investigators, and all investigational site members involved in this study. The study was funded by Regeneron Pharmaceuticals, Inc., and Sanofi. Medical writing support and typesetting was provided by Kate Carolan, PhD, of Prime, Knutsford, UK, funded by Regeneron Pharmaceuticals, Inc.and Sanofi.For any questions or comments, please contact Dr Danny Rischin, [email protected]
Conclusions• For patients with advanced CSCC, cemiplimab achieved ORR of 46.1%.
• Patients had deepening responses over time as evidenced by increasing complete response rates.9–11 Overall, the complete response rate is now 16.1% and median time to complete response was 11.2 months.
• DOR and OS are longer than what has been previously described with other agents.7
• With median DOR not reached after an additional 1 year of follow-up,this analysis indicates an increasing, clinically meaningful DOR with cemiplimab.
• The discontinuation rate, regardless of attribution, was low and most TRAEs were Grades 1–2.
Background• Cutaneous squamous cell carcinoma (CSCC) is the second most
common cancer in the US and its incidence is increasing.1
• Most cases of CSCC are cured by complete surgical excision.2,3 However, a small but substantial number of patients present with either metastatic CSCC (mCSCC) or locally advanced CSCC (laCSCC) not amenable to curative surgery or curative radiotherapy (collectivelyreferred to as “advanced CSCC”), both of which have poor prognoses.4–6
• Historical data shows median overall survival (OS) of approximately 15 months with conventional chemotherapy or epidermal growth factor receptor inhibitors.7
• Cemiplimab is a high-affinity, highly potent human immunoglobulin G4 monoclonal antibody to the programmed cell death (PD)-1 receptor.8
• Cemiplimab monotherapy achieved clinically meaningful activity in patients with advanced CSCC and has a safety profile consistent with other anti–PD-1 inhibitors.9–11
• Based on initial data (median follow-up of 9.4 months in the pivotal study, NCT02760498), cemiplimab (cemiplimab-rwlc in the US) was approved for the treatment of patients with advanced CSCC.
Objective• The primary objective of the Phase 2 study was to evaluate the objective
response rate (ORR) by independent central review (ICR) per Response Evaluation Criteria In Solid Tumors version 1.1 (RECIST 1.1) (for scans)12 and modified World Health Organization (WHO) criteria (for photos).
• Key secondary objectives included ORR per investigator review (INV), duration of response (DOR) by ICR and INV, progression-free survival (PFS) by ICR and INV, OS, complete response rate by ICR, safety and tolerability, and assessment of health-related quality of life. Durable disease control rate, defined as the proportion of patients with response or stable disease for at least 105 days, was also examined.
- Please see poster #382 for results on health-related quality of life data from this study.
• Here, we present up to 3-year follow-up (median duration of follow-up for all patients: 15.7 months) from the largest and most mature prospective data set in advanced CSCC.
Methods• EMPOWER-CSCC-1 is an open-label, non-randomized, multicenter,
international Phase 2 study of patients with advanced CSCC.
• Patients received cemiplimab 3 mg/kg every 2 weeks (Q2W) (Group 1;mCSCC; Group 2, laCSCC) or cemiplimab 350 mg every 3 weeks (Q3W) (Group 3, mCSCC) (Figure 1).
• The severity of treatment-emergent adverse events (TEAEs) was graded according to the National Cancer Institute Common Terminology Criteria for Adverse Events (version 4.03).
• The data cut-off was October 11, 2019.
Presented at American Society of Clinical Oncology (ASCO) 2020 Virtual Scientific Meeting, May 29–31, 2020.
Group 1 – Adult patients with metastatic (nodal and/or distant) CSCC Cemiplimab 3 mg/kg
Q2W IV, for up to 96 weeks
Cemiplimab 350 mgQ3W IV, for up to
54 weeks
Tumor response assessment by ICR (RECIST 1.1 for scans; modified WHO criteria for photos)
Tumor imaging every 8 weeks for the
assessment of efficacy
Tumor imaging every 9 weeks for the
assessment of efficacy
Group 3 – Adult patients with metastatic (nodal and/or distant) CSCC
Group 2 – laCSCC
Key inclusion criteria• ECOG performance status of 0 or 1• Adequate organ function• Groups 1 and 3:
At least one lesion measurable by RECIST 1.1 • Group 2
At least one lesion measurable by digital medical photographyCSCC lesion that is not amenable to curative surgery or curative radiation therapy per investigators’ assessmentTumor biopsies at baseline and on day 29, for exploratory biomarker analysis, unless considered to have unacceptable safety risks by the investigator
Key exclusion criteria• Ongoing or recent (within 5 years) autoimmune disease requiring systemic immunosuppression• Prior treatments with anti–PD-1 or anti–PD-L1 therapy• History of solid organ transplant, concurrent malignancies (unless indolent or not considered life-threatening; for example, basal cell carcinoma), or hematologic malignancies
Figure 1. Study design
ECOG, Eastern Cooperative Oncology Group; IV, intravenously; PD-L1, PD-ligand 1.
Phase 2 Study of Cemiplimab in Patients with Advanced Cutaneous Squamous Cell Carcinoma (CSCC): Longer Follow-Up
Danny Rischin,1 Nikhil I. Khushalani,2 Chrysalyne D. Schmults,3 Alexander Guminski,4 Anne Lynn S. Chang,5 Karl D. Lewis,6 Annette M. Lim,1 Leonel Hernandez-Aya,7 Brett G.M. Hughes,8 Dirk Schadendorf,9 Axel Hauschild,10
Elizabeth Stankevich,11 Jocelyn Booth,11 Suk-Young Yoo,11 Zhen Chen,12 Emmanuel Okoye,13 Israel Lowy,12 Matthew G. Fury,12 Michael R. Migden14
1Department of Medical Oncology, Peter MacCallum Cancer Centre, Melbourne, Australia; 2Department of Cutaneous Oncology, Moffitt Cancer Center, Tampa, FL, USA; 3Department of Dermatology, Brigham and Women’s Hospital, Harvard Medical School, Boston, MA, USA; 4Department of Medical Oncology, Royal North Shore Hospital, St Leonards, Australia; 5Department of Dermatology, Stanford University School of Medicine, Redwood City, CA, USA; 6University of Colorado Denver, School of Medicine, Aurora, CO, USA;
7Division of Medical Oncology, Department of Medicine, Washington University School of Medicine, St Louis, MO, USA; 8Royal Brisbane & Women’s Hospital and University of Queensland, Brisbane, Australia; 9University Hospital Essen, Essen and German Cancer Consortium, Essen, Germany; 10Schleswig-Holstein University Hospital, Kiel, Germany; 11Regeneron Pharmaceuticals, Inc., Basking Ridge, NJ, USA; 12Regeneron Pharmaceuticals, Inc., Tarrytown, NY, USA; 13Regeneron Pharmaceuticals, Inc., London, UK;
14Departments of Dermatology and Head and Neck Surgery, University of Texas MD Anderson Cancer Center, Houston, TX, USA
ResultsPatients• A total of 193 patients were enrolled (Group 1, n=59; Group 2, n=78;
Group 3, n=56) (Table 1).
Table 1. Baseline demographics
Advanced CSCC(n=193)
Median age, years (range) 72.0 (38–96)Male, n (%) 161 (83.4)ECOG performance status, n (%)
0 86 (44.6)1 107 (55.4)
Primary CSCC site: head and neck, n (%) 131 (67.9)mCSCC, n (%) 115 (59.6)laCSCC, n (%) 78 (40.4)Patients with cemiplimab as first-line therapy, n (%) 128 (66.3)Patients with prior systemic therapy, n (%)† 65 (33.7)Median duration of exposure to cemiplimab, weeks (range) 51.1 (2.0–109.3)Median number of doses of cemiplimab administered (range) 18.0 (1–48)†Settings for prior lines of therapy included metastatic disease, adjuvant, chemotherapy with concurrent radiation, or other and the most common types of prior systemic therapy were platinum compounds (n=46/65 [70.8%]) and monoclonal antibodies (n=18/65 [27.7%]).
Table 2. Duration of follow-up and tumor response to cemiplimab per ICR
Group 1 (mCSCC)3 mg/kg Q2W (n=59)
Group 2 (laCSCC)3 mg/kg Q2W (n=78)
Group 3 (mCSCC)350 mg Q3W (n=56)
Total(n=193)
Median duration of follow-up, months (range) 18.5 (1.1–36.1) 15.5 (0.8–35.6) 17.3 (0.6–26.3) 15.7 (0.6–36.1)ORR, % (95% CI) 50.8 (37.5–64.1) 44.9 (33.6–56.6) 42.9 (29.7–56.8) 46.1 (38.9–53.4)
Complete response, n (%) 12 (20.3) 10 (12.8) 9 (16.1) 31 (16.1)Partial response, n (%) 18 (30.5) 25 (32.1) 15 (26.8) 58 (30.1)Stable disease, n (%) 9 (15.3) 27 (34.6) 10 (17.9) 46 (23.8)Non-complete response/non-progressive disease, n (%) 3 (5.1) 0 2 (3.6) 5 (2.6)Progressive disease, n (%) 10 (16.9) 10 (12.8) 14 (25.0) 34 (17.6)Not evaluable, n (%) 7 (11.9) 6 (7.7) 6 (10.7) 19 (9.8)
Disease control rate, % (95% CI) 71.2 (57.9–82.2) 79.5 (68.8–87.8) 64.3 (50.4–76.6) 72.5 (65.7–78.7)Durable disease control rate,† % (95% CI) 61.0 (47.4–73.5) 62.8 (51.1–73.5) 57.1 (43.2–70.3) 60.6 (53.3–67.6)Median observed time to response, months (IQR)‡ 1.9 (1.8–2.0) 2.1 (1.9–3.8) 2.1 (2.1–4.2) 2.1 (1.9–3.7)
Median observed time to complete response, months (IQR)‡ 11.1 (7.5–18.4) 10.5 (7.4–12.9) 12.4 (8.2–16.6) 11.2 (7.4–14.8)Median DOR, months (range)‡ NR (20.7, NE) NR (18.4, NE) NR (NE, NE) NR (28.8, NE)Kaplan–Meier 12-month estimate of patients with ongoing response, % (95% CI) 89.5 (70.9–96.5) 83.2 (64.1–92.7) 91.7 (70.6–97.8) 87.8 (78.5–93.3)Kaplan–Meier 24-month estimate of patients with ongoing response, % (95% CI) 68.8 (46.9–83.2) 62.5 (38.4–79.4) NE (NE, NE) 69.4 (55.6–79.6)†Defined as the proportion of patients without progressive disease for at least 105 days.‡Based on number of patients with confirmed complete or partial response.
ORR per INV was 54.4% (95% CI: 47.1–61.6) for all patients; 50.8% (95% CI: 37.5–64.1) for Group 1, 56.4% (95% CI: 44.7–67.6) for Group 2, and 55.4% (95% CI: 41.5–68.7) for Group 3. ORR per INV was 57.8% (95% CI: 48.8–66.5) among treatment-naïve patients and 47.7% (95% CI: 35.1–60.5)among previously treated patients.CI, confidence interval; NE, not evaluable; NR, not reached.
Table 3. TEAEs regardless of attribution
Advanced CSCC (n=193)
n (%) Any grade Grade ≥3Any 192 (99.5) 94 (48.7)Led to discontinuation 19 (9.8) 14 (7.3)Most common†
Fatigue 67 (34.7) 5 (2.6)Diarrhea 53 (27.5) 2 (1.0)Nausea 46 (23.8) 0Pruritus 41 (21.2) 0Rash 32 (16.6) 1 (0.5)Cough 32 (16.6) 0Arthralgia 28 (14.5) 1 (0.5)Constipation 26 (13.5) 1 (0.5)Vomiting 24 (12.4) 1 (0.5)Actinic keratosis 23 (11.9) 0Maculopapular rash 23 (11.9) 1 (0.5)Anemia 22 (11.4) 8 (4.1)Hypothyroidism 22 (11.4) 0Headache 21 (10.9) 0Upper respiratory tract infection 20 (10.4) 0
†TEAEs reported in ≥10% of patients, ordered by frequency of any grade.
367
• ORR per ICR was 46.1% (95% CI: 38.9–53.4) among all patients; 50.8% (95% CI: 37.5–64.1) for Group 1, 44.9% (95% CI: 33.6–56.6) for Group 2, and 42.9% (95% CI: 29.7–56.8) for Group 3 (Table 2).
• Per ICR, ORR was 48.4% and 41.5% among those who had not received prior anticancer systemic therapy (n=128) and those who had received prior anticancer systemic therapy (n=65), respectively.
• Overall, the observed time to response was 2 months for 41 (46.1%) patients, 2–4 months for 29 (32.6%) patients, 4–6 months for eight (9.0%) patients, and >6 months for 11 (12.4%) patients.
• Median DOR has not been reached (observed DOR range: 1.9–34.3 months).In responding patients, the estimated proportion of patients with ongoing response at 24 months was 69.4% (95% CI: 55.6–79.6) (Figure 3).
Treatment-emergent adverse events
• In total, 192 (99.5%) patients experienced at least one TEAE of any grade regardless of attribution (Table 3).
• Overall, the most common TEAEs of any grade were fatigue (n=67, 34.7%), diarrhea (n=53, 27.5%), and nausea (n=46, 23.8%).
• Grade ≥3 TEAEs regardless of attribution occurred in 94 (48.7%) of patients. The most common Grade ≥3 TEAEs were hypertension (n=9; 4.7%) and anemia and cellulitis (each n=8; 4.1%).
Clinical activity
• Complete response rates at primary analysis, ~1 year follow-up for Groups 1, 2, and 3, and ~2 year follow-up for Group 1 are shown in Figure 2.
• Among 89 responders, median time to complete response was 11.2 months (interquartile range [IQR], 7.4–14.8).
• Estimated median PFS was 18.4 months (95% CI: 10.3–24.3) for all patients. The Kaplan–Meier estimated progression-free probability at 24 months was 44.2% (95% CI: 36.1–52.1) (Figure 4A).
• Median OS has not been reached. The Kaplan–Meier estimated probability of OS at 24 months was 73.3% (95% CI: 66.1–79.2) (Figure 4B).
Figure 3. Kaplan–Meier curves of DOR per ICR
1.0
0.9
0.8
0.7
0.6
0.5
0.4
0.3
0.2
0.1
0.0
0 2 4 6 8 10 12 14 16 18 20 22 24 26 28 30 32 34 36 38 40
Pro
bab
ility
of
no
pro
gre
ssio
n o
r d
eath
MonthNumber of patients at risk
30 30 29 28 23 23 23 23 23 20 18 16 16 16 10 9 6 2 0 0 0Group 1 (n=59)35 33 32 30 27 25 22 21 17 14 10 8 6 6 5 4 0 0 0 0 0Group 2 (n=78)24 24 24 23 21 21 20 19 17 11 5 0 0 0 0 0 0 0 0 0 0Group 3 (n=56)
Total (n=193) 89 87 85 81 71 69 65 63 57 45 33 24 22 22 15 13 6 2 0 0 0
Group 1 (mCSCC) 3 mg/kg Q2W (n=59)Group 2 (laCSCC) 3 mg/kg Q2W (n=78)Group 3 (mCSCC) 350 mg Q3W (n=56)Total (n=193)Figure 2. Complete response rates per ICR
25
20
15
10
5
0
Co
mp
lete
res
po
nse
rate
s (%
)
Group 1 (mCSCC)3 mg/kg Q2W
Group 2 (laCSCC)†
3 mg/kg Q2WGroup 3 (mCSCC)
350 mg Q3W
n=1012.8
n=35.4
n=46.8
n=1016.9
n=1220.3
n=1012.8
n=916.1
Primary ~1-year follow-up ~2-year follow-up
Figure 4. Kaplan–Meier curves for A) PFS per ICR and B) OS
Group 1 (mCSCC) 3 mg/kg Q2W (n=59)Group 2 (laCSCC) 3 mg/kg Q2W (n=78)Group 3 (mCSCC) 350 mg Q3W (n=56)Total (n=193)
1.00.90.80.70.60.50.40.30.20.10.0
0 2 4 6 8 10 12 14 16 18 20 22 24 26 28 30 32 34 36 38 40
Pro
bab
ility
of
OS
MonthNumber of patients at risk
59 56 52 49 47 46 41 39 39 38 38 37 35 33 24 16 11 4 1 0Group 1 (n=59) 4778 76 73 67 65 64 62 59 54 44 41 33 25 22 15 12 8 3 1 0Group 2 (n=78) 6556 52 49 46 45 38 38 38 37 29 20 9 2 0 0 0 0 0 0 0Group 3 (n=56) 44
Total (n=193) 193 184 174 162 157 156 148 141 136 130 111 99 79 62 55 39 28 19 7 2 0
B
Group 1 (mCSCC) 3 mg/kg Q2W (n=59)Group 2 (laCSCC) 3 mg/kg Q2W (n=78)Group 3 (mCSCC) 350 mg Q3W (n=56)Total (n=193)
1.00.90.80.70.60.50.40.30.20.10.0
0 2 4 6 8 10 12 14 16 18 20 22 24 26 28 30 32 34 36 38 40
Pro
bab
ility
of
PFS
MonthNumber of patients at risk
59 42 38 36 32 27 27 27 27 27 24 24 21 20 20 12 9 6 1 0 0Group 1 (n=59)78 61 48 43 39 37 33 29 26 20 17 16 12 10 7 5 5 2 0 0 0Group 2 (n=78)56 48 33 31 31 28 26 26 24 24 17 10 1 1 0 0 0 0 0 0 0Group 3 (n=56)193 151 119 110 102 92 86 82 77 71 58 50 34 31 27 17 14 8 1 0 0Total (n=193)
A
• Grade ≥3 treatment-related adverse events (TRAEs) were reported in 33 (17.1%) patients, with the most common being pneumonitis (n=5, 2.6%), autoimmune hepatitis (n=3; 1.6%), anemia, colitis, and diarrhea (all n=2; 1.0%).
• No new TEAEs resulting in death were reported compared to previousreports.9–11
†Among 23 laCSCC patients who were included in the pre-specified Group 2 interim analysis, there were no complete responses.
See poster #382 reporting post hoc analysis of health-related quality of life in the same patient population presented in this poster. Also see poster #433 that provides the design and rationale of a Phase 3, randomized, double-blind study of adjuvant cemiplimab versus placebo post-surgery and radiation in patients with high-risk CSCC.
References1. Que SKT et al. J Am Acad Dermatol. 2018;78:237–247.2. Cranmer LD et al. Oncologist. 2010;15:1320–1328.3. National Comprehensive Cancer Network. NCCN Clinical
practice guidelines in oncology: squamous cell skin cancer (Version 2.2019). 2018. Available at: https://www.nccn.org/professionals/physician_gls/pdf/squamous.pdf. [AccessedMarch 20, 2020].
4. Karia PS et al. J Clin Oncol. 2014;32:327–334.5. Weinberg AS et al. Dermatol Surg. 2007;33:885–899.
6. Schmults CD et al. JAMA Dermatol. 2013;149:541–547.7. Cowey C et al. Cancer Med. 2020 [in press].8. Burova E et al. Mol Cancer Ther. 2017;16:861–870.9. Migden MR et al. Lancet Oncol. 2020;21:294–305.
10. Migden MR et al. N Engl J Med. 2018;379:341–351.11. Rischin D et al. Poster presented at Maui Dermatology
Conference, January 25–29, 2020. 12. Eisenhauer EA et al. Eur J Cancer. 2009;45:228–247.
AcknowledgmentsThe authors would like to thank the patients, their families, all other investigators, and all investigational site members involved in this study. The study was funded by Regeneron Pharmaceuticals, Inc., and Sanofi. Medical writing support and typesetting was provided by KateCarolan, PhD, of Prime, Knutsford, UK, funded by Regeneron Pharmaceuticals, Inc.and Sanofi.For any questions or comments, please contact Dr Danny Rischin, [email protected]
Conclusions• For patients with advanced CSCC, cemiplimab achieved ORR of 46.1%.
• Patients had deepening responses over time as evidenced byincreasing complete response rates.9–11 Overall, the complete response rate is now 16.1% and median time to complete response was 11.2 months.
• DOR and OS are longer than what has been previously described with other agents.7
• With median DOR not reached after an additional 1 year of follow-up,this analysis indicates an increasing, clinically meaningful DORwith cemiplimab.
• The discontinuation rate, regardless of attribution, was low and most TRAEs were Grades 1–2.
Background• Cutaneous squamous cell carcinoma (CSCC) is the second most
common cancer in the US and its incidence is increasing.1
• Most cases of CSCC are cured by complete surgical excision.2,3
However, a small but substantial number of patients present with either metastatic CSCC (mCSCC) or locally advanced CSCC (laCSCC) notamenable to curative surgery or curative radiotherapy (collectivelyreferred to as “advanced CSCC”), both of which have poor prognoses.4–6
• Historical data shows median overall survival (OS) of approximately 15 months with conventional chemotherapy or epidermal growth factor receptor inhibitors.7
• Cemiplimab is a high-affinity, highly potent human immunoglobulin G4 monoclonal antibody to the programmed cell death (PD)-1 receptor.8
• Cemiplimab monotherapy achieved clinically meaningful activity in patients with advanced CSCC and has a safety profile consistent with other anti–PD-1 inhibitors.9–11
• Based on initial data (median follow-up of 9.4 months in the pivotal study, NCT02760498), cemiplimab (cemiplimab-rwlc in the US) was approved for the treatment of patients with advanced CSCC.
Objective• The primary objective of the Phase 2 study was to evaluate the objective
response rate (ORR) by independent central review (ICR) per Response Evaluation Criteria In Solid Tumors version 1.1 (RECIST 1.1) (for scans)12
and modified World Health Organization (WHO) criteria (for photos).
• Key secondary objectives included ORR per investigator review (INV), duration of response (DOR) by ICR and INV, progression-free survival (PFS) by ICR and INV, OS, complete response rate by ICR, safety and tolerability, and assessment of health-related quality of life. Durable disease control rate, defined as the proportion of patients with response or stable disease for at least 105 days, was also examined.
- Please see poster #382 for results on health-related quality of life data from this study.
• Here, we present up to 3-year follow-up (median duration of follow-up for all patients: 15.7 months) from the largest and most mature prospective data set in advanced CSCC.
Methods• EMPOWER-CSCC-1 is an open-label, non-randomized, multicenter,
international Phase 2 study of patients with advanced CSCC.
• Patients received cemiplimab 3 mg/kg every 2 weeks (Q2W) (Group 1; mCSCC; Group 2, laCSCC) or cemiplimab 350 mg every 3 weeks (Q3W) (Group 3, mCSCC) (Figure 1).
• The severity of treatment-emergent adverse events (TEAEs) was graded according to the National Cancer Institute Common Terminology Criteria for Adverse Events (version 4.03).
• The data cut-off was October 11, 2019.
Presented at American Society of Clinical Oncology (ASCO) 2020 Virtual Scientific Meeting, May 29–31, 2020.
Group 1 – Adult patients with metastatic (nodal and/or distant) CSCC Cemiplimab 3 mg/kg
Q2W IV, for up to 96 weeks
Cemiplimab 350 mgQ3W IV, for up to
54 weeks
Tumor response assessment by ICR (RECIST 1.1 for scans; modified WHO criteria for photos)
Tumor imaging every 8 weeks for the
assessment of efficacy
Tumor imaging every 9 weeks for the
assessment of efficacy
Group 3 – Adult patients with metastatic (nodal and/or distant) CSCC
Group 2 – laCSCC
Key inclusion criteria• ECOG performance status of 0 or 1• Adequate organ function• Groups 1 and 3:
At least one lesion measurable by RECIST 1.1 • Group 2
At least one lesion measurable by digital medical photographyCSCC lesion that is not amenable to curative surgery or curative radiation therapy per investigators’ assessmentTumor biopsies at baseline and on day 29, for exploratory biomarker analysis, unless considered to have unacceptable safety risks by the investigator
Key exclusion criteria• Ongoing or recent (within 5 years) autoimmune disease requiring systemic immunosuppression• Prior treatments with anti–PD-1 or anti–PD-L1 therapy• History of solid organ transplant, concurrent malignancies (unless indolent or not considered life-threatening; for example, basal cell carcinoma), or hematologic malignancies
Figure 1. Study design
ECOG, Eastern Cooperative Oncology Group; IV, intravenously; PD-L1, PD-ligand 1.
Phase 2 Study of Cemiplimab in Patients with Advanced Cutaneous Squamous Cell Carcinoma (CSCC): Longer Follow-Up
Danny Rischin,1 Nikhil I. Khushalani,2 Chrysalyne D. Schmults,3 Alexander Guminski,4 Anne Lynn S. Chang,5 Karl D. Lewis,6 Annette M. Lim,1 Leonel Hernandez-Aya,7 Brett G.M. Hughes,8 Dirk Schadendorf,9 Axel Hauschild,10
Elizabeth Stankevich,11 Jocelyn Booth,11 Suk-Young Yoo,11 Zhen Chen,12 Emmanuel Okoye,13 Israel Lowy,12 Matthew G. Fury,12 Michael R. Migden14
1Department of Medical Oncology, Peter MacCallum Cancer Centre, Melbourne, Australia; 2Department of Cutaneous Oncology, Moffitt Cancer Center, Tampa, FL, USA; 3Department of Dermatology, Brigham and Women’s Hospital, Harvard Medical School, Boston, MA, USA; 4Department of Medical Oncology, Royal North Shore Hospital, St Leonards, Australia; 5Department of Dermatology, Stanford University School of Medicine, Redwood City, CA, USA; 6University of Colorado Denver, School of Medicine, Aurora, CO, USA;
7Division of Medical Oncology, Department of Medicine, Washington University School of Medicine, St Louis, MO, USA; 8Royal Brisbane & Women’s Hospital and University of Queensland, Brisbane, Australia; 9University Hospital Essen, Essen and German Cancer Consortium, Essen, Germany; 10Schleswig-Holstein University Hospital, Kiel, Germany; 11Regeneron Pharmaceuticals, Inc., Basking Ridge, NJ, USA; 12Regeneron Pharmaceuticals, Inc., Tarrytown, NY, USA; 13Regeneron Pharmaceuticals, Inc., London, UK;
14Departments of Dermatology and Head and Neck Surgery, University of Texas MD Anderson Cancer Center, Houston, TX, USA
ResultsPatients• A total of 193 patients were enrolled (Group 1, n=59; Group 2, n=78;
Group 3, n=56) (Table 1).
Table 1. Baseline demographics
Advanced CSCC(n=193)
Median age, years (range) 72.0 (38–96)Male, n (%) 161 (83.4)ECOG performance status, n (%)
0 86 (44.6)1 107 (55.4)
Primary CSCC site: head and neck, n (%) 131 (67.9)mCSCC, n (%) 115 (59.6)laCSCC, n (%) 78 (40.4)Patients with cemiplimab as first-line therapy, n (%) 128 (66.3)Patients with prior systemic therapy, n (%)† 65 (33.7)Median duration of exposure to cemiplimab, weeks (range) 51.1 (2.0–109.3)Median number of doses of cemiplimab administered (range) 18.0 (1–48)†Settings for prior lines of therapy included metastatic disease, adjuvant, chemotherapy with concurrent radiation, or other and the most common types of prior systemic therapy were platinum compounds (n=46/65 [70.8%]) and monoclonal antibodies (n=18/65 [27.7%]).
Table 2. Duration of follow-up and tumor response to cemiplimab per ICR
Group 1 (mCSCC)3 mg/kg Q2W (n=59)
Group 2 (laCSCC)3 mg/kg Q2W (n=78)
Group 3 (mCSCC)350 mg Q3W (n=56)
Total(n=193)
Median duration of follow-up, months (range) 18.5 (1.1–36.1) 15.5 (0.8–35.6) 17.3 (0.6–26.3) 15.7 (0.6–36.1)ORR, % (95% CI) 50.8 (37.5–64.1) 44.9 (33.6–56.6) 42.9 (29.7–56.8) 46.1 (38.9–53.4)
Complete response, n (%) 12 (20.3) 10 (12.8) 9 (16.1) 31 (16.1)Partial response, n (%) 18 (30.5) 25 (32.1) 15 (26.8) 58 (30.1)Stable disease, n (%) 9 (15.3) 27 (34.6) 10 (17.9) 46 (23.8)Non-complete response/non-progressive disease, n (%) 3 (5.1) 0 2 (3.6) 5 (2.6)Progressive disease, n (%) 10 (16.9) 10 (12.8) 14 (25.0) 34 (17.6)Not evaluable, n (%) 7 (11.9) 6 (7.7) 6 (10.7) 19 (9.8)
Disease control rate, % (95% CI) 71.2 (57.9–82.2) 79.5 (68.8–87.8) 64.3 (50.4–76.6) 72.5 (65.7–78.7)Durable disease control rate,† % (95% CI) 61.0 (47.4–73.5) 62.8 (51.1–73.5) 57.1 (43.2–70.3) 60.6 (53.3–67.6)Median observed time to response, months (IQR)‡ 1.9 (1.8–2.0) 2.1 (1.9–3.8) 2.1 (2.1–4.2) 2.1 (1.9–3.7)
Median observed time to complete response, months (IQR)‡ 11.1 (7.5–18.4) 10.5 (7.4–12.9) 12.4 (8.2–16.6) 11.2 (7.4–14.8)Median DOR, months (range)‡ NR (20.7, NE) NR (18.4, NE) NR (NE, NE) NR (28.8, NE)Kaplan–Meier 12-month estimate of patients with ongoing response, % (95% CI) 89.5 (70.9–96.5) 83.2 (64.1–92.7) 91.7 (70.6–97.8) 87.8 (78.5–93.3)Kaplan–Meier 24-month estimate of patients with ongoing response, % (95% CI) 68.8 (46.9–83.2) 62.5 (38.4–79.4) NE (NE, NE) 69.4 (55.6–79.6)†Defined as the proportion of patients without progressive disease for at least 105 days.‡Based on number of patients with confirmed complete or partial response.ORR per INV was 54.4% (95% CI: 47.1–61.6) for all patients; 50.8% (95% CI: 37.5–64.1) for Group 1, 56.4% (95% CI: 44.7–67.6) for Group 2, and 55.4% (95% CI: 41.5–68.7) for Group 3. ORR per INV was 57.8% (95% CI: 48.8–66.5) among treatment-naïve patients and 47.7% (95% CI: 35.1–60.5) among previously treated patients.CI, confidence interval; NE, not evaluable; NR, not reached.
Table 3. TEAEs regardless of attribution
Advanced CSCC (n=193)
n (%) Any grade Grade ≥3Any 192 (99.5) 94 (48.7)Led to discontinuation 19 (9.8) 14 (7.3)Most common†
Fatigue 67 (34.7) 5 (2.6)Diarrhea 53 (27.5) 2 (1.0)Nausea 46 (23.8) 0Pruritus 41 (21.2) 0Rash 32 (16.6) 1 (0.5)Cough 32 (16.6) 0Arthralgia 28 (14.5) 1 (0.5)Constipation 26 (13.5) 1 (0.5)Vomiting 24 (12.4) 1 (0.5)Actinic keratosis 23 (11.9) 0Maculopapular rash 23 (11.9) 1 (0.5)Anemia 22 (11.4) 8 (4.1)Hypothyroidism 22 (11.4) 0Headache 21 (10.9) 0Upper respiratory tract infection 20 (10.4) 0
†TEAEs reported in ≥10% of patients, ordered by frequency of any grade.
367
• ORR per ICR was 46.1% (95% CI: 38.9–53.4) among all patients; 50.8% (95% CI: 37.5–64.1) for Group 1, 44.9% (95% CI: 33.6–56.6) for Group 2, and 42.9% (95% CI: 29.7–56.8) for Group 3 (Table 2).
• Per ICR, ORR was 48.4% and 41.5% among those who had not received prior anticancer systemic therapy (n=128) and those who had received prior anticancer systemic therapy (n=65), respectively.
• Overall, the observed time to response was 2 months for 41 (46.1%) patients, 2–4 months for 29 (32.6%) patients, 4–6 months for eight (9.0%) patients, and >6 months for 11 (12.4%) patients.
• Median DOR has not been reached (observed DOR range: 1.9–34.3 months).In responding patients, the estimated proportion of patients with ongoing response at 24 months was 69.4% (95% CI: 55.6–79.6) (Figure 3).
Treatment-emergent adverse events
• In total, 192 (99.5%) patients experienced at least one TEAE of any grade regardless of attribution (Table 3).
• Overall, the most common TEAEs of any grade were fatigue (n=67, 34.7%), diarrhea (n=53, 27.5%), and nausea (n=46, 23.8%).
• Grade ≥3 TEAEs regardless of attribution occurred in 94 (48.7%) of patients. The most common Grade ≥3 TEAEs were hypertension (n=9; 4.7%) and anemia and cellulitis (each n=8; 4.1%).
Clinical activity
• Complete response rates at primary analysis, ~1 year follow-up for Groups 1, 2, and 3, and ~2 year follow-up for Group 1 are shown in Figure 2.
• Among 89 responders, median time to complete response was 11.2 months (interquartile range [IQR], 7.4–14.8).
• Estimated median PFS was 18.4 months (95% CI: 10.3–24.3) for all patients. The Kaplan–Meier estimated progression-free probability at 24 months was 44.2% (95% CI: 36.1–52.1) (Figure 4A).
• Median OS has not been reached. The Kaplan–Meier estimated probability of OS at 24 months was 73.3% (95% CI: 66.1–79.2) (Figure 4B).
Figure 3. Kaplan–Meier curves of DOR per ICR
1.0
0.9
0.8
0.7
0.6
0.5
0.4
0.3
0.2
0.1
0.0
0 2 4 6 8 10 12 14 16 18 20 22 24 26 28 30 32 34 36 38 40
Pro
bab
ility
of
no
pro
gre
ssio
n o
r d
eath
MonthNumber of patients at risk
30 30 29 28 23 23 23 23 23 20 18 16 16 16 10 9 6 2 0 0 0Group 1 (n=59)35 33 32 30 27 25 22 21 17 14 10 8 6 6 5 4 0 0 0 0 0Group 2 (n=78)24 24 24 23 21 21 20 19 17 11 5 0 0 0 0 0 0 0 0 0 0Group 3 (n=56)
Total (n=193) 89 87 85 81 71 69 65 63 57 45 33 24 22 22 15 13 6 2 0 0 0
Group 1 (mCSCC) 3 mg/kg Q2W (n=59)Group 2 (laCSCC) 3 mg/kg Q2W (n=78)Group 3 (mCSCC) 350 mg Q3W (n=56)Total (n=193)Figure 2. Complete response rates per ICR
25
20
15
10
5
0
Co
mp
lete
res
po
nse
rate
s (%
)
Group 1 (mCSCC)3 mg/kg Q2W
Group 2 (laCSCC)†
3 mg/kg Q2WGroup 3 (mCSCC)
350 mg Q3W
n=1012.8
n=35.4
n=46.8
n=1016.9
n=1220.3
n=1012.8
n=916.1
Primary ~1-year follow-up ~2-year follow-up
Figure 4. Kaplan–Meier curves for A) PFS per ICR and B) OS
Group 1 (mCSCC) 3 mg/kg Q2W (n=59)Group 2 (laCSCC) 3 mg/kg Q2W (n=78)Group 3 (mCSCC) 350 mg Q3W (n=56)Total (n=193)
1.00.90.80.70.60.50.40.30.20.10.0
0 2 4 6 8 10 12 14 16 18 20 22 24 26 28 30 32 34 36 38 40
Pro
bab
ility
of
OS
MonthNumber of patients at risk
59 56 52 49 47 46 41 39 39 38 38 37 35 33 24 16 11 4 1 0Group 1 (n=59) 4778 76 73 67 65 64 62 59 54 44 41 33 25 22 15 12 8 3 1 0Group 2 (n=78) 6556 52 49 46 45 38 38 38 37 29 20 9 2 0 0 0 0 0 0 0Group 3 (n=56) 44
Total (n=193) 193 184 174 162 157 156 148 141 136 130 111 99 79 62 55 39 28 19 7 2 0
B
Group 1 (mCSCC) 3 mg/kg Q2W (n=59)Group 2 (laCSCC) 3 mg/kg Q2W (n=78)Group 3 (mCSCC) 350 mg Q3W (n=56)Total (n=193)
1.00.90.80.70.60.50.40.30.20.10.0
0 2 4 6 8 10 12 14 16 18 20 22 24 26 28 30 32 34 36 38 40
Pro
bab
ility
of
PFS
MonthNumber of patients at risk
59 42 38 36 32 27 27 27 27 27 24 24 21 20 20 12 9 6 1 0 0Group 1 (n=59)78 61 48 43 39 37 33 29 26 20 17 16 12 10 7 5 5 2 0 0 0Group 2 (n=78)56 48 33 31 31 28 26 26 24 24 17 10 1 1 0 0 0 0 0 0 0Group 3 (n=56)193 151 119 110 102 92 86 82 77 71 58 50 34 31 27 17 14 8 1 0 0Total (n=193)
A
• Grade ≥3 treatment-related adverse events (TRAEs) were reported in 33 (17.1%) patients, with the most common being pneumonitis (n=5, 2.6%), autoimmune hepatitis (n=3; 1.6%), anemia, colitis, and diarrhea (all n=2; 1.0%).
• No new TEAEs resulting in death were reported compared to previousreports.9–11
†Among 23 laCSCC patients who were included in the pre-specified Group 2 interim analysis, there were no complete responses.
See poster #382 reporting post hoc analysis of health-related quality of life in the same patient population presented in this poster. Also see poster #433 that provides the design and rationale of a Phase 3, randomized, double-blind study of adjuvant cemiplimab versus placebo post-surgery and radiation in patients with high-risk CSCC.
References1. Que SKT et al. J Am Acad Dermatol. 2018;78:237–247.2. Cranmer LD et al. Oncologist. 2010;15:1320–1328.3. National Comprehensive Cancer Network. NCCN Clinical
practice guidelines in oncology: squamous cell skin cancer (Version 2.2019). 2018. Available at: https://www.nccn.org/professionals/physician_gls/pdf/squamous.pdf. [AccessedMarch 20, 2020].
4. Karia PS et al. J Clin Oncol. 2014;32:327–334.5. Weinberg AS et al. Dermatol Surg. 2007;33:885–899.
6. Schmults CD et al. JAMA Dermatol. 2013;149:541–547.7. Cowey C et al. Cancer Med. 2020 [in press].8. Burova E et al. Mol Cancer Ther. 2017;16:861–870.9. Migden MR et al. Lancet Oncol. 2020;21:294–305.
10. Migden MR et al. N Engl J Med. 2018;379:341–351.11. Rischin D et al. Poster presented at Maui Dermatology
Conference, January 25–29, 2020. 12. Eisenhauer EA et al. Eur J Cancer. 2009;45:228–247.
AcknowledgmentsThe authors would like to thank the patients, their families, all other investigators, and all investigational site members involved in this study. The study was funded by Regeneron Pharmaceuticals, Inc., and Sanofi. Medical writing support and typesetting was provided by KateCarolan, PhD, of Prime, Knutsford, UK, funded by Regeneron Pharmaceuticals, Inc.and Sanofi.For any questions or comments, please contact Dr Danny Rischin, [email protected]
Conclusions• For patients with advanced CSCC, cemiplimab achieved ORR of 46.1%.
• Patients had deepening responses over time as evidenced byincreasing complete response rates.9–11 Overall, the complete response rate is now 16.1% and median time to complete response was 11.2 months.
• DOR and OS are longer than what has been previously described with other agents.7
• With median DOR not reached after an additional 1 year of follow-up,this analysis indicates an increasing, clinically meaningful DORwith cemiplimab.
• The discontinuation rate, regardless of attribution, was low and most TRAEs were Grades 1–2.
Background• Cutaneous squamous cell carcinoma (CSCC) is the second most
common cancer in the US and its incidence is increasing.1
• Most cases of CSCC are cured by complete surgical excision.2,3
However, a small but substantial number of patients present with either metastatic CSCC (mCSCC) or locally advanced CSCC (laCSCC) not amenable to curative surgery or curative radiotherapy (collectivelyreferred to as “advanced CSCC”), both of which have poor prognoses.4–6
• Historical data shows median overall survival (OS) of approximately 15 months with conventional chemotherapy or epidermal growth factor receptor inhibitors.7
• Cemiplimab is a high-affinity, highly potent human immunoglobulin G4 monoclonal antibody to the programmed cell death (PD)-1 receptor.8
• Cemiplimab monotherapy achieved clinically meaningful activity in patients with advanced CSCC and has a safety profile consistent with other anti–PD-1 inhibitors.9–11
• Based on initial data (median follow-up of 9.4 months in the pivotal study, NCT02760498), cemiplimab (cemiplimab-rwlc in the US) was approved for the treatment of patients with advanced CSCC.
Objective• The primary objective of the Phase 2 study was to evaluate the objective
response rate (ORR) by independent central review (ICR) per Response Evaluation Criteria In Solid Tumors version 1.1 (RECIST 1.1) (for scans)12
and modified World Health Organization (WHO) criteria (for photos).
• Key secondary objectives included ORR per investigator review (INV), duration of response (DOR) by ICR and INV, progression-free survival (PFS) by ICR and INV, OS, complete response rate by ICR, safety and tolerability, and assessment of health-related quality of life. Durable disease control rate, defined as the proportion of patients with response or stable disease for at least 105 days, was also examined.
- Please see poster #382 for results on health-related quality of life data from this study.
• Here, we present up to 3-year follow-up (median duration of follow-up for all patients: 15.7 months) from the largest and most mature prospective data set in advanced CSCC.
Methods• EMPOWER-CSCC-1 is an open-label, non-randomized, multicenter,
international Phase 2 study of patients with advanced CSCC.
• Patients received cemiplimab 3 mg/kg every 2 weeks (Q2W) (Group 1; mCSCC; Group 2, laCSCC) or cemiplimab 350 mg every 3 weeks (Q3W) (Group 3, mCSCC) (Figure 1).
• The severity of treatment-emergent adverse events (TEAEs) was graded according to the National Cancer Institute Common Terminology Criteria for Adverse Events (version 4.03).
• The data cut-off was October 11, 2019.
Presented at American Society of Clinical Oncology (ASCO) 2020 Virtual Scientific Meeting, May 29–31, 2020.
Group 1 – Adult patients with metastatic (nodal and/or distant) CSCC Cemiplimab 3 mg/kg
Q2W IV, for up to 96 weeks
Cemiplimab 350 mgQ3W IV, for up to
54 weeks
Tumor response assessment by ICR (RECIST 1.1 for scans; modified WHO criteria for photos)
Tumor imaging every 8 weeks for the
assessment of efficacy
Tumor imaging every 9 weeks for the
assessment of efficacy
Group 3 – Adult patients with metastatic (nodal and/or distant) CSCC
Group 2 – laCSCC
Key inclusion criteria• ECOG performance status of 0 or 1• Adequate organ function• Groups 1 and 3:
At least one lesion measurable by RECIST 1.1 • Group 2
At least one lesion measurable by digital medical photographyCSCC lesion that is not amenable to curative surgery or curative radiation therapy per investigators’ assessmentTumor biopsies at baseline and on day 29, for exploratory biomarker analysis, unless considered to have unacceptable safety risks by the investigator
Key exclusion criteria• Ongoing or recent (within 5 years) autoimmune disease requiring systemic immunosuppression• Prior treatments with anti–PD-1 or anti–PD-L1 therapy• History of solid organ transplant, concurrent malignancies (unless indolent or not considered life-threatening; for example, basal cell carcinoma), or hematologic malignancies
Figure 1. Study design
ECOG, Eastern Cooperative Oncology Group; IV, intravenously; PD-L1, PD-ligand 1.
Phase 2 Study of Cemiplimab in Patients with Advanced Cutaneous Squamous Cell Carcinoma (CSCC): Longer Follow-Up
Danny Rischin,1 Nikhil I. Khushalani,2 Chrysalyne D. Schmults,3 Alexander Guminski,4 Anne Lynn S. Chang,5 Karl D. Lewis,6 Annette M. Lim,1 Leonel Hernandez-Aya,7 Brett G.M. Hughes,8 Dirk Schadendorf,9 Axel Hauschild,10
Elizabeth Stankevich,11 Jocelyn Booth,11 Suk-Young Yoo,11 Zhen Chen,12 Emmanuel Okoye,13 Israel Lowy,12 Matthew G. Fury,12 Michael R. Migden14
1Department of Medical Oncology, Peter MacCallum Cancer Centre, Melbourne, Australia; 2Department of Cutaneous Oncology, Moffitt Cancer Center, Tampa, FL, USA; 3Department of Dermatology, Brigham and Women’s Hospital, Harvard Medical School, Boston, MA, USA; 4Department of Medical Oncology, Royal North Shore Hospital, St Leonards, Australia; 5Department of Dermatology, Stanford University School of Medicine, Redwood City, CA, USA; 6University of Colorado Denver, School of Medicine, Aurora, CO, USA;
7Division of Medical Oncology, Department of Medicine, Washington University School of Medicine, St Louis, MO, USA; 8Royal Brisbane & Women’s Hospital and University of Queensland, Brisbane, Australia; 9University Hospital Essen, Essen and German Cancer Consortium, Essen, Germany; 10Schleswig-Holstein University Hospital, Kiel, Germany; 11Regeneron Pharmaceuticals, Inc., Basking Ridge, NJ, USA; 12Regeneron Pharmaceuticals, Inc., Tarrytown, NY, USA; 13Regeneron Pharmaceuticals, Inc., London, UK;
14Departments of Dermatology and Head and Neck Surgery, University of Texas MD Anderson Cancer Center, Houston, TX, USA
ResultsPatients• A total of 193 patients were enrolled (Group 1, n=59; Group 2, n=78;
Group 3, n=56) (Table 1).
Table 1. Baseline demographics
Advanced CSCC(n=193)
Median age, years (range) 72.0 (38–96)Male, n (%) 161 (83.4)ECOG performance status, n (%)
0 86 (44.6)1 107 (55.4)
Primary CSCC site: head and neck, n (%) 131 (67.9)mCSCC, n (%) 115 (59.6)laCSCC, n (%) 78 (40.4)Patients with cemiplimab as first-line therapy, n (%) 128 (66.3)Patients with prior systemic therapy, n (%)† 65 (33.7)Median duration of exposure to cemiplimab, weeks (range) 51.1 (2.0–109.3)Median number of doses of cemiplimab administered (range) 18.0 (1–48)†Settings for prior lines of therapy included metastatic disease, adjuvant, chemotherapy with concurrent radiation, or other and the most common types of prior systemic therapy were platinum compounds (n=46/65 [70.8%]) and monoclonal antibodies (n=18/65 [27.7%]).
Table 2. Duration of follow-up and tumor response to cemiplimab per ICR
Group 1 (mCSCC)3 mg/kg Q2W (n=59)
Group 2 (laCSCC)3 mg/kg Q2W (n=78)
Group 3 (mCSCC)350 mg Q3W (n=56)
Total(n=193)
Median duration of follow-up, months (range) 18.5 (1.1–36.1) 15.5 (0.8–35.6) 17.3 (0.6–26.3) 15.7 (0.6–36.1)ORR, % (95% CI) 50.8 (37.5–64.1) 44.9 (33.6–56.6) 42.9 (29.7–56.8) 46.1 (38.9–53.4)
Complete response, n (%) 12 (20.3) 10 (12.8) 9 (16.1) 31 (16.1)Partial response, n (%) 18 (30.5) 25 (32.1) 15 (26.8) 58 (30.1)Stable disease, n (%) 9 (15.3) 27 (34.6) 10 (17.9) 46 (23.8)Non-complete response/non-progressive disease, n (%) 3 (5.1) 0 2 (3.6) 5 (2.6)Progressive disease, n (%) 10 (16.9) 10 (12.8) 14 (25.0) 34 (17.6)Not evaluable, n (%) 7 (11.9) 6 (7.7) 6 (10.7) 19 (9.8)
Disease control rate, % (95% CI) 71.2 (57.9–82.2) 79.5 (68.8–87.8) 64.3 (50.4–76.6) 72.5 (65.7–78.7)Durable disease control rate,† % (95% CI) 61.0 (47.4–73.5) 62.8 (51.1–73.5) 57.1 (43.2–70.3) 60.6 (53.3–67.6)Median observed time to response, months (IQR)‡ 1.9 (1.8–2.0) 2.1 (1.9–3.8) 2.1 (2.1–4.2) 2.1 (1.9–3.7)
Median observed time to complete response, months (IQR)‡ 11.1 (7.5–18.4) 10.5 (7.4–12.9) 12.4 (8.2–16.6) 11.2 (7.4–14.8)Median DOR, months (range)‡ NR (20.7, NE) NR (18.4, NE) NR (NE, NE) NR (28.8, NE)Kaplan–Meier 12-month estimate of patients with ongoing response, % (95% CI) 89.5 (70.9–96.5) 83.2 (64.1–92.7) 91.7 (70.6–97.8) 87.8 (78.5–93.3)Kaplan–Meier 24-month estimate of patients with ongoing response, % (95% CI) 68.8 (46.9–83.2) 62.5 (38.4–79.4) NE (NE, NE) 69.4 (55.6–79.6)†Defined as the proportion of patients without progressive disease for at least 105 days.‡Based on number of patients with confirmed complete or partial response.
ORR per INV was 54.4% (95% CI: 47.1–61.6) for all patients; 50.8% (95% CI: 37.5–64.1) for Group 1, 56.4% (95% CI: 44.7–67.6) for Group 2, and 55.4% (95% CI: 41.5–68.7) for Group 3. ORR per INV was 57.8% (95% CI: 48.8–66.5) among treatment-naïve patients and 47.7% (95% CI: 35.1–60.5)among previously treated patients.CI, confidence interval; NE, not evaluable; NR, not reached.
Table 3. TEAEs regardless of attribution
Advanced CSCC (n=193)
n (%) Any grade Grade ≥3Any 192 (99.5) 94 (48.7)Led to discontinuation 19 (9.8) 14 (7.3)Most common†
Fatigue 67 (34.7) 5 (2.6)Diarrhea 53 (27.5) 2 (1.0)Nausea 46 (23.8) 0Pruritus 41 (21.2) 0Rash 32 (16.6) 1 (0.5)Cough 32 (16.6) 0Arthralgia 28 (14.5) 1 (0.5)Constipation 26 (13.5) 1 (0.5)Vomiting 24 (12.4) 1 (0.5)Actinic keratosis 23 (11.9) 0Maculopapular rash 23 (11.9) 1 (0.5)Anemia 22 (11.4) 8 (4.1)Hypothyroidism 22 (11.4) 0Headache 21 (10.9) 0Upper respiratory tract infection 20 (10.4) 0
†TEAEs reported in ≥10% of patients, ordered by frequency of any grade.
367
• ORR per ICR was 46.1% (95% CI: 38.9–53.4) among all patients; 50.8% (95% CI: 37.5–64.1) for Group 1, 44.9% (95% CI: 33.6–56.6) for Group 2, and 42.9% (95% CI: 29.7–56.8) for Group 3 (Table 2).
• Per ICR, ORR was 48.4% and 41.5% among those who had not received prior anticancer systemic therapy (n=128) and those who had received prior anticancer systemic therapy (n=65), respectively.
• Overall, the observed time to response was 2 months for 41 (46.1%)patients, 2–4 months for 29 (32.6%) patients, 4–6 months for eight (9.0%) patients, and >6 months for 11 (12.4%) patients.
• Median DOR has not been reached (observed DOR range: 1.9–34.3 months).In responding patients, the estimated proportion of patients with ongoing response at 24 months was 69.4% (95% CI: 55.6–79.6) (Figure 3).
Treatment-emergent adverse events
• In total, 192 (99.5%) patients experienced at least one TEAE of any grade regardless of attribution (Table 3).
• Overall, the most common TEAEs of any grade were fatigue (n=67, 34.7%), diarrhea (n=53, 27.5%), and nausea (n=46, 23.8%).
• Grade ≥3 TEAEs regardless of attribution occurred in 94 (48.7%) of patients. The most common Grade ≥3 TEAEs were hypertension (n=9; 4.7%) and anemia and cellulitis (each n=8; 4.1%).
Clinical activity
• Complete response rates at primary analysis, ~1 year follow-up for Groups 1, 2, and 3, and ~2 year follow-up for Group 1 are shown in Figure 2.
• Among 89 responders, median time to complete response was 11.2 months (interquartile range [IQR], 7.4–14.8).
• Estimated median PFS was 18.4 months (95% CI: 10.3–24.3) for all patients. The Kaplan–Meier estimated progression-free probability at 24 months was 44.2% (95% CI: 36.1–52.1) (Figure 4A).
• Median OS has not been reached. The Kaplan–Meier estimated probabilityof OS at 24 months was 73.3% (95% CI: 66.1–79.2) (Figure 4B).
Figure 3. Kaplan–Meier curves of DOR per ICR
1.0
0.9
0.8
0.7
0.6
0.5
0.4
0.3
0.2
0.1
0.0
0 2 4 6 8 10 12 14 16 18 20 22 24 26 28 30 32 34 36 38 40
Pro
bab
ility
of
no
pro
gre
ssio
n o
r d
eath
MonthNumber of patients at risk
30 30 29 28 23 23 23 23 23 20 18 16 16 16 10 9 6 2 0 0 0Group 1 (n=59)35 33 32 30 27 25 22 21 17 14 10 8 6 6 5 4 0 0 0 0 0Group 2 (n=78)24 24 24 23 21 21 20 19 17 11 5 0 0 0 0 0 0 0 0 0 0Group 3 (n=56)
Total (n=193) 89 87 85 81 71 69 65 63 57 45 33 24 22 22 15 13 6 2 0 0 0
Group 1 (mCSCC) 3 mg/kg Q2W (n=59)Group 2 (laCSCC) 3 mg/kg Q2W (n=78)Group 3 (mCSCC) 350 mg Q3W (n=56)Total (n=193)Figure 2. Complete response rates per ICR
25
20
15
10
5
0
Co
mp
lete
res
po
nse
rate
s (%
)
Group 1 (mCSCC)3 mg/kg Q2W
Group 2 (laCSCC)†
3 mg/kg Q2WGroup 3 (mCSCC)
350 mg Q3W
n=1012.8
n=35.4
n=46.8
n=1016.9
n=1220.3
n=1012.8
n=916.1
Primary ~1-year follow-up ~2-year follow-up
Figure 4. Kaplan–Meier curves for A) PFS per ICR and B) OS
Group 1 (mCSCC) 3 mg/kg Q2W (n=59)Group 2 (laCSCC) 3 mg/kg Q2W (n=78)Group 3 (mCSCC) 350 mg Q3W (n=56)Total (n=193)
1.00.90.80.70.60.50.40.30.20.10.0
0 2 4 6 8 10 12 14 16 18 20 22 24 26 28 30 32 34 36 38 40
Pro
bab
ility
of
OS
MonthNumber of patients at risk
59 56 52 49 47 46 41 39 39 38 38 37 35 33 24 16 11 4 1 0Group 1 (n=59) 4778 76 73 67 65 64 62 59 54 44 41 33 25 22 15 12 8 3 1 0Group 2 (n=78) 6556 52 49 46 45 38 38 38 37 29 20 9 2 0 0 0 0 0 0 0Group 3 (n=56) 44
Total (n=193) 193 184 174 162 157 156 148 141 136 130 111 99 79 62 55 39 28 19 7 2 0
B
Group 1 (mCSCC) 3 mg/kg Q2W (n=59)Group 2 (laCSCC) 3 mg/kg Q2W (n=78)Group 3 (mCSCC) 350 mg Q3W (n=56)Total (n=193)
1.00.90.80.70.60.50.40.30.20.10.0
0 2 4 6 8 10 12 14 16 18 20 22 24 26 28 30 32 34 36 38 40
Pro
bab
ility
of
PFS
MonthNumber of patients at risk
59 42 38 36 32 27 27 27 27 27 24 24 21 20 20 12 9 6 1 0 0Group 1 (n=59)78 61 48 43 39 37 33 29 26 20 17 16 12 10 7 5 5 2 0 0 0Group 2 (n=78)56 48 33 31 31 28 26 26 24 24 17 10 1 1 0 0 0 0 0 0 0Group 3 (n=56)193 151 119 110 102 92 86 82 77 71 58 50 34 31 27 17 14 8 1 0 0Total (n=193)
A
• Grade ≥3 treatment-related adverse events (TRAEs) were reported in 33 (17.1%) patients, with the most common being pneumonitis (n=5, 2.6%), autoimmune hepatitis (n=3; 1.6%), anemia, colitis, and diarrhea (all n=2; 1.0%).
• No new TEAEs resulting in death were reported compared to previous reports.9–11
†Among 23 laCSCC patients who were included in the pre-specified Group 2 interim analysis, there were no complete responses.

Résumé
Les données de 193 patients atteints d'un CEC avancé provenant de l'étude de phase II ont été évaluées.1 Le suivi médian était de 15,7 mois.1
Caractéristiques au début de l'étude1
• Age médian : 72 ans
• ECOG 1 chez 55,4 % des patients (107 sur 193)
• Carcinomes épidermoïdes cutanés de la tête et du cou (y compris oreille et tempe) chez 67,9 % despatients (131 sur 193)
• Carcinome épidermoïde cutané métastatique chez 59,6 % des patients (115 sur 193)
• Carcinome épidermoïde cutané localement avancé chez 40,4 % des patients (78 sur 193)
• Patients ayant reçu du cémiplimab en traitement de première ligne : 66,3 % (128 sur 193)
• Patients ayant reçu un traitement systémique antérieur : 33,7 % (65 sur 193)
Efficacité1
• Taux de réponse (ORR) : 46,1 % – dont 16,1 % présentant une réponse complète (CR)
• Après 24 mois, 69,4 % des patients (IC à 95 % : 55,6–79,6) répondaient encore au traitement(selon une estimation de Kaplan-Meier).
• La durée médiane de réponse (DOR) n'a pas encore été atteinte.
• La survie médiane sans progression (PFS) était de 18,4 mois.
• La survie globale médiane (OS) n'a pas encore été atteinte.
Tolérance1
• Survenue d'effets indésirables survenus en cours de traitement (EIT), tous grades confondus :99,5 % des patients (192 sur 193)
• EIT les plus fréquents (tous grades confondus) : fatigue (34,7 % ; 67 sur 193), diarrhée (27,5 % ;53 sur 193) et nausée (23,8 % ; 46 sur 193)
• EIT de grade 3 ou plus : 48,7 % (94 sur 193) ; dont les plus fréquents étaient l'hypertension(4,7 % ; 9 sur 193), l'anémie et la cellulite (4,1 % pour chacun de ces deux effets ; 8 sur 193) ;(voir tableau 3 pour tous les points)
Conclusion• Le cémiplimab a permis d'obtenir un taux de réponse objective de 46,1 % chez les patients atteints
de CEC avancé.
• Comme la durée de réponse médiane (DOR) n'a pas encore été atteinte au bout d'une annéesupplémentaire, l'analyse démontre que le cémiplimab permet d'obtenir une durée de réponse deplus en plus significative sur le plan clinique.
1. Rischin, D. et al. Phase 2 Study of Cemiplimab in Patients with Advanced Cutaneous Squamous Cell Carcinoma (CSCC): Longer Follow-Up (presented at ASCO 2020). 2. https://clinicaltrials.gov/ct2/show/NCT02760498 – consulté le 28.05.2020. 3. https://clinicaltrials.gov/ct2/show/NCT03132636 – consulté le 28.05.2020. 4. https://clinicaltrials.gov/ct2/show/NCT03088540?term=REGN2810&draw=2 – consultéle 28.05.2020. 5. https://clinicaltrials.gov/ct2/show/NCT03257267?term=REGN2810&rank=6 – consulté le 28.05.2020.
Danny Rischin,1 Nikhil I. Khushalani,2 Chrysalyne D. Schmults,3 Alexander Guminski,4 Anne Lynn S. Chang,5 Karl D. Lewis,6 Annette M. Lim,1 Leonel Hernandez-Aya,7 Brett G.M. Hughes,8 Dirk Schadendorf,9 Axel Hauschild,10 Elizabeth Stankevich,11 Jocelyn Booth,11 Suk-Young Yoo,11 Zhen Chen,12 Emmanuel Okoye,13 Israel Lowy,12 Matthew G. Fury,12 Michael R. Migden14
1Department of Medical Oncology, Peter MacCallum Cancer Centre, Melbourne, Australia; 2Department of Cutaneous Oncology, Moffitt Cancer Center, Tampa, FL, USA; 3Department of Dermatology, Brigham and Women’s Hospital, Harvard Medical School, Boston, MA, USA; 4Department of Medical Oncology, Royal North Shore Hospital, St Leonards, Australia; 5Department of Dermatology, Stanford University School of Medicine, Redwood City, CA, USA; 6University of Colorado Denver, School of Medicine, Aurora, CO, USA; 7Division of Medical Oncology, Department of Medicine, Washington University School of Medicine, St Louis, MO, USA; 8Royal Brisbane & Women’s Hospital and University of Queensland, Brisbane, Australia; 9University Hospital Essen, Essen and German Cancer Consortium, Essen, Germany; 10Schleswig-Holstein University Hospital, Kiel, Germany; 11Regeneron Pharmaceuticals, Inc., Basking Ridge, NJ, USA; 12Regeneron Pharmaceuticals, Inc., Tarrytown, NY, USA; 13Regeneron Pharmaceuticals, Inc., London, UK; 14Departments of Dermatology and Head and Neck Surgery, University of Texas MD Anderson Cancer Center, Houston, TX, USA
Phase II Study of Cemiplimab in Patients with Advanced Cutaneous Squamous Cell Carcinoma (CSCC): Longer Follow-Up
POSTER SCIENTIFIQUE
Rischin et al, Phase 2 Study of Cemiplimab in Patients with Advanced Cutaneous Squamous Cell Carcinoma (CSCC): Longer Follow-Up, presented at ASCO 2020.
Ce contenu est mis à votre disposition pour votre usage personnel, votre formation ou votre développement professionnel. Toute reproduction non autorisée est interdite. Pour obtenir l'autorisation de réutiliser le contenu à des fins commerciales ou autres, veuillez contacter [email protected]. MA
T-CH
-200
1806
-1.0
- 08/2
020
ASCO- Update2020
Des thérapies de pointeface à des maladies complexes.
Titulaire de sanofi-aventis (suisse) sal’autorisation : 3, route de Montfleury
1214 Vernier
Contact : [email protected] www.sanofigenzyme.ch
Libtayo® concentré pour solution pour perfusion. PA : cémiplimab . I : monothérapie pour le traitement des patients atteints de carcinome épidermoïde cutané métastatique, ou de carcinome épidermoïde cutané localement avancé, qui ne sont pas éligibles à une chirurgie curative ou à une radiothérapie curative. P : 350 mg toutes les 3 semaines en perfusion intraveineuse pendant 30 minutes, durant maximum 2 ans. CI : hypersensibilité à la substance active ou à l’un des excipients. MP : des effets indésirables d’origine immunologique sévères et mortels ont été observés. En cas de suspicion d’effets indésirables d’origine immunologique, le patient doit être évalué et le traitement au cémiplimab suspendu ou arrêté définitivement. Cémiplimab peut provoquer des réactions liées à la perfusion sévères ou menaçant le pronostic vital. Les patients doivent être surveillés pour détecter tout signe/symptôme de réaction liée à la perfusion. Le traitement par cémiplimab doit être adapté et une corticothérapie administrée. Cémiplimab peut augmenter le risque de rejet chez les patients transplantés ; le rapport bénéfice/risque doit donc être soigneusement évalué. Les études menées chez l’animal ont démontré une toxicité embryo-foetale ; cémiplimab n’est pas recommandé pendant la grossesse ni chez la femme en âge de procréer sans contraception efficace, sauf en cas de nécessité absolue. EI : affections cutanées (éruption cutanée, prurit), réactions liées à la perfusion, troubles de la fonction thyroïdienne, pneumonite, stomatite, hépatite, hausse de la valeur hépatique, fatigue, diarrhée, arthralgie, douleurs musculosquelettiques, arthrite, augmentation de la créatinine sanguine. Pr : Libtayo 350 mg/ 7 ml : boîte de 1 flacon à usage unique. Cat.rem. : A. Tit.AMM : sanofi-aventis (suisse) sa, 1214 Vernier/GE. MàJ : mai 2020. (MAT-CH-2001066-1.0 - 06/2020). Pour plus de renseignements, voir l'information destinée aux professionnels sur www.swissmedicinfo.ch.

See poster #382 reporting post hoc analysis of health-related quality of life in the same patient population presented in this poster. Also see poster #433 that provides the design and rationale of a Phase 3, randomized, double-blind study of adjuvant cemiplimab versus placebo post-surgery and radiation in patients with high-risk CSCC.
References1. Que SKT et al. J Am Acad Dermatol. 2018;78:237–247.2. Cranmer LD et al. Oncologist. 2010;15:1320–1328.3. National Comprehensive Cancer Network. NCCN Clinical
practice guidelines in oncology: squamous cell skin cancer(Version 2.2019). 2018. Available at: https://www.nccn.org/professionals/physician_gls/pdf/squamous.pdf. [AccessedMarch 20, 2020].
4. Karia PS et al. J Clin Oncol. 2014;32:327–334.5. Weinberg AS et al. Dermatol Surg. 2007;33:885–899.
6. Schmults CD et al. JAMA Dermatol. 2013;149:541–547.7. Cowey C et al. Cancer Med. 2020 [in press].8. Burova E et al. Mol Cancer Ther. 2017;16:861–870.9. Migden MR et al. Lancet Oncol. 2020;21:294–305.
10. Migden MR et al. N Engl J Med. 2018;379:341–351.11. Rischin D et al. Poster presented at Maui Dermatology
Conference, January 25–29, 2020. 12. Eisenhauer EA et al. Eur J Cancer. 2009;45:228–247.
AcknowledgmentsThe authors would like to thank the patients, their families, all other investigators, and all investigational site members involved in this study.The study was funded by Regeneron Pharmaceuticals, Inc., and Sanofi. Medical writing support and typesetting was provided by KateCarolan, PhD, of Prime, Knutsford, UK, funded by Regeneron Pharmaceuticals, Inc.and Sanofi.For any questions or comments, please contact Dr Danny Rischin, [email protected]
Conclusions• For patients with advanced CSCC, cemiplimab achieved ORR of 46.1%.
• Patients had deepening responses over time as evidenced byincreasing complete response rates.9–11 Overall, the completeresponse rate is now 16.1% and median time to complete responsewas 11.2 months.
• DOR and OS are longer than what has been previously described withother agents.7
• With median DOR not reached after an additional 1 year of follow-up,this analysis indicates an increasing, clinically meaningful DORwith cemiplimab.
• The discontinuation rate, regardless of attribution, was low and mostTRAEs were Grades 1–2.
Background• Cutaneous squamous cell carcinoma (CSCC) is the second most
common cancer in the US and its incidence is increasing.1
• Most cases of CSCC are cured by complete surgical excision.2,3 However, a small but substantial number of patients present with either metastatic CSCC (mCSCC) or locally advanced CSCC (laCSCC) not amenable to curative surgery or curative radiotherapy (collectively referred to as “advanced CSCC”), both of which have poor prognoses.4–6
• Historical data shows median overall survival (OS) of approximately 15 months with conventional chemotherapy or epidermal growth factor receptor inhibitors.7
• Cemiplimab is a high-affinity, highly potent human immunoglobulin G4 monoclonal antibody to the programmed cell death (PD)-1 receptor.8
• Cemiplimab monotherapy achieved clinically meaningful activity in patients with advanced CSCC and has a safety profile consistent with other anti–PD-1 inhibitors.9–11
• Based on initial data (median follow-up of 9.4 months in the pivotal study, NCT02760498), cemiplimab (cemiplimab-rwlc in the US) was approved for the treatment of patients with advanced CSCC.
Objective• The primary objective of the Phase 2 study was to evaluate the objective
response rate (ORR) by independent central review (ICR) per Response Evaluation Criteria In Solid Tumors version 1.1 (RECIST 1.1) (for scans)12 and modified World Health Organization (WHO) criteria (for photos).
• Key secondary objectives included ORR per investigator review (INV), duration of response (DOR) by ICR and INV, progression-free survival (PFS) by ICR and INV, OS, complete response rate by ICR, safety and tolerability, and assessment of health-related quality of life. Durable disease control rate, defined as the proportion of patients with response or stable disease for at least 105 days, was also examined.
- Please see poster #382 for results on health-related quality of life data from this study.
• Here, we present up to 3-year follow-up (median duration of follow-up for all patients: 15.7 months) from the largest and most mature prospective data set in advanced CSCC.
Methods• EMPOWER-CSCC-1 is an open-label, non-randomized, multicenter,
international Phase 2 study of patients with advanced CSCC.
• Patients received cemiplimab 3 mg/kg every 2 weeks (Q2W) (Group 1; mCSCC; Group 2, laCSCC) or cemiplimab 350 mg every 3 weeks (Q3W) (Group 3, mCSCC) (Figure 1).
• The severity of treatment-emergent adverse events (TEAEs) was graded according to the National Cancer Institute Common Terminology Criteria for Adverse Events (version 4.03).
• The data cut-off was October 11, 2019.
Presented at American Society of Clinical Oncology (ASCO) 2020 Virtual Scientific Meeting, May 29–31, 2020.
Group 1 – Adult patients with metastatic (nodal and/or distant) CSCC Cemiplimab 3 mg/kg
Q2W IV, for up to 96 weeks
Cemiplimab 350 mgQ3W IV, for up to
54 weeks
Tumor response assessment by ICR (RECIST 1.1 for scans; modified WHO criteria for photos)
Tumor imaging every 8 weeks for the
assessment of efficacy
Tumor imaging every 9 weeks for the
assessment of efficacy
Group 3 – Adult patients with metastatic (nodal and/or distant) CSCC
Group 2 – laCSCC
Key inclusion criteria• ECOG performance status of 0 or 1• Adequate organ function• Groups 1 and 3:
At least one lesion measurable by RECIST 1.1 • Group 2
At least one lesion measurable by digital medical photographyCSCC lesion that is not amenable to curative surgery or curative radiation therapy per investigators’ assessmentTumor biopsies at baseline and on day 29, for exploratory biomarker analysis, unless considered to have unacceptable safety risks by the investigator
Key exclusion criteria• Ongoing or recent (within 5 years) autoimmune disease requiring systemic immunosuppression• Prior treatments with anti–PD-1 or anti–PD-L1 therapy• History of solid organ transplant, concurrent malignancies (unless indolent or not considered life-threatening; for example, basal cell carcinoma), or hematologic malignancies
Figure 1. Study design
ECOG, Eastern Cooperative Oncology Group; IV, intravenously; PD-L1, PD-ligand 1.
Phase 2 Study of Cemiplimab in Patients with Advanced Cutaneous Squamous Cell Carcinoma (CSCC): Longer Follow-Up
Danny Rischin,1 Nikhil I. Khushalani,2 Chrysalyne D. Schmults,3 Alexander Guminski,4 Anne Lynn S. Chang,5 Karl D. Lewis,6 Annette M. Lim,1 Leonel Hernandez-Aya,7 Brett G.M. Hughes,8 Dirk Schadendorf,9 Axel Hauschild,10
Elizabeth Stankevich,11 Jocelyn Booth,11 Suk-Young Yoo,11 Zhen Chen,12 Emmanuel Okoye,13 Israel Lowy,12 Matthew G. Fury,12 Michael R. Migden14
1Department of Medical Oncology, Peter MacCallum Cancer Centre, Melbourne, Australia; 2Department of Cutaneous Oncology, Moffitt Cancer Center, Tampa, FL, USA; 3Department of Dermatology, Brigham and Women’s Hospital, Harvard Medical School, Boston, MA, USA; 4Department of Medical Oncology, Royal North Shore Hospital, St Leonards, Australia; 5Department of Dermatology, Stanford University School of Medicine, Redwood City, CA, USA; 6University of Colorado Denver, School of Medicine, Aurora, CO, USA;
7Division of Medical Oncology, Department of Medicine, Washington University School of Medicine, St Louis, MO, USA; 8Royal Brisbane & Women’s Hospital and University of Queensland, Brisbane, Australia; 9University Hospital Essen, Essen and German Cancer Consortium, Essen, Germany; 10Schleswig-Holstein University Hospital, Kiel, Germany; 11Regeneron Pharmaceuticals, Inc., Basking Ridge, NJ, USA; 12Regeneron Pharmaceuticals, Inc., Tarrytown, NY, USA; 13Regeneron Pharmaceuticals, Inc., London, UK;
14Departments of Dermatology and Head and Neck Surgery, University of Texas MD Anderson Cancer Center, Houston, TX, USA
ResultsPatients• A total of 193 patients were enrolled (Group 1, n=59; Group 2, n=78;
Group 3, n=56) (Table 1).
Table 1. Baseline demographics
Advanced CSCC(n=193)
Median age, years (range) 72.0 (38–96)Male, n (%) 161 (83.4)ECOG performance status, n (%)
0 86 (44.6)1 107 (55.4)
Primary CSCC site: head and neck, n (%) 131 (67.9)mCSCC, n (%) 115 (59.6)laCSCC, n (%) 78 (40.4)Patients with cemiplimab as first-line therapy, n (%) 128 (66.3)Patients with prior systemic therapy, n (%)† 65 (33.7)Median duration of exposure to cemiplimab, weeks (range) 51.1 (2.0–109.3)Median number of doses of cemiplimab administered (range) 18.0 (1–48)†Settings for prior lines of therapy included metastatic disease, adjuvant, chemotherapy with concurrent radiation, or other and the most common types of prior systemic therapy were platinum compounds (n=46/65 [70.8%]) and monoclonal antibodies (n=18/65 [27.7%]).
Table 2. Duration of follow-up and tumor response to cemiplimab per ICR
Group 1 (mCSCC)3 mg/kg Q2W (n=59)
Group 2 (laCSCC)3 mg/kg Q2W (n=78)
Group 3 (mCSCC)350 mg Q3W (n=56)
Total(n=193)
Median duration of follow-up, months (range) 18.5 (1.1–36.1) 15.5 (0.8–35.6) 17.3 (0.6–26.3) 15.7 (0.6–36.1)ORR, % (95% CI) 50.8 (37.5–64.1) 44.9 (33.6–56.6) 42.9 (29.7–56.8) 46.1 (38.9–53.4)
Complete response, n (%) 12 (20.3) 10 (12.8) 9 (16.1) 31 (16.1)Partial response, n (%) 18 (30.5) 25 (32.1) 15 (26.8) 58 (30.1)Stable disease, n (%) 9 (15.3) 27 (34.6) 10 (17.9) 46 (23.8)Non-complete response/non-progressive disease, n (%) 3 (5.1) 0 2 (3.6) 5 (2.6)Progressive disease, n (%) 10 (16.9) 10 (12.8) 14 (25.0) 34 (17.6)Not evaluable, n (%) 7 (11.9) 6 (7.7) 6 (10.7) 19 (9.8)
Disease control rate, % (95% CI) 71.2 (57.9–82.2) 79.5 (68.8–87.8) 64.3 (50.4–76.6) 72.5 (65.7–78.7)Durable disease control rate,† % (95% CI) 61.0 (47.4–73.5) 62.8 (51.1–73.5) 57.1 (43.2–70.3) 60.6 (53.3–67.6)Median observed time to response, months (IQR)‡ 1.9 (1.8–2.0) 2.1 (1.9–3.8) 2.1 (2.1–4.2) 2.1 (1.9–3.7)
Median observed time to complete response, months (IQR)‡ 11.1 (7.5–18.4) 10.5 (7.4–12.9) 12.4 (8.2–16.6) 11.2 (7.4–14.8)Median DOR, months (range)‡ NR (20.7, NE) NR (18.4, NE) NR (NE, NE) NR (28.8, NE)Kaplan–Meier 12-month estimate of patients with ongoing response, % (95% CI) 89.5 (70.9–96.5) 83.2 (64.1–92.7) 91.7 (70.6–97.8) 87.8 (78.5–93.3)Kaplan–Meier 24-month estimate of patients with ongoing response, % (95% CI) 68.8 (46.9–83.2) 62.5 (38.4–79.4) NE (NE, NE) 69.4 (55.6–79.6)†Defined as the proportion of patients without progressive disease for at least 105 days.‡Based on number of patients with confirmed complete or partial response.ORR per INV was 54.4% (95% CI: 47.1–61.6) for all patients; 50.8% (95% CI: 37.5–64.1) for Group 1, 56.4% (95% CI: 44.7–67.6) for Group 2, and 55.4% (95% CI: 41.5–68.7) for Group 3. ORR per INV was 57.8% (95% CI: 48.8–66.5) among treatment-naïve patients and 47.7% (95% CI: 35.1–60.5)among previously treated patients.CI, confidence interval; NE, not evaluable; NR, not reached.
Table 3. TEAEs regardless of attribution
Advanced CSCC (n=193)
n (%) Any grade Grade ≥3Any 192 (99.5) 94 (48.7)Led to discontinuation 19 (9.8) 14 (7.3)Most common†
Fatigue 67 (34.7) 5 (2.6)Diarrhea 53 (27.5) 2 (1.0)Nausea 46 (23.8) 0Pruritus 41 (21.2) 0Rash 32 (16.6) 1 (0.5)Cough 32 (16.6) 0Arthralgia 28 (14.5) 1 (0.5)Constipation 26 (13.5) 1 (0.5)Vomiting 24 (12.4) 1 (0.5)Actinic keratosis 23 (11.9) 0Maculopapular rash 23 (11.9) 1 (0.5)Anemia 22 (11.4) 8 (4.1)Hypothyroidism 22 (11.4) 0Headache 21 (10.9) 0Upper respiratory tract infection 20 (10.4) 0
†TEAEs reported in ≥10% of patients, ordered by frequency of any grade.
367
• ORR per ICR was 46.1% (95% CI: 38.9–53.4) among all patients; 50.8% (95% CI: 37.5–64.1) for Group 1, 44.9% (95% CI: 33.6–56.6) for Group 2, and 42.9% (95% CI: 29.7–56.8) for Group 3 (Table 2).
• Per ICR, ORR was 48.4% and 41.5% among those who had not received prior anticancer systemic therapy (n=128) and those who had received prior anticancer systemic therapy (n=65), respectively.
• Overall, the observed time to response was 2 months for 41 (46.1%)patients, 2–4 months for 29 (32.6%) patients, 4–6 months for eight (9.0%)patients, and >6 months for 11 (12.4%) patients.
• Median DOR has not been reached (observed DOR range: 1.9–34.3 months).In responding patients, the estimated proportion of patients with ongoingresponse at 24 months was 69.4% (95% CI: 55.6–79.6) (Figure 3).
Treatment-emergent adverse events
• In total, 192 (99.5%) patients experienced at least one TEAE of any grade regardless of attribution (Table 3).
• Overall, the most common TEAEs of any grade were fatigue (n=67, 34.7%), diarrhea (n=53, 27.5%), and nausea (n=46, 23.8%).
• Grade ≥3 TEAEs regardless of attribution occurred in 94 (48.7%) of patients. The most common Grade ≥3 TEAEs were hypertension (n=9; 4.7%) and anemia and cellulitis (each n=8; 4.1%).
Clinical activity
• Complete response rates at primary analysis, ~1 year follow-up for Groups 1, 2, and 3, and ~2 year follow-up for Group 1 are shown in Figure 2.
• Among 89 responders, median time to complete response was 11.2 months (interquartile range [IQR], 7.4–14.8).
• Estimated median PFS was 18.4 months (95% CI: 10.3–24.3) for all patients. The Kaplan–Meier estimated progression-free probability at 24 months was 44.2% (95% CI: 36.1–52.1) (Figure 4A).
• Median OS has not been reached. The Kaplan–Meier estimated probabilityof OS at 24 months was 73.3% (95% CI: 66.1–79.2) (Figure 4B).
Figure 3. Kaplan–Meier curves of DOR per ICR
1.0
0.9
0.8
0.7
0.6
0.5
0.4
0.3
0.2
0.1
0.0
0 2 4 6 8 10 12 14 16 18 20 22 24 26 28 30 32 34 36 38 40P
rob
abili
ty o
f no
p
rog
ress
ion
or
dea
thMonth
Number of patients at risk30 30 29 28 23 23 23 23 23 20 18 16 16 16 10 9 6 2 0 0 0Group 1 (n=59)35 33 32 30 27 25 22 21 17 14 10 8 6 6 5 4 0 0 0 0 0Group 2 (n=78)24 24 24 23 21 21 20 19 17 11 5 0 0 0 0 0 0 0 0 0 0Group 3 (n=56)
Total (n=193) 89 87 85 81 71 69 65 63 57 45 33 24 22 22 15 13 6 2 0 0 0
Group 1 (mCSCC) 3 mg/kg Q2W (n=59)Group 2 (laCSCC) 3 mg/kg Q2W (n=78)Group 3 (mCSCC) 350 mg Q3W (n=56)Total (n=193)Figure 2. Complete response rates per ICR
25
20
15
10
5
0
Co
mp
lete
res
po
nse
rate
s (%
)
Group 1 (mCSCC)3 mg/kg Q2W
Group 2 (laCSCC)†
3 mg/kg Q2WGroup 3 (mCSCC)
350 mg Q3W
n=1012.8
n=35.4
n=46.8
n=1016.9
n=1220.3
n=1012.8
n=916.1
Primary ~1-year follow-up ~2-year follow-up
Figure 4. Kaplan–Meier curves for A) PFS per ICR and B) OS
Group 1 (mCSCC) 3 mg/kg Q2W (n=59)Group 2 (laCSCC) 3 mg/kg Q2W (n=78)Group 3 (mCSCC) 350 mg Q3W (n=56)Total (n=193)
1.00.90.80.70.60.50.40.30.20.10.0
0 2 4 6 8 10 12 14 16 18 20 22 24 26 28 30 32 34 36 38 40
Pro
bab
ility
of
OS
MonthNumber of patients at risk
59 56 52 49 47 46 41 39 39 38 38 37 35 33 24 16 11 4 1 0Group 1 (n=59) 4778 76 73 67 65 64 62 59 54 44 41 33 25 22 15 12 8 3 1 0Group 2 (n=78) 6556 52 49 46 45 38 38 38 37 29 20 9 2 0 0 0 0 0 0 0Group 3 (n=56) 44
Total (n=193) 193 184 174 162 157 156 148 141 136 130 111 99 79 62 55 39 28 19 7 2 0
B
Group 1 (mCSCC) 3 mg/kg Q2W (n=59)Group 2 (laCSCC) 3 mg/kg Q2W (n=78)Group 3 (mCSCC) 350 mg Q3W (n=56)Total (n=193)
1.00.90.80.70.60.50.40.30.20.10.0
0 2 4 6 8 10 12 14 16 18 20 22 24 26 28 30 32 34 36 38 40
Pro
bab
ility
of
PFS
MonthNumber of patients at risk
59 42 38 36 32 27 27 27 27 27 24 24 21 20 20 12 9 6 1 0 0Group 1 (n=59)78 61 48 43 39 37 33 29 26 20 17 16 12 10 7 5 5 2 0 0 0Group 2 (n=78)56 48 33 31 31 28 26 26 24 24 17 10 1 1 0 0 0 0 0 0 0Group 3 (n=56)193 151 119 110 102 92 86 82 77 71 58 50 34 31 27 17 14 8 1 0 0Total (n=193)
A
• Grade ≥3 treatment-related adverse events (TRAEs) were reported in 33 (17.1%) patients, with the most common being pneumonitis (n=5, 2.6%), autoimmune hepatitis (n=3; 1.6%), anemia, colitis, and diarrhea (all n=2; 1.0%).
• No new TEAEs resulting in death were reported compared to previousreports.9–11
†Among 23 laCSCC patients who were included in the pre-specified Group 2 interim analysis, there were no complete responses.
See poster #382 reporting post hoc analysis of health-related quality of life in the same patient population presented in this poster. Also see poster #433 that provides the design and rationale of a Phase 3, randomized, double-blind study of adjuvant cemiplimab versus placebo post-surgery and radiation in patients with high-risk CSCC.
References1. Que SKT et al. J Am Acad Dermatol. 2018;78:237–247.2. Cranmer LD et al. Oncologist. 2010;15:1320–1328.3. National Comprehensive Cancer Network. NCCN Clinical
practice guidelines in oncology: squamous cell skin cancer(Version 2.2019). 2018. Available at: https://www.nccn.org/professionals/physician_gls/pdf/squamous.pdf. [AccessedMarch 20, 2020].
4. Karia PS et al. J Clin Oncol. 2014;32:327–334.5. Weinberg AS et al. Dermatol Surg. 2007;33:885–899.
6. Schmults CD et al. JAMA Dermatol. 2013;149:541–547.7. Cowey C et al. Cancer Med. 2020 [in press].8. Burova E et al. Mol Cancer Ther. 2017;16:861–870.9. Migden MR et al. Lancet Oncol. 2020;21:294–305.
10. Migden MR et al. N Engl J Med. 2018;379:341–351.11. Rischin D et al. Poster presented at Maui Dermatology
Conference, January 25–29, 2020. 12. Eisenhauer EA et al. Eur J Cancer. 2009;45:228–247.
AcknowledgmentsThe authors would like to thank the patients, their families, all other investigators, and all investigational site members involved in this study.The study was funded by Regeneron Pharmaceuticals, Inc., and Sanofi. Medical writing support and typesetting was provided by KateCarolan, PhD, of Prime, Knutsford, UK, funded by Regeneron Pharmaceuticals, Inc.and Sanofi.For any questions or comments, please contact Dr Danny Rischin, [email protected]
Conclusions• For patients with advanced CSCC, cemiplimab achieved ORR of 46.1%.
• Patients had deepening responses over time as evidenced byincreasing complete response rates.9–11 Overall, the completeresponse rate is now 16.1% and median time to complete responsewas 11.2 months.
• DOR and OS are longer than what has been previously described withother agents.7
• With median DOR not reached after an additional 1 year of follow-up,this analysis indicates an increasing, clinically meaningful DORwith cemiplimab.
• The discontinuation rate, regardless of attribution, was low and mostTRAEs were Grades 1–2.
Background• Cutaneous squamous cell carcinoma (CSCC) is the second most
common cancer in the US and its incidence is increasing.1
• Most cases of CSCC are cured by complete surgical excision.2,3
However, a small but substantial number of patients present with eithermetastatic CSCC (mCSCC) or locally advanced CSCC (laCSCC) notamenable to curative surgery or curative radiotherapy (collectivelyreferred to as “advanced CSCC”), both of which have poor prognoses.4–6
• Historical data shows median overall survival (OS) of approximately 15 months with conventional chemotherapy or epidermal growth factor receptor inhibitors.7
• Cemiplimab is a high-affinity, highly potent human immunoglobulin G4 monoclonal antibody to the programmed cell death (PD)-1 receptor.8
• Cemiplimab monotherapy achieved clinically meaningful activity in patients with advanced CSCC and has a safety profile consistent with other anti–PD-1 inhibitors.9–11
• Based on initial data (median follow-up of 9.4 months in the pivotal study, NCT02760498), cemiplimab (cemiplimab-rwlc in the US) was approved for the treatment of patients with advanced CSCC.
Objective• The primary objective of the Phase 2 study was to evaluate the objective
response rate (ORR) by independent central review (ICR) per Response Evaluation Criteria In Solid Tumors version 1.1 (RECIST 1.1) (for scans)12
and modified World Health Organization (WHO) criteria (for photos).
• Key secondary objectives included ORR per investigator review (INV), duration of response (DOR) by ICR and INV, progression-free survival (PFS) by ICR and INV, OS, complete response rate by ICR, safety and tolerability, and assessment of health-related quality of life. Durable disease control rate, defined as the proportion of patients with response or stable disease for at least 105 days, was also examined.
- Please see poster #382 for results on health-related quality of life data from this study.
• Here, we present up to 3-year follow-up (median duration of follow-up for all patients: 15.7 months) from the largest and most mature prospective data set in advanced CSCC.
Methods• EMPOWER-CSCC-1 is an open-label, non-randomized, multicenter,
international Phase 2 study of patients with advanced CSCC.
• Patients received cemiplimab 3 mg/kg every 2 weeks (Q2W) (Group 1; mCSCC; Group 2, laCSCC) or cemiplimab 350 mg every 3 weeks (Q3W) (Group 3, mCSCC) (Figure 1).
• The severity of treatment-emergent adverse events (TEAEs) was graded according to the National Cancer Institute Common Terminology Criteria for Adverse Events (version 4.03).
• The data cut-off was October 11, 2019.
Presented at American Society of Clinical Oncology (ASCO) 2020 Virtual Scientific Meeting, May 29–31, 2020.
Group 1 – Adult patients with metastatic (nodal and/or distant) CSCC Cemiplimab 3 mg/kg
Q2W IV, for up to 96 weeks
Cemiplimab 350 mgQ3W IV, for up to
54 weeks
Tumor response assessment by ICR (RECIST 1.1 for scans; modified WHO criteria for photos)
Tumor imaging every 8 weeks for the
assessment of efficacy
Tumor imaging every 9 weeks for the
assessment of efficacy
Group 3 – Adult patients with metastatic (nodal and/or distant) CSCC
Group 2 – laCSCC
Key inclusion criteria• ECOG performance status of 0 or 1• Adequate organ function• Groups 1 and 3:
At least one lesion measurable by RECIST 1.1 • Group 2
At least one lesion measurable by digital medical photographyCSCC lesion that is not amenable to curative surgery or curative radiation therapy per investigators’ assessmentTumor biopsies at baseline and on day 29, for exploratory biomarker analysis, unless considered to have unacceptable safety risks by the investigator
Key exclusion criteria• Ongoing or recent (within 5 years) autoimmune disease requiring systemic immunosuppression• Prior treatments with anti–PD-1 or anti–PD-L1 therapy• History of solid organ transplant, concurrent malignancies (unless indolent or not considered life-threatening; for example, basal cell carcinoma), or hematologic malignancies
Figure 1. Study design
ECOG, Eastern Cooperative Oncology Group; IV, intravenously; PD-L1, PD-ligand 1.
Phase 2 Study of Cemiplimab in Patients with Advanced Cutaneous Squamous Cell Carcinoma (CSCC): Longer Follow-Up
Danny Rischin,1 Nikhil I. Khushalani,2 Chrysalyne D. Schmults,3 Alexander Guminski,4 Anne Lynn S. Chang,5 Karl D. Lewis,6 Annette M. Lim,1 Leonel Hernandez-Aya,7 Brett G.M. Hughes,8 Dirk Schadendorf,9 Axel Hauschild,10
Elizabeth Stankevich,11 Jocelyn Booth,11 Suk-Young Yoo,11 Zhen Chen,12 Emmanuel Okoye,13 Israel Lowy,12 Matthew G. Fury,12 Michael R. Migden14
1Department of Medical Oncology, Peter MacCallum Cancer Centre, Melbourne, Australia; 2Department of Cutaneous Oncology, Moffitt Cancer Center, Tampa, FL, USA; 3Department of Dermatology, Brigham and Women’s Hospital, Harvard Medical School, Boston, MA, USA; 4Department of Medical Oncology, Royal North Shore Hospital, St Leonards, Australia; 5Department of Dermatology, Stanford University School of Medicine, Redwood City, CA, USA; 6University of Colorado Denver, School of Medicine, Aurora, CO, USA;
7Division of Medical Oncology, Department of Medicine, Washington University School of Medicine, St Louis, MO, USA; 8Royal Brisbane & Women’s Hospital and University of Queensland, Brisbane, Australia; 9University Hospital Essen, Essen and German Cancer Consortium, Essen, Germany; 10Schleswig-Holstein University Hospital, Kiel, Germany; 11Regeneron Pharmaceuticals, Inc., Basking Ridge, NJ, USA; 12Regeneron Pharmaceuticals, Inc., Tarrytown, NY, USA; 13Regeneron Pharmaceuticals, Inc., London, UK;
14Departments of Dermatology and Head and Neck Surgery, University of Texas MD Anderson Cancer Center, Houston, TX, USA
ResultsPatients• A total of 193 patients were enrolled (Group 1, n=59; Group 2, n=78;
Group 3, n=56) (Table 1).
Table 1. Baseline demographics
Advanced CSCC(n=193)
Median age, years (range) 72.0 (38–96)Male, n (%) 161 (83.4)ECOG performance status, n (%)
0 86 (44.6)1 107 (55.4)
Primary CSCC site: head and neck, n (%) 131 (67.9)mCSCC, n (%) 115 (59.6)laCSCC, n (%) 78 (40.4)Patients with cemiplimab as first-line therapy, n (%) 128 (66.3)Patients with prior systemic therapy, n (%)† 65 (33.7)Median duration of exposure to cemiplimab, weeks (range) 51.1 (2.0–109.3)Median number of doses of cemiplimab administered (range) 18.0 (1–48)†Settings for prior lines of therapy included metastatic disease, adjuvant, chemotherapy with concurrent radiation, or other and the mostcommon types of prior systemic therapy were platinum compounds (n=46/65 [70.8%]) and monoclonal antibodies (n=18/65 [27.7%]).
Table 2. Duration of follow-up and tumor response to cemiplimab per ICR
Group 1 (mCSCC)3 mg/kg Q2W (n=59)
Group 2 (laCSCC)3 mg/kg Q2W (n=78)
Group 3 (mCSCC)350 mg Q3W (n=56)
Total (n=193)
Median duration of follow-up, months (range) 18.5 (1.1–36.1) 15.5 (0.8–35.6) 17.3 (0.6–26.3) 15.7 (0.6–36.1)ORR, % (95% CI) 50.8 (37.5–64.1) 44.9 (33.6–56.6) 42.9 (29.7–56.8) 46.1 (38.9–53.4)
Complete response, n (%) 12 (20.3) 10 (12.8) 9 (16.1) 31 (16.1)Partial response, n (%) 18 (30.5) 25 (32.1) 15 (26.8) 58 (30.1)Stable disease, n (%) 9 (15.3) 27 (34.6) 10 (17.9) 46 (23.8)Non-complete response/non-progressive disease, n (%) 3 (5.1) 0 2 (3.6) 5 (2.6)Progressive disease, n (%) 10 (16.9) 10 (12.8) 14 (25.0) 34 (17.6)Not evaluable, n (%) 7 (11.9) 6 (7.7) 6 (10.7) 19 (9.8)
Disease control rate, % (95% CI) 71.2 (57.9–82.2) 79.5 (68.8–87.8) 64.3 (50.4–76.6) 72.5 (65.7–78.7)Durable disease control rate,† % (95% CI) 61.0 (47.4–73.5) 62.8 (51.1–73.5) 57.1 (43.2–70.3) 60.6 (53.3–67.6)Median observed time to response, months (IQR)‡ 1.9 (1.8–2.0) 2.1 (1.9–3.8) 2.1 (2.1–4.2) 2.1 (1.9–3.7)
Median observed time to complete response, months (IQR)‡ 11.1 (7.5–18.4) 10.5 (7.4–12.9) 12.4 (8.2–16.6) 11.2 (7.4–14.8)Median DOR, months (range)‡ NR (20.7, NE) NR (18.4, NE) NR (NE, NE) NR (28.8, NE)Kaplan–Meier 12-month estimate of patients with ongoing response, % (95% CI) 89.5 (70.9–96.5) 83.2 (64.1–92.7) 91.7 (70.6–97.8) 87.8 (78.5–93.3)Kaplan–Meier 24-month estimate of patients with ongoing response, % (95% CI) 68.8 (46.9–83.2) 62.5 (38.4–79.4) NE (NE, NE) 69.4 (55.6–79.6)†Defined as the proportion of patients without progressive disease for at least 105 days.
‡Based on number of patients with confirmed complete or partial response.
ORR per INV was 54.4% (95% CI: 47.1–61.6) for all patients; 50.8% (95% CI: 37.5–64.1) for Group 1, 56.4% (95% CI: 44.7–67.6) for Group 2, and 55.4% (95% CI: 41.5–68.7) for Group 3. ORR per INV was 57.8% (95% CI: 48.8–66.5) among treatment-naïve patients and 47.7% (95% CI: 35.1–60.5) among previously treated patients.CI, confidence interval; NE, not evaluable; NR, not reached.
Table 3. TEAEs regardless of attribution
Advanced CSCC (n=193)
n (%) Any grade Grade ≥3Any 192 (99.5) 94 (48.7)Led to discontinuation 19 (9.8) 14 (7.3)Most common†
Fatigue 67 (34.7) 5 (2.6)Diarrhea 53 (27.5) 2 (1.0)Nausea 46 (23.8) 0Pruritus 41 (21.2) 0Rash 32 (16.6) 1 (0.5)Cough 32 (16.6) 0Arthralgia 28 (14.5) 1 (0.5)Constipation 26 (13.5) 1 (0.5)Vomiting 24 (12.4) 1 (0.5)Actinic keratosis 23 (11.9) 0Maculopapular rash 23 (11.9) 1 (0.5)Anemia 22 (11.4) 8 (4.1)Hypothyroidism 22 (11.4) 0Headache 21 (10.9) 0Upper respiratory tract infection 20 (10.4) 0
†TEAEs reported in ≥10% of patients, ordered by frequency of any grade.
367
• ORR per ICR was 46.1% (95% CI: 38.9–53.4) among all patients; 50.8% (95% CI: 37.5–64.1) for Group 1, 44.9% (95% CI: 33.6–56.6) for Group 2, and 42.9% (95% CI: 29.7–56.8) for Group 3 (Table 2).
• Per ICR, ORR was 48.4% and 41.5% among those who had not received prior anticancer systemic therapy (n=128) and those who had received prior anticancer systemic therapy (n=65), respectively.
• Overall, the observed time to response was 2 months for 41 (46.1%) patients, 2–4 months for 29 (32.6%) patients, 4–6 months for eight (9.0%) patients, and >6 months for 11 (12.4%) patients.
• Median DOR has not been reached (observed DOR range: 1.9–34.3 months). In responding patients, the estimated proportion of patients with ongoing response at 24 months was 69.4% (95% CI: 55.6–79.6) (Figure 3).
Treatment-emergent adverse events
• In total, 192 (99.5%) patients experienced at least one TEAE of any grade regardless of attribution (Table 3).
• Overall, the most common TEAEs of any grade were fatigue (n=67, 34.7%), diarrhea (n=53, 27.5%), and nausea (n=46, 23.8%).
• Grade ≥3 TEAEs regardless of attribution occurred in 94 (48.7%) of patients. The most common Grade ≥3 TEAEs were hypertension (n=9; 4.7%) and anemia and cellulitis (each n=8; 4.1%).
Clinical activity
• Complete response rates at primary analysis, ~1 year follow-up for Groups1, 2, and 3, and ~2 year follow-up for Group 1 are shown in Figure 2.
• Among 89 responders, median time to complete response was 11.2 months (interquartile range [IQR], 7.4–14.8).
• Estimated median PFS was 18.4 months (95% CI: 10.3–24.3) for all patients. The Kaplan–Meier estimated progression-free probability at 24 months was 44.2% (95% CI: 36.1–52.1) (Figure 4A).
• Median OS has not been reached. The Kaplan–Meier estimated probability of OS at 24 months was 73.3% (95% CI: 66.1–79.2) (Figure 4B).
Figure 3. Kaplan–Meier curves of DOR per ICR
1.0
0.9
0.8
0.7
0.6
0.5
0.4
0.3
0.2
0.1
0.0
0 2 4 6 8 10 12 14 16 18 20 22 24 26 28 30 32 34 36 38 40
Pro
bab
ility
of
no
pro
gre
ssio
n o
r d
eath
MonthNumber of patients at risk
30 30 29 28 23 23 23 23 23 20 18 16 16 16 10 9 6 2 0 0 0Group 1 (n=59)35 33 32 30 27 25 22 21 17 14 10 8 6 6 5 4 0 0 0 0 0Group 2 (n=78)24 24 24 23 21 21 20 19 17 11 5 0 0 0 0 0 0 0 0 0 0Group 3 (n=56)
Total (n=193) 89 87 85 81 71 69 65 63 57 45 33 24 22 22 15 13 6 2 0 0 0
Group 1 (mCSCC) 3 mg/kg Q2W (n=59)Group 2 (laCSCC) 3 mg/kg Q2W (n=78)Group 3 (mCSCC) 350 mg Q3W (n=56)Total (n=193)Figure 2. Complete response rates per ICR
25
20
15
10
5
0
Co
mp
lete
res
po
nse
rate
s (%
)
Group 1 (mCSCC)3 mg/kg Q2W
Group 2 (laCSCC)†
3 mg/kg Q2WGroup 3 (mCSCC)
350 mg Q3W
n=1012.8
n=35.4
n=46.8
n=1016.9
n=1220.3
n=1012.8
n=916.1
Primary ~1-year follow-up ~2-year follow-up
Figure 4. Kaplan–Meier curves for A) PFS per ICR and B) OS
Group 1 (mCSCC) 3 mg/kg Q2W (n=59)Group 2 (laCSCC) 3 mg/kg Q2W (n=78)Group 3 (mCSCC) 350 mg Q3W (n=56)Total (n=193)
1.00.90.80.70.60.50.40.30.20.10.0
0 2 4 6 8 10 12 14 16 18 20 22 24 26 28 30 32 34 36 38 40
Pro
bab
ility
of
OS
MonthNumber of patients at risk
59 56 52 49 47 46 41 39 39 38 38 37 35 33 24 16 11 4 1 0Group 1 (n=59) 4778 76 73 67 65 64 62 59 54 44 41 33 25 22 15 12 8 3 1 0Group 2 (n=78) 6556 52 49 46 45 38 38 38 37 29 20 9 2 0 0 0 0 0 0 0Group 3 (n=56) 44
Total (n=193) 193 184 174 162 157 156 148 141 136 130 111 99 79 62 55 39 28 19 7 2 0
B
Group 1 (mCSCC) 3 mg/kg Q2W (n=59)Group 2 (laCSCC) 3 mg/kg Q2W (n=78)Group 3 (mCSCC) 350 mg Q3W (n=56)Total (n=193)
1.00.90.80.70.60.50.40.30.20.10.0
0 2 4 6 8 10 12 14 16 18 20 22 24 26 28 30 32 34 36 38 40
Pro
bab
ility
of
PFS
MonthNumber of patients at risk
59 42 38 36 32 27 27 27 27 27 24 24 21 20 20 12 9 6 1 0 0Group 1 (n=59)78 61 48 43 39 37 33 29 26 20 17 16 12 10 7 5 5 2 0 0 0Group 2 (n=78)56 48 33 31 31 28 26 26 24 24 17 10 1 1 0 0 0 0 0 0 0Group 3 (n=56)193 151 119 110 102 92 86 82 77 71 58 50 34 31 27 17 14 8 1 0 0Total (n=193)
A
• Grade ≥3 treatment-related adverse events (TRAEs) were reported in 33 (17.1%) patients, with the most common being pneumonitis (n=5, 2.6%), autoimmune hepatitis (n=3; 1.6%), anemia, colitis, and diarrhea (all n=2; 1.0%).
• No new TEAEs resulting in death were reported compared to previousreports.9–11
†Among 23 laCSCC patients who were included in the pre-specified Group 2 interim analysis, there were no complete responses.
See poster #382 reporting post hoc analysis of health-related quality of life in the same patient population presented in this poster. Also see poster #433 that provides the design and rationale of a Phase 3, randomized, double-blind study of adjuvant cemiplimab versus placebo post-surgery and radiation in patients with high-risk CSCC.
References1. Que SKT et al. J Am Acad Dermatol. 2018;78:237–247.2. Cranmer LD et al. Oncologist. 2010;15:1320–1328.3. National Comprehensive Cancer Network. NCCN Clinical
practice guidelines in oncology: squamous cell skin cancer (Version 2.2019). 2018. Available at: https://www.nccn.org/professionals/physician_gls/pdf/squamous.pdf. [Accessed March 20, 2020].
4. Karia PS et al. J Clin Oncol. 2014;32:327–334.5. Weinberg AS et al. Dermatol Surg. 2007;33:885–899.
6. Schmults CD et al. JAMA Dermatol. 2013;149:541–547.7. Cowey C et al. Cancer Med. 2020 [in press].8. Burova E et al. Mol Cancer Ther. 2017;16:861–870.9. Migden MR et al. Lancet Oncol. 2020;21:294–305.
10. Migden MR et al. N Engl J Med. 2018;379:341–351.11. Rischin D et al. Poster presented at Maui Dermatology
Conference, January 25–29, 2020. 12. Eisenhauer EA et al. Eur J Cancer. 2009;45:228–247.
AcknowledgmentsThe authors would like to thank the patients, their families, all other investigators, and all investigational site members involved in this study. The study was funded by Regeneron Pharmaceuticals, Inc., and Sanofi. Medical writing support and typesetting was provided by Kate Carolan, PhD, of Prime, Knutsford, UK, funded by Regeneron Pharmaceuticals, Inc.and Sanofi.For any questions or comments, please contact Dr Danny Rischin, [email protected]
Conclusions• For patients with advanced CSCC, cemiplimab achieved ORR of 46.1%.
• Patients had deepening responses over time as evidenced by increasing complete response rates.9–11 Overall, the complete response rate is now 16.1% and median time to complete response was 11.2 months.
• DOR and OS are longer than what has been previously described with other agents.7
• With median DOR not reached after an additional 1 year of follow-up, this analysis indicates an increasing, clinically meaningful DOR with cemiplimab.
• The discontinuation rate, regardless of attribution, was low and most TRAEs were Grades 1–2.
Background• Cutaneous squamous cell carcinoma (CSCC) is the second most
common cancer in the US and its incidence is increasing.1
• Most cases of CSCC are cured by complete surgical excision.2,3
However, a small but substantial number of patients present with eithermetastatic CSCC (mCSCC) or locally advanced CSCC (laCSCC) notamenable to curative surgery or curative radiotherapy (collectivelyreferred to as “advanced CSCC”), both of which have poor prognoses.4–6
• Historical data shows median overall survival (OS) of approximately 15 months with conventional chemotherapy or epidermal growth factor receptor inhibitors.7
• Cemiplimab is a high-affinity, highly potent human immunoglobulin G4 monoclonal antibody to the programmed cell death (PD)-1 receptor.8
• Cemiplimab monotherapy achieved clinically meaningful activity in patients with advanced CSCC and has a safety profile consistent with other anti–PD-1 inhibitors.9–11
• Based on initial data (median follow-up of 9.4 months in the pivotal study, NCT02760498), cemiplimab (cemiplimab-rwlc in the US) was approved for the treatment of patients with advanced CSCC.
Objective• The primary objective of the Phase 2 study was to evaluate the objective
response rate (ORR) by independent central review (ICR) per Response Evaluation Criteria In Solid Tumors version 1.1 (RECIST 1.1) (for scans)12
and modified World Health Organization (WHO) criteria (for photos).
• Key secondary objectives included ORR per investigator review (INV), duration of response (DOR) by ICR and INV, progression-free survival (PFS) by ICR and INV, OS, complete response rate by ICR, safety and tolerability, and assessment of health-related quality of life. Durable disease control rate, defined as the proportion of patients with response or stable disease for at least 105 days, was also examined.
- Please see poster #382 for results on health-related quality of life data from this study.
• Here, we present up to 3-year follow-up (median duration of follow-up for all patients: 15.7 months) from the largest and most mature prospective data set in advanced CSCC.
Methods• EMPOWER-CSCC-1 is an open-label, non-randomized, multicenter,
international Phase 2 study of patients with advanced CSCC.
• Patients received cemiplimab 3 mg/kg every 2 weeks (Q2W) (Group 1; mCSCC; Group 2, laCSCC) or cemiplimab 350 mg every 3 weeks (Q3W) (Group 3, mCSCC) (Figure 1).
• The severity of treatment-emergent adverse events (TEAEs) was graded according to the National Cancer Institute Common Terminology Criteria for Adverse Events (version 4.03).
• The data cut-off was October 11, 2019.
Presented at American Society of Clinical Oncology (ASCO) 2020 Virtual Scientific Meeting, May 29–31, 2020.
Group 1 – Adult patients with metastatic (nodal and/or distant) CSCC Cemiplimab 3 mg/kg
Q2W IV, for up to 96 weeks
Cemiplimab 350 mgQ3W IV, for up to
54 weeks
Tumor response assessment by ICR (RECIST 1.1 for scans; modified WHO criteria for photos)
Tumor imaging every 8 weeks for the
assessment of efficacy
Tumor imaging every 9 weeks for the
assessment of efficacy
Group 3 – Adult patients with metastatic (nodal and/or distant) CSCC
Group 2 – laCSCC
Key inclusion criteria• ECOG performance status of 0 or 1• Adequate organ function• Groups 1 and 3:
At least one lesion measurable by RECIST 1.1 • Group 2
At least one lesion measurable by digital medical photographyCSCC lesion that is not amenable to curative surgery or curative radiation therapy per investigators’ assessmentTumor biopsies at baseline and on day 29, for exploratory biomarker analysis, unless considered to have unacceptable safety risks by the investigator
Key exclusion criteria• Ongoing or recent (within 5 years) autoimmune disease requiring systemic immunosuppression• Prior treatments with anti–PD-1 or anti–PD-L1 therapy• History of solid organ transplant, concurrent malignancies (unless indolent or not considered life-threatening; for example, basal cell carcinoma), or hematologic malignancies
Figure 1. Study design
ECOG, Eastern Cooperative Oncology Group; IV, intravenously; PD-L1, PD-ligand 1.
Phase 2 Study of Cemiplimab in Patients with Advanced Cutaneous Squamous Cell Carcinoma (CSCC): Longer Follow-Up
Danny Rischin,1 Nikhil I. Khushalani,2 Chrysalyne D. Schmults,3 Alexander Guminski,4 Anne Lynn S. Chang,5 Karl D. Lewis,6 Annette M. Lim,1 Leonel Hernandez-Aya,7 Brett G.M. Hughes,8 Dirk Schadendorf,9 Axel Hauschild,10
Elizabeth Stankevich,11 Jocelyn Booth,11 Suk-Young Yoo,11 Zhen Chen,12 Emmanuel Okoye,13 Israel Lowy,12 Matthew G. Fury,12 Michael R. Migden14
1Department of Medical Oncology, Peter MacCallum Cancer Centre, Melbourne, Australia; 2Department of Cutaneous Oncology, Moffitt Cancer Center, Tampa, FL, USA; 3Department of Dermatology, Brigham and Women’s Hospital, Harvard Medical School, Boston, MA, USA; 4Department of Medical Oncology, Royal North Shore Hospital, St Leonards, Australia; 5Department of Dermatology, Stanford University School of Medicine, Redwood City, CA, USA; 6University of Colorado Denver, School of Medicine, Aurora, CO, USA;
7Division of Medical Oncology, Department of Medicine, Washington University School of Medicine, St Louis, MO, USA; 8Royal Brisbane & Women’s Hospital and University of Queensland, Brisbane, Australia; 9University Hospital Essen, Essen and German Cancer Consortium, Essen, Germany; 10Schleswig-Holstein University Hospital, Kiel, Germany; 11Regeneron Pharmaceuticals, Inc., Basking Ridge, NJ, USA; 12Regeneron Pharmaceuticals, Inc., Tarrytown, NY, USA; 13Regeneron Pharmaceuticals, Inc., London, UK;
14Departments of Dermatology and Head and Neck Surgery, University of Texas MD Anderson Cancer Center, Houston, TX, USA
ResultsPatients• A total of 193 patients were enrolled (Group 1, n=59; Group 2, n=78;
Group 3, n=56) (Table 1).
Table 1. Baseline demographics
Advanced CSCC(n=193)
Median age, years (range) 72.0 (38–96)Male, n (%) 161 (83.4)ECOG performance status, n (%)
0 86 (44.6)1 107 (55.4)
Primary CSCC site: head and neck, n (%) 131 (67.9)mCSCC, n (%) 115 (59.6)laCSCC, n (%) 78 (40.4)Patients with cemiplimab as first-line therapy, n (%) 128 (66.3)Patients with prior systemic therapy, n (%)† 65 (33.7)Median duration of exposure to cemiplimab, weeks (range) 51.1 (2.0–109.3)Median number of doses of cemiplimab administered (range) 18.0 (1–48)†Settings for prior lines of therapy included metastatic disease, adjuvant, chemotherapy with concurrent radiation, or other and the mostcommon types of prior systemic therapy were platinum compounds (n=46/65 [70.8%]) and monoclonal antibodies (n=18/65 [27.7%]).
Table 2. Duration of follow-up and tumor response to cemiplimab per ICR
Group 1 (mCSCC)3 mg/kg Q2W (n=59)
Group 2 (laCSCC)3 mg/kg Q2W (n=78)
Group 3 (mCSCC)350 mg Q3W (n=56)
Total(n=193)
Median duration of follow-up, months (range) 18.5 (1.1–36.1) 15.5 (0.8–35.6) 17.3 (0.6–26.3) 15.7 (0.6–36.1)ORR, % (95% CI) 50.8 (37.5–64.1) 44.9 (33.6–56.6) 42.9 (29.7–56.8) 46.1 (38.9–53.4)
Complete response, n (%) 12 (20.3) 10 (12.8) 9 (16.1) 31 (16.1)Partial response, n (%) 18 (30.5) 25 (32.1) 15 (26.8) 58 (30.1)Stable disease, n (%) 9 (15.3) 27 (34.6) 10 (17.9) 46 (23.8)Non-complete response/non-progressive disease, n (%) 3 (5.1) 0 2 (3.6) 5 (2.6)Progressive disease, n (%) 10 (16.9) 10 (12.8) 14 (25.0) 34 (17.6)Not evaluable, n (%) 7 (11.9) 6 (7.7) 6 (10.7) 19 (9.8)
Disease control rate, % (95% CI) 71.2 (57.9–82.2) 79.5 (68.8–87.8) 64.3 (50.4–76.6) 72.5 (65.7–78.7)Durable disease control rate,† % (95% CI) 61.0 (47.4–73.5) 62.8 (51.1–73.5) 57.1 (43.2–70.3) 60.6 (53.3–67.6)Median observed time to response, months (IQR)‡ 1.9 (1.8–2.0) 2.1 (1.9–3.8) 2.1 (2.1–4.2) 2.1 (1.9–3.7)
Median observed time to complete response, months (IQR)‡ 11.1 (7.5–18.4) 10.5 (7.4–12.9) 12.4 (8.2–16.6) 11.2 (7.4–14.8)Median DOR, months (range)‡ NR (20.7, NE) NR (18.4, NE) NR (NE, NE) NR (28.8, NE)Kaplan–Meier 12-month estimate of patients with ongoing response, % (95% CI) 89.5 (70.9–96.5) 83.2 (64.1–92.7) 91.7 (70.6–97.8) 87.8 (78.5–93.3)Kaplan–Meier 24-month estimate of patients with ongoing response, % (95% CI) 68.8 (46.9–83.2) 62.5 (38.4–79.4) NE (NE, NE) 69.4 (55.6–79.6)†Defined as the proportion of patients without progressive disease for at least 105 days.‡Based on number of patients with confirmed complete or partial response.ORR per INV was 54.4% (95% CI: 47.1–61.6) for all patients; 50.8% (95% CI: 37.5–64.1) for Group 1, 56.4% (95% CI: 44.7–67.6) for Group 2, and 55.4% (95% CI: 41.5–68.7) for Group 3. ORR per INV was 57.8% (95% CI: 48.8–66.5) among treatment-naïve patients and 47.7% (95% CI: 35.1–60.5)among previously treated patients.CI, confidence interval; NE, not evaluable; NR, not reached.
Table 3. TEAEs regardless of attribution
Advanced CSCC (n=193)
n (%) Any grade Grade ≥3Any 192 (99.5) 94 (48.7)Led to discontinuation 19 (9.8) 14 (7.3)Most common†
Fatigue 67 (34.7) 5 (2.6)Diarrhea 53 (27.5) 2 (1.0)Nausea 46 (23.8) 0Pruritus 41 (21.2) 0Rash 32 (16.6) 1 (0.5)Cough 32 (16.6) 0Arthralgia 28 (14.5) 1 (0.5)Constipation 26 (13.5) 1 (0.5)Vomiting 24 (12.4) 1 (0.5)Actinic keratosis 23 (11.9) 0Maculopapular rash 23 (11.9) 1 (0.5)Anemia 22 (11.4) 8 (4.1)Hypothyroidism 22 (11.4) 0Headache 21 (10.9) 0Upper respiratory tract infection 20 (10.4) 0
†TEAEs reported in ≥10% of patients, ordered by frequency of any grade.
367
• ORR per ICR was 46.1% (95% CI: 38.9–53.4) among all patients; 50.8% (95% CI: 37.5–64.1) for Group 1, 44.9% (95% CI: 33.6–56.6) for Group 2, and 42.9% (95% CI: 29.7–56.8) for Group 3 (Table 2).
• Per ICR, ORR was 48.4% and 41.5% among those who had not received prior anticancer systemic therapy (n=128) and those who had received prior anticancer systemic therapy (n=65), respectively.
• Overall, the observed time to response was 2 months for 41 (46.1%)patients, 2–4 months for 29 (32.6%) patients, 4–6 months for eight (9.0%)patients, and >6 months for 11 (12.4%) patients.
• Median DOR has not been reached (observed DOR range: 1.9–34.3 months).In responding patients, the estimated proportion of patients with ongoingresponse at 24 months was 69.4% (95% CI: 55.6–79.6) (Figure 3).
Treatment-emergent adverse events
• In total, 192 (99.5%) patients experienced at least one TEAE of any grade regardless of attribution (Table 3).
• Overall, the most common TEAEs of any grade were fatigue (n=67, 34.7%), diarrhea (n=53, 27.5%), and nausea (n=46, 23.8%).
• Grade ≥3 TEAEs regardless of attribution occurred in 94 (48.7%) of patients. The most common Grade ≥3 TEAEs were hypertension (n=9; 4.7%) and anemia and cellulitis (each n=8; 4.1%).
Clinical activity
• Complete response rates at primary analysis, ~1 year follow-up for Groups1, 2, and 3, and ~2 year follow-up for Group 1 are shown in Figure 2.
• Among 89 responders, median time to complete response was 11.2 months (interquartile range [IQR], 7.4–14.8).
• Estimated median PFS was 18.4 months (95% CI: 10.3–24.3) for all patients. The Kaplan–Meier estimated progression-free probability at 24 months was 44.2% (95% CI: 36.1–52.1) (Figure 4A).
• Median OS has not been reached. The Kaplan–Meier estimated probabilityof OS at 24 months was 73.3% (95% CI: 66.1–79.2) (Figure 4B).
Figure 3. Kaplan–Meier curves of DOR per ICR
1.0
0.9
0.8
0.7
0.6
0.5
0.4
0.3
0.2
0.1
0.0
0 2 4 6 8 10 12 14 16 18 20 22 24 26 28 30 32 34 36 38 40
Pro
bab
ility
of
no
pro
gre
ssio
n o
r d
eath
MonthNumber of patients at risk
30 30 29 28 23 23 23 23 23 20 18 16 16 16 10 9 6 2 0 0 0Group 1 (n=59)35 33 32 30 27 25 22 21 17 14 10 8 6 6 5 4 0 0 0 0 0Group 2 (n=78)24 24 24 23 21 21 20 19 17 11 5 0 0 0 0 0 0 0 0 0 0Group 3 (n=56)
Total (n=193) 89 87 85 81 71 69 65 63 57 45 33 24 22 22 15 13 6 2 0 0 0
Group 1 (mCSCC) 3 mg/kg Q2W (n=59)Group 2 (laCSCC) 3 mg/kg Q2W (n=78)Group 3 (mCSCC) 350 mg Q3W (n=56)Total (n=193)Figure 2. Complete response rates per ICR
25
20
15
10
5
0
Co
mp
lete
res
po
nse
rate
s (%
)
Group 1 (mCSCC)3 mg/kg Q2W
Group 2 (laCSCC)†
3 mg/kg Q2WGroup 3 (mCSCC)
350 mg Q3W
n=1012.8
n=35.4
n=46.8
n=1016.9
n=1220.3
n=1012.8
n=916.1
Primary ~1-year follow-up ~2-year follow-up
Figure 4. Kaplan–Meier curves for A) PFS per ICR and B) OS
Group 1 (mCSCC) 3 mg/kg Q2W (n=59)Group 2 (laCSCC) 3 mg/kg Q2W (n=78)Group 3 (mCSCC) 350 mg Q3W (n=56)Total (n=193)
1.00.90.80.70.60.50.40.30.20.10.0
0 2 4 6 8 10 12 14 16 18 20 22 24 26 28 30 32 34 36 38 40
Pro
bab
ility
of
OS
MonthNumber of patients at risk
59 56 52 49 47 46 41 39 39 38 38 37 35 33 24 16 11 4 1 0Group 1 (n=59) 4778 76 73 67 65 64 62 59 54 44 41 33 25 22 15 12 8 3 1 0Group 2 (n=78) 6556 52 49 46 45 38 38 38 37 29 20 9 2 0 0 0 0 0 0 0Group 3 (n=56) 44
Total (n=193) 193 184 174 162 157 156 148 141 136 130 111 99 79 62 55 39 28 19 7 2 0
B
Group 1 (mCSCC) 3 mg/kg Q2W (n=59)Group 2 (laCSCC) 3 mg/kg Q2W (n=78)Group 3 (mCSCC) 350 mg Q3W (n=56)Total (n=193)
1.00.90.80.70.60.50.40.30.20.10.0
0 2 4 6 8 10 12 14 16 18 20 22 24 26 28 30 32 34 36 38 40
Pro
bab
ility
of
PFS
MonthNumber of patients at risk
59 42 38 36 32 27 27 27 27 27 24 24 21 20 20 12 9 6 1 0 0Group 1 (n=59)78 61 48 43 39 37 33 29 26 20 17 16 12 10 7 5 5 2 0 0 0Group 2 (n=78)56 48 33 31 31 28 26 26 24 24 17 10 1 1 0 0 0 0 0 0 0Group 3 (n=56)193 151 119 110 102 92 86 82 77 71 58 50 34 31 27 17 14 8 1 0 0Total (n=193)
A
• Grade ≥3 treatment-related adverse events (TRAEs) were reported in 33 (17.1%) patients, with the most common being pneumonitis (n=5, 2.6%), autoimmune hepatitis (n=3; 1.6%), anemia, colitis, and diarrhea (all n=2; 1.0%).
• No new TEAEs resulting in death were reported compared to previous reports.9–11
†Among 23 laCSCC patients who were included in the pre-specified Group 2 interim analysis, there were no complete responses.
See poster #382 reporting post hoc analysis of health-related quality of life in the same patient population presented in this poster. Also see poster #433 that provides the design and rationale of a Phase 3, randomized, double-blind study of adjuvant cemiplimab versus placebo post-surgery and radiation in patients with high-risk CSCC.
References1. Que SKT et al. J Am Acad Dermatol. 2018;78:237–247.2. Cranmer LD et al. Oncologist. 2010;15:1320–1328.3. National Comprehensive Cancer Network. NCCN Clinical
practice guidelines in oncology: squamous cell skin cancer(Version 2.2019). 2018. Available at: https://www.nccn.org/professionals/physician_gls/pdf/squamous.pdf. [AccessedMarch 20, 2020].
4. Karia PS et al. J Clin Oncol. 2014;32:327–334.5. Weinberg AS et al. Dermatol Surg. 2007;33:885–899.
6. Schmults CD et al. JAMA Dermatol. 2013;149:541–547.7. Cowey C et al. Cancer Med. 2020 [in press].8. Burova E et al. Mol Cancer Ther. 2017;16:861–870.9. Migden MR et al. Lancet Oncol. 2020;21:294–305.
10. Migden MR et al. N Engl J Med. 2018;379:341–351.11. Rischin D et al. Poster presented at Maui Dermatology
Conference, January 25–29, 2020. 12. Eisenhauer EA et al. Eur J Cancer. 2009;45:228–247.
AcknowledgmentsThe authors would like to thank the patients, their families, all other investigators, and all investigational site members involved in this study.The study was funded by Regeneron Pharmaceuticals, Inc., and Sanofi. Medical writing support and typesetting was provided by KateCarolan, PhD, of Prime, Knutsford, UK, funded by Regeneron Pharmaceuticals, Inc.and Sanofi.For any questions or comments, please contact Dr Danny Rischin, [email protected]
Conclusions• For patients with advanced CSCC, cemiplimab achieved ORR of 46.1%.
• Patients had deepening responses over time as evidenced byincreasing complete response rates.9–11 Overall, the completeresponse rate is now 16.1% and median time to complete responsewas 11.2 months.
• DOR and OS are longer than what has been previously described withother agents.7
• With median DOR not reached after an additional 1 year of follow-up,this analysis indicates an increasing, clinically meaningful DORwith cemiplimab.
• The discontinuation rate, regardless of attribution, was low and mostTRAEs were Grades 1–2.
Background• Cutaneous squamous cell carcinoma (CSCC) is the second most
common cancer in the US and its incidence is increasing.1
• Most cases of CSCC are cured by complete surgical excision.2,3
However, a small but substantial number of patients present with eithermetastatic CSCC (mCSCC) or locally advanced CSCC (laCSCC) notamenable to curative surgery or curative radiotherapy (collectivelyreferred to as “advanced CSCC”), both of which have poor prognoses.4–6
• Historical data shows median overall survival (OS) of approximately 15 months with conventional chemotherapy or epidermal growth factor receptor inhibitors.7
• Cemiplimab is a high-affinity, highly potent human immunoglobulin G4 monoclonal antibody to the programmed cell death (PD)-1 receptor.8
• Cemiplimab monotherapy achieved clinically meaningful activity in patients with advanced CSCC and has a safety profile consistent with other anti–PD-1 inhibitors.9–11
• Based on initial data (median follow-up of 9.4 months in the pivotal study, NCT02760498), cemiplimab (cemiplimab-rwlc in the US) was approved for the treatment of patients with advanced CSCC.
Objective• The primary objective of the Phase 2 study was to evaluate the objective
response rate (ORR) by independent central review (ICR) per Response Evaluation Criteria In Solid Tumors version 1.1 (RECIST 1.1) (for scans)12
and modified World Health Organization (WHO) criteria (for photos).
• Key secondary objectives included ORR per investigator review (INV), duration of response (DOR) by ICR and INV, progression-free survival (PFS) by ICR and INV, OS, complete response rate by ICR, safety and tolerability, and assessment of health-related quality of life. Durable disease control rate, defined as the proportion of patients with response or stable disease for at least 105 days, was also examined.
- Please see poster #382 for results on health-related quality of life data from this study.
• Here, we present up to 3-year follow-up (median duration of follow-up for all patients: 15.7 months) from the largest and most mature prospective data set in advanced CSCC.
Methods• EMPOWER-CSCC-1 is an open-label, non-randomized, multicenter,
international Phase 2 study of patients with advanced CSCC.
• Patients received cemiplimab 3 mg/kg every 2 weeks (Q2W) (Group 1; mCSCC; Group 2, laCSCC) or cemiplimab 350 mg every 3 weeks (Q3W) (Group 3, mCSCC) (Figure 1).
• The severity of treatment-emergent adverse events (TEAEs) was graded according to the National Cancer Institute Common Terminology Criteria for Adverse Events (version 4.03).
• The data cut-off was October 11, 2019.
Presented at American Society of Clinical Oncology (ASCO) 2020 Virtual Scientific Meeting, May 29–31, 2020.
Group 1 – Adult patients with metastatic (nodal and/or distant) CSCC Cemiplimab 3 mg/kg
Q2W IV, for up to 96 weeks
Cemiplimab 350 mgQ3W IV, for up to
54 weeks
Tumor response assessment by ICR (RECIST 1.1 for scans; modified WHO criteria for photos)
Tumor imaging every 8 weeks for the
assessment of efficacy
Tumor imaging every 9 weeks for the
assessment of efficacy
Group 3 – Adult patients with metastatic (nodal and/or distant) CSCC
Group 2 – laCSCC
Key inclusion criteria• ECOG performance status of 0 or 1• Adequate organ function• Groups 1 and 3:
At least one lesion measurable by RECIST 1.1 • Group 2
At least one lesion measurable by digital medical photographyCSCC lesion that is not amenable to curative surgery or curative radiation therapy per investigators’ assessmentTumor biopsies at baseline and on day 29, for exploratory biomarker analysis, unless considered to have unacceptable safety risks by the investigator
Key exclusion criteria• Ongoing or recent (within 5 years) autoimmune disease requiring systemic immunosuppression• Prior treatments with anti–PD-1 or anti–PD-L1 therapy• History of solid organ transplant, concurrent malignancies (unless indolent or not considered life-threatening; for example, basal cell carcinoma), or hematologic malignancies
Figure 1. Study design
ECOG, Eastern Cooperative Oncology Group; IV, intravenously; PD-L1, PD-ligand 1.
Phase 2 Study of Cemiplimab in Patients with Advanced Cutaneous Squamous Cell Carcinoma (CSCC): Longer Follow-Up
Danny Rischin,1 Nikhil I. Khushalani,2 Chrysalyne D. Schmults,3 Alexander Guminski,4 Anne Lynn S. Chang,5 Karl D. Lewis,6 Annette M. Lim,1 Leonel Hernandez-Aya,7 Brett G.M. Hughes,8 Dirk Schadendorf,9 Axel Hauschild,10
Elizabeth Stankevich,11 Jocelyn Booth,11 Suk-Young Yoo,11 Zhen Chen,12 Emmanuel Okoye,13 Israel Lowy,12 Matthew G. Fury,12 Michael R. Migden14
1Department of Medical Oncology, Peter MacCallum Cancer Centre, Melbourne, Australia; 2Department of Cutaneous Oncology, Moffitt Cancer Center, Tampa, FL, USA; 3Department of Dermatology, Brigham and Women’s Hospital, Harvard Medical School, Boston, MA, USA; 4Department of Medical Oncology, Royal North Shore Hospital, St Leonards, Australia; 5Department of Dermatology, Stanford University School of Medicine, Redwood City, CA, USA; 6University of Colorado Denver, School of Medicine, Aurora, CO, USA;
7Division of Medical Oncology, Department of Medicine, Washington University School of Medicine, St Louis, MO, USA; 8Royal Brisbane & Women’s Hospital and University of Queensland, Brisbane, Australia; 9University Hospital Essen, Essen and German Cancer Consortium, Essen, Germany; 10Schleswig-Holstein University Hospital, Kiel, Germany; 11Regeneron Pharmaceuticals, Inc., Basking Ridge, NJ, USA; 12Regeneron Pharmaceuticals, Inc., Tarrytown, NY, USA; 13Regeneron Pharmaceuticals, Inc., London, UK;
14Departments of Dermatology and Head and Neck Surgery, University of Texas MD Anderson Cancer Center, Houston, TX, USA
ResultsPatients• A total of 193 patients were enrolled (Group 1, n=59; Group 2, n=78;
Group 3, n=56) (Table 1).
Table 1. Baseline demographics
Advanced CSCC(n=193)
Median age, years (range) 72.0 (38–96)Male, n (%) 161 (83.4)ECOG performance status, n (%)
0 86 (44.6)1 107 (55.4)
Primary CSCC site: head and neck, n (%) 131 (67.9)mCSCC, n (%) 115 (59.6)laCSCC, n (%) 78 (40.4)Patients with cemiplimab as first-line therapy, n (%) 128 (66.3)Patients with prior systemic therapy, n (%)† 65 (33.7)Median duration of exposure to cemiplimab, weeks (range) 51.1 (2.0–109.3)Median number of doses of cemiplimab administered (range) 18.0 (1–48)†Settings for prior lines of therapy included metastatic disease, adjuvant, chemotherapy with concurrent radiation, or other and the mostcommon types of prior systemic therapy were platinum compounds (n=46/65 [70.8%]) and monoclonal antibodies (n=18/65 [27.7%]).
Table 2. Duration of follow-up and tumor response to cemiplimab per ICR
Group 1 (mCSCC)3 mg/kg Q2W (n=59)
Group 2 (laCSCC)3 mg/kg Q2W (n=78)
Group 3 (mCSCC)350 mg Q3W (n=56)
Total(n=193)
Median duration of follow-up, months (range) 18.5 (1.1–36.1) 15.5 (0.8–35.6) 17.3 (0.6–26.3) 15.7 (0.6–36.1)ORR, % (95% CI) 50.8 (37.5–64.1) 44.9 (33.6–56.6) 42.9 (29.7–56.8) 46.1 (38.9–53.4)
Complete response, n (%) 12 (20.3) 10 (12.8) 9 (16.1) 31 (16.1)Partial response, n (%) 18 (30.5) 25 (32.1) 15 (26.8) 58 (30.1)Stable disease, n (%) 9 (15.3) 27 (34.6) 10 (17.9) 46 (23.8)Non-complete response/non-progressive disease, n (%) 3 (5.1) 0 2 (3.6) 5 (2.6)Progressive disease, n (%) 10 (16.9) 10 (12.8) 14 (25.0) 34 (17.6)Not evaluable, n (%) 7 (11.9) 6 (7.7) 6 (10.7) 19 (9.8)
Disease control rate, % (95% CI) 71.2 (57.9–82.2) 79.5 (68.8–87.8) 64.3 (50.4–76.6) 72.5 (65.7–78.7)Durable disease control rate,† % (95% CI) 61.0 (47.4–73.5) 62.8 (51.1–73.5) 57.1 (43.2–70.3) 60.6 (53.3–67.6)Median observed time to response, months (IQR)‡ 1.9 (1.8–2.0) 2.1 (1.9–3.8) 2.1 (2.1–4.2) 2.1 (1.9–3.7)
Median observed time to complete response, months (IQR)‡ 11.1 (7.5–18.4) 10.5 (7.4–12.9) 12.4 (8.2–16.6) 11.2 (7.4–14.8)Median DOR, months (range)‡ NR (20.7, NE) NR (18.4, NE) NR (NE, NE) NR (28.8, NE)Kaplan–Meier 12-month estimate of patients with ongoing response, % (95% CI) 89.5 (70.9–96.5) 83.2 (64.1–92.7) 91.7 (70.6–97.8) 87.8 (78.5–93.3)Kaplan–Meier 24-month estimate of patients with ongoing response, % (95% CI) 68.8 (46.9–83.2) 62.5 (38.4–79.4) NE (NE, NE) 69.4 (55.6–79.6)†Defined as the proportion of patients without progressive disease for at least 105 days.‡Based on number of patients with confirmed complete or partial response.ORR per INV was 54.4% (95% CI: 47.1–61.6) for all patients; 50.8% (95% CI: 37.5–64.1) for Group 1, 56.4% (95% CI: 44.7–67.6) for Group 2, and 55.4% (95% CI: 41.5–68.7) for Group 3. ORR per INV was 57.8% (95% CI: 48.8–66.5) among treatment-naïve patients and 47.7% (95% CI: 35.1–60.5)among previously treated patients.CI, confidence interval; NE, not evaluable; NR, not reached.
Table 3. TEAEs regardless of attribution
Advanced CSCC (n=193)
n (%) Any grade Grade ≥3Any 192 (99.5) 94 (48.7)Led to discontinuation 19 (9.8) 14 (7.3)Most common†
Fatigue 67 (34.7) 5 (2.6)Diarrhea 53 (27.5) 2 (1.0)Nausea 46 (23.8) 0Pruritus 41 (21.2) 0Rash 32 (16.6) 1 (0.5)Cough 32 (16.6) 0Arthralgia 28 (14.5) 1 (0.5)Constipation 26 (13.5) 1 (0.5)Vomiting 24 (12.4) 1 (0.5)Actinic keratosis 23 (11.9) 0Maculopapular rash 23 (11.9) 1 (0.5)Anemia 22 (11.4) 8 (4.1)Hypothyroidism 22 (11.4) 0Headache 21 (10.9) 0Upper respiratory tract infection 20 (10.4) 0
†TEAEs reported in ≥10% of patients, ordered by frequency of any grade.
367
• ORR per ICR was 46.1% (95% CI: 38.9–53.4) among all patients; 50.8% (95% CI: 37.5–64.1) for Group 1, 44.9% (95% CI: 33.6–56.6) for Group 2, and 42.9% (95% CI: 29.7–56.8) for Group 3 (Table 2).
• Per ICR, ORR was 48.4% and 41.5% among those who had not received prior anticancer systemic therapy (n=128) and those who had received prior anticancer systemic therapy (n=65), respectively.
• Overall, the observed time to response was 2 months for 41 (46.1%)patients, 2–4 months for 29 (32.6%) patients, 4–6 months for eight (9.0%)patients, and >6 months for 11 (12.4%) patients.
• Median DOR has not been reached (observed DOR range: 1.9–34.3 months).In responding patients, the estimated proportion of patients with ongoingresponse at 24 months was 69.4% (95% CI: 55.6–79.6) (Figure 3).
Treatment-emergent adverse events
• In total, 192 (99.5%) patients experienced at least one TEAE of any grade regardless of attribution (Table 3).
• Overall, the most common TEAEs of any grade were fatigue (n=67, 34.7%), diarrhea (n=53, 27.5%), and nausea (n=46, 23.8%).
• Grade ≥3 TEAEs regardless of attribution occurred in 94 (48.7%) of patients. The most common Grade ≥3 TEAEs were hypertension (n=9; 4.7%) and anemia and cellulitis (each n=8; 4.1%).
Clinical activity
• Complete response rates at primary analysis, ~1 year follow-up for Groups1, 2, and 3, and ~2 year follow-up for Group 1 are shown in Figure 2.
• Among 89 responders, median time to complete response was 11.2 months (interquartile range [IQR], 7.4–14.8).
• Estimated median PFS was 18.4 months (95% CI: 10.3–24.3) for all patients. The Kaplan–Meier estimated progression-free probability at 24 months was 44.2% (95% CI: 36.1–52.1) (Figure 4A).
• Median OS has not been reached. The Kaplan–Meier estimated probabilityof OS at 24 months was 73.3% (95% CI: 66.1–79.2) (Figure 4B).
Figure 3. Kaplan–Meier curves of DOR per ICR
1.0
0.9
0.8
0.7
0.6
0.5
0.4
0.3
0.2
0.1
0.0
0 2 4 6 8 10 12 14 16 18 20 22 24 26 28 30 32 34 36 38 40
Pro
bab
ility
of
no
pro
gre
ssio
n o
r d
eath
MonthNumber of patients at risk
30 30 29 28 23 23 23 23 23 20 18 16 16 16 10 9 6 2 0 0 0Group 1 (n=59)35 33 32 30 27 25 22 21 17 14 10 8 6 6 5 4 0 0 0 0 0Group 2 (n=78)24 24 24 23 21 21 20 19 17 11 5 0 0 0 0 0 0 0 0 0 0Group 3 (n=56)
Total (n=193) 89 87 85 81 71 69 65 63 57 45 33 24 22 22 15 13 6 2 0 0 0
Group 1 (mCSCC) 3 mg/kg Q2W (n=59)Group 2 (laCSCC) 3 mg/kg Q2W (n=78)Group 3 (mCSCC) 350 mg Q3W (n=56)Total (n=193)Figure 2. Complete response rates per ICR
25
20
15
10
5
0
Co
mp
lete
res
po
nse
rate
s (%
)
Group 1 (mCSCC)3 mg/kg Q2W
Group 2 (laCSCC)†
3 mg/kg Q2WGroup 3 (mCSCC)
350 mg Q3W
n=1012.8
n=35.4
n=46.8
n=1016.9
n=1220.3
n=1012.8
n=916.1
Primary ~1-year follow-up ~2-year follow-up
Figure 4. Kaplan–Meier curves for A) PFS per ICR and B) OS
Group 1 (mCSCC) 3 mg/kg Q2W (n=59)Group 2 (laCSCC) 3 mg/kg Q2W (n=78)Group 3 (mCSCC) 350 mg Q3W (n=56)Total (n=193)
1.00.90.80.70.60.50.40.30.20.10.0
0 2 4 6 8 10 12 14 16 18 20 22 24 26 28 30 32 34 36 38 40
Pro
bab
ility
of
OS
MonthNumber of patients at risk
59 56 52 49 47 46 41 39 39 38 38 37 35 33 24 16 11 4 1 0Group 1 (n=59) 4778 76 73 67 65 64 62 59 54 44 41 33 25 22 15 12 8 3 1 0Group 2 (n=78) 6556 52 49 46 45 38 38 38 37 29 20 9 2 0 0 0 0 0 0 0Group 3 (n=56) 44
Total (n=193) 193 184 174 162 157 156 148 141 136 130 111 99 79 62 55 39 28 19 7 2 0
B
Group 1 (mCSCC) 3 mg/kg Q2W (n=59)Group 2 (laCSCC) 3 mg/kg Q2W (n=78)Group 3 (mCSCC) 350 mg Q3W (n=56)Total (n=193)
1.00.90.80.70.60.50.40.30.20.10.0
0 2 4 6 8 10 12 14 16 18 20 22 24 26 28 30 32 34 36 38 40
Pro
bab
ility
of
PFS
MonthNumber of patients at risk
59 42 38 36 32 27 27 27 27 27 24 24 21 20 20 12 9 6 1 0 0Group 1 (n=59)78 61 48 43 39 37 33 29 26 20 17 16 12 10 7 5 5 2 0 0 0Group 2 (n=78)56 48 33 31 31 28 26 26 24 24 17 10 1 1 0 0 0 0 0 0 0Group 3 (n=56)193 151 119 110 102 92 86 82 77 71 58 50 34 31 27 17 14 8 1 0 0Total (n=193)
A
• Grade ≥3 treatment-related adverse events (TRAEs) were reported in 33 (17.1%) patients, with the most common being pneumonitis (n=5, 2.6%), autoimmune hepatitis (n=3; 1.6%), anemia, colitis, and diarrhea (all n=2; 1.0%).
• No new TEAEs resulting in death were reported compared to previousreports.9–11
†Among 23 laCSCC patients who were included in the pre-specified Group 2 interim analysis, there were no complete responses.
See poster #382 reporting post hoc analysis of health-related quality of life in the same patient population presented in this poster. Also see poster #433 that provides the design and rationale of a Phase 3, randomized, double-blind study of adjuvant cemiplimab versus placebo post-surgery and radiation in patients with high-risk CSCC.
References1. Que SKT et al. J Am Acad Dermatol. 2018;78:237–247.2. Cranmer LD et al. Oncologist. 2010;15:1320–1328.3. National Comprehensive Cancer Network. NCCN Clinical
practice guidelines in oncology: squamous cell skin cancer (Version 2.2019). 2018. Available at: https://www.nccn.org/professionals/physician_gls/pdf/squamous.pdf. [Accessed March 20, 2020].
4. Karia PS et al. J Clin Oncol. 2014;32:327–334.5. Weinberg AS et al. Dermatol Surg. 2007;33:885–899.
6. Schmults CD et al. JAMA Dermatol. 2013;149:541–547.7. Cowey C et al. Cancer Med. 2020 [in press].8. Burova E et al. Mol Cancer Ther. 2017;16:861–870.9. Migden MR et al. Lancet Oncol. 2020;21:294–305.
10. Migden MR et al. N Engl J Med. 2018;379:341–351.11. Rischin D et al. Poster presented at Maui Dermatology
Conference, January 25–29, 2020. 12. Eisenhauer EA et al. Eur J Cancer. 2009;45:228–247.
AcknowledgmentsThe authors would like to thank the patients, their families, all other investigators, and all investigational site members involved in this study. The study was funded by Regeneron Pharmaceuticals, Inc., and Sanofi. Medical writing support and typesetting was provided by Kate Carolan, PhD, of Prime, Knutsford, UK, funded by Regeneron Pharmaceuticals, Inc.and Sanofi.For any questions or comments, please contact Dr Danny Rischin, [email protected]
Conclusions• For patients with advanced CSCC, cemiplimab achieved ORR of 46.1%.
• Patients had deepening responses over time as evidenced byincreasing complete response rates.9–11 Overall, the complete response rate is now 16.1% and median time to complete responsewas 11.2 months.
• DOR and OS are longer than what has been previously described with other agents.7
• With median DOR not reached after an additional 1 year of follow-up, this analysis indicates an increasing, clinically meaningful DOR with cemiplimab.
• The discontinuation rate, regardless of attribution, was low and most TRAEs were Grades 1–2.
Background• Cutaneous squamous cell carcinoma (CSCC) is the second most
common cancer in the US and its incidence is increasing.1
• Most cases of CSCC are cured by complete surgical excision.2,3 However, a small but substantial number of patients present with either metastatic CSCC (mCSCC) or locally advanced CSCC (laCSCC) not amenable to curative surgery or curative radiotherapy (collectively referred to as “advanced CSCC”), both of which have poor prognoses.4–6
• Historical data shows median overall survival (OS) of approximately 15 months with conventional chemotherapy or epidermal growth factor receptor inhibitors.7
• Cemiplimab is a high-affinity, highly potent human immunoglobulin G4 monoclonal antibody to the programmed cell death (PD)-1 receptor.8
• Cemiplimab monotherapy achieved clinically meaningful activity in patients with advanced CSCC and has a safety profile consistent with other anti–PD-1 inhibitors.9–11
• Based on initial data (median follow-up of 9.4 months in the pivotal study, NCT02760498), cemiplimab (cemiplimab-rwlc in the US) was approved for the treatment of patients with advanced CSCC.
Objective• The primary objective of the Phase 2 study was to evaluate the objective
response rate (ORR) by independent central review (ICR) per Response Evaluation Criteria In Solid Tumors version 1.1 (RECIST 1.1) (for scans)12
and modified World Health Organization (WHO) criteria (for photos).
• Key secondary objectives included ORR per investigator review (INV), duration of response (DOR) by ICR and INV, progression-free survival (PFS) by ICR and INV, OS, complete response rate by ICR, safety and tolerability, and assessment of health-related quality of life. Durable disease control rate, defined as the proportion of patients with response or stable disease for at least 105 days, was also examined.
- Please see poster #382 for results on health-related quality of life data from this study.
• Here, we present up to 3-year follow-up (median duration of follow-up for all patients: 15.7 months) from the largest and most mature prospective data set in advanced CSCC.
Methods• EMPOWER-CSCC-1 is an open-label, non-randomized, multicenter,
international Phase 2 study of patients with advanced CSCC.
• Patients received cemiplimab 3 mg/kg every 2 weeks (Q2W) (Group 1; mCSCC; Group 2, laCSCC) or cemiplimab 350 mg every 3 weeks (Q3W) (Group 3, mCSCC) (Figure 1).
• The severity of treatment-emergent adverse events (TEAEs) was graded according to the National Cancer Institute Common Terminology Criteria for Adverse Events (version 4.03).
• The data cut-off was October 11, 2019.
Presented at American Society of Clinical Oncology (ASCO) 2020 Virtual Scientific Meeting, May 29–31, 2020.
Group 1 – Adult patients with metastatic (nodal and/or distant) CSCC Cemiplimab 3 mg/kg
Q2W IV, for up to 96 weeks
Cemiplimab 350 mgQ3W IV, for up to
54 weeks
Tumor response assessment by ICR (RECIST 1.1 for scans; modified WHO criteria for photos)
Tumor imaging every 8 weeks for the
assessment of efficacy
Tumor imaging every 9 weeks for the
assessment of efficacy
Group 3 – Adult patients with metastatic (nodal and/or distant) CSCC
Group 2 – laCSCC
Key inclusion criteria• ECOG performance status of 0 or 1• Adequate organ function• Groups 1 and 3:
At least one lesion measurable by RECIST 1.1 • Group 2
At least one lesion measurable by digital medical photographyCSCC lesion that is not amenable to curative surgery or curative radiation therapy per investigators’ assessmentTumor biopsies at baseline and on day 29, for exploratory biomarker analysis, unless considered to have unacceptable safety risks by the investigator
Key exclusion criteria• Ongoing or recent (within 5 years) autoimmune disease requiring systemic immunosuppression• Prior treatments with anti–PD-1 or anti–PD-L1 therapy• History of solid organ transplant, concurrent malignancies (unless indolent or not considered life-threatening; for example, basal cell carcinoma), or hematologic malignancies
Figure 1. Study design
ECOG, Eastern Cooperative Oncology Group; IV, intravenously; PD-L1, PD-ligand 1.
Phase 2 Study of Cemiplimab in Patients with Advanced Cutaneous Squamous Cell Carcinoma (CSCC): Longer Follow-Up
Danny Rischin,1 Nikhil I. Khushalani,2 Chrysalyne D. Schmults,3 Alexander Guminski,4 Anne Lynn S. Chang,5 Karl D. Lewis,6 Annette M. Lim,1 Leonel Hernandez-Aya,7 Brett G.M. Hughes,8 Dirk Schadendorf,9 Axel Hauschild,10 Elizabeth Stankevich,11 Jocelyn Booth,11 Suk-Young Yoo,11 Zhen Chen,12 Emmanuel Okoye,13 Israel Lowy,12 Matthew G. Fury,12 Michael R. Migden14
1Department of Medical Oncology, Peter MacCallum Cancer Centre, Melbourne, Australia; 2Department of Cutaneous Oncology, Moffitt Cancer Center, Tampa, FL, USA; 3Department of Dermatology, Brigham and Women’s Hospital, Harvard Medical School, Boston, MA, USA; 4Department of Medical Oncology, Royal North Shore Hospital, St Leonards, Australia; 5Department of Dermatology, Stanford University School of Medicine, Redwood City, CA, USA; 6University of Colorado Denver, School of Medicine, Aurora, CO, USA;
7Division of Medical Oncology, Department of Medicine, Washington University School of Medicine, St Louis, MO, USA; 8Royal Brisbane & Women’s Hospital and University of Queensland, Brisbane, Australia; 9University Hospital Essen, Essen and German Cancer Consortium, Essen, Germany; 10Schleswig-Holstein University Hospital, Kiel, Germany; 11Regeneron Pharmaceuticals, Inc., Basking Ridge, NJ, USA; 12Regeneron Pharmaceuticals, Inc., Tarrytown, NY, USA; 13Regeneron Pharmaceuticals, Inc., London, UK;
14Departments of Dermatology and Head and Neck Surgery, University of Texas MD Anderson Cancer Center, Houston, TX, USA
ResultsPatients• A total of 193 patients were enrolled (Group 1, n=59; Group 2, n=78;
Group 3, n=56) (Table 1).
Table 1. Baseline demographics
Advanced CSCC(n=193)
Median age, years (range) 72.0 (38–96)Male, n (%) 161 (83.4)ECOG performance status, n (%)
0 86 (44.6)1 107 (55.4)
Primary CSCC site: head and neck, n (%) 131 (67.9)mCSCC, n (%) 115 (59.6)laCSCC, n (%) 78 (40.4)Patients with cemiplimab as first-line therapy, n (%) 128 (66.3)Patients with prior systemic therapy, n (%)† 65 (33.7)Median duration of exposure to cemiplimab, weeks (range) 51.1 (2.0–109.3)Median number of doses of cemiplimab administered (range) 18.0 (1–48)†Settings for prior lines of therapy included metastatic disease, adjuvant, chemotherapy with concurrent radiation, or other and the most common types of prior systemic therapy were platinum compounds (n=46/65 [70.8%]) and monoclonal antibodies (n=18/65 [27.7%]).
Table 2. Duration of follow-up and tumor response to cemiplimab per ICR
Group 1 (mCSCC)3 mg/kg Q2W (n=59)
Group 2 (laCSCC)3 mg/kg Q2W (n=78)
Group 3 (mCSCC)350 mg Q3W (n=56)
Total(n=193)
Median duration of follow-up, months (range) 18.5 (1.1–36.1) 15.5 (0.8–35.6) 17.3 (0.6–26.3) 15.7 (0.6–36.1)ORR, % (95% CI) 50.8 (37.5–64.1) 44.9 (33.6–56.6) 42.9 (29.7–56.8) 46.1 (38.9–53.4)
Complete response, n (%) 12 (20.3) 10 (12.8) 9 (16.1) 31 (16.1)Partial response, n (%) 18 (30.5) 25 (32.1) 15 (26.8) 58 (30.1)Stable disease, n (%) 9 (15.3) 27 (34.6) 10 (17.9) 46 (23.8)Non-complete response/non-progressive disease, n (%) 3 (5.1) 0 2 (3.6) 5 (2.6)Progressive disease, n (%) 10 (16.9) 10 (12.8) 14 (25.0) 34 (17.6)Not evaluable, n (%) 7 (11.9) 6 (7.7) 6 (10.7) 19 (9.8)
Disease control rate, % (95% CI) 71.2 (57.9–82.2) 79.5 (68.8–87.8) 64.3 (50.4–76.6) 72.5 (65.7–78.7)Durable disease control rate,† % (95% CI) 61.0 (47.4–73.5) 62.8 (51.1–73.5) 57.1 (43.2–70.3) 60.6 (53.3–67.6)Median observed time to response, months (IQR)‡ 1.9 (1.8–2.0) 2.1 (1.9–3.8) 2.1 (2.1–4.2) 2.1 (1.9–3.7)
Median observed time to complete response, months (IQR)‡ 11.1 (7.5–18.4) 10.5 (7.4–12.9) 12.4 (8.2–16.6) 11.2 (7.4–14.8)Median DOR, months (range)‡ NR (20.7, NE) NR (18.4, NE) NR (NE, NE) NR (28.8, NE)Kaplan–Meier 12-month estimate of patients with ongoing response, % (95% CI) 89.5 (70.9–96.5) 83.2 (64.1–92.7) 91.7 (70.6–97.8) 87.8 (78.5–93.3)Kaplan–Meier 24-month estimate of patients with ongoing response, % (95% CI) 68.8 (46.9–83.2) 62.5 (38.4–79.4) NE (NE, NE) 69.4 (55.6–79.6)†Defined as the proportion of patients without progressive disease for at least 105 days.‡Based on number of patients with confirmed complete or partial response.ORR per INV was 54.4% (95% CI: 47.1–61.6) for all patients; 50.8% (95% CI: 37.5–64.1) for Group 1, 56.4% (95% CI: 44.7–67.6) for Group 2, and 55.4% (95% CI: 41.5–68.7) for Group 3. ORR per INV was 57.8% (95% CI: 48.8–66.5) among treatment-naïve patients and 47.7% (95% CI: 35.1–60.5) among previously treated patients.CI, confidence interval; NE, not evaluable; NR, not reached.
Table 3. TEAEs regardless of attribution
Advanced CSCC (n=193)
n (%) Any grade Grade ≥3Any 192 (99.5) 94 (48.7)Led to discontinuation 19 (9.8) 14 (7.3)Most common†
Fatigue 67 (34.7) 5 (2.6)Diarrhea 53 (27.5) 2 (1.0)Nausea 46 (23.8) 0Pruritus 41 (21.2) 0Rash 32 (16.6) 1 (0.5)Cough 32 (16.6) 0Arthralgia 28 (14.5) 1 (0.5)Constipation 26 (13.5) 1 (0.5)Vomiting 24 (12.4) 1 (0.5)Actinic keratosis 23 (11.9) 0Maculopapular rash 23 (11.9) 1 (0.5)Anemia 22 (11.4) 8 (4.1)Hypothyroidism 22 (11.4) 0Headache 21 (10.9) 0Upper respiratory tract infection 20 (10.4) 0
†TEAEs reported in ≥10% of patients, ordered by frequency of any grade.
367
• ORR per ICR was 46.1% (95% CI: 38.9–53.4) among all patients; 50.8% (95% CI: 37.5–64.1) for Group 1, 44.9% (95% CI: 33.6–56.6) for Group 2, and 42.9% (95% CI: 29.7–56.8) for Group 3 (Table 2).
• Per ICR, ORR was 48.4% and 41.5% among those who had not received prior anticancer systemic therapy (n=128) and those who had received prior anticancer systemic therapy (n=65), respectively.
• Overall, the observed time to response was 2 months for 41 (46.1%) patients, 2–4 months for 29 (32.6%) patients, 4–6 months for eight (9.0%) patients, and >6 months for 11 (12.4%) patients.
• Median DOR has not been reached (observed DOR range: 1.9–34.3 months). In responding patients, the estimated proportion of patients with ongoing response at 24 months was 69.4% (95% CI: 55.6–79.6) (Figure 3).
Treatment-emergent adverse events
• In total, 192 (99.5%) patients experienced at least one TEAE of any grade regardless of attribution (Table 3).
• Overall, the most common TEAEs of any grade were fatigue (n=67, 34.7%), diarrhea (n=53, 27.5%), and nausea (n=46, 23.8%).
• Grade ≥3 TEAEs regardless of attribution occurred in 94 (48.7%) of patients. The most common Grade ≥3 TEAEs were hypertension (n=9; 4.7%) and anemia and cellulitis (each n=8; 4.1%).
Clinical activity
• Complete response rates at primary analysis, ~1 year follow-up for Groups1, 2, and 3, and ~2 year follow-up for Group 1 are shown in Figure 2.
• Among 89 responders, median time to complete response was 11.2 months (interquartile range [IQR], 7.4–14.8).
• Estimated median PFS was 18.4 months (95% CI: 10.3–24.3) for all patients. The Kaplan–Meier estimated progression-free probability at 24 months was 44.2% (95% CI: 36.1–52.1) (Figure 4A).
• Median OS has not been reached. The Kaplan–Meier estimated probability of OS at 24 months was 73.3% (95% CI: 66.1–79.2) (Figure 4B).
Figure 3. Kaplan–Meier curves of DOR per ICR
1.0
0.9
0.8
0.7
0.6
0.5
0.4
0.3
0.2
0.1
0.0
0 2 4 6 8 10 12 14 16 18 20 22 24 26 28 30 32 34 36 38 40
Pro
bab
ility
of
no
pro
gre
ssio
n o
r d
eath
MonthNumber of patients at risk
30 30 29 28 23 23 23 23 23 20 18 16 16 16 10 9 6 2 0 0 0Group 1 (n=59)35 33 32 30 27 25 22 21 17 14 10 8 6 6 5 4 0 0 0 0 0Group 2 (n=78)24 24 24 23 21 21 20 19 17 11 5 0 0 0 0 0 0 0 0 0 0Group 3 (n=56)
Total (n=193) 89 87 85 81 71 69 65 63 57 45 33 24 22 22 15 13 6 2 0 0 0
Group 1 (mCSCC) 3 mg/kg Q2W (n=59)Group 2 (laCSCC) 3 mg/kg Q2W (n=78)Group 3 (mCSCC) 350 mg Q3W (n=56)Total (n=193)Figure 2. Complete response rates per ICR
25
20
15
10
5
0
Co
mp
lete
res
po
nse
rate
s (%
)
Group 1 (mCSCC)3 mg/kg Q2W
Group 2 (laCSCC)†
3 mg/kg Q2WGroup 3 (mCSCC)
350 mg Q3W
n=1012.8
n=35.4
n=46.8
n=1016.9
n=1220.3
n=1012.8
n=916.1
Primary ~1-year follow-up ~2-year follow-up
Figure 4. Kaplan–Meier curves for A) PFS per ICR and B) OS
Group 1 (mCSCC) 3 mg/kg Q2W (n=59)Group 2 (laCSCC) 3 mg/kg Q2W (n=78)Group 3 (mCSCC) 350 mg Q3W (n=56)Total (n=193)
1.00.90.80.70.60.50.40.30.20.10.0
0 2 4 6 8 10 12 14 16 18 20 22 24 26 28 30 32 34 36 38 40
Pro
bab
ility
of
OS
MonthNumber of patients at risk
59 56 52 49 47 46 41 39 39 38 38 37 35 33 24 16 11 4 1 0Group 1 (n=59) 4778 76 73 67 65 64 62 59 54 44 41 33 25 22 15 12 8 3 1 0Group 2 (n=78) 6556 52 49 46 45 38 38 38 37 29 20 9 2 0 0 0 0 0 0 0Group 3 (n=56) 44
Total (n=193) 193 184 174 162 157 156 148 141 136 130 111 99 79 62 55 39 28 19 7 2 0
B
Group 1 (mCSCC) 3 mg/kg Q2W (n=59)Group 2 (laCSCC) 3 mg/kg Q2W (n=78)Group 3 (mCSCC) 350 mg Q3W (n=56)Total (n=193)
1.00.90.80.70.60.50.40.30.20.10.0
0 2 4 6 8 10 12 14 16 18 20 22 24 26 28 30 32 34 36 38 40
Pro
bab
ility
of
PFS
MonthNumber of patients at risk
59 42 38 36 32 27 27 27 27 27 24 24 21 20 20 12 9 6 1 0 0Group 1 (n=59)78 61 48 43 39 37 33 29 26 20 17 16 12 10 7 5 5 2 0 0 0Group 2 (n=78)56 48 33 31 31 28 26 26 24 24 17 10 1 1 0 0 0 0 0 0 0Group 3 (n=56)193 151 119 110 102 92 86 82 77 71 58 50 34 31 27 17 14 8 1 0 0Total (n=193)
A
• Grade ≥3 treatment-related adverse events (TRAEs) were reported in 33 (17.1%) patients, with the most common being pneumonitis (n=5, 2.6%), autoimmune hepatitis (n=3; 1.6%), anemia, colitis, and diarrhea (all n=2; 1.0%).
• No new TEAEs resulting in death were reported compared to previous reports.9–11
†Among 23 laCSCC patients who were included in the pre-specified Group 2 interim analysis, there were no complete responses.
See poster #382 reporting post hoc analysis of health-related quality of life in the same patient population presented in this poster. Also see poster #433 that provides the design and rationale of a Phase 3, randomized, double-blind study of adjuvant cemiplimab versus placebo post-surgery and radiation in patients with high-risk CSCC.
References1. Que SKT et al. J Am Acad Dermatol. 2018;78:237–247.2. Cranmer LD et al. Oncologist. 2010;15:1320–1328.3. National Comprehensive Cancer Network. NCCN Clinical
practice guidelines in oncology: squamous cell skin cancer (Version 2.2019). 2018. Available at: https://www.nccn.org/professionals/physician_gls/pdf/squamous.pdf. [Accessed March 20, 2020].
4. Karia PS et al. J Clin Oncol. 2014;32:327–334.5. Weinberg AS et al. Dermatol Surg. 2007;33:885–899.
6. Schmults CD et al. JAMA Dermatol. 2013;149:541–547.7. Cowey C et al. Cancer Med. 2020 [in press].8. Burova E et al. Mol Cancer Ther. 2017;16:861–870.9. Migden MR et al. Lancet Oncol. 2020;21:294–305.
10. Migden MR et al. N Engl J Med. 2018;379:341–351.11. Rischin D et al. Poster presented at Maui Dermatology
Conference, January 25–29, 2020. 12. Eisenhauer EA et al. Eur J Cancer. 2009;45:228–247.
AcknowledgmentsThe authors would like to thank the patients, their families, all other investigators, and all investigational site members involved in this study.The study was funded by Regeneron Pharmaceuticals, Inc., and Sanofi. Medical writing support and typesetting was provided by Kate Carolan, PhD, of Prime, Knutsford, UK, funded by Regeneron Pharmaceuticals, Inc.and Sanofi.For any questions or comments, please contact Dr Danny Rischin, [email protected]
Conclusions• For patients with advanced CSCC, cemiplimab achieved ORR of 46.1%.
• Patients had deepening responses over time as evidenced by increasing complete response rates.9–11 Overall, the complete response rate is now 16.1% and median time to complete response was 11.2 months.
• DOR and OS are longer than what has been previously described with other agents.7
• With median DOR not reached after an additional 1 year of follow-up,this analysis indicates an increasing, clinically meaningful DORwith cemiplimab.
• The discontinuation rate, regardless of attribution, was low and most TRAEs were Grades 1–2.
Background• Cutaneous squamous cell carcinoma (CSCC) is the second most
common cancer in the US and its incidence is increasing.1
• Most cases of CSCC are cured by complete surgical excision.2,3 However, a small but substantial number of patients present with either metastatic CSCC (mCSCC) or locally advanced CSCC (laCSCC) not amenable to curative surgery or curative radiotherapy (collectivelyreferred to as “advanced CSCC”), both of which have poor prognoses.4–6
• Historical data shows median overall survival (OS) of approximately 15 months with conventional chemotherapy or epidermal growth factor receptor inhibitors.7
• Cemiplimab is a high-affinity, highly potent human immunoglobulin G4 monoclonal antibody to the programmed cell death (PD)-1 receptor.8
• Cemiplimab monotherapy achieved clinically meaningful activity in patients with advanced CSCC and has a safety profile consistent with other anti–PD-1 inhibitors.9–11
• Based on initial data (median follow-up of 9.4 months in the pivotal study, NCT02760498), cemiplimab (cemiplimab-rwlc in the US) was approved for the treatment of patients with advanced CSCC.
Objective• The primary objective of the Phase 2 study was to evaluate the objective
response rate (ORR) by independent central review (ICR) per Response Evaluation Criteria In Solid Tumors version 1.1 (RECIST 1.1) (for scans)12 and modified World Health Organization (WHO) criteria (for photos).
• Key secondary objectives included ORR per investigator review (INV), duration of response (DOR) by ICR and INV, progression-free survival (PFS) by ICR and INV, OS, complete response rate by ICR, safety and tolerability, and assessment of health-related quality of life. Durable disease control rate, defined as the proportion of patients with response or stable disease for at least 105 days, was also examined.
- Please see poster #382 for results on health-related quality of life data from this study.
• Here, we present up to 3-year follow-up (median duration of follow-up for all patients: 15.7 months) from the largest and most mature prospective data set in advanced CSCC.
Methods• EMPOWER-CSCC-1 is an open-label, non-randomized, multicenter,
international Phase 2 study of patients with advanced CSCC.
• Patients received cemiplimab 3 mg/kg every 2 weeks (Q2W) (Group 1;mCSCC; Group 2, laCSCC) or cemiplimab 350 mg every 3 weeks (Q3W) (Group 3, mCSCC) (Figure 1).
• The severity of treatment-emergent adverse events (TEAEs) was graded according to the National Cancer Institute Common Terminology Criteria for Adverse Events (version 4.03).
• The data cut-off was October 11, 2019.
Presented at American Society of Clinical Oncology (ASCO) 2020 Virtual Scientific Meeting, May 29–31, 2020.
Group 1 – Adult patients with metastatic (nodal and/or distant) CSCC Cemiplimab 3 mg/kg
Q2W IV, for up to 96 weeks
Cemiplimab 350 mgQ3W IV, for up to
54 weeks
Tumor response assessment by ICR (RECIST 1.1 for scans; modified WHO criteria for photos)
Tumor imaging every 8 weeks for the
assessment of efficacy
Tumor imaging every 9 weeks for the
assessment of efficacy
Group 3 – Adult patients with metastatic (nodal and/or distant) CSCC
Group 2 – laCSCC
Key inclusion criteria• ECOG performance status of 0 or 1• Adequate organ function• Groups 1 and 3:
At least one lesion measurable by RECIST 1.1 • Group 2
At least one lesion measurable by digital medical photographyCSCC lesion that is not amenable to curative surgery or curative radiation therapy per investigators’ assessmentTumor biopsies at baseline and on day 29, for exploratory biomarker analysis, unless considered to have unacceptable safety risks by the investigator
Key exclusion criteria• Ongoing or recent (within 5 years) autoimmune disease requiring systemic immunosuppression• Prior treatments with anti–PD-1 or anti–PD-L1 therapy• History of solid organ transplant, concurrent malignancies (unless indolent or not considered life-threatening; for example, basal cell carcinoma), or hematologic malignancies
Figure 1. Study design
ECOG, Eastern Cooperative Oncology Group; IV, intravenously; PD-L1, PD-ligand 1.
Phase 2 Study of Cemiplimab in Patients with Advanced Cutaneous Squamous Cell Carcinoma (CSCC): Longer Follow-Up
Danny Rischin,1 Nikhil I. Khushalani,2 Chrysalyne D. Schmults,3 Alexander Guminski,4 Anne Lynn S. Chang,5 Karl D. Lewis,6 Annette M. Lim,1 Leonel Hernandez-Aya,7 Brett G.M. Hughes,8 Dirk Schadendorf,9 Axel Hauschild,10
Elizabeth Stankevich,11 Jocelyn Booth,11 Suk-Young Yoo,11 Zhen Chen,12 Emmanuel Okoye,13 Israel Lowy,12 Matthew G. Fury,12 Michael R. Migden14
1Department of Medical Oncology, Peter MacCallum Cancer Centre, Melbourne, Australia; 2Department of Cutaneous Oncology, Moffitt Cancer Center, Tampa, FL, USA; 3Department of Dermatology, Brigham and Women’s Hospital, Harvard Medical School, Boston, MA, USA; 4Department of Medical Oncology, Royal North Shore Hospital, St Leonards, Australia; 5Department of Dermatology, Stanford University School of Medicine, Redwood City, CA, USA; 6University of Colorado Denver, School of Medicine, Aurora, CO, USA;
7Division of Medical Oncology, Department of Medicine, Washington University School of Medicine, St Louis, MO, USA; 8Royal Brisbane & Women’s Hospital and University of Queensland, Brisbane, Australia; 9University Hospital Essen, Essen and German Cancer Consortium, Essen, Germany; 10Schleswig-Holstein University Hospital, Kiel, Germany; 11Regeneron Pharmaceuticals, Inc., Basking Ridge, NJ, USA; 12Regeneron Pharmaceuticals, Inc., Tarrytown, NY, USA; 13Regeneron Pharmaceuticals, Inc., London, UK;
14Departments of Dermatology and Head and Neck Surgery, University of Texas MD Anderson Cancer Center, Houston, TX, USA
ResultsPatients• A total of 193 patients were enrolled (Group 1, n=59; Group 2, n=78;
Group 3, n=56) (Table 1).
Table 1. Baseline demographics
Advanced CSCC(n=193)
Median age, years (range) 72.0 (38–96)Male, n (%) 161 (83.4)ECOG performance status, n (%)
0 86 (44.6)1 107 (55.4)
Primary CSCC site: head and neck, n (%) 131 (67.9)mCSCC, n (%) 115 (59.6)laCSCC, n (%) 78 (40.4)Patients with cemiplimab as first-line therapy, n (%) 128 (66.3)Patients with prior systemic therapy, n (%)† 65 (33.7)Median duration of exposure to cemiplimab, weeks (range) 51.1 (2.0–109.3)Median number of doses of cemiplimab administered (range) 18.0 (1–48)†Settings for prior lines of therapy included metastatic disease, adjuvant, chemotherapy with concurrent radiation, or other and the mostcommon types of prior systemic therapy were platinum compounds (n=46/65 [70.8%]) and monoclonal antibodies (n=18/65 [27.7%]).
Table 2. Duration of follow-up and tumor response to cemiplimab per ICR
Group 1 (mCSCC)3 mg/kg Q2W (n=59)
Group 2 (laCSCC)3 mg/kg Q2W (n=78)
Group 3 (mCSCC)350 mg Q3W (n=56)
Total(n=193)
Median duration of follow-up, months (range) 18.5 (1.1–36.1) 15.5 (0.8–35.6) 17.3 (0.6–26.3) 15.7 (0.6–36.1)ORR, % (95% CI) 50.8 (37.5–64.1) 44.9 (33.6–56.6) 42.9 (29.7–56.8) 46.1 (38.9–53.4)
Complete response, n (%) 12 (20.3) 10 (12.8) 9 (16.1) 31 (16.1)Partial response, n (%) 18 (30.5) 25 (32.1) 15 (26.8) 58 (30.1)Stable disease, n (%) 9 (15.3) 27 (34.6) 10 (17.9) 46 (23.8)Non-complete response/non-progressive disease, n (%) 3 (5.1) 0 2 (3.6) 5 (2.6)Progressive disease, n (%) 10 (16.9) 10 (12.8) 14 (25.0) 34 (17.6)Not evaluable, n (%) 7 (11.9) 6 (7.7) 6 (10.7) 19 (9.8)
Disease control rate, % (95% CI) 71.2 (57.9–82.2) 79.5 (68.8–87.8) 64.3 (50.4–76.6) 72.5 (65.7–78.7)Durable disease control rate,† % (95% CI) 61.0 (47.4–73.5) 62.8 (51.1–73.5) 57.1 (43.2–70.3) 60.6 (53.3–67.6)Median observed time to response, months (IQR)‡ 1.9 (1.8–2.0) 2.1 (1.9–3.8) 2.1 (2.1–4.2) 2.1 (1.9–3.7)
Median observed time to complete response, months (IQR)‡ 11.1 (7.5–18.4) 10.5 (7.4–12.9) 12.4 (8.2–16.6) 11.2 (7.4–14.8)Median DOR, months (range)‡ NR (20.7, NE) NR (18.4, NE) NR (NE, NE) NR (28.8, NE)Kaplan–Meier 12-month estimate of patients with ongoing response, % (95% CI) 89.5 (70.9–96.5) 83.2 (64.1–92.7) 91.7 (70.6–97.8) 87.8 (78.5–93.3)Kaplan–Meier 24-month estimate of patients with ongoing response, % (95% CI) 68.8 (46.9–83.2) 62.5 (38.4–79.4) NE (NE, NE) 69.4 (55.6–79.6)†Defined as the proportion of patients without progressive disease for at least 105 days.‡Based on number of patients with confirmed complete or partial response.ORR per INV was 54.4% (95% CI: 47.1–61.6) for all patients; 50.8% (95% CI: 37.5–64.1) for Group 1, 56.4% (95% CI: 44.7–67.6) for Group 2, and 55.4% (95% CI: 41.5–68.7) for Group 3. ORR per INV was 57.8% (95% CI: 48.8–66.5) among treatment-naïve patients and 47.7% (95% CI: 35.1–60.5)among previously treated patients.CI, confidence interval; NE, not evaluable; NR, not reached.
Table 3. TEAEs regardless of attribution
Advanced CSCC (n=193)
n (%) Any grade Grade ≥3Any 192 (99.5) 94 (48.7)Led to discontinuation 19 (9.8) 14 (7.3)Most common†
Fatigue 67 (34.7) 5 (2.6)Diarrhea 53 (27.5) 2 (1.0)Nausea 46 (23.8) 0Pruritus 41 (21.2) 0Rash 32 (16.6) 1 (0.5)Cough 32 (16.6) 0Arthralgia 28 (14.5) 1 (0.5)Constipation 26 (13.5) 1 (0.5)Vomiting 24 (12.4) 1 (0.5)Actinic keratosis 23 (11.9) 0Maculopapular rash 23 (11.9) 1 (0.5)Anemia 22 (11.4) 8 (4.1)Hypothyroidism 22 (11.4) 0Headache 21 (10.9) 0Upper respiratory tract infection 20 (10.4) 0
†TEAEs reported in ≥10% of patients, ordered by frequency of any grade.
367
• ORR per ICR was 46.1% (95% CI: 38.9–53.4) among all patients;50.8% (95% CI: 37.5–64.1) for Group 1, 44.9% (95% CI: 33.6–56.6) for Group 2, and 42.9% (95% CI: 29.7–56.8) for Group 3 (Table 2).
• Per ICR, ORR was 48.4% and 41.5% among those who had not received prior anticancer systemic therapy (n=128) and those who had received prior anticancer systemic therapy (n=65), respectively.
• Overall, the observed time to response was 2 months for 41 (46.1%) patients, 2–4 months for 29 (32.6%) patients, 4–6 months for eight (9.0%) patients, and >6 months for 11 (12.4%) patients.
• Median DOR has not been reached (observed DOR range: 1.9–34.3 months).In responding patients, the estimated proportion of patients with ongoing response at 24 months was 69.4% (95% CI: 55.6–79.6) (Figure 3).
Treatment-emergent adverse events
• In total, 192 (99.5%) patients experienced at least one TEAE of anygrade regardless of attribution (Table 3).
• Overall, the most common TEAEs of any grade were fatigue (n=67, 34.7%), diarrhea (n=53, 27.5%), and nausea (n=46, 23.8%).
• Grade ≥3 TEAEs regardless of attribution occurred in 94 (48.7%) of patients. The most common Grade ≥3 TEAEs were hypertension (n=9; 4.7%) and anemia and cellulitis (each n=8; 4.1%).
Clinical activity
• Complete response rates at primary analysis, ~1 year follow-up for Groups 1, 2, and 3, and ~2 year follow-up for Group 1 are shown in Figure 2.
• Among 89 responders, median time to complete response was 11.2 months (interquartile range [IQR], 7.4–14.8).
• Estimated median PFS was 18.4 months (95% CI: 10.3–24.3) for all patients. The Kaplan–Meier estimated progression-free probability at 24 months was 44.2% (95% CI: 36.1–52.1) (Figure 4A).
• Median OS has not been reached. The Kaplan–Meier estimated probability of OS at 24 months was 73.3% (95% CI: 66.1–79.2) (Figure 4B).
Figure 3. Kaplan–Meier curves of DOR per ICR
1.0
0.9
0.8
0.7
0.6
0.5
0.4
0.3
0.2
0.1
0.0
0 2 4 6 8 10 12 14 16 18 20 22 24 26 28 30 32 34 36 38 40
Pro
bab
ility
of
no
pro
gre
ssio
n o
r d
eath
MonthNumber of patients at risk
30 30 29 28 23 23 23 23 23 20 18 16 16 16 10 9 6 2 0 0 0Group 1 (n=59)35 33 32 30 27 25 22 21 17 14 10 8 6 6 5 4 0 0 0 0 0Group 2 (n=78)24 24 24 23 21 21 20 19 17 11 5 0 0 0 0 0 0 0 0 0 0Group 3 (n=56)
Total (n=193) 89 87 85 81 71 69 65 63 57 45 33 24 22 22 15 13 6 2 0 0 0
Group 1 (mCSCC) 3 mg/kg Q2W (n=59)Group 2 (laCSCC) 3 mg/kg Q2W (n=78)Group 3 (mCSCC) 350 mg Q3W (n=56)Total (n=193)Figure 2. Complete response rates per ICR
25
20
15
10
5
0
Co
mp
lete
res
po
nse
rate
s (%
)
Group 1 (mCSCC)3 mg/kg Q2W
Group 2 (laCSCC)†
3 mg/kg Q2WGroup 3 (mCSCC)
350 mg Q3W
n=1012.8
n=35.4
n=46.8
n=1016.9
n=1220.3
n=1012.8
n=916.1
Primary ~1-year follow-up ~2-year follow-up
Figure 4. Kaplan–Meier curves for A) PFS per ICR and B) OS
Group 1 (mCSCC) 3 mg/kg Q2W (n=59)Group 2 (laCSCC) 3 mg/kg Q2W (n=78)Group 3 (mCSCC) 350 mg Q3W (n=56)Total (n=193)
1.00.90.80.70.60.50.40.30.20.10.0
0 2 4 6 8 10 12 14 16 18 20 22 24 26 28 30 32 34 36 38 40
Pro
bab
ility
of
OS
MonthNumber of patients at risk
59 56 52 49 47 46 41 39 39 38 38 37 35 33 24 16 11 4 1 0Group 1 (n=59) 4778 76 73 67 65 64 62 59 54 44 41 33 25 22 15 12 8 3 1 0Group 2 (n=78) 6556 52 49 46 45 38 38 38 37 29 20 9 2 0 0 0 0 0 0 0Group 3 (n=56) 44
Total (n=193) 193 184 174 162 157 156 148 141 136 130 111 99 79 62 55 39 28 19 7 2 0
B
Group 1 (mCSCC) 3 mg/kg Q2W (n=59)Group 2 (laCSCC) 3 mg/kg Q2W (n=78)Group 3 (mCSCC) 350 mg Q3W (n=56)Total (n=193)
1.00.90.80.70.60.50.40.30.20.10.0
0 2 4 6 8 10 12 14 16 18 20 22 24 26 28 30 32 34 36 38 40
Pro
bab
ility
of
PFS
MonthNumber of patients at risk
59 42 38 36 32 27 27 27 27 27 24 24 21 20 20 12 9 6 1 0 0Group 1 (n=59)78 61 48 43 39 37 33 29 26 20 17 16 12 10 7 5 5 2 0 0 0Group 2 (n=78)56 48 33 31 31 28 26 26 24 24 17 10 1 1 0 0 0 0 0 0 0Group 3 (n=56)193 151 119 110 102 92 86 82 77 71 58 50 34 31 27 17 14 8 1 0 0Total (n=193)
A
• Grade ≥3 treatment-related adverse events (TRAEs) were reported in 33 (17.1%) patients, with the most common being pneumonitis (n=5, 2.6%), autoimmune hepatitis (n=3; 1.6%), anemia, colitis, and diarrhea (all n=2; 1.0%).
• No new TEAEs resulting in death were reported compared to previousreports.9–11
†Among 23 laCSCC patients who were included in the pre-specified Group 2 interim analysis, there were no complete responses.
See poster #382 reporting post hoc analysis of health-related quality of life in the same patient population presented in this poster. Also see poster #433 that provides the design and rationale of a Phase 3, randomized, double-blind study of adjuvant cemiplimab versus placebo post-surgery and radiation in patients with high-risk CSCC.
References1. Que SKT et al. J Am Acad Dermatol. 2018;78:237–247.2. Cranmer LD et al. Oncologist. 2010;15:1320–1328.3. National Comprehensive Cancer Network. NCCN Clinical
practice guidelines in oncology: squamous cell skin cancer (Version 2.2019). 2018. Available at: https://www.nccn.org/professionals/physician_gls/pdf/squamous.pdf. [AccessedMarch 20, 2020].
4. Karia PS et al. J Clin Oncol. 2014;32:327–334.5. Weinberg AS et al. Dermatol Surg. 2007;33:885–899.
6. Schmults CD et al. JAMA Dermatol. 2013;149:541–547.7. Cowey C et al. Cancer Med. 2020 [in press].8. Burova E et al. Mol Cancer Ther. 2017;16:861–870.9. Migden MR et al. Lancet Oncol. 2020;21:294–305.
10. Migden MR et al. N Engl J Med. 2018;379:341–351.11. Rischin D et al. Poster presented at Maui Dermatology
Conference, January 25–29, 2020. 12. Eisenhauer EA et al. Eur J Cancer. 2009;45:228–247.
AcknowledgmentsThe authors would like to thank the patients, their families, all other investigators, and all investigational site members involved in this study. The study was funded by Regeneron Pharmaceuticals, Inc., and Sanofi. Medical writing support and typesetting was provided by KateCarolan, PhD, of Prime, Knutsford, UK, funded by Regeneron Pharmaceuticals, Inc.and Sanofi.For any questions or comments, please contact Dr Danny Rischin, [email protected]
Conclusions• For patients with advanced CSCC, cemiplimab achieved ORR of 46.1%.
• Patients had deepening responses over time as evidenced byincreasing complete response rates.9–11 Overall, the complete response rate is now 16.1% and median time to complete response was 11.2 months.
• DOR and OS are longer than what has been previously described with other agents.7
• With median DOR not reached after an additional 1 year of follow-up,this analysis indicates an increasing, clinically meaningful DORwith cemiplimab.
• The discontinuation rate, regardless of attribution, was low and most TRAEs were Grades 1–2.
Background• Cutaneous squamous cell carcinoma (CSCC) is the second most
common cancer in the US and its incidence is increasing.1
• Most cases of CSCC are cured by complete surgical excision.2,3
However, a small but substantial number of patients present with eithermetastatic CSCC (mCSCC) or locally advanced CSCC (laCSCC) notamenable to curative surgery or curative radiotherapy (collectivelyreferred to as “advanced CSCC”), both of which have poor prognoses.4–6
• Historical data shows median overall survival (OS) of approximately 15 months with conventional chemotherapy or epidermal growth factor receptor inhibitors.7
• Cemiplimab is a high-affinity, highly potent human immunoglobulin G4 monoclonal antibody to the programmed cell death (PD)-1 receptor.8
• Cemiplimab monotherapy achieved clinically meaningful activity in patients with advanced CSCC and has a safety profile consistent with other anti–PD-1 inhibitors.9–11
• Based on initial data (median follow-up of 9.4 months in the pivotal study, NCT02760498), cemiplimab (cemiplimab-rwlc in the US) was approved for the treatment of patients with advanced CSCC.
Objective• The primary objective of the Phase 2 study was to evaluate the objective
response rate (ORR) by independent central review (ICR) per Response Evaluation Criteria In Solid Tumors version 1.1 (RECIST 1.1) (for scans)12
and modified World Health Organization (WHO) criteria (for photos).
• Key secondary objectives included ORR per investigator review (INV), duration of response (DOR) by ICR and INV, progression-free survival (PFS) by ICR and INV, OS, complete response rate by ICR, safety and tolerability, and assessment of health-related quality of life. Durable disease control rate, defined as the proportion of patients with response or stable disease for at least 105 days, was also examined.
- Please see poster #382 for results on health-related quality of life data from this study.
• Here, we present up to 3-year follow-up (median duration of follow-up for all patients: 15.7 months) from the largest and most mature prospective data set in advanced CSCC.
Methods• EMPOWER-CSCC-1 is an open-label, non-randomized, multicenter,
international Phase 2 study of patients with advanced CSCC.
• Patients received cemiplimab 3 mg/kg every 2 weeks (Q2W) (Group 1; mCSCC; Group 2, laCSCC) or cemiplimab 350 mg every 3 weeks (Q3W) (Group 3, mCSCC) (Figure 1).
• The severity of treatment-emergent adverse events (TEAEs) was graded according to the National Cancer Institute Common Terminology Criteria for Adverse Events (version 4.03).
• The data cut-off was October 11, 2019.
Presented at American Society of Clinical Oncology (ASCO) 2020 Virtual Scientific Meeting, May 29–31, 2020.
Group 1 – Adult patients with metastatic (nodal and/or distant) CSCC Cemiplimab 3 mg/kg
Q2W IV, for up to 96 weeks
Cemiplimab 350 mgQ3W IV, for up to
54 weeks
Tumor response assessment by ICR (RECIST 1.1 for scans; modified WHO criteria for photos)
Tumor imaging every 8 weeks for the
assessment of efficacy
Tumor imaging every 9 weeks for the
assessment of efficacy
Group 3 – Adult patients with metastatic (nodal and/or distant) CSCC
Group 2 – laCSCC
Key inclusion criteria• ECOG performance status of 0 or 1• Adequate organ function• Groups 1 and 3:
At least one lesion measurable by RECIST 1.1 • Group 2
At least one lesion measurable by digital medical photographyCSCC lesion that is not amenable to curative surgery or curative radiation therapy per investigators’ assessmentTumor biopsies at baseline and on day 29, for exploratory biomarker analysis, unless considered to have unacceptable safety risks by the investigator
Key exclusion criteria• Ongoing or recent (within 5 years) autoimmune disease requiring systemic immunosuppression• Prior treatments with anti–PD-1 or anti–PD-L1 therapy• History of solid organ transplant, concurrent malignancies (unless indolent or not considered life-threatening; for example, basal cell carcinoma), or hematologic malignancies
Figure 1. Study design
ECOG, Eastern Cooperative Oncology Group; IV, intravenously; PD-L1, PD-ligand 1.
Phase 2 Study of Cemiplimab in Patients with Advanced Cutaneous Squamous Cell Carcinoma (CSCC): Longer Follow-Up
Danny Rischin,1 Nikhil I. Khushalani,2 Chrysalyne D. Schmults,3 Alexander Guminski,4 Anne Lynn S. Chang,5 Karl D. Lewis,6 Annette M. Lim,1 Leonel Hernandez-Aya,7 Brett G.M. Hughes,8 Dirk Schadendorf,9 Axel Hauschild,10
Elizabeth Stankevich,11 Jocelyn Booth,11 Suk-Young Yoo,11 Zhen Chen,12 Emmanuel Okoye,13 Israel Lowy,12 Matthew G. Fury,12 Michael R. Migden14
1Department of Medical Oncology, Peter MacCallum Cancer Centre, Melbourne, Australia; 2Department of Cutaneous Oncology, Moffitt Cancer Center, Tampa, FL, USA; 3Department of Dermatology, Brigham and Women’s Hospital, Harvard Medical School, Boston, MA, USA; 4Department of Medical Oncology, Royal North Shore Hospital, St Leonards, Australia; 5Department of Dermatology, Stanford University School of Medicine, Redwood City, CA, USA; 6University of Colorado Denver, School of Medicine, Aurora, CO, USA;
7Division of Medical Oncology, Department of Medicine, Washington University School of Medicine, St Louis, MO, USA; 8Royal Brisbane & Women’s Hospital and University of Queensland, Brisbane, Australia; 9University Hospital Essen, Essen and German Cancer Consortium, Essen, Germany; 10Schleswig-Holstein University Hospital, Kiel, Germany; 11Regeneron Pharmaceuticals, Inc., Basking Ridge, NJ, USA; 12Regeneron Pharmaceuticals, Inc., Tarrytown, NY, USA; 13Regeneron Pharmaceuticals, Inc., London, UK;
14Departments of Dermatology and Head and Neck Surgery, University of Texas MD Anderson Cancer Center, Houston, TX, USA
ResultsPatients• A total of 193 patients were enrolled (Group 1, n=59; Group 2, n=78;
Group 3, n=56) (Table 1).
Table 1. Baseline demographics
Advanced CSCC(n=193)
Median age, years (range) 72.0 (38–96)Male, n (%) 161 (83.4)ECOG performance status, n (%)
0 86 (44.6)1 107 (55.4)
Primary CSCC site: head and neck, n (%) 131 (67.9)mCSCC, n (%) 115 (59.6)laCSCC, n (%) 78 (40.4)Patients with cemiplimab as first-line therapy, n (%) 128 (66.3)Patients with prior systemic therapy, n (%)† 65 (33.7)Median duration of exposure to cemiplimab, weeks (range) 51.1 (2.0–109.3)Median number of doses of cemiplimab administered (range) 18.0 (1–48)†Settings for prior lines of therapy included metastatic disease, adjuvant, chemotherapy with concurrent radiation, or other and the most common types of prior systemic therapy were platinum compounds (n=46/65 [70.8%]) and monoclonal antibodies (n=18/65 [27.7%]).
Table 2. Duration of follow-up and tumor response to cemiplimab per ICR
Group 1 (mCSCC)3 mg/kg Q2W (n=59)
Group 2 (laCSCC)3 mg/kg Q2W (n=78)
Group 3 (mCSCC)350 mg Q3W (n=56)
Total(n=193)
Median duration of follow-up, months (range) 18.5 (1.1–36.1) 15.5 (0.8–35.6) 17.3 (0.6–26.3) 15.7 (0.6–36.1)ORR, % (95% CI) 50.8 (37.5–64.1) 44.9 (33.6–56.6) 42.9 (29.7–56.8) 46.1 (38.9–53.4)
Complete response, n (%) 12 (20.3) 10 (12.8) 9 (16.1) 31 (16.1)Partial response, n (%) 18 (30.5) 25 (32.1) 15 (26.8) 58 (30.1)Stable disease, n (%) 9 (15.3) 27 (34.6) 10 (17.9) 46 (23.8)Non-complete response/non-progressive disease, n (%) 3 (5.1) 0 2 (3.6) 5 (2.6)Progressive disease, n (%) 10 (16.9) 10 (12.8) 14 (25.0) 34 (17.6)Not evaluable, n (%) 7 (11.9) 6 (7.7) 6 (10.7) 19 (9.8)
Disease control rate, % (95% CI) 71.2 (57.9–82.2) 79.5 (68.8–87.8) 64.3 (50.4–76.6) 72.5 (65.7–78.7)Durable disease control rate,† % (95% CI) 61.0 (47.4–73.5) 62.8 (51.1–73.5) 57.1 (43.2–70.3) 60.6 (53.3–67.6)Median observed time to response, months (IQR)‡ 1.9 (1.8–2.0) 2.1 (1.9–3.8) 2.1 (2.1–4.2) 2.1 (1.9–3.7)
Median observed time to complete response, months (IQR)‡ 11.1 (7.5–18.4) 10.5 (7.4–12.9) 12.4 (8.2–16.6) 11.2 (7.4–14.8)Median DOR, months (range)‡ NR (20.7, NE) NR (18.4, NE) NR (NE, NE) NR (28.8, NE)Kaplan–Meier 12-month estimate of patients with ongoing response, % (95% CI) 89.5 (70.9–96.5) 83.2 (64.1–92.7) 91.7 (70.6–97.8) 87.8 (78.5–93.3)Kaplan–Meier 24-month estimate of patients with ongoing response, % (95% CI) 68.8 (46.9–83.2) 62.5 (38.4–79.4) NE (NE, NE) 69.4 (55.6–79.6)†Defined as the proportion of patients without progressive disease for at least 105 days.‡Based on number of patients with confirmed complete or partial response.ORR per INV was 54.4% (95% CI: 47.1–61.6) for all patients; 50.8% (95% CI: 37.5–64.1) for Group 1, 56.4% (95% CI: 44.7–67.6) for Group 2, and 55.4% (95% CI: 41.5–68.7) for Group 3. ORR per INV was 57.8% (95% CI: 48.8–66.5) among treatment-naïve patients and 47.7% (95% CI: 35.1–60.5) among previously treated patients.CI, confidence interval; NE, not evaluable; NR, not reached.
Table 3. TEAEs regardless of attribution
Advanced CSCC (n=193)
n (%) Any grade Grade ≥3Any 192 (99.5) 94 (48.7)Led to discontinuation 19 (9.8) 14 (7.3)Most common†
Fatigue 67 (34.7) 5 (2.6)Diarrhea 53 (27.5) 2 (1.0)Nausea 46 (23.8) 0Pruritus 41 (21.2) 0Rash 32 (16.6) 1 (0.5)Cough 32 (16.6) 0Arthralgia 28 (14.5) 1 (0.5)Constipation 26 (13.5) 1 (0.5)Vomiting 24 (12.4) 1 (0.5)Actinic keratosis 23 (11.9) 0Maculopapular rash 23 (11.9) 1 (0.5)Anemia 22 (11.4) 8 (4.1)Hypothyroidism 22 (11.4) 0Headache 21 (10.9) 0Upper respiratory tract infection 20 (10.4) 0
†TEAEs reported in ≥10% of patients, ordered by frequency of any grade.
367
• ORR per ICR was 46.1% (95% CI: 38.9–53.4) among all patients; 50.8% (95% CI: 37.5–64.1) for Group 1, 44.9% (95% CI: 33.6–56.6) for Group 2, and 42.9% (95% CI: 29.7–56.8) for Group 3 (Table 2).
• Per ICR, ORR was 48.4% and 41.5% among those who had not received prior anticancer systemic therapy (n=128) and those who had received prior anticancer systemic therapy (n=65), respectively.
• Overall, the observed time to response was 2 months for 41 (46.1%)patients, 2–4 months for 29 (32.6%) patients, 4–6 months for eight (9.0%) patients, and >6 months for 11 (12.4%) patients.
• Median DOR has not been reached (observed DOR range: 1.9–34.3 months).In responding patients, the estimated proportion of patients with ongoing response at 24 months was 69.4% (95% CI: 55.6–79.6) (Figure 3).
Treatment-emergent adverse events
• In total, 192 (99.5%) patients experienced at least one TEAE of any grade regardless of attribution (Table 3).
• Overall, the most common TEAEs of any grade were fatigue (n=67, 34.7%), diarrhea (n=53, 27.5%), and nausea (n=46, 23.8%).
• Grade ≥3 TEAEs regardless of attribution occurred in 94 (48.7%) of patients. The most common Grade ≥3 TEAEs were hypertension (n=9; 4.7%) and anemia and cellulitis (each n=8; 4.1%).
Clinical activity
• Complete response rates at primary analysis, ~1 year follow-up for Groups 1, 2, and 3, and ~2 year follow-up for Group 1 are shown in Figure 2.
• Among 89 responders, median time to complete response was 11.2 months (interquartile range [IQR], 7.4–14.8).
• Estimated median PFS was 18.4 months (95% CI: 10.3–24.3) for all patients. The Kaplan–Meier estimated progression-free probability at 24 months was 44.2% (95% CI: 36.1–52.1) (Figure 4A).
• Median OS has not been reached. The Kaplan–Meier estimated probability of OS at 24 months was 73.3% (95% CI: 66.1–79.2) (Figure 4B).
Figure 3. Kaplan–Meier curves of DOR per ICR
1.0
0.9
0.8
0.7
0.6
0.5
0.4
0.3
0.2
0.1
0.0
0 2 4 6 8 10 12 14 16 18 20 22 24 26 28 30 32 34 36 38 40
Pro
bab
ility
of
no
pro
gre
ssio
n o
r d
eath
MonthNumber of patients at risk
30 30 29 28 23 23 23 23 23 20 18 16 16 16 10 9 6 2 0 0 0Group 1 (n=59)35 33 32 30 27 25 22 21 17 14 10 8 6 6 5 4 0 0 0 0 0Group 2 (n=78)24 24 24 23 21 21 20 19 17 11 5 0 0 0 0 0 0 0 0 0 0Group 3 (n=56)
Total (n=193) 89 87 85 81 71 69 65 63 57 45 33 24 22 22 15 13 6 2 0 0 0
Group 1 (mCSCC) 3 mg/kg Q2W (n=59)Group 2 (laCSCC) 3 mg/kg Q2W (n=78)Group 3 (mCSCC) 350 mg Q3W (n=56)Total (n=193)Figure 2. Complete response rates per ICR
25
20
15
10
5
0
Co
mp
lete
res
po
nse
rate
s (%
)
Group 1 (mCSCC)3 mg/kg Q2W
Group 2 (laCSCC)†
3 mg/kg Q2WGroup 3 (mCSCC)
350 mg Q3W
n=1012.8
n=35.4
n=46.8
n=1016.9
n=1220.3
n=1012.8
n=916.1
Primary ~1-year follow-up ~2-year follow-up
Figure 4. Kaplan–Meier curves for A) PFS per ICR and B) OS
Group 1 (mCSCC) 3 mg/kg Q2W (n=59)Group 2 (laCSCC) 3 mg/kg Q2W (n=78)Group 3 (mCSCC) 350 mg Q3W (n=56)Total (n=193)
1.00.90.80.70.60.50.40.30.20.10.0
0 2 4 6 8 10 12 14 16 18 20 22 24 26 28 30 32 34 36 38 40
Pro
bab
ility
of
OS
MonthNumber of patients at risk
59 56 52 49 47 46 41 39 39 38 38 37 35 33 24 16 11 4 1 0Group 1 (n=59) 4778 76 73 67 65 64 62 59 54 44 41 33 25 22 15 12 8 3 1 0Group 2 (n=78) 6556 52 49 46 45 38 38 38 37 29 20 9 2 0 0 0 0 0 0 0Group 3 (n=56) 44
Total (n=193) 193 184 174 162 157 156 148 141 136 130 111 99 79 62 55 39 28 19 7 2 0
B
Group 1 (mCSCC) 3 mg/kg Q2W (n=59)Group 2 (laCSCC) 3 mg/kg Q2W (n=78)Group 3 (mCSCC) 350 mg Q3W (n=56)Total (n=193)
1.00.90.80.70.60.50.40.30.20.10.0
0 2 4 6 8 10 12 14 16 18 20 22 24 26 28 30 32 34 36 38 40
Pro
bab
ility
of
PFS
MonthNumber of patients at risk
59 42 38 36 32 27 27 27 27 27 24 24 21 20 20 12 9 6 1 0 0Group 1 (n=59)78 61 48 43 39 37 33 29 26 20 17 16 12 10 7 5 5 2 0 0 0Group 2 (n=78)56 48 33 31 31 28 26 26 24 24 17 10 1 1 0 0 0 0 0 0 0Group 3 (n=56)193 151 119 110 102 92 86 82 77 71 58 50 34 31 27 17 14 8 1 0 0Total (n=193)
A
• Grade ≥3 treatment-related adverse events (TRAEs) were reported in 33 (17.1%) patients, with the most common being pneumonitis (n=5, 2.6%), autoimmune hepatitis (n=3; 1.6%), anemia, colitis, and diarrhea (all n=2; 1.0%).
• No new TEAEs resulting in death were reported compared to previousreports.9–11
†Among 23 laCSCC patients who were included in the pre-specified Group 2 interim analysis, there were no complete responses.
See poster #382 reporting post hoc analysis of health-related quality of life in the same patient population presented in this poster. Also see poster #433 that provides the design and rationale of a Phase 3, randomized, double-blind study of adjuvant cemiplimab versus placebo post-surgery and radiation in patients with high-risk CSCC.
References1. Que SKT et al. J Am Acad Dermatol. 2018;78:237–247.2. Cranmer LD et al. Oncologist. 2010;15:1320–1328.3. National Comprehensive Cancer Network. NCCN Clinical
practice guidelines in oncology: squamous cell skin cancer (Version 2.2019). 2018. Available at: https://www.nccn.org/professionals/physician_gls/pdf/squamous.pdf. [AccessedMarch 20, 2020].
4. Karia PS et al. J Clin Oncol. 2014;32:327–334.5. Weinberg AS et al. Dermatol Surg. 2007;33:885–899.
6. Schmults CD et al. JAMA Dermatol. 2013;149:541–547.7. Cowey C et al. Cancer Med. 2020 [in press].8. Burova E et al. Mol Cancer Ther. 2017;16:861–870.9. Migden MR et al. Lancet Oncol. 2020;21:294–305.
10. Migden MR et al. N Engl J Med. 2018;379:341–351.11. Rischin D et al. Poster presented at Maui Dermatology
Conference, January 25–29, 2020. 12. Eisenhauer EA et al. Eur J Cancer. 2009;45:228–247.
AcknowledgmentsThe authors would like to thank the patients, their families, all other investigators, and all investigational site members involved in this study. The study was funded by Regeneron Pharmaceuticals, Inc., and Sanofi. Medical writing support and typesetting was provided by KateCarolan, PhD, of Prime, Knutsford, UK, funded by Regeneron Pharmaceuticals, Inc.and Sanofi.For any questions or comments, please contact Dr Danny Rischin, [email protected]
Conclusions• For patients with advanced CSCC, cemiplimab achieved ORR of 46.1%.
• Patients had deepening responses over time as evidenced byincreasing complete response rates.9–11 Overall, the complete response rate is now 16.1% and median time to complete response was 11.2 months.
• DOR and OS are longer than what has been previously described with other agents.7
• With median DOR not reached after an additional 1 year of follow-up,this analysis indicates an increasing, clinically meaningful DORwith cemiplimab.
• The discontinuation rate, regardless of attribution, was low and most TRAEs were Grades 1–2.
Background• Cutaneous squamous cell carcinoma (CSCC) is the second most
common cancer in the US and its incidence is increasing.1
• Most cases of CSCC are cured by complete surgical excision.2,3
However, a small but substantial number of patients present with either metastatic CSCC (mCSCC) or locally advanced CSCC (laCSCC) not amenable to curative surgery or curative radiotherapy (collectivelyreferred to as “advanced CSCC”), both of which have poor prognoses.4–6
• Historical data shows median overall survival (OS) of approximately 15 months with conventional chemotherapy or epidermal growth factor receptor inhibitors.7
• Cemiplimab is a high-affinity, highly potent human immunoglobulin G4 monoclonal antibody to the programmed cell death (PD)-1 receptor.8
• Cemiplimab monotherapy achieved clinically meaningful activity in patients with advanced CSCC and has a safety profile consistent with other anti–PD-1 inhibitors.9–11
• Based on initial data (median follow-up of 9.4 months in the pivotal study, NCT02760498), cemiplimab (cemiplimab-rwlc in the US) was approved for the treatment of patients with advanced CSCC.
Objective• The primary objective of the Phase 2 study was to evaluate the objective
response rate (ORR) by independent central review (ICR) per Response Evaluation Criteria In Solid Tumors version 1.1 (RECIST 1.1) (for scans)12
and modified World Health Organization (WHO) criteria (for photos).
• Key secondary objectives included ORR per investigator review (INV), duration of response (DOR) by ICR and INV, progression-free survival (PFS) by ICR and INV, OS, complete response rate by ICR, safety and tolerability, and assessment of health-related quality of life. Durable disease control rate, defined as the proportion of patients with response or stable disease for at least 105 days, was also examined.
- Please see poster #382 for results on health-related quality of life data from this study.
• Here, we present up to 3-year follow-up (median duration of follow-up for all patients: 15.7 months) from the largest and most mature prospective data set in advanced CSCC.
Methods• EMPOWER-CSCC-1 is an open-label, non-randomized, multicenter,
international Phase 2 study of patients with advanced CSCC.
• Patients received cemiplimab 3 mg/kg every 2 weeks (Q2W) (Group 1; mCSCC; Group 2, laCSCC) or cemiplimab 350 mg every 3 weeks (Q3W) (Group 3, mCSCC) (Figure 1).
• The severity of treatment-emergent adverse events (TEAEs) was graded according to the National Cancer Institute Common Terminology Criteria for Adverse Events (version 4.03).
• The data cut-off was October 11, 2019.
Presented at American Society of Clinical Oncology (ASCO) 2020 Virtual Scientific Meeting, May 29–31, 2020.
Group 1 – Adult patients with metastatic (nodal and/or distant) CSCC Cemiplimab 3 mg/kg
Q2W IV, for up to 96 weeks
Cemiplimab 350 mgQ3W IV, for up to
54 weeks
Tumor response assessment by ICR (RECIST 1.1 for scans; modified WHO criteria for photos)
Tumor imaging every 8 weeks for the
assessment of efficacy
Tumor imaging every 9 weeks for the
assessment of efficacy
Group 3 – Adult patients with metastatic (nodal and/or distant) CSCC
Group 2 – laCSCC
Key inclusion criteria• ECOG performance status of 0 or 1• Adequate organ function• Groups 1 and 3:
At least one lesion measurable by RECIST 1.1 • Group 2
At least one lesion measurable by digital medical photographyCSCC lesion that is not amenable to curative surgery or curative radiation therapy per investigators’ assessmentTumor biopsies at baseline and on day 29, for exploratory biomarker analysis, unless considered to have unacceptable safety risks by the investigator
Key exclusion criteria• Ongoing or recent (within 5 years) autoimmune disease requiring systemic immunosuppression• Prior treatments with anti–PD-1 or anti–PD-L1 therapy• History of solid organ transplant, concurrent malignancies (unless indolent or not considered life-threatening; for example, basal cell carcinoma), or hematologic malignancies
Figure 1. Study design
ECOG, Eastern Cooperative Oncology Group; IV, intravenously; PD-L1, PD-ligand 1.
Phase 2 Study of Cemiplimab in Patients with Advanced Cutaneous Squamous Cell Carcinoma (CSCC): Longer Follow-Up
Danny Rischin,1 Nikhil I. Khushalani,2 Chrysalyne D. Schmults,3 Alexander Guminski,4 Anne Lynn S. Chang,5 Karl D. Lewis,6 Annette M. Lim,1 Leonel Hernandez-Aya,7 Brett G.M. Hughes,8 Dirk Schadendorf,9 Axel Hauschild,10
Elizabeth Stankevich,11 Jocelyn Booth,11 Suk-Young Yoo,11 Zhen Chen,12 Emmanuel Okoye,13 Israel Lowy,12 Matthew G. Fury,12 Michael R. Migden14
1Department of Medical Oncology, Peter MacCallum Cancer Centre, Melbourne, Australia; 2Department of Cutaneous Oncology, Moffitt Cancer Center, Tampa, FL, USA; 3Department of Dermatology, Brigham and Women’s Hospital, Harvard Medical School, Boston, MA, USA; 4Department of Medical Oncology, Royal North Shore Hospital, St Leonards, Australia; 5Department of Dermatology, Stanford University School of Medicine, Redwood City, CA, USA; 6University of Colorado Denver, School of Medicine, Aurora, CO, USA;
7Division of Medical Oncology, Department of Medicine, Washington University School of Medicine, St Louis, MO, USA; 8Royal Brisbane & Women’s Hospital and University of Queensland, Brisbane, Australia; 9University Hospital Essen, Essen and German Cancer Consortium, Essen, Germany; 10Schleswig-Holstein University Hospital, Kiel, Germany; 11Regeneron Pharmaceuticals, Inc., Basking Ridge, NJ, USA; 12Regeneron Pharmaceuticals, Inc., Tarrytown, NY, USA; 13Regeneron Pharmaceuticals, Inc., London, UK;
14Departments of Dermatology and Head and Neck Surgery, University of Texas MD Anderson Cancer Center, Houston, TX, USA
ResultsPatients• A total of 193 patients were enrolled (Group 1, n=59; Group 2, n=78;
Group 3, n=56) (Table 1).
Table 1. Baseline demographics
Advanced CSCC(n=193)
Median age, years (range) 72.0 (38–96)Male, n (%) 161 (83.4)ECOG performance status, n (%)
0 86 (44.6)1 107 (55.4)
Primary CSCC site: head and neck, n (%) 131 (67.9)mCSCC, n (%) 115 (59.6)laCSCC, n (%) 78 (40.4)Patients with cemiplimab as first-line therapy, n (%) 128 (66.3)Patients with prior systemic therapy, n (%)† 65 (33.7)Median duration of exposure to cemiplimab, weeks (range) 51.1 (2.0–109.3)Median number of doses of cemiplimab administered (range) 18.0 (1–48)†Settings for prior lines of therapy included metastatic disease, adjuvant, chemotherapy with concurrent radiation, or other and the most common types of prior systemic therapy were platinum compounds (n=46/65 [70.8%]) and monoclonal antibodies (n=18/65 [27.7%]).
Table 2. Duration of follow-up and tumor response to cemiplimab per ICR
Group 1 (mCSCC)3 mg/kg Q2W (n=59)
Group 2 (laCSCC)3 mg/kg Q2W (n=78)
Group 3 (mCSCC)350 mg Q3W (n=56)
Total(n=193)
Median duration of follow-up, months (range) 18.5 (1.1–36.1) 15.5 (0.8–35.6) 17.3 (0.6–26.3) 15.7 (0.6–36.1)ORR, % (95% CI) 50.8 (37.5–64.1) 44.9 (33.6–56.6) 42.9 (29.7–56.8) 46.1 (38.9–53.4)
Complete response, n (%) 12 (20.3) 10 (12.8) 9 (16.1) 31 (16.1)Partial response, n (%) 18 (30.5) 25 (32.1) 15 (26.8) 58 (30.1)Stable disease, n (%) 9 (15.3) 27 (34.6) 10 (17.9) 46 (23.8)Non-complete response/non-progressive disease, n (%) 3 (5.1) 0 2 (3.6) 5 (2.6)Progressive disease, n (%) 10 (16.9) 10 (12.8) 14 (25.0) 34 (17.6)Not evaluable, n (%) 7 (11.9) 6 (7.7) 6 (10.7) 19 (9.8)
Disease control rate, % (95% CI) 71.2 (57.9–82.2) 79.5 (68.8–87.8) 64.3 (50.4–76.6) 72.5 (65.7–78.7)Durable disease control rate,† % (95% CI) 61.0 (47.4–73.5) 62.8 (51.1–73.5) 57.1 (43.2–70.3) 60.6 (53.3–67.6)Median observed time to response, months (IQR)‡ 1.9 (1.8–2.0) 2.1 (1.9–3.8) 2.1 (2.1–4.2) 2.1 (1.9–3.7)
Median observed time to complete response, months (IQR)‡ 11.1 (7.5–18.4) 10.5 (7.4–12.9) 12.4 (8.2–16.6) 11.2 (7.4–14.8)Median DOR, months (range)‡ NR (20.7, NE) NR (18.4, NE) NR (NE, NE) NR (28.8, NE)Kaplan–Meier 12-month estimate of patients with ongoing response, % (95% CI) 89.5 (70.9–96.5) 83.2 (64.1–92.7) 91.7 (70.6–97.8) 87.8 (78.5–93.3)Kaplan–Meier 24-month estimate of patients with ongoing response, % (95% CI) 68.8 (46.9–83.2) 62.5 (38.4–79.4) NE (NE, NE) 69.4 (55.6–79.6)†Defined as the proportion of patients without progressive disease for at least 105 days.‡Based on number of patients with confirmed complete or partial response.ORR per INV was 54.4% (95% CI: 47.1–61.6) for all patients; 50.8% (95% CI: 37.5–64.1) for Group 1, 56.4% (95% CI: 44.7–67.6) for Group 2, and 55.4% (95% CI: 41.5–68.7) for Group 3. ORR per INV was 57.8% (95% CI: 48.8–66.5) among treatment-naïve patients and 47.7% (95% CI: 35.1–60.5)among previously treated patients.CI, confidence interval; NE, not evaluable; NR, not reached.
Table 3. TEAEs regardless of attribution
Advanced CSCC (n=193)
n (%) Any grade Grade ≥3Any 192 (99.5) 94 (48.7)Led to discontinuation 19 (9.8) 14 (7.3)Most common†
Fatigue 67 (34.7) 5 (2.6)Diarrhea 53 (27.5) 2 (1.0)Nausea 46 (23.8) 0Pruritus 41 (21.2) 0Rash 32 (16.6) 1 (0.5)Cough 32 (16.6) 0Arthralgia 28 (14.5) 1 (0.5)Constipation 26 (13.5) 1 (0.5)Vomiting 24 (12.4) 1 (0.5)Actinic keratosis 23 (11.9) 0Maculopapular rash 23 (11.9) 1 (0.5)Anemia 22 (11.4) 8 (4.1)Hypothyroidism 22 (11.4) 0Headache 21 (10.9) 0Upper respiratory tract infection 20 (10.4) 0
†TEAEs reported in ≥10% of patients, ordered by frequency of any grade.
367
• ORR per ICR was 46.1% (95% CI: 38.9–53.4) among all patients; 50.8% (95% CI: 37.5–64.1) for Group 1, 44.9% (95% CI: 33.6–56.6) for Group 2, and 42.9% (95% CI: 29.7–56.8) for Group 3 (Table 2).
• Per ICR, ORR was 48.4% and 41.5% among those who had not received prior anticancer systemic therapy (n=128) and those who had received prior anticancer systemic therapy (n=65), respectively.
• Overall, the observed time to response was 2 months for 41 (46.1%)patients, 2–4 months for 29 (32.6%) patients, 4–6 months for eight (9.0%) patients, and >6 months for 11 (12.4%) patients.
• Median DOR has not been reached (observed DOR range: 1.9–34.3 months).In responding patients, the estimated proportion of patients with ongoing response at 24 months was 69.4% (95% CI: 55.6–79.6) (Figure 3).
Treatment-emergent adverse events
• In total, 192 (99.5%) patients experienced at least one TEAE of any grade regardless of attribution (Table 3).
• Overall, the most common TEAEs of any grade were fatigue (n=67, 34.7%), diarrhea (n=53, 27.5%), and nausea (n=46, 23.8%).
• Grade ≥3 TEAEs regardless of attribution occurred in 94 (48.7%) of patients. The most common Grade ≥3 TEAEs were hypertension (n=9; 4.7%) and anemia and cellulitis (each n=8; 4.1%).
Clinical activity
• Complete response rates at primary analysis, ~1 year follow-up for Groups 1, 2, and 3, and ~2 year follow-up for Group 1 are shown in Figure 2.
• Among 89 responders, median time to complete response was 11.2 months (interquartile range [IQR], 7.4–14.8).
• Estimated median PFS was 18.4 months (95% CI: 10.3–24.3) for all patients. The Kaplan–Meier estimated progression-free probability at 24 months was 44.2% (95% CI: 36.1–52.1) (Figure 4A).
• Median OS has not been reached. The Kaplan–Meier estimated probabilityof OS at 24 months was 73.3% (95% CI: 66.1–79.2) (Figure 4B).
Figure 3. Kaplan–Meier curves of DOR per ICR
1.0
0.9
0.8
0.7
0.6
0.5
0.4
0.3
0.2
0.1
0.0
0 2 4 6 8 10 12 14 16 18 20 22 24 26 28 30 32 34 36 38 40
Pro
bab
ility
of
no
pro
gre
ssio
n o
r d
eath
MonthNumber of patients at risk
30 30 29 28 23 23 23 23 23 20 18 16 16 16 10 9 6 2 0 0 0Group 1 (n=59)35 33 32 30 27 25 22 21 17 14 10 8 6 6 5 4 0 0 0 0 0Group 2 (n=78)24 24 24 23 21 21 20 19 17 11 5 0 0 0 0 0 0 0 0 0 0Group 3 (n=56)
Total (n=193) 89 87 85 81 71 69 65 63 57 45 33 24 22 22 15 13 6 2 0 0 0
Group 1 (mCSCC) 3 mg/kg Q2W (n=59)Group 2 (laCSCC) 3 mg/kg Q2W (n=78)Group 3 (mCSCC) 350 mg Q3W (n=56)Total (n=193)Figure 2. Complete response rates per ICR
25
20
15
10
5
0
Co
mp
lete
res
po
nse
rate
s (%
)
Group 1 (mCSCC)3 mg/kg Q2W
Group 2 (laCSCC)†
3 mg/kg Q2WGroup 3 (mCSCC)
350 mg Q3W
n=1012.8
n=35.4
n=46.8
n=1016.9
n=1220.3
n=1012.8
n=916.1
Primary ~1-year follow-up ~2-year follow-up
Figure 4. Kaplan–Meier curves for A) PFS per ICR and B) OS
Group 1 (mCSCC) 3 mg/kg Q2W (n=59)Group 2 (laCSCC) 3 mg/kg Q2W (n=78)Group 3 (mCSCC) 350 mg Q3W (n=56)Total (n=193)
1.00.90.80.70.60.50.40.30.20.10.0
0 2 4 6 8 10 12 14 16 18 20 22 24 26 28 30 32 34 36 38 40
Pro
bab
ility
of
OS
MonthNumber of patients at risk
59 56 52 49 47 46 41 39 39 38 38 37 35 33 24 16 11 4 1 0Group 1 (n=59) 4778 76 73 67 65 64 62 59 54 44 41 33 25 22 15 12 8 3 1 0Group 2 (n=78) 6556 52 49 46 45 38 38 38 37 29 20 9 2 0 0 0 0 0 0 0Group 3 (n=56) 44
Total (n=193) 193 184 174 162 157 156 148 141 136 130 111 99 79 62 55 39 28 19 7 2 0
B
Group 1 (mCSCC) 3 mg/kg Q2W (n=59)Group 2 (laCSCC) 3 mg/kg Q2W (n=78)Group 3 (mCSCC) 350 mg Q3W (n=56)Total (n=193)
1.00.90.80.70.60.50.40.30.20.10.0
0 2 4 6 8 10 12 14 16 18 20 22 24 26 28 30 32 34 36 38 40
Pro
bab
ility
of
PFS
MonthNumber of patients at risk
59 42 38 36 32 27 27 27 27 27 24 24 21 20 20 12 9 6 1 0 0Group 1 (n=59)78 61 48 43 39 37 33 29 26 20 17 16 12 10 7 5 5 2 0 0 0Group 2 (n=78)56 48 33 31 31 28 26 26 24 24 17 10 1 1 0 0 0 0 0 0 0Group 3 (n=56)193 151 119 110 102 92 86 82 77 71 58 50 34 31 27 17 14 8 1 0 0Total (n=193)
A
• Grade ≥3 treatment-related adverse events (TRAEs) were reported in 33 (17.1%) patients, with the most common being pneumonitis (n=5, 2.6%), autoimmune hepatitis (n=3; 1.6%), anemia, colitis, and diarrhea (all n=2; 1.0%).
• No new TEAEs resulting in death were reported compared to previousreports.9–11
†Among 23 laCSCC patients who were included in the pre-specified Group 2 interim analysis, there were no complete responses.