Embed Size (px)
Citation preview
REPORT PA 3 Phase3 report
1 (19)
SNRA, Arena, Susanne PlanathDate
1999-11-26
Phase 3 report, PA 3, Traffic Management Tools
Activity 30, “Common development of traffic management tools”
IntroductionThe third phase of VIKING started in 1998 and will finish by the turn of the millennium. The VIKINGwork during this period has focused on joint studies aiming at co-operation and common work.Project area 3, Traffic Management Tools co-ordinates development and implementation of varioustools used in real time traffic management such as control strategies, incident management etc.Activity 30 aims at forming a consensus on the views on traffic management tools to be used withinthe VIKING countries. The purpose of this is to create a common foundation for harmonised trafficmanagement.Phase 3 has focused on the analysis of the current state of traffic management tools within theVIKING countries including definitions and principal guidelines. In the work plan for phase 3 thefollowing three areas were defined as most important and of common interest
VMS on TERNExchange of information should cover not only matters concerning design and qualitybut also criteria for the use of VMS as well as efficiency studies and similar.
Traffic models for road traffic managementTraffic models include not only technical matters but also organisational co-operationbetween different authorities, exchange of experience at international level, methods forevaluation and studies on economy and efficiency. Joint evaluation of traffic models isof great value.
MCS – Motorway Control Systems – for TERN high class roadsThe work was to include exchange of relevant information about present nationalactivities and plans. The common work also included discussions of differenttechniques and methods in pre-studies as well as post-studies.
ActivitiesTo achieve the goals set up in the work plan, and to get started at a high tempo, it was decided to hostseminars, one in each VIKING country. The purpose of these meetings was also to get a view of on-going activities in each country, to see how traffic data is collected, how traffic information is handledand to look at the physical installations and learn from eachothers experience. To the meetings eachVIKING project representative invited the country experts within the field. Three meetings focused onthe target areas
• Stockholm 990210-11, MCS• Oslo 990426-27, Traffic models• Helsinki 990527-28, VMS
REPORT PA 3 Phase3 report
2 (19)
SNRA, Arena, Susanne PlanathDate
1999-11-26
In addition to this meetings were also held where traffic management tools in general and plans for thefuture PA 3 work were discussed.
• Hamburg 990223-24• Copenhagen 990906-07
The traffic model experts attending the Oslo seminar identified traffic signals as one area where theVIKING countries would benefit from co-operation. So, as a direct result from the discussions in Osloa Traffic Signals seminar was arranged in Stockholm 991028.
During the meetings two topics, in addition to the areas specified in the work plan, have beenfrequently discussed. These two topics are traffic control centres and travel times. Regarding trafficcontrol centres the countries have exchanged experience and view points of the current situation andfuture plans on strategies, data collection, external and internal co-operation, dissemination of trafficinformation, education etc. In terms of travel times the group has discussed data collection, datahandling, dissemination and interfaces to the public, and future plans. Since the two above specifiedsubjects were not defined in the workplan it is referred to the appended meeting minutes for furtherdetails.
Minutes from the meetings and the Traffic Signals seminar are appended.
Conclusions from Seminars
VMSWithin the VMS field the VIKING countries has a lot of experience. The VMS systems has beenrunning for quite some time and has therefore supplied the opportunity of evaluation from a longerperspective than most of other ITS-applications.
VIKING applications where VMS is used includes general traffic management (free-text signs),variable speed limits, variable direction signs, weather controlled road, parking information system,travel time presentation, reversible lane control, congestion warning, route guidance system andwarning signs.
Work regarding policies and guidelines has been carried out in several countries.
National input
DenmarkIn 1996-97 the E47/E55 motorway was widened from 4 to 6 lanes. As all northern accessroads towards Copenhagen already were congested during the morning rush hours, the roadauthorities feared that the congestion could spread to other roads in the area. To informdrivers about the capacity problems which were expected during the road works and maketraffic flow smoother, investments were made in the ITS field. To meet the needs of trafficmonitoring the following temporary systems were implemented:
• Video cameras (18)• Information panels (5) with free text displaying expected delay or incident information.• Variable queue warning signs for drivers travelling towards the work zone (14)
REPORT PA 3 Phase3 report
3 (19)
SNRA, Arena, Susanne PlanathDate
1999-11-26
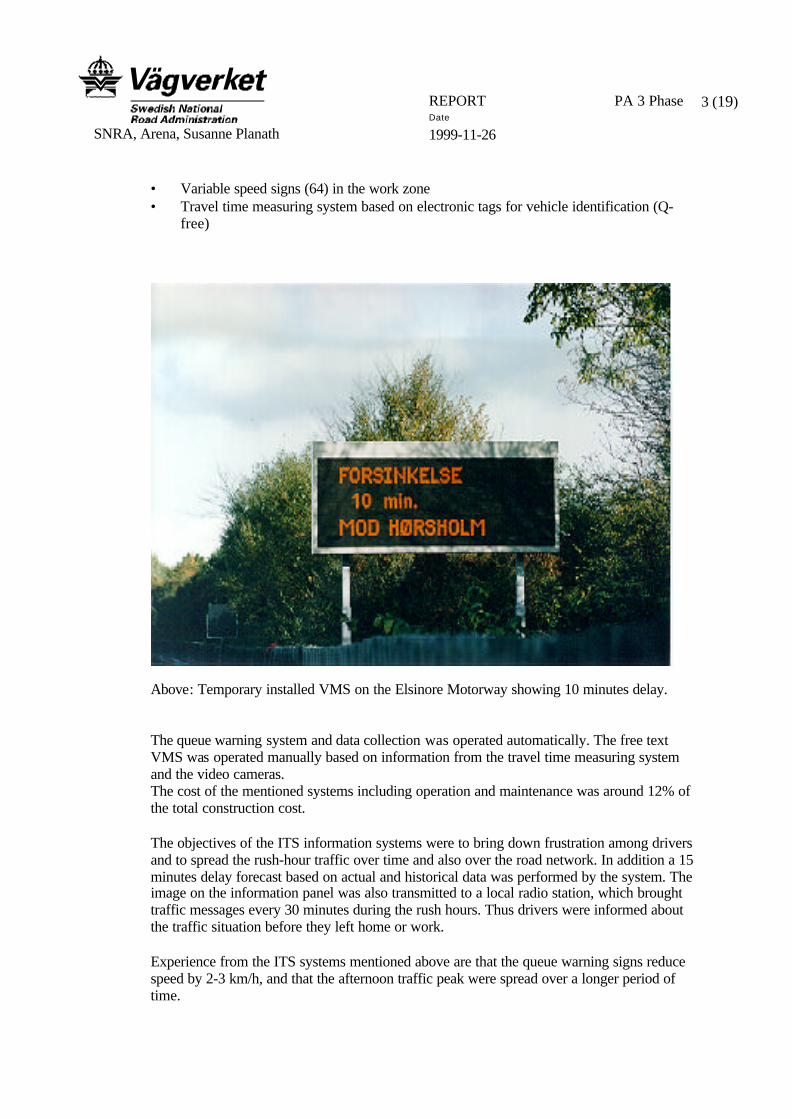
• Variable speed signs (64) in the work zone• Travel time measuring system based on electronic tags for vehicle identification (Q-
free)
Above: Temporary installed VMS on the Elsinore Motorway showing 10 minutes delay.
The queue warning system and data collection was operated automatically. The free textVMS was operated manually based on information from the travel time measuring systemand the video cameras.The cost of the mentioned systems including operation and maintenance was around 12% ofthe total construction cost.
The objectives of the ITS information systems were to bring down frustration among driversand to spread the rush-hour traffic over time and also over the road network. In addition a 15minutes delay forecast based on actual and historical data was performed by the system. Theimage on the information panel was also transmitted to a local radio station, which broughttraffic messages every 30 minutes during the rush hours. Thus drivers were informed aboutthe traffic situation before they left home or work.
Experience from the ITS systems mentioned above are that the queue warning signs reducespeed by 2-3 km/h, and that the afternoon traffic peak were spread over a longer period oftime.
REPORT PA 3 Phase3 report
4 (19)
SNRA, Arena, Susanne PlanathDate
1999-11-26
The Danish side of the Öresund Cross-border link will host 3 VMS signs to be used inconnection with bridge closures. The expectations are that the bridge may be closed for afew hours per year. Comparison has been made with the Great Belt Bridge, which is placedat the same angle referring to wind conditions. In it’s first 1.5 years of operation, the GreatBelt Bridge has been completely closed once for 10 hours, and closed for vehicles speciallysensitive to strong wind 22 times for approximately 1-2 hours each time.
FinlandThe Finnish national input of the seminars has been written totally under the headline ofVMS because of the systems like MCS is used also outside motorways in Finland.
In Finland FINNRA published guidelines for the use of variable speed limits in 1999. Futureplans include compiling policy papers, before/after studies, specification of data collectionrequirements, technical matters etc. Today VMS are used in Finland for variable speed limitson road sections and single spots, variable warning signs and lane control, bridge control andcongestion warning system. In Finland was used also route guidance system in the beginningof 1990’s.
The first work regarding VMS in Finland was carried out through signs displaying speedadvice for green wave on ring road 3 in Helsinki as early as 1975. Experience gained at thisstage was that there was no acceptance by the drivers and therefore no benefits. This couldrelate to the low traffic volume. In 1987 the Road traffic act was passed acceptingblack/white variable speed limit signs. Between 1994-1999 “big systems” such as weathercontrolled variable speed limits and warning signs, variable route guidance, variable lanecontrol system, bridge control system and congestion warning system have been installed.
Problems that have been encountered during the work period is that there is a lack of policiesand guidelines which might result in repeated mistakes and the problem of handing out”different messages in the same situation”/”same message in different situations”.
In 1996 FINNRA established a policy of experiments and use of VMS. Information of everyapplication goes in to the so-called traffic management toolbox. All new systems must beevaluated before implementation.In 1999 guidelines for the use of variable speed limits were published.The objectives of variable speed limits is to• Bring down the number of accidents and alleviating their consequences• Improving traffic flow• Give the driver a chance to choose his speed
Road types where variable speed limits should be considered include motorways, semi-motorways and high volume roads. Today variable speed limits are used on 140 km of theFinnish road network. For the future was made a proposal of an extension to 1000 kmconcentrated to the southern part of Finland and to the larger cities. If the proposal isincreased to 2500 km the network between the cities will also be included connecting thecities. However, the use of variable speed limit signs can not really be anticipated on the lowvolume road as extensively because of making the connection of the cities into somewhat ofan “overkill”.
REPORT PA 3 Phase3 report
5 (19)
SNRA, Arena, Susanne PlanathDate
1999-11-26
Finnra recommends automatic operation of the variable speed limit system rather thanmanual operation.
The traffic management centres enforce the use of variable speed limit signs.
The fibre optic VMS used by Finnra has been developed in co-operation with the Finnishindustries. During 1995-1996 functional tests were carried out in Lappland where 10 types ofsigns, originated from Finland, Austria, Germany, Sweden, Norway, Canada and Finlandwere tested. After one year only 4 signs were without damage. The results were discussedwith the VMS suppliers to try to solve the problems northern countries experience andimprove the mechanical solution. The mechanical and technical durability of VMS wasstressed as a very important co-operational action of northern countries for more welldesigned VMS.
The VMS signs in some areas in Finland are bilingual since there are two official languagesin the country. Signs comprise of a symbol (e.g. slippery road) on top and one part consistingof 10 positions and 2 lines below for text messages. Text messages are used for addedfunctionality and contains an explanation of the symbol and usually a description of thestretch concerned.
The E18 test area stretches across southern Finland all the way to the Russian border andconnects Finland to Sweden by ferry. The E18 stretch has a total length of about 350 km, ofwhich 150 km is a motorway or dual-carriage road.The test area comprises of 40 weather stations, 11 weather/road condition cameras, 22automatic traffic monitoring stations, 66+31 Variable Speed Limit signs and 13+8 variablewarning and information signs.
Experience gained from the E18 project are that the driver acceptance of the VSL and VMSsigns is high, up to 95%, but, as in most countries work needs to be carried out to solve theeconomical problems. Cost/benefit analysis had been made, but the results were too low. Ofcourse this was due to the relatively low number of installations.Between Pyhtää and Hamina the E18 road is equipped with a weather controlled trafficmanagement system.
When entering the weather-controlled stretch the driver is informed of the ITS systemthrough a fixed information sign. The background to weather controlled road is to allow asuitable speed limit for each road section according to the weather situation. VMS withadditional panels are used for roadwork, slippery road and other dangers. Additionalmessages on the panel (2 lines 10 characters) are usually air and road temperature. Roadcondition categories are good, normal, poor and very poor.• Evaluation of the weather-controlled road gave the following indications• 95% of the drivers’ think the VSL according to existing road conditions are both useful
and they increase traffic safety.• over 80% of the drivers felt that the speed limit was appropriateDrivers would like more weather-controlled road sections with VSL signs.
REPORT PA 3 Phase3 report
6 (19)
SNRA, Arena, Susanne PlanathDate
1999-11-26
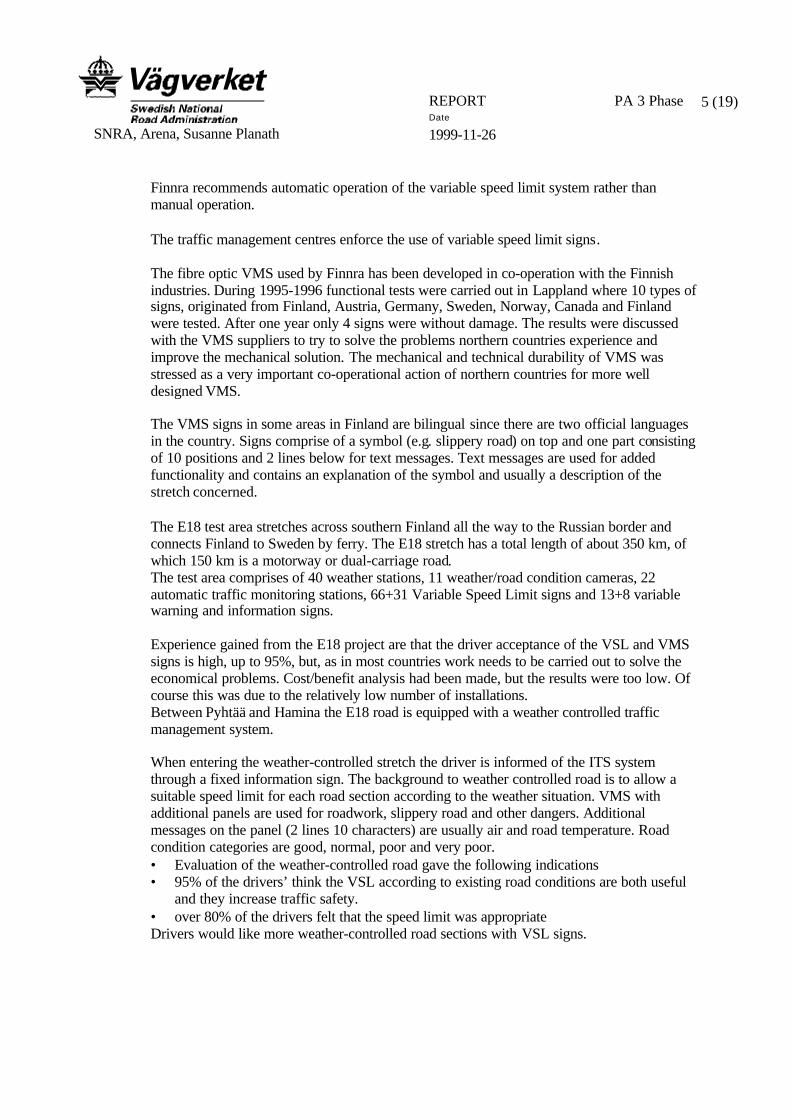
Below: Picture showing the E18 weather control VSL sign.
The western artery congestion warning system is west from Helsinki and it includessomewhat 30 fibre optic VMS/VSL signs. The congestion warning system is also connectedto the road weather stations and if necessary the VMS/VSL signs can be used as warningsigns for slippery road.The speed limits on the VMS/VSL signs are mandatory.
The evaluation of the congestion warning system is carried out independently from what hasbeen done in other countries. A lot of evaluation has been carried out within this field inGermany and guidelines and results would be of interest to all countries present.
Future work on traffic management area will focus on gaining more knowledge of effectsand impacts of VMS, development of operational and technical guidelines and Trans-European Network guidelines. A very important issue concerning VMS is if we need thistype of roadside equipment in the future or if in-car equipment will become general enoughfor traffic management. This issue has bearing on traffic management both in nearer as wellas broader perspective.
The plans for the nearest future 1999-2001• For the systems in use
• Written policy papers• Training of operators at the TMCs• Study of effects• Adding factors
REPORT PA 3 Phase3 report
7 (19)
SNRA, Arena, Susanne PlanathDate
1999-11-26
• For new systems• Before-after studies• Selection of new road segments
• Separate studies• Technical matters• Use of speed limits in 10 km/h intervals• Data collection requirements
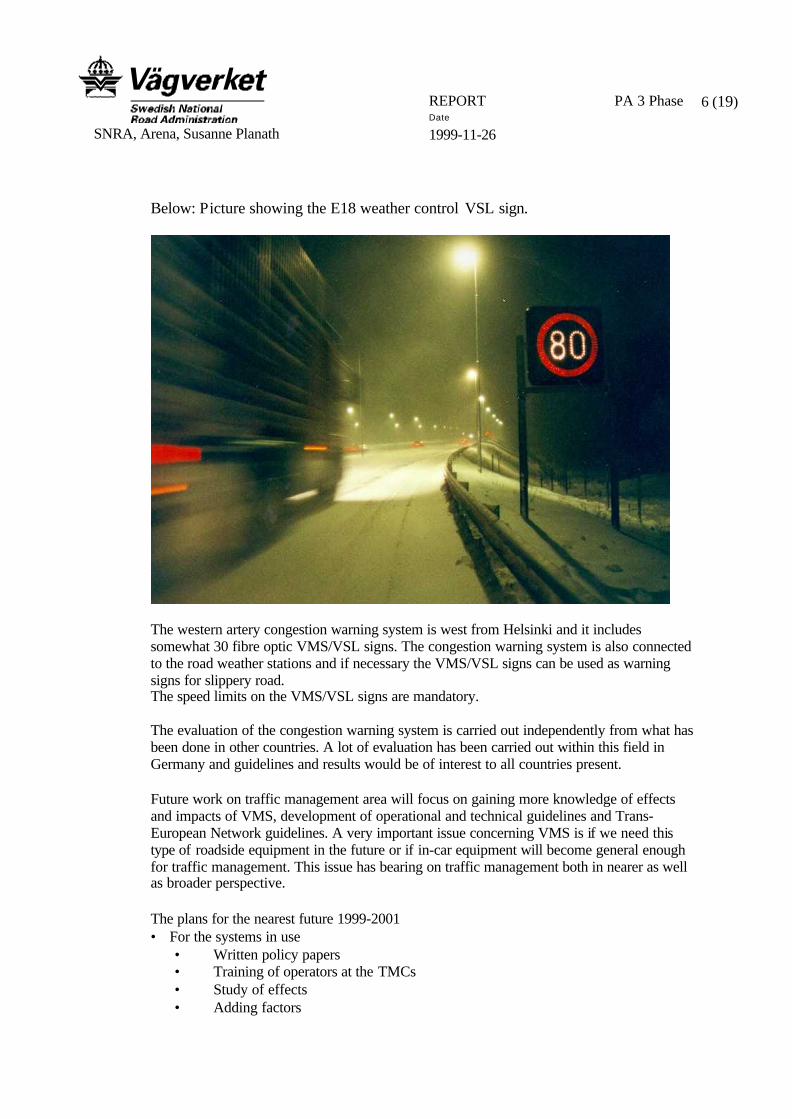
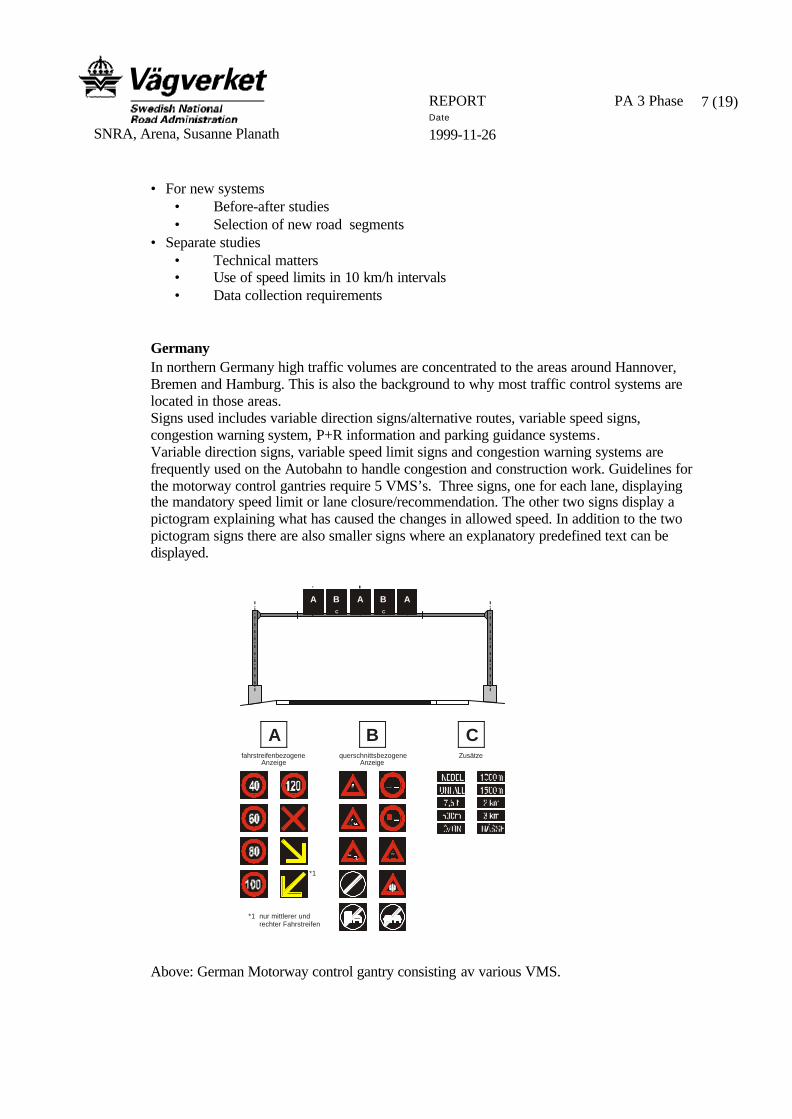
GermanyIn northern Germany high traffic volumes are concentrated to the areas around Hannover,Bremen and Hamburg. This is also the background to why most traffic control systems arelocated in those areas.Signs used includes variable direction signs/alternative routes, variable speed signs,congestion warning system, P+R information and parking guidance systems.Variable direction signs, variable speed limit signs and congestion warning systems arefrequently used on the Autobahn to handle congestion and construction work. Guidelines forthe motorway control gantries require 5 VMS’s. Three signs, one for each lane, displayingthe mandatory speed limit or lane closure/recommendation. The other two signs display apictogram explaining what has caused the changes in allowed speed. In addition to the twopictogram signs there are also smaller signs where an explanatory predefined text can bedisplayed.
Above: German Motorway control gantry consisting av various VMS.
B CAquerschnittsbezogene
AnzeigeZusätzefahrstreifenbezogene
Anzeige
*1
*1 nur mittlerer und rechter Fahrstreifen
A B A B AC C
REPORT PA 3 Phase3 report
8 (19)
SNRA, Arena, Susanne PlanathDate
1999-11-26
The design is standardised in the guidelinesRWVA: Richtlinien für Wechselverkehrszeichenanlagen an Bundesfernstraßen (Guidelines
for Variable Message Sign systems on motorways) andRWVZ: Richtlinien für Wechselverkehrszeichen an Bundesfernstraßen (Guidelines for
Variable Message Signs on motorways
Experience show that the information on the gantries is very appreciated.In Germany variable speed signs are mandatory through the red ring around the speed limit.Co-operation with the Police force ensures that the drivers respect the speed limits.
NorwayGardermoen airport was opened in October 1998. Problems caused by traffic to and from theairport were to be solved by a high-speed railway between Oslo central station and theairport. A year before the opening difficulties occurred in the tunnels on the stretch causingtravel-times up to 33 minutes instead of the expected 19 minutes. NPRA had 5 months toprevent the road traffic problems. The solution was found to be travel-time information.Distribution to the public was to be carried out through GSM-text, radio, the Internet, aspecial phone number and 9 VMS signs.The travel-time estimate is calculated at 5 minutes interval. Forecasts can not be given, butthe tendency is calculated by looking at the data available 5 minutes before.If the travel-time exceed 44 minutes (to be compared with the “normal travel-time” of 36minutes) tendency and travel-time are displayed on the VMS signs.The evaluation of the information system is in progress. So far there has been positiveresponse from the public.Plans for the future is to extend the traveltime system to other stretches and look into a PTguiding system.
SwedenIn Sweden SNRA is in the process of approving guidelines on VMS for design, constructionand planning. A lot off work has also been carried out regarding evaluation of how VMSsigns are perceived, understood and what effect they have on traffic. Future plans includenational guidelines on the total VMS chain, that is from idea to implementation and use.
In 1998 a study was made of which documents that were needed for ITS. VMS wasconsidered a very important area and it was decided that national guidelines would be thefirst document that should be written. The following step should be a document on technicaldemands and strategy.The VMS guideline report is currently being reviewed by the SNRA organisation. Approvalof the document is scheduled to later this year and after that the guidelines will beincorporated in the national guidelines for road design (VU 94).The document comprises of• definitions• guidelines for where VMS should be used• work plan for design• classification of signs• regulations of where the signs should be placed• message standards• recommendations of choices of techniques and sign size
REPORT PA 3 Phase3 report
9 (19)
SNRA, Arena, Susanne PlanathDate
1999-11-26
• what colours should be used on the signs• guidelines for yellow blinking warning lights in connection to the VMS signs
VMS signs in Sweden includes smaller VMS signs used for bridge opening and large threeline VMSs on the main access roads into the Gothenburg city, smaller speed limit/directionsigns used in the tunnel management systems, P-information and guidance system and PTinformation VMSs. A lot of work has been carried out over the years regarding evaluation ofthe large three line VMS signs, how they are perceived, understood and what effect theyhave on traffic. Results show that the messages were very well understood, the informationis seen as very useful and the functionality was very reliable. Different types of messageshave been compared showing that accident and alternative route information is found to havethe greatest value to the road users. Future plans for VMS in Sweden include mobile VMS,adding symbols to the existing signs, displaying departure times for car ferries, travel timeinformation, variable speed signs and the national guidelines on VMS.
For the cross-border region of Öresund (between Sweden and Denmark) the plans for theSwedish side of the link are active sign systems in connection to traffic loop sensors. Theaims of the applications is to• Decrease the number of accidents• Provide information on alternative routes. (The Malmö region has very good opportunities
of re-routing traffic.)
The VMS system that is planned consists of signs, which will be manually activated afterinformation from an automatic detection system. The plans include somewhat 23 largerVMS and 23 smaller (budgeted to approximately 20 MSKr in total), but no decision has beenmade so far. The signs will only display information in Swedish even though 20% of theroad users do not understand Swedish. A possible solution to this problem is to use icons,which is being considered.
Note:One issue that has been on the agenda during one of the VIKING seminars was the Europeanwork on VMS. Apparently only Finland has been represented at the European Standardisation ofVMS meetings. It was stressed that the other VIKING countries need to take their responsibilitiesin this work to get a stronger influence with a Northern Europe approach. Through this worklarger effects can be expected at discussion with suppliers when it comes to issues like newdesigns, weather resistant constructions, larger production volumes etc.
Traffic and prediction modelsTraffic models that have been and are being used include SPOT/UTOPIA (intersection and PTmodelling), HUTSIM, NETSIM, CONTRAM and TRIPS.Co-operation between Viking partners within this area was found as potentially useful. Issues to bediscussed further would then be for example “How can we use output of data for implementation?”
The VIKING countries share a lot of experience within the traffic signal area. SPOT is widely usedand a lot of common issues were raised during the Oslo seminar. As a direct result of the discussionsin Oslo a workshop on SPOT was arranged by VIKING PA3 in Stockholm in October.
The program included the following discussion points:
REPORT PA 3 Phase3 report
10 (19)
SNRA, Arena, Susanne PlanathDate
1999-11-26
• Experience from SPOT installations• Simulation as a tool to evaluate SPOT• SPOT improvements;
• general interface to controller• improved VA-control• faster update of SPOT• joint efforts
• User manuals and education• SPOT user forum
National input
DenmarkFor travel time monitoring a system was developed during the re-construction of theE47/E55. The system is no longer in use, but served both as information application and as aknowledge project during the 1,5 years it was is use.The traveltime system used 2200 cars equipped with tags transmitting information at 13certain measuring points. The tags could not be connected to the specific car or driver. Thecalculated delays were up-dated every minute and then presented to the operator at the trafficinformation centre. To reduce the problem of predicting congestion two prognosis modelswere developed, one for “expected delay now” and one “expected delay in 15 minutes”.Conclusions from the travel time system were the following:• The system worked OK• There were too few tags• The prognosis model was successful• A more independent system should be considered in future projects with similar
circumstances.
ASTRID is an off-line system, for calculating the accessibility on the motorway network inDenmark.The system is used for• Calculating and analysing delays. Delays etc. can be calculated by vehicle. Problems
occur when queues go outside the detection area.• Planning the Copenhagen traffic system both for personal traffic and for Public
Transport.• Identify bottlenecks in the traffic system.• Information collection on traffic problems, when, what, where, how, frequency etc.
Information based on ASTRID data will be put on the Road Directorates website in the nearfuture.
GermanyControl algorithms/models are almost based on the guidelineMARZ Merkblatt für die Ausstattung von Verkehrsrechnerzentralen und Unterzentralen
(Leaflet for the Equipment of Traffic Control Computer and Subcontrol Centres)Some of the described models in the MARZ are the following ones:Harmonisation of speedCongestion warning
REPORT PA 3 Phase3 report
11 (19)
SNRA, Arena, Susanne PlanathDate
1999-11-26
Wetness warningFog warningRestriction on overtaking for lorriesA.o.m.Additionally models are developed in the research departments of universities. Per examplethe simulation tool PELOPS, which has been used to investigate optimisation of traffic flowsbut also for simulating driving behaviour in the Elbe tunnel. The driver has no opticalguidance today, which causes uneven traffic flows, due to the fact that the driver can not feel ifhe is going down or up hill. By supplying a running line of lights moving at the intended speedthe driver is urged to adjust his/hers speed to match the light. This tool was a research work.There was no further realisation.
NorwayIn Oslo 4 intersections had been evaluated using SPOT/UTOPIA. Regional analysis show 40-50% improvement in traffic flows in the morning. In the afternoon the improvement in trafficflow is about 15%. A study has also been carried out for Public Transport, but no results areavailable yet. For the future there are plans for a larger study including 40 intersections.Expansion of the SPOT system in Oslo is technically possible, but depends on the budgetavailable.In Bergen simulations of SPOT has been made comprising of 9 intersections. There are plansto expand the system to 25 intersections during next spring. Results from Bergen indicateimprovements in total travel time with 3,9% and in total delay 7,8%. Simulations with 20%overload resulted in 14,1% improvement regarding total travel time and 20,3% on total delay.Trondheim (Norway) will also invest money in intelligent traffic signals in the future.
In Norway CONTRAM is only used for smaller areas. On larger areas more strategic modelssuch as TRIPS is used. The modeltypes are not integrated, but the results from CONTRAMmay be fed into TRIPS.
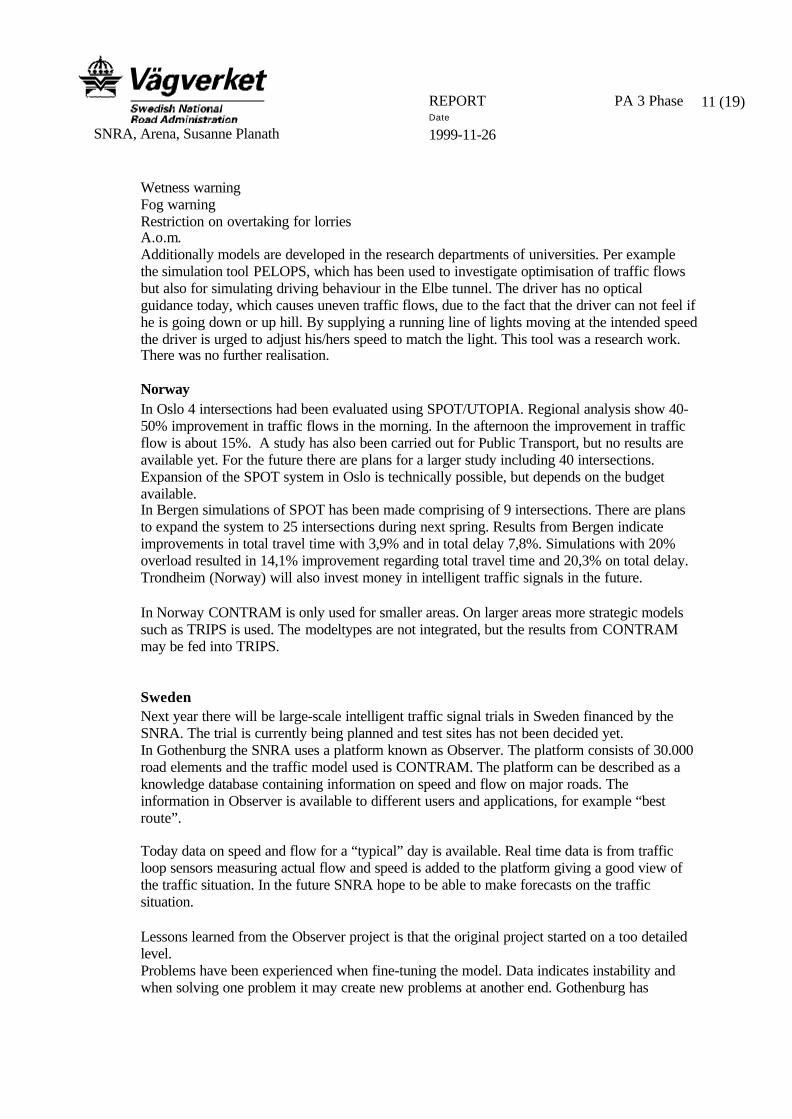
SwedenNext year there will be large-scale intelligent traffic signal trials in Sweden financed by theSNRA. The trial is currently being planned and test sites has not been decided yet.In Gothenburg the SNRA uses a platform known as Observer. The platform consists of 30.000road elements and the traffic model used is CONTRAM. The platform can be described as aknowledge database containing information on speed and flow on major roads. Theinformation in Observer is available to different users and applications, for example “bestroute”.
Today data on speed and flow for a “typical” day is available. Real time data is from trafficloop sensors measuring actual flow and speed is added to the platform giving a good view ofthe traffic situation. In the future SNRA hope to be able to make forecasts on the trafficsituation.
Lessons learned from the Observer project is that the original project started on a too detailedlevel.Problems have been experienced when fine-tuning the model. Data indicates instability andwhen solving one problem it may create new problems at another end. Gothenburg has
REPORT PA 3 Phase3 report
12 (19)
SNRA, Arena, Susanne PlanathDate
1999-11-26
realised that a detailed model is not realistic on the complete road network, but the efforts areinstead concentrated on problem areas and the main road network.
Above: Picture from Observer displaying the best route between two points.
Traffic models have been used in Sweden for a number of years, but these models havemostly been static. The need for dynamic models initiated the so-called Dirigent project.It is run on a national basis with focus on the Stockholm and Gothenburg regions. Thepurpose of the project is to develop models for traffic monitoring and planning. TheObserver project mentioned above co-operates with Dirigent.
In Stockholm the Dirigent project involves the demonstration of a “town Supervisor”, TS.The TS is based on Contram data and will supply a picture of real time traffic based onhistorical and real-time traffic data. Trials and evaluations will also be carried out for aprediction model for travel times. In Stockholm a platform, UTVIST, for development ofITS applications is also under development. UTVIST will develop, test and evaluate newapplications and deliver approved applications for sharp operations. UTVIST uses data bothfrom Dirigent and TS and is also connected to partners outside the SNRA.
MCSMotorway Control Systems are used in all of the VIKING countries. MCS functions include variablespeed, lane closure, queue detection/warning, high vehicle detection, weather information, VMS signs,cameras etc.
REPORT PA 3 Phase3 report
13 (19)
SNRA, Arena, Susanne PlanathDate
1999-11-26
Discussions at the seminars have touched subjects like the tendering process, functionality, problemsand evaluation.
National input
DenmarkThe Limfjord TunnelA contractor has been signed for implementing a video detection system in the Limfjordtunnel in Aalborg. The company was contracted on a functional specification and the Roadadministration is very happy with the outcome of this process. 4 companies were invited tothe tendering where only the function was specified. As a requirement in the contract thecontractor needed to verify the system during one year after installation. The period was tobe extended if the requirements were not fulfilled. The system will not be handed overbefore the fulfilment of the verification period. A thought for future work is to let differentcompanies compete during a practical test period.
The Limfjord Tunnel installation comprises of 14 cameras per tube of which 7-9 werealready available/tube.Detection of a vehicle results in• Automatic switch on of cameras• Highlight of alarm object on CCTV-monitor• Alarm through SCADA-system• Automatic traffic restriction• Automatic VCR-recording
The system is operated by the police force.
The evaluation of the system has been made by live traffic tests as well as runs with test cars.The problems the AID system has encountered have been divided into• Contractor related problems since the system is a new product.• External problems since there have been roadwork on the stretch that has been evaluated
causing difficulties in separating true and false alarms.• Technical problems such as shifting light conditions, reflections from car headlights, too
few cameras and the placements and direction of cameras etc.
Conclusions of the whole AID process so far is that DRD is very happy with the functionaltender/contract method. They think they could not have dealt with the matter otherwise. Athought for future work is to let different companies compete during a practical test period.
GermanyIn Germany most of the Traffic Control Systems are based on the following guidelines
TLS Technische Lieferbedingungen für Streckenstationen (TechnicalConditions of Delivery for Local Controlers)
MARZ Merkblatt für die Ausstattung von Verkehrsrechner-zentralen undUnterzentralen (Leaflet for the Equipment of Traffic Control Computer andSubcontrol Centres)
REPORT PA 3 Phase3 report
14 (19)
SNRA, Arena, Susanne PlanathDate
1999-11-26
RWVA Richtlinien für Wechselverkehrszeichenanlagen an Bundesfernstraßen(Guidelines for Variable Message Sign (VMS) systems on motorways)
RWVZ Richtlinien für Wechselverkehrszeichen an Bundesfernstraßen(Guidelines for Variable Message Signs (VMS) on motorways)
In the following there are described most of the Traffic Control Systems in the northern partof Germany:The Elbetunnel in Hamburg was built in 1975 and consists of three tubes where traffic canbe diverted in the middle tube. An additional tube is under construction. The planned tunnelcontrol system will operate computer aided. Operators can switch prepared programs. Thereare also possibilities for the operator for manually interventions.For monitoring the traffic, there are cameras covering the tunnel. The distance between twocameras is 150-200 meter and the operators are able to zoom the cameras.There is a warning system for high lorries where a lane is closed if a lorry is too high.At the beginning of the tunnel there is a congestion warning system where the road-users areinformed by VMS-signs. Additional to the construction of the 4th tube, the congestionwarning system will be replaced by am modern Traffic Control System.The MCS in the Bremen area has been operating since 1996. A new multimodal TrafficManagement Centre is under planning and the existing MCS will be integrated into the newcentre.
The MCS system in Niedersachsen consists of information from loop/radar detectors andweather stations. Traffic is controlled by VMS signs through an automatic system. However,it can be overruled manually by an operator at the TCC. Different control centres and subcentres can monitor the traffic but to manage and control the VMS signs you need apassword. Different centres control different sections. The system is considered flexible andeasy to extend.The congestion warning system is operated automatically through information from theloop/radar detectors. The input from these sensors controls the VMS’s on the gantries anddue to the conditions suitable speeds and pictograms are displayed (see also under section onVMS). The motorways are also controlled due to construction work, accidents, overtakingrestrictions and road weather conditions.
Germany has a lot of experience when it comes to calculating cost/benefit and motivate therelatively large investments extensions of existing MCS systems and new systems involve.All investments have to be investigated through cost/benefit analysis before the decisions aremade. The analysis also includes an estimated investment cost based on experience.Germany has been working with these issues for the last 10-12 years.
An example of a draft guideline regarding the expansion of an existing system can bedescribed as the following• Description of measure• Necessity of measure• Technical design of measure• Explanation of cost calculation (including specifications)• Estimation of economic benefit (reduction of accident rate, comparison of cost and
benefit)• Conclusions
REPORT PA 3 Phase3 report
15 (19)
SNRA, Arena, Susanne PlanathDate
1999-11-26
Calculations of reduction of accidents for a new project build on statistics from earlierprojects. One year after implementation there are follow-up activities to give feedback to thecalculations.
When discussing how much work that has been carried out within the other Viking countriesin the cost/benefit area Finland has done some work, but has not come as far as Germany. InDenmark and Sweden no evaluation of ITS impacts has been made.
NorwayThe tunnels in Oslo have a common system for detection and monitoring. There is nodynamic control system instead the system is operated manually. The section betweengantries is 600-700 metres. The tunnels have full coverage by cameras which means 1camera every 60-70 meters.Apart from the cameras in the tunnels there is also a 3 km test-site out side the tunnelsequipped with ITV cameras. There are plans for a MCS system, but no contract has beensigned so far.
The Oslo-Gardermoen stretch is 49 km and to collect data for estimating travel-times AIDcameras were installed on 23 “double direction points” (i.e. 46 videobased measurementpoints). Adding 8 existing traffic sensor loops and 35 video CCTV cameras the stretch has100% data coverage.The travel-time estimate is based on the points mentioned above measuring at 5 minutesinterval. The time is calculated through aggregating the timeslices from the differentroadsegments. Forecasts can not be given, but the tendency is calculated by looking at thedata available 5 minutes before.Conclusions from the Gardermoen system video based detection system supplied by Siemensare• Problems with headlights during night time• Algorithm needed for each weather/light condition• Not a “plug and play” system.
SwedenThe MCS system used, as National Standard by the SNRA is a Dutch system developed bythe Rijkswaterstaat. It is considered to be a robust, reliable and functional system. The MCSsystem has automatical queue and incident detection, but closing of lanes is made manually.The system is installed as motorway control system in Stockholm and as tunnel controlsystem in Gothenburg.
REPORT PA 3 Phase3 report
16 (19)
SNRA, Arena, Susanne PlanathDate
1999-11-26
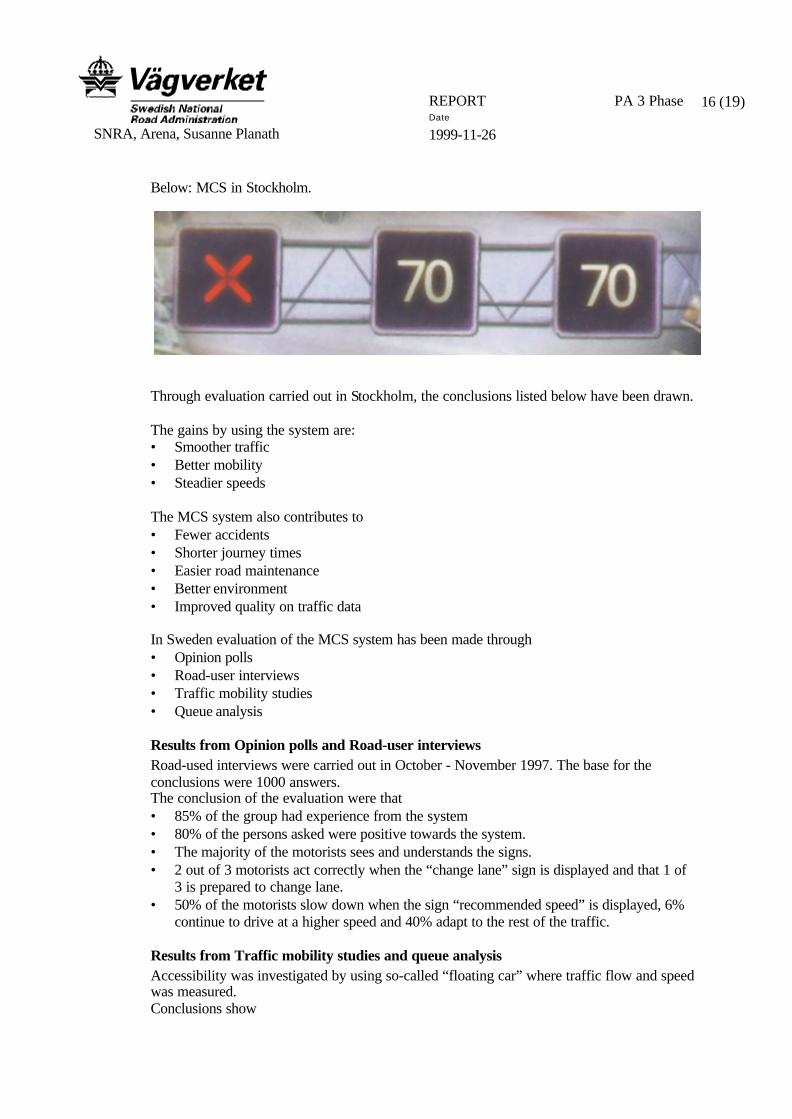
Below: MCS in Stockholm.
Through evaluation carried out in Stockholm, the conclusions listed below have been drawn.
The gains by using the system are:• Smoother traffic• Better mobility• Steadier speeds
The MCS system also contributes to• Fewer accidents• Shorter journey times• Easier road maintenance• Better environment• Improved quality on traffic data
In Sweden evaluation of the MCS system has been made through• Opinion polls• Road-user interviews• Traffic mobility studies• Queue analysis
Results from Opinion polls and Road-user interviewsRoad-used interviews were carried out in October - November 1997. The base for theconclusions were 1000 answers.The conclusion of the evaluation were that• 85% of the group had experience from the system• 80% of the persons asked were positive towards the system.• The majority of the motorists sees and understands the signs.• 2 out of 3 motorists act correctly when the “change lane” sign is displayed and that 1 of
3 is prepared to change lane.• 50% of the motorists slow down when the sign “recommended speed” is displayed, 6%
continue to drive at a higher speed and 40% adapt to the rest of the traffic.
Results from Traffic mobility studies and queue analysisAccessibility was investigated by using so-called “floating car” where traffic flow and speedwas measured.Conclusions show
REPORT PA 3 Phase3 report
17 (19)
SNRA, Arena, Susanne PlanathDate
1999-11-26
• improvement in traffic safety by 25%• increase by 5% in capacity• improvement in “driving comfort”• reduction in difference between highest and lowest speed• reduction in fuel consumption.
Norway, Denmark and Finland were all about to conduct the same type of evaluation and itwas agreed to bee a good idea if all countries conducted the study in the same way.
During the Stockholm seminar, the group discussed speed limits within MCS systems. InSweden the speeds are only recommended maximum speed. Germany, Finland, Denmarkand Norway however all have mandatory speed limits. In the “mandatory countries” thespeed limits are enforced by the Police or automatic speed control check-up by camera(Norway). In Sweden the Police has no resources to use for everyday speed control andtherefore there is only the recommendation. The experience of the group was that there needsto be police check-ups to make the road-users keep the speed limit.
Suggestions for the future PA 3 work
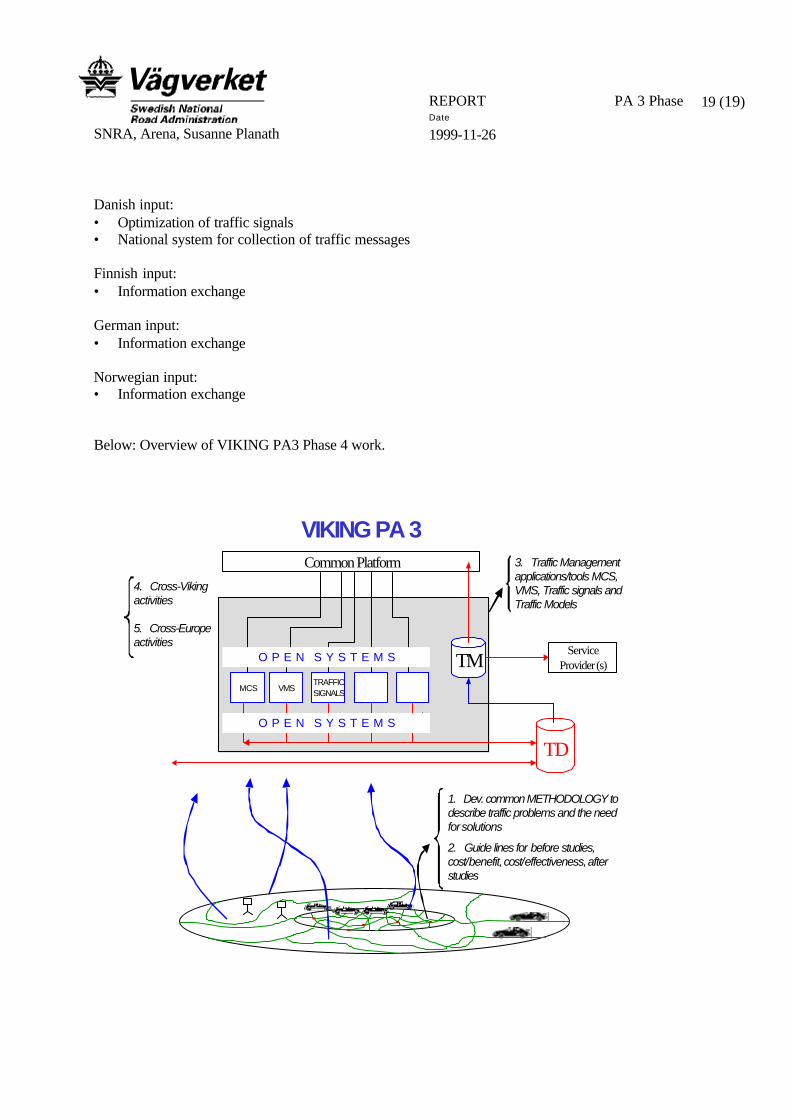
The figure below visualises the future tasks for PA3, Activity 30 ”Common development of trafficmanagement tools”.
The work can be divided into 5 groups1. The development of a common methodology to describe traffic problems and also to describe
the solutions.2. The creation of guidelines for ”before”-studies, cost/benefit and cost /effectiveness
calculations, and finally ”after”-studies.3. The definition of open and common interfaces to the traffic control centres, traffic databases
and traffic management applications and tools such as VMS, MCS, Traffic models and Trafficsignals.
4. Active participation in Cross-Viking activities.5. Active participation in Cross-Europe activities
The aim of the work carried out during Phase 4 is to start compiling a VIKING-common specificationfor the suppliers of applications and tools.
There is a need of discussion between the other PA’s, for instance regarding Traffic Models, so thatthe right group carries out the right work. The work carried out within Activity 30 is also to serve asinput to the other activities in PA3.
Ideas for the future work include working-groups and evaluation network to learn from each othersexperience.
There is also need for a follow-up on SPOT seminar.
Each country is to specify work that can be used in steps 1-3 specified above.
REPORT PA 3 Phase3 report
18 (19)
SNRA, Arena, Susanne PlanathDate
1999-11-26
Input to the Phase 4 Common work:
Step 1, Development of common Methodology to describe traffic problems and the need forsolutionsSwedish input• Accessibility studies for Stockholm, Malmö and Gothenburg• ”Trängsel i tätort” (“Crowding in densly built-up areas”)• Traffic safety analysis
Danish input:• “Trængsel i København” (Crowding in Copenhagen)• Motorways in the Greater Copenhagen area (accessibility studies and suggested solutions)TRIM concept on non-motorways (Description of the traffic situation based on single loop detectors)
Finnish input:• Information exchange of completed and ongoing projects
German input:• Information exchange of completed and ongoing projects
Norwegian input:• Information exchange of completed and ongoing projects
Step 2, Guidelines for calculating cos/benefit and/or cost/effectivenessSwedish input• ”PLUTO”, planering av utvärdering vid införande av väginformatiktillämpningar (Plan for
evaluation before implementing ITS)
Danish input:• Evaluation of ramp metering• P+R activities (selection of locations, evaluation )
Finnish input:• Information exchange of completed and ongoing projects
German input:• Information exchange of completed and ongoing projects
Norwegian input:• Information exchange of completed and ongoing projects
Step 3, Definition of interfaces to applications and TICSwedish input• “GTIS”, gemensam trafikdatabas i Sverige (Common traffic database in Sweden)
REPORT PA 3 Phase3 report
19 (19)
SNRA, Arena, Susanne PlanathDate
1999-11-26
Danish input:• Optimization of traffic signals• National system for collection of traffic messages
Finnish input:• Information exchange
German input:• Information exchange
Norwegian input:• Information exchange
Below: Overview of VIKING PA3 Phase 4 work.
VIKING PA 3
VMS
1. Dev. common METHODOLOGY todescribe traffic problems and the needfor solutions
2. Guide lines for before studies,cost/benefit, cost/effectiveness, afterstudies
O P E N S Y S T E M S
TD
TM
O P E N S Y S T E M S
3. Traffic Managementapplications/tools MCS,VMS, Traffic signals andTraffic Models
MCSTRAFFICSIGNALS
Common Platform4. Cross-Vikingactivities
5. Cross-Europeactivities
ServiceProvider (s)


![PA-TAF [opción-3]](https://img.pdfslide.us/doc/110x75/577ce3bf1a28abf1038ce8f0/pa-taf-opcion-3.jpg)