Embed Size (px)
Citation preview

Grid Service Charges 2012-2013: Phase 1 - 2011/12 Fixed and
Variable Operating Expenditure Benchmark Review
Grid Service Provider: LinkWater
June 2012

The SKM logo trade mark is a registered trade mark of Sinclair Knight Merz Pty Ltd.
Grid Service Charges 2012-2013
PHASE 1 – 2011/12 FIXED AND VARIABLE OPERATING EXPENDITURE BENCHMARK REVIEW – LINKWATER
Rev 4 Final 7 June 2012
Sinclair Knight Merz ABN 37 001 024 095 Cnr of Cordelia and Russell Street South Brisbane QLD 4101 Australia PO Box 3848 South Brisbane QLD 4101 Australia Tel: +61 7 3026 7100 Fax: +61 7 3026 7300 Web: www.skmconsulting.com COPYRIGHT: The concepts and information contained in this document are the property of Sinclair Knight Merz Pty Ltd. Use or copying of this document in whole or in part without the written permission of Sinclair Knight Merz constitutes an infringement of copyright.
LIMITATION: This report has been prepared on behalf of and for the exclusive use of Sinclair Knight Merz Pty Ltd’s Client, and is subject to and issued in connection with the provisions of the agreement between Sinclair Knight Merz and its Client. Sinclair Knight Merz accepts no liability or responsibility whatsoever for or in respect of any use of or reliance upon this report by any third party.
PAGE i
Contents 1. Executive summary 2
1.1. Background 2 1.2. Benchmarking Methodology 2 1.3. Corporate level benchmarking 3 1.4. Benchmarking by asset grouping 4 1.5. Asset specific benchmarking 4 1.6. Duplication of effort – LinkWater, contractors and SEQ Water Grid Manager 5 1.7. Summary and conclusions 6
2. Introduction 7 2.1. Terms of reference 8 2.1.1. Scope exclusions 8 2.2. Report overview 8
3. Background 9 3.1. Water Reform and Grid Entities 9 3.2. The role of the Authority 9 3.3. Role of the SEQ Water Grid Manager 9 3.4. Background to LinkWater 10
4. Benchmarking Methodology 11 4.1. Comparator water utility metrics 14 4.1.1. Water utilities approached 14 4.1.2. Response to information requests 15 4.1.3. Other information sources 16 4.1.4. Incomplete data and information 17
5. Corporate level benchmarking 18 5.1.1. Comparator water utility metrics 21 5.1.2. Benchmark comparison and discussion – Australian Entities 21 5.1.2.1. Total operating expenditure as a proportion of water supplied 23 5.1.2.2. Total operating expenditure as a proportion of non-current assets 25 5.1.2.3. Total employee cost as a proportion of total operating expenditure 26 5.1.2.4. Total operating expenditure as a proportion of total revenue 28 5.1.2.5. Total revenue as a proportion of total full-time equivalents 30 5.1.2.6. Total full-time equivalents as a proportion of non-current assets 33 5.1.2.7. Water supplied as a proportion of total full-time equivalents 35 5.1.2.8. Total employee cost as a proportion of total full-time equivalents 37 5.1.2.9. Total operating expenditure as a proportion of mains length 39

PAGE ii
5.1.3. Benchmark comparison and discussion – International Entities 40 5.1.3.1. Total operating expenditure as a proportion of water supplied 42 5.1.3.2. Total operating expenditure as a proportion of non-current assets 43 5.1.3.3. Total employee cost as a proportion of total operating expenditure 46 5.1.3.4. Total operating expenditure as a proportion of total revenue 47 5.1.3.5. Total revenue as a proportion of total full-time equivalents 49 5.1.3.6. Total full-time equivalents as a proportion of non-current assets 52 5.1.3.7. Water supplied as a proportion of total full-time equivalents 54 5.1.3.8. Total employee cost as a proportion of total full-time equivalents 56 5.1.3.9. Total operating expenditure as a proportion of mains length 58 5.1.4. Conclusions on corporate level benchmarking 59
6. Benchmarking by Asset Grouping 61 6.1. Water quality facilities 61 6.1.1. LinkWater metrics 61 6.1.2. Comparator water utility asset group metrics 62 6.2. Water pump stations 62 6.2.1. LinkWater metrics 63 6.2.2. Comparator water utility asset group metrics 64 6.3. Reservoirs 64 6.3.1. LinkWater metrics 64 6.3.2. Comparator water utility asset group metrics 66 6.3.3. Benchmark comparison and discussion 67 6.3.4. Conclusions on reservoir costs benchmarking 68 6.4. Bulk transmission schemes 68 6.4.1. LinkWater metrics 68 6.4.2. Comparator water utility asset group metrics 70 6.4.3. Benchmark comparison and discussion and conclusions 71 6.5. Asset group benchmarking overall summary 71
7. Asset specific benchmarking – Water quality facilities 72 7.1. Chambers Flat Water Quality Facility 72 7.1.1. LinkWater metrics 72 7.1.2. Comparator water utility asset metrics 73 7.2. Alexandra Hills Water Quality Facility 73 7.2.1. LinkWater metrics 74 7.2.2. Comparator water utility asset metrics 75 7.3. Summary and conclusions on water quality facility benchmarking 75
8. Asset specific benchmarking – Pump stations 76 8.1. Bundamba Pump Station 76 8.1.1. LinkWater metrics 76 8.1.2. Comparator water utility asset metrics 77
PAGE iii
8.2. Cameron’s Hill Pump Station 77 8.2.1. LinkWater metrics 78 8.2.2. Comparator water utility asset metrics 79 8.3. Mudgeeraba Pump Station 79 8.3.1. LinkWater metrics 80 8.3.2. Comparator water utility asset metrics 81 8.4. North Pine Pump Station 81 8.4.1. LinkWater metrics 82 8.4.2. Comparator water utility asset metrics 83 8.5. Trinder Park Pump Station 83 8.5.1. LinkWater metrics 83 8.5.2. Comparator water utility asset metrics 85 8.6. Summary and conclusions on pump station benchmarking 85
9. Asset specific benchmarking – Reservoirs 86 9.1. Aspley Reservoir 86 9.1.1. LinkWater metrics 86 9.1.2. Comparator water utility asset metrics 87 9.2. Green Hill Reservoirs 87 9.2.1. LinkWater metrics 87 9.2.2. Comparator water utility asset metrics 89 9.3. Narangba Reservoirs 89 9.3.1. LinkWater metrics 89 9.3.2. Comparator water utility asset metrics 91 9.4. Stapylton Reservoir 91 9.4.1. LinkWater metrics 91 9.4.2. Comparator water utility asset metrics 93 9.4.3. Benchmark comparison and discussion 94 9.4.4. Conclusions on Stapylton Reservoir costs benchmarking 96 9.5. Summary and conclusions on reservoir benchmarking 96
10. Asset specific benchmarking – Bulk transmission schemes 97 10.1. Northern Interconnector Pipeline (NPI) scheme 97 10.1.1. LinkWater metrics 97 10.1.2. Comparator water utility asset metrics 98 10.2. Anstead to Runcorn scheme 98 10.2.1. LinkWater metrics 99 10.2.2. Comparator water utility asset metrics 100 10.3. Mt Crosby to Wellers Hill scheme 100 10.3.1. LinkWater metrics 100 10.3.2. Comparator water utility asset metrics 102 10.4. North Pine Water Treatment Plant to Aspley scheme 102

PAGE iv
10.4.1. LinkWater metrics 102 10.4.2. Comparator water utility asset metrics 104 10.5. Ipswich Central Main scheme 104 10.5.1. LinkWater metrics 104 10.5.2. Comparator water utility asset metrics 106 10.6. Tarrant Drive to Elanora scheme 106 10.6.1. LinkWater metrics 106 10.6.2. Comparator water utility asset metrics 107 10.6.3. Benchmark comparison and discussion 107 10.6.4. Conclusions on Tarrant Drive to Elanora trunk main costs benchmarking 108 10.7. Logan Central Supply scheme 108 10.7.1. LinkWater metrics 108 10.7.2. Comparator water utility asset metrics 109 10.8. Narangba to North Pine Water Treatment Plant scheme 109 10.8.1. LinkWater metrics 110 10.8.2. Comparator water utility asset metrics 111 10.9. Heinemann Rd to Alex Hills trunk main 111 10.9.1. LinkWater metrics 111 10.9.2. Comparator water utility asset metrics 112 10.9.3. Benchmark comparison and discussion 113 10.10. Trunk main asset benchmarking summary 113
11. Duplication of effort – LinkWater, contractors and SEQ Water Grid Manager 115
11.1. Methodology 115 11.2. Overview of LinkWater information 116 11.3. Overview of Alliance Contractor information 116 11.4. Overview of SEQ Water Grid Manager’s information 117 11.5. Analysis of information and discussion on potential duplication 118 11.6. Summary and conclusions – duplication of effort analysis 130
12. Summary and conclusions 133 12.1. Benchmarking Methodology 133 12.2. Corporate level benchmarking 133 12.3. Benchmarking by Asset Grouping 134 12.4. Asset specific benchmarking 134 12.5. Duplication of effort – LinkWater, contractors and Water Grid Manager 135 12.6. Conclusions 136
Appendix A Terms of Reference 137 Appendix B LinkWater Data 142

PAGE v
Document history and status Revision Date issued Reviewed by Approved by Date approved Revision type
Rev 0 29/02/2012 T. Saxby S. Hinchliffe 29/02/2012 Draft – Issued for client comment
Rev 1 05/04/2012 T. Saxby S. Hinchliffe 05/04/2012 Draft – Issue for client comments
Rev 2 10/04/2012 T. Saxby S. Hinchliffe 10/04/2012 Draft addressing duplication of effort update
Rev 3 20/04/2012 T. Saxby S. Hinchliffe 10/04/2012 Draft – Issue for client comments
Rev 4 08/06/2012 T. Saxby S. Hinchliffe 07/06/2012 Final
Distribution of copies Revision Copy no Quantity Issued to
Rev 0 Electronic Electronic William Copeman, George Passmore & Chris Boulis
Rev 1 Electronic Electronic Client
Rev 2 Electronic Electronic Client
Rev 3 Electronic Electronic Client
Rev 4 Electronic Electronic Client
Printed: 7 June 2012
Last saved: 7 June 2012 01:09 PM
File name: QE06556 QCA GSPs Phase 1 Report LinkWater Rev 4.docx
Author: Michelle Strathdee
Project manager: Stephen Hinchliffe
Name of organisation: Queensland Competition Authority(QCA)
Name of project: Grid Service Charges 2012-2013
Name of document: Phase 1 – 2011/12 Fixed and Variable Operating Expenditure Benchmark Review – LinkWater
Document version: Rev 4
Project number: QE06556

SINCLAIR KNIGHT MERZ PAGE 1
Limitation statement The sole purpose of this report and the associated services performed by Sinclair Knight Merz Pty Ltd (SKM) is to assist the Queensland Competition Authority (the Authority) in its review of Grid Service Charges for the SEQ Water Grid in accordance with the scope of services set out in the contract between SKM and the Authority. That scope of services, as described in this report, was developed with the Authority.
In preparing this report, SKM has relied upon, and presumed accurate, any information (or confirmation of the absence thereof) provided by the Authority, the Grid Service Providers and/or from other sources. Except as otherwise stated in the report, SKM has not attempted to verify the accuracy or completeness of any such information. If the information is subsequently determined to be false, inaccurate or incomplete then it is possible that our observations and conclusions as expressed in this report may change.
SKM derived the data in this report from information sourced from the Authority, the Grid Service Providers and/or available in the public domain at the time or times outlined in this report. The passage of time, manifestation of latent conditions or impacts of future events may require further examination of the project and subsequent data analysis, and re-evaluation of the data, findings, observations and conclusions expressed in this report. SKM has prepared this report in accordance with the usual care and thoroughness of the consulting profession, for the sole purpose described above and by reference to applicable standards, guidelines, procedures and practices at the date of issue of this report. For the reasons outlined above, however, no other warranty or guarantee, whether expressed or implied, is made as to the data, observations and findings expressed in this report, to the extent permitted by law.
This report should be read in full and no excerpts are to be taken as representative of the findings. No responsibility is accepted by SKM for use of any part of this report in any other context.
This report has been prepared within the time restraints imposed by the project program. These time restraints have imposed constraints on SKM’s ability to obtain and review information from the Entities.
This report has been prepared on behalf of, and for the exclusive use of, the Authority, and is subject to, and issued in accordance with, the provisions of the agreement between SKM and the Authority. SKM accepts no liability or responsibility whatsoever for, or in respect of, any use of, or reliance upon, this report by any third party.

SINCLAIR KNIGHT MERZ PAGE 2
1. Executive summary The Queensland Competition Authority (the Authority) commissioned Sinclair Knight Merz Pty Ltd (SKM) to undertake a benchmarking review of the 2011/12 fixed and variable operating expenditure of the two Grid Service Providers (GSPs) - Seqwater and LinkWater. In addition, SKM has been commissioned to identify potential duplications of effort relating to fixed operating costs between GSPs, their contractors and the SEQ Water Grid Manager and to identify any potential efficiency improvements and areas for potential operating cost savings as a result of the Seqwater-WaterSecure merger on 1 July 2011.
This review forms part of the Authority’s process to undertake interim price monitoring for these monopoly utilities. SKM’s review of the (two utilities) prudency and efficiency of capital expenditure and operating expenditure (of the two utilities) is documented in separate reports to the benchmarking review reports.
This report pertains to the benchmarking review of 2011/12 fixed and variable operating expenditure of LinkWater and the analysis the potential duplication of effort between LinkWater, its contractors and the SEQ Water Grid Manager.
1.1. Background
On 1 July 2008, the Queensland Government implemented a series of reforms in the SEQ water industry by establishing new bulk water entities, Seqwater, WaterSecure and LinkWater that together owned and operated the SEQ Water Grid. On 1 July 2011 WaterSecure merged with Seqwater to form a single bulk water supply authority called Seqwater. The bulk water transmission system is owned and operated by LinkWater.
1.2. Benchmarking Methodology
Information provided by LinkWater for the 2011/12 price monitoring was reviewed and benchmarking metrics were developed. To gather information on comparator water utilities a number of approaches were adopted including: approaching the regulator within other jurisdictions; approaching water utilities owning and operating similar assets in other jurisdictions via their regulator; approaching water utilities directly; accessing public domain data/information; and drawing on SKM in house data/information. The benchmarking was broken down into three sections – corporate level, asset group level and asset specific level.
A number of issues were encountered during this process including a lack of availability of data and coarseness of data from reference water utilities. In contrast SKM appreciates the support provided by LinkWater and its staff in responding to our requests for information. For the corporate level, information was gathered from a number of national and international water utilities. Asset

SINCLAIR KNIGHT MERZ PAGE 3
specific information from external water utilities was only provided by Ben Lomond Water in Tasmania for two reservoirs and two bulk transmission schemes. Due to the limited information obtained on comparator organisations in the time available to conduct this exercise, at the time of production of this draft report, limited conclusions can be drawn.
SKM notes that the majority of the organisations approached expressed an interest in participating in the benchmarking process and it is SKM’s opinion that if additional time was allowed for the organisations to respond and additional effort is put into progressing responses from the organisations, then a more robust benchmarking exercise will be capable of being undertaken.
1.3. Corporate level benchmarking
The corporate level benchmarking undertaken has been undertaken for LinkWater as a whole. Information available for LinkWater included total expenditure, total operating costs, total variable costs and number of FTEs employed. Information collected from other national and international water utilities to allow comparable metrics to be developed included:
Total operating expenditure ($)
Water supplied (ML)
Employee costs ($)
Total revenue ($)
Number of full-time equivalents
Non-current asset value ($)
Length of mains (km)
Making use of the above information the following metrics were developed for each of the national and international water utilities and the values compared to that of LinkWater:
Total operating expenditure as a proportion of total water supplied
Total operating expenditure as a proportion of non-current assets
Total employee cost as a proportion of total operating expenditure
Total operating expenditure as a proportion of total revenue
Total revenue as a proportion of total full-time equivalents
Total full-time equivalents as a proportion of non-current assets
Total water supplied as a proportion of the total full-time equivalents
Total employee cost as a proportion of the total full-time equivalents
Total operating expenditure as a proportion of mains length

SINCLAIR KNIGHT MERZ PAGE 4
The majority of the comparator utilities have a larger suite of water and wastewater services than LinkWater offers. Where possible, this has been taken into consideration when comparing the various metrics developed in the narrative of this report.
The conclusion from this study is that LinkWater is efficient in organisational issues and spending, has an effective workforce and utilises its asset efficiently. In short, the benchmarks indicate that LinkWater’s business operations, as a whole, are in keeping with what would be expected of an efficient operator undertaking bulk water transport.
SKM notes that the majority of the organisations approached expressed an interest in participating in the benchmarking process and it is SKM’s opinion that if additional time was allowed for the organisations to respond and additional effort is put into progressing responses from the organisations, a more robust benchmarking exercise will be capable of being undertaken.
1.4. Benchmarking by asset grouping
The asset group benchmarking covers water quality facilities, reservoirs, water pump stations and bulk transmission schemes. Metrics were developed for all of LinkWater’s asset groups however a benchmarking comparison was only undertaken for reservoirs. No reference utility information was available on water quality facilities or pump stations as an asset group at the time of writing this draft report. The information available on bulk transmission schemes was limited and was not directly comparable with that provided by LinkWater. The operating costs per ML for the Ben Lomond Water reservoirs ($2,797/ML) and the LinkWater reservoirs ($2,877/ML) are not materially dissimilar. However SKM considers that the high operating cost per km of linear asset (trunk main) exhibited by LinkWater compared to the majority of the comparator utilities indicates that LinkWater is not an efficient operator in this respect.
1.5. Asset specific benchmarking
The asset specific benchmarking covers agreed and selected water quality facilities, reservoirs, water pump stations and bulk transmission schemes. Metrics were developed for all selected LinkWater assets however a benchmarking comparison was only undertaken for reservoirs. No reference utility information was available on water quality facilities or pump station assets at the time of writing this draft report and the reference utility information available on bulk transmission schemes directly comparable with that provided by LinkWater was limited.
The operating costs per ML for Stapylton Reservoir (LinkWater) were compared to operating costs per ML for Rocherlea complex reservoirs and Distillery Creek complex reservoirs (Ben Lomond Water). The comparison indicates that the operating costs per ML storage capacity for Stapylton Reservoir ($11,523/ML) is significantly higher than those of Rocherlea Complex reservoirs ($2,672/ML) and Distillery Creek Complex reservoirs ($2,954/ML). It is suggested that further
SINCLAIR KNIGHT MERZ PAGE 5
investigation be undertaken to determine why the operating costs per ML are so much higher for Stapylton Reservoir than Rocherlea complex reservoirs and Distillery Creek complex reservoirs. No definitive conclusions can be drawn from the comparison due to limited being information available on the breakdown of costs within the operating expenditure of Rocherlea Complex reservoirs and Distillery Creek Complex reservoirs nor on the type of construction of the dams to determine if these costs are, in fact, comparable.
1.6. Duplication of effort – LinkWater, contractors and SEQ Water Grid Manager
A review of the roles and responsibilities of LinkWater, its alliance contractors and the SEQ Water Grid Manager was conducted to identify potential areas of duplication of effort. Organisational charts and descriptions of objectives and responsibilities for each of the positions were provided for review. This data was analysed for common objectives roles and responsibilities.
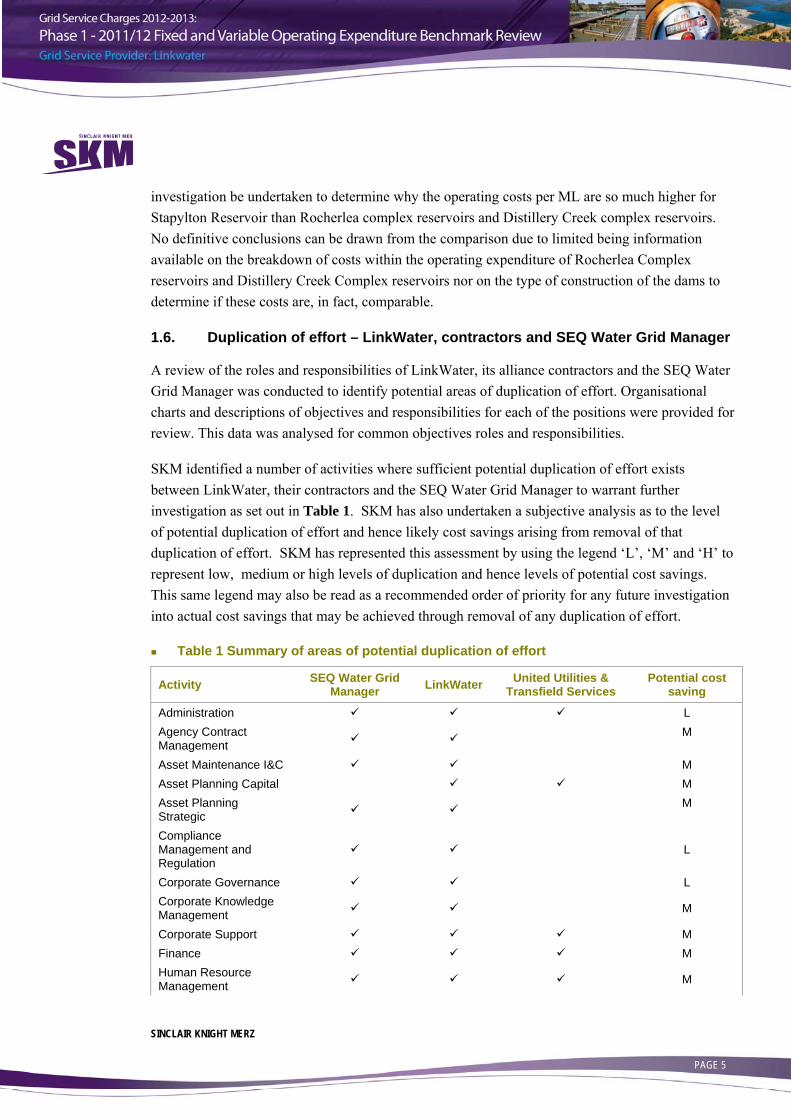
SKM identified a number of activities where sufficient potential duplication of effort exists between LinkWater, their contractors and the SEQ Water Grid Manager to warrant further investigation as set out in Table 1. SKM has also undertaken a subjective analysis as to the level of potential duplication of effort and hence likely cost savings arising from removal of that duplication of effort. SKM has represented this assessment by using the legend ‘L’, ‘M’ and ‘H’ to represent low, medium or high levels of duplication and hence levels of potential cost savings. This same legend may also be read as a recommended order of priority for any future investigation into actual cost savings that may be achieved through removal of any duplication of effort.
Table 1 Summary of areas of potential duplication of effort
Activity SEQ Water Grid Manager LinkWater United Utilities &
Transfield Services Potential cost
saving
Administration L Agency Contract Management M
Asset Maintenance I&C M Asset Planning Capital M Asset Planning Strategic M
Compliance Management and Regulation
L
Corporate Governance L Corporate Knowledge Management M
Corporate Support M Finance M Human Resource Management M

SINCLAIR KNIGHT MERZ PAGE 6
Activity SEQ Water Grid Manager LinkWater United Utilities &
Transfield Services Potential cost
saving
Information and Communication Technology (ICT)
M
Legal Services L Project Delivery M Relationship management M
Risk Management L
Water Quality Management M
Work Place Health and Safety L
1.7. Summary and conclusions
SKM has conducted benchmarking of LinkWater’s 2011/12 fixed and variable operating expenditure against comparator water utilities in so far as is possible with the information available at the time of writing this draft report. The information provided by LinkWater was sufficient to develop the proposed metrics however, for comparator organisations, the limited information available restricted the metrics that could be developed for the benchmarking exercise. To support further analysis it is recommended that an extended benchmarking study is conducted over a longer duration than the current study to allow the capture of relevant information from other water utilities to enable the development of relevant comparator metrics. Nevertheless, SKM considers that LinkWater’s costs, as a whole are in keeping with those that would be expected of an efficient operator. However, SKM considers that the high operating cost per km of linear asset (trunk main) exhibited by LinkWater compared to the majority of the comparator utilities indicates that LinkWater is not an efficient operator in this respect.
SKM has reviewed the roles and responsibilities for LinkWater, their major contractors and the SEQ Water Grid Manager to identify potential areas of duplication of effort. A number of areas have been identified where there is considered to be duplication of effort including asset planning strategic and water quality management of sufficient magnitude to warrant further and more detailed investigation. Areas assessed as having greatest potential for efficiency gains through removal of duplication of effort are: Asset Planning Capital, Asset Planning Strategic; and Relationship Management.

SINCLAIR KNIGHT MERZ PAGE 7
2. Introduction The Queensland Competition Authority (the Authority) is required to recommend the Grid Service Charges (GSCs) to be applied in 2012/13. GSCs represent the amount payable by the South East Queensland Water Grid Manager (SEQ Water Grid Manager) to the two separate Grid Service Providers (GSPs): Seqwater and LinkWater; for declared water services.
To assist it in this process, the Authority has appointed SKM to:
Conduct a review of available information on operating cost categories for functional and corporate cost centres and for specific asset operation and maintenance, benchmark costs using benchmark metrics such as $/ML storage against similar entities with similar assets
Investigate for any duplication of effort and investigate for any potential efficiency gains from the Seqwater-WaterSecure merger
Conduct a review of available information, undertake a gap analyses, conduct interviews with the GSPs, prepare information requests, undertake a review of policies and procedures and standards of service, undertake assessments of prudency and efficiency of capital and operating expenditure and conduct a review of allocation of overhead costs
The consultancy consists of two phases:
Phase 1:
Fixed and variable OPEX review – SKM has been requested to review available information on operating cost categories for functional and corporate cost centres and for specific asset operation and maintenance costs. SKM has also been requested to benchmark costs using benchmark metrics such as $/ML storage against similar entities with similar assets as well as to, investigate for any duplication of effort and identify areas for potential efficiency gains
Phase 2:
Component 1: Operational Expenditure – SKM has been requested to undertake a review of policies and procedures and standards of service, undertake assessments of prudency and efficiency of operating expenditure and conduct a review of allocation of overhead costs
Component 2: 2011-12 Estimated Actual Capital Expenditure – SKM has been requested to undertake a review of supporting documentation and undertake assessments of prudency and efficiency of selected capital expenditure projects
Component 3: 2012-13 Forecast Operational Expenditure – SKM has been requested to undertake a review of policies and procedures, undertake assessments of prudency and

SINCLAIR KNIGHT MERZ PAGE 8
efficiency of selected capital expenditure projects and conduct a review of allocation of overhead costs
2.1. Terms of reference
The full terms of reference are included in Appendix A.
2.1.1. Scope exclusions
The following items are outside of the scope of SKM’s review:
Costs associated with capital repayment/depreciation have been excluded from this review
Quantification of potential duplication of effort between the SEQ Water Grid Manager, the entities and their alliance contractors and estimate of any potential savings arising from removal of those areas of duplication of effort
2.2. Report overview
This report addresses the benchmarking review and duplication of effort (between LinkWater, the SEQ Water Grid Manager and LinkWater’s alliance contractor’s) review for LinkWater (phase 1). The benchmarking review, duplication of effort review and potential merger efficiency gains for Seqwater is contained in a separate report1.
This report is structured as follows:
Background
Benchmarking methodology
Corporate level benchmarking
Benchmarking by asset grouping
Asset specific benchmarking
Duplication of effort – LinkWater, contractors and SEQ Water Grid Manager
Summary and conclusions
1 Grid Service Charges 2012-2013: Phase 1 – 2011/12 Fixed and Variable Operating Expenditure Review – Seqwater, Draft v1, SKM, April 2012
SINCLAIR KNIGHT MERZ PAGE 9
3. Background 3.1. Water Reform and Grid Entities
On 1 July 2008, the Queensland Government implemented a series of reforms in the South East Queensland (SEQ) water industry by establishing new bulk water entities that own and operate the SEQ Water Grid. Seqwater owns all dams, groundwater infrastructure and water treatment plants in the SEQ Water Grid in SEQ while WaterSecure owned the desalination plant at the Gold Coast and the Western Corridor Recycled Water Scheme.
On 1 July 2011 Seqwater and WaterSecure merged with Seqwater to form a single bulk water supply authority. The bulk water transmission system is owned by LinkWater.
In addition to the bulk water entities, 10 regional council water utilities were amalgamated into three larger retail distribution entities. These entities now own the water and sewerage distribution infrastructure and sell water and wastewater disposal services to customers in their respective areas.
Finally, the reforms also established the roles of the Authority in respect of regulating prices and the SEQ Water Grid Manager.
3.2. The role of the Authority
The Authority is an independent Statutory Authority established by the Queensland Competition Authority Act 1997 and is given the task of regulating prices, access and other matters relating to regulated industries in Queensland.
Under the South East Queensland Water Market Rules (the Market Rules), the Authority is required to recommend the Grid Service Charges (GSCs) for the period from 1 July 2012 until 30 June 2013. The Authority is required to provide a report to the Price Regulator setting out its recommendations on GSCs and such information as is reasonably required, to support its recommendations, by no later than 30 June 2012.
GSCs are paid by the SEQ Water Grid Manager to the two GSPs, for the provision of declared water services. Declared water services relate to the storage, production, treatment and transport of water to retailer-distributors and other Grid Customers, such as power stations and irrigators in South East Queensland. A single GSC is applied for each GSP.
3.3. Role of the SEQ Water Grid Manager
The SEQ Water Grid Manager is responsible for directing the physical operation of the SEQ Water Grid and, by acting as the single buyer of bulk water services and as the single seller of bulk water for urban purposes, provides a mechanism to share the costs of the SEQ Water Grid. It sells a

SINCLAIR KNIGHT MERZ PAGE 10
wholesale “pool” product, which reflects the portfolio cost of supplying retailers with a defined security and quality of supply at a defined bulk supply node.
The SEQ Water Grid Manager sells potable water to the three council-owned retail-distributors at a price determined under the SEQ Bulk Water Price Path. A 10-year price path has been projected for bulk water prices, based on assumed interest rates and consumption patterns by the Queensland Government. The Bulk Water Price Path is intended to reach full cost recovery by 2017/18. The bulk water prices are different from the grid service charges payable by the SEQ Water Grid Manager.
3.4. Background to LinkWater
LinkWater owns, operates and maintains of potable bulk water pipelines and related infrastructure throughout SEQ.
LinkWater was established to:
improve the regional water supply network in SEQ
improve regional coordination and management of water supply
provide more efficient delivery of water services
enhance customer service for water consumers
give a clear accountability framework for water supply security
Assets that form LinkWater’s network include bulk transmission mains, pump stations, reservoirs and water quality facilities. LinkWater owns, operates and maintains approximately 530 km of water mains, 22 pump stations, 28 reservoirs and seven water quality facilities.
SINCLAIR KNIGHT MERZ PAGE 11
4. Benchmarking Methodology This section of the report describes the process that SKM undertook to identify and benchmark the corporate wide costs (based on the 2011/12 price determination approved costs) of LinkWater against key cost parameters at relevant comparator water utilities and good industry practice.
To identify expenditure areas and assets to benchmark, initially, the previous benchmarking study2 was reviewed. Areas to benchmark were identified as a disaggregation of high level benchmarks previously reviewed, together with new corporate cost areas, asset grouping (ie all water pump stations) and individual asset (ie Bundamba Pump Station).
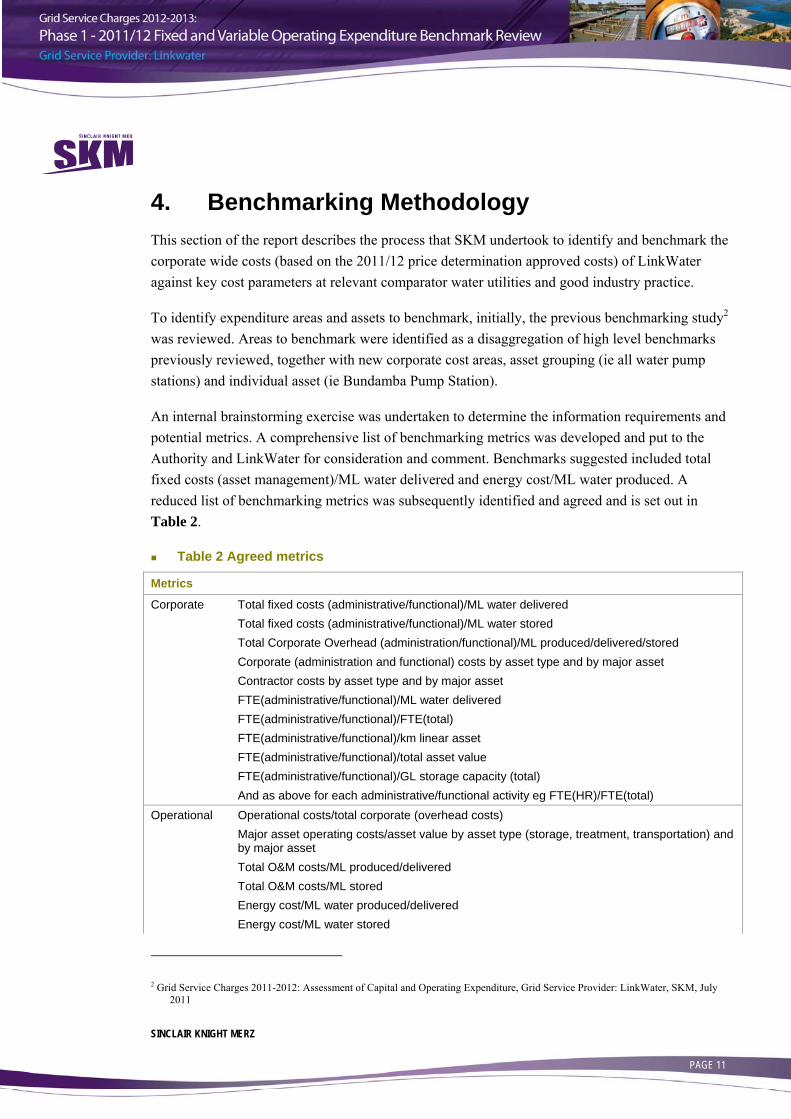
An internal brainstorming exercise was undertaken to determine the information requirements and potential metrics. A comprehensive list of benchmarking metrics was developed and put to the Authority and LinkWater for consideration and comment. Benchmarks suggested included total fixed costs (asset management)/ML water delivered and energy cost/ML water produced. A reduced list of benchmarking metrics was subsequently identified and agreed and is set out in Table 2.
Table 2 Agreed metrics
Metrics
Corporate Total fixed costs (administrative/functional)/ML water delivered Total fixed costs (administrative/functional)/ML water stored Total Corporate Overhead (administration/functional)/ML produced/delivered/stored Corporate (administration and functional) costs by asset type and by major asset Contractor costs by asset type and by major asset FTE(administrative/functional)/ML water delivered FTE(administrative/functional)/FTE(total) FTE(administrative/functional)/km linear asset FTE(administrative/functional)/total asset value FTE(administrative/functional)/GL storage capacity (total) And as above for each administrative/functional activity eg FTE(HR)/FTE(total) Operational Operational costs/total corporate (overhead costs) Major asset operating costs/asset value by asset type (storage, treatment, transportation) and
by major asset Total O&M costs/ML produced/delivered Total O&M costs/ML stored Energy cost/ML water produced/delivered Energy cost/ML water stored
2 Grid Service Charges 2011-2012: Assessment of Capital and Operating Expenditure, Grid Service Provider: LinkWater, SKM, July 2011

SINCLAIR KNIGHT MERZ PAGE 12
Metrics
Chemical cost/ML water produced/delivered Chemical cost/ML water stored Sludge handling/disposal/ML water produced/delivered Sludge handling/disposal/ML water stored Total maintenance costs/total asset value Major asset maintenance costs/asset value by asset type and by major asset Planned maintenance costs/unplanned maintenance costs by major asset The benchmarking has been conducted at three levels: corporate level, asset group level and specific asset level. The corporate level benchmarking looks at LinkWater as a whole, the asset group level benchmarking looks at the asset groups as a whole ie water quality facilities, water pump stations, reservoirs and trunk mains, and the asset specific benchmarking looks at a number of selected individual assets from each of the asset groups. The assets selected were submitted to the Authority and LinkWater for comment and approval.
A review of all provided information and information submitted to the Authority by LinkWater for the 2011/12 period for fixed and variable operating expenditure was completed and information gaps identified. To address the information gaps, information requests were sent to LinkWater. The information received from LinkWater was reviewed and metrics developed. The identified information requirements are outlined below in Table 3.
Table 3 Information requirements
Assets Information Requested Information Received
Whole of business Organisational structure Description of roles and responsibilities of all
business units
FTEs and expenditure per business unit Total value of all assets Fleet costs allocated to business unit Costs not allocated Water Pump Stations
Cameron’s Hill ML/year pumped North Pine ML/year pumping capacity Bundamba Asset Value (replacement)
Trinder Park Asset age Mudgeeraba FTE staff allocated to asset FTEs not allocated
All others FTE contractors allocated to asset Hours only allocated Planned and unplanned maintenance costs
Variable costs – electricity Allocation of corporate costs to asset Costs not allocated

SINCLAIR KNIGHT MERZ PAGE 13
Assets Information Requested Information Received
Reservoirs Green Hill ML stored
Aspley Asset Value (replacement) Narangba Asset age Stapylton FTE staff allocated to asset FTEs not allocated All others FTE contractors allocated to asset Hours only allocated
Planned and unplanned maintenance costs Variable costs – electricity Allocation of corporate costs to asset Costs not allocated Trunk Mains
NIP ML/year transported Anstead to Runcorn ML/year transported capacity
Mt Crosby to Wellers Hill Asset Value (replacement) North Pine WTP to Aspley Asset age
Ipswich Central Main FTE staff allocated to asset FTEs not allocated Tarrant Drive to Elanora FTE contractors allocated to asset Hours only allocated Logan Central Supplies Planned and unplanned maintenance costs
Narangba to North Pine WTP Variable costs – electricity Heinemann Rd to Alex Hills Allocation of corporate costs to asset Costs not allocated
All others Water Quality Facilities
Chambers Flat ML/year treated Alexander Hills ML/year treated capacity
Asset Value (replacement) Asset age FTE staff allocated to asset FTEs not allocated FTE contractors allocated to asset Hours only allocated Planned and unplanned maintenance costs Variable costs – electricity, chemical Allocation of corporate costs to asset Costs not allocated Major Contractors Contract (if appropriate) Organisational structure/description of
department roles and responsibilities for contractors (eg, alliance contractors)
Activities related to fixing operating costs activities of each contractor, ie asset management, planning, capital project business case development, engineering design, project management, operation and maintenance activities
Total FTE's FTE's per activity
SINCLAIR KNIGHT MERZ PAGE 14
LinkWater does not currently have a comprehensive cost allocation method by which to allocate FTEs to assets or corporate costs to assets and as such was unable to provide this information. LinkWater indicated that:
“This is largely a result of the requirement of the Water Market Rules to report cost information according to Fixed; Variable and Capital. Within this format the Fixed Costs represent LinkWater’s corporate, operational and maintenance costs. Historically these costs have been reported discretely with no subsequent allocation to asset or activity. LinkWater has continued this approach in 2011-12 and 2012-13.”
LinkWater discussed the issue of cost allocation in its 2011/12 Grid Service Charges Submission3. LinkWater suggested that consultation would need to occur with the Authority to develop a cost allocation methodology. Where no information has been provided on the FTEs allocated to an asset no FTEs have been included. For the planned and unplanned maintenance of assets, which has been provided as a number of hours, the number of FTEs has been calculated on the basis of 38 hour weeks for 48 working weeks each year.
For future investigations, to facilitate the capture of benchmarking information in relation to the allocation of overheads and FTEs to assets, there would be merit in the Authority agreeing with LinkWater and Seqwater the data to be captured and mechanism for apportionment of costs.4
4.1. Comparator water utility metrics
To develop metrics for comparator water utilities a number of approaches were adopted. These included approaching the regulator within other jurisdictions such as the South Australia Essential Services Commission and the Independent Pricing and Regulator Tribunal of New South Wales, approaching water utilities owning and operating similar assets in other jurisdictions via their regulator, approaching the water utilities directly, accessing public domain data/information and drawing on in house data/information.
4.1.1. Water utilities approached
Regulators in other Australian states were approached regarding their willingness and ability to provide information on assets similar to those selected to be reviewed for LinkWater. The response was generally positive however not all of the regulators had relevant information that could be provided. Following discussion and receipt of advice from the Authority only asset specific information was requested from regulators and water utilities outside SEQ. Water utilities to be approached were determined on the basis of the type of assets they own, operate and maintain. In
3 LinkWater Regulatory Submission to the Queensland Competition Authority, 31 March 2011 4 SKM considers that the structure and format of this FTE and component cost breakdown allocation would need to be discussed and
agreed between the Authority and GSPs before LinkWater could develop systems to achieve this.

SINCLAIR KNIGHT MERZ PAGE 15
this respect whether the water utility provided bulk services or water and wastewater direct to customers was not relevant. Requests for information were sent to:
the Independent Pricing and Regulatory Tribunal of New South Wales (IPART)
the Essential Services Commission Victoria (ESA VIC)
the Office of the Tasmanian Economic Regulator (OTTER)
South Australia Water
Economic Regulatory Authority Western Australia (ERA WA)
Melbourne Water
Water utilities approached directly (for example where its relevant regulator was unable to assist) included the Sydney Catchment Authority, the Northern Territory Power and Water Corporation and the Western Australian Water Corporation. Requests for information have also been sent to Queensland’s Wide Bay Water and the Gladstone Area Water Board (GAWB).
Additionally a review of information available in the public domain from regulators and water utilities, both nationally and internationally, was conducted. However it should be noted that there is limited publicly available information that is relevant and that can be used to support this exercise. Information in the public domain, particularly information provided in regulator’s reports, relates more to standards of service than operating expenditure and asset specific information.
4.1.2. Response to information requests
At the time of writing of the draft report, information was received from the Office of the Tasmanian Energy Regulator for Ben Lomond Water only. Ben Lomond Water provides water and wastewater services to the northern region of Tasmania. It owns, operates and maintains all assets within the water and wastewater network including dams, water treatment plants, reservoirs, trunk mains and wastewater treatment plants.
Assets that information was provided on were the Rocherlea Complex Reservoirs, Distillery Creek Complex Reservoirs, the West Tamar pipeline scheme and the North Esk pipeline scheme. An overview of the information provided is outlined below in Table 4.
Table 4 Ben Lomond Water information
Asset Capacity FTEs Total OPEX ($m)
Overhead costs ($m)
Asset value ($)
Rocherlea Complex Reservoirs 23 ML 0.5 60,170 39,375 3,374,533 Distillery Creek Complex Reservoirs 18 ML 0.5 53,170 23,985 1,231,218 West Tamar pipeline scheme 46 km 1.5 - 141,185 7,225,000 North Esk pipeline scheme 108 km 1.5 - 491,266 25,140,000 NOTE: Capacity values are rounded to nearest whole value.

SINCLAIR KNIGHT MERZ PAGE 16
The information received on Ben Lomond Water assets was at a relatively high level and therefore the metrics able to be developed were limited.
No other information has been provided from other regulators and water utilities as at the date of issue of this draft report.
4.1.3. Other information sources
Information and comparative data has been obtained from a number of other sources. The majority of this data is publicly available information from local, interstate and some international sources.
The comparative data and information was compiled from numerous sources, including:
Sydney Water - Annual Report 2011 (Sydney Water, 2011) <http://www.sydneywater.com.au/Publications/Reports/AnnualReport/2011/downloads/_download.cfm?DownloadFile=../pdf_files/full_annual_report.pdf>
South Australian Water Corporation Annual Report: For the year ending 30 June 2011 (SA Water , 2011) <http://www.sawater.com.au/NR/rdonlyres/47D668BC-2489-4514-ADB4-FA1A6E9B9E89/0/SAWaterAnnualReport1011.pdf>
Metropolitan Melbourne Water Price Review 2009: Melbourne Water Determination – Services Other Than Metropolitan Drainage and Diversion Services, 1 July 2009 – 30 June 2013 (Essential Services Commission, June 2009) < http://www.esc.vic.gov.au/NR/rdonlyres/3ACADDA8-E633-4728-97DC-339E3988514B/0/DTRMWDeterminationMetropolitanMelbournewaterpricereview2009_20090625.pdf>
Tasmanian Water and Sewerage State of the Industry Report 2009-10 (Office of the Tasmanian Economic Regulator, March 2011) <http://www.economicregulator.tas.gov.au/domino/otter.nsf/LookupFiles/11949_Tasmanian_Water_and_Sewerage_State_of_the_Industry_Report_2009-10_110415.pdf/$file/11949_Tasmanian_Water_and_Sewerage_State_of_the_Industry_Report_2009-10_110415.pdf>
Water Corporation Annual Report 2011 (Water Corporation, 2011) <http://www.watercorporation.com.au/_files/PublicationsRegister/6/2011_Annual_Report.pdf>
June Return 2011 (Dee Valley Water, 2011) <http://www.deevalleywater.co.uk/article.php?id=154 >
Annual Report and Financial Statements 2011, (South West Water, 2011) <http://www.southwestwater.co.uk/media/pdf/j/q/110634_SWW_AR_2011_10.pdf>

SINCLAIR KNIGHT MERZ PAGE 17
Thames Water Utilities Finance Limited: Annual Report & Financial Statements for the Period ended 31 March 2011, (Thames Water Utilities Limited, June 2011) <http://www.thameswater.co.uk/cps/rde/xbcr/corp/2011-twul-financials-full-year-statements-31-mar.pdf>
Dŵr Cymru Cyfyngedig Annual report and financial statements for the year ended 31 March 2011, (Dŵr Cymru Cyfyngedig, June 2011) <http://www.dwrcymru.com/eng/library/company_reports/2011/dcc_statutory_accounts_2011.pdf>
2011 Annual Review (Wessex Water, 2011) <http://www.wessexwater.co.uk/WorkArea//DownloadAsset.aspx?id=7449>
Annual Report & Accounts 2011 (Bristol Water, May 2011) <http://www.bristolwater.co.uk/pdf/aboutUs/companyReports/bwAnnualReport11.pdf>
Comprehensive Budget Report Fiscal Year 2011: Portland, Maine (Portland Water District, 2011) <http://www.pwd.org/pdf/2011%20Final%20Budget.pdf>
4.1.4. Incomplete data and information
Prior to the development of the metrics a review of the data was undertaken. From this review, the following issues were identified:
Incomplete Data – not all information requested from LinkWater has been received. This is due to limitations on the data able to be supplied, ie the information has not been collected before and hence LinkWater has no mechanism to collect and collate this data in the time available. This limits the extent of the metrics able to be developed
Inconsistent Data – the additional information provided by the LinkWater is not consistent with information provided for the 2011/12 review. As SKM’s review is based on the information received during the 2011/12 review this constrains the effectiveness of comparisons
Coarseness of Data – the Authority instructed SKM to request information at the asset level, ie site-by-site information, rather than at LinkWater’s corporate or asset group level, from water utilities beyond LinkWater and LinkWater. This has limited the effectiveness of any comparison SKM was able to undertake on asset grouping basis and on a whole of organisation basis
SINCLAIR KNIGHT MERZ PAGE 18
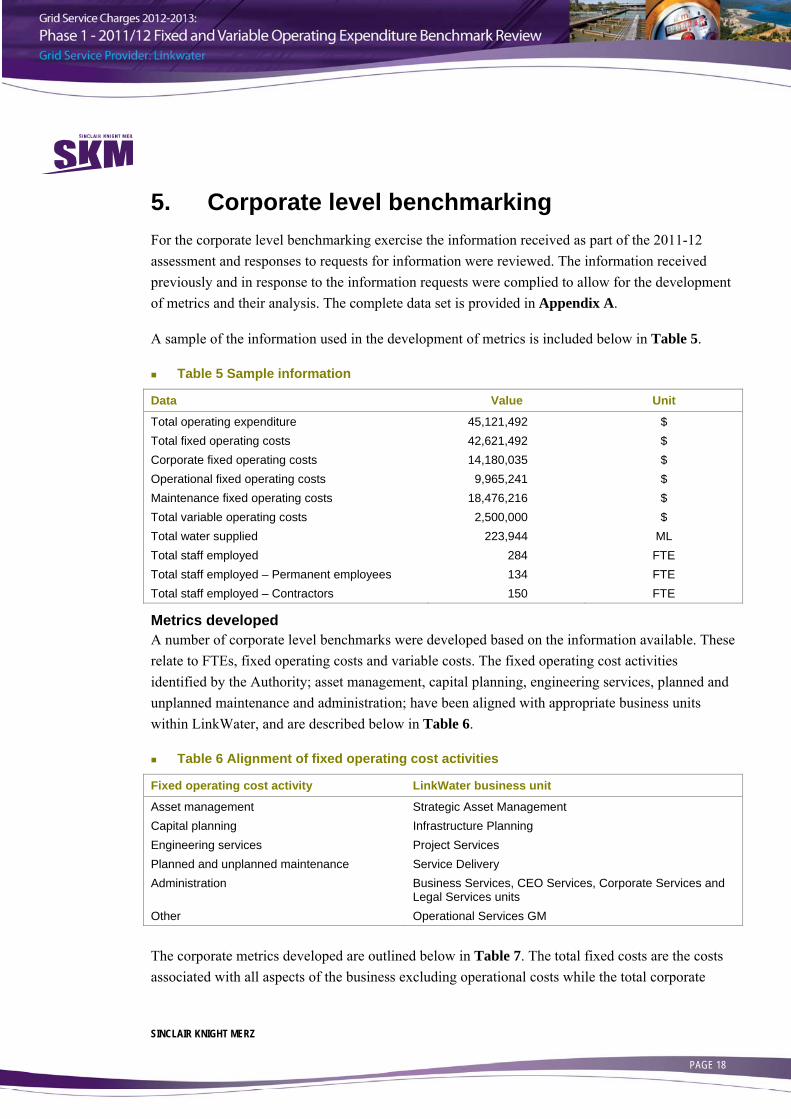
5. Corporate level benchmarking For the corporate level benchmarking exercise the information received as part of the 2011-12 assessment and responses to requests for information were reviewed. The information received previously and in response to the information requests were complied to allow for the development of metrics and their analysis. The complete data set is provided in Appendix A.
A sample of the information used in the development of metrics is included below in Table 5.
Table 5 Sample information
Data Value Unit
Total operating expenditure 45,121,492 $ Total fixed operating costs 42,621,492 $ Corporate fixed operating costs 14,180,035 $ Operational fixed operating costs 9,965,241 $ Maintenance fixed operating costs 18,476,216 $ Total variable operating costs 2,500,000 $ Total water supplied 223,944 ML Total staff employed 284 FTE Total staff employed – Permanent employees 134 FTE Total staff employed – Contractors 150 FTE
Metrics developed A number of corporate level benchmarks were developed based on the information available. These relate to FTEs, fixed operating costs and variable costs. The fixed operating cost activities identified by the Authority; asset management, capital planning, engineering services, planned and unplanned maintenance and administration; have been aligned with appropriate business units within LinkWater, and are described below in Table 6.
Table 6 Alignment of fixed operating cost activities
Fixed operating cost activity LinkWater business unit
Asset management Strategic Asset Management Capital planning Infrastructure Planning Engineering services Project Services Planned and unplanned maintenance Service Delivery Administration Business Services, CEO Services, Corporate Services and
Legal Services units Other Operational Services GM The corporate metrics developed are outlined below in Table 7. The total fixed costs are the costs associated with all aspects of the business excluding operational costs while the total corporate

SINCLAIR KNIGHT MERZ PAGE 19
costs are the costs associated with administration, IT and leasing premises together with operational and operational staff costs.
Table 7 Corporate metrics for LinkWater
Metric Component 1 Component 2 Value Unit
Total operating expenditure/ML water supplied $45,121,492 223,944 ML 201.49 $/ML Total fixed costs/ML water supplied $42,621,492 223,944 ML 190.32 $/ML Corporate costs/ML water supplied $14,180,035 223,944 ML 63.32 $/ML Operational costs/ML water supplied $9,965,241 223,944 ML 55.66 $/ML Maintenance costs/ML water supplied $18,476,216 223,944 ML 82.50 $/ML Total variable costs/ML water supplied $2,500,000 223,944 ML 11.16 $/ML FTE (total)/ML water supplied 134.0 223,944 ML 0.0006 FTE/ML FTE (Asset Management)/ML water supplied 5.0 223,944 ML 0.000022 FTE/ML FTE (Asset Management)/FTE (total) 5.0 134.0 0.037 Ratio FTE (Capital Planning)/ML water supplied 13.0 223,944 ML 0.000058 FTE/ML FTE (Capital Planning)/FTE (total) 13.0 134.0 0.097 Ratio FTE (Engineering Services)/ML water supplied 31.0 223,944 ML 0.00014 FTE/ML FTE (Engineering Services)/FTE (total) 31.0 134.0 0.23 Ratio FTE (Maintenance)/ML water supplied 22.0 223,944 ML 0.00010 FTE/ML FTE (Maintenance)/FTE (total) 22.0 134.0 0.16 Ratio FTE (Administration)/ML water supplied 61.0 223,944 ML 0.00027 FTE/ML FTE (Administration)/FTE (total) 61.0 134.0 0.46 Ratio FTE (Other)/ML water supplied 2.0 223,944 ML 0.0000089 FTE/ML FTE (Other)/FTE (total) 2.0 134.0 0.015 Ratio Note: FTE breakdown is for permanent employees
Figure 1 indicates that the total costs associated with planned and unplanned maintenance account for approximately 52% of all costs with administration the next highest at over 32%.

SINCLAIR KNIGHT MERZ PAGE 20
Figure 1 Total costs by activity for LinkWater
Figure 2 presents the breakdown of total costs (corporate, operational, maintenance and variable) as a percentage per ML water supplied. The figure indicates that the operational costs are the largest costs associated with the organisation comprising some 30% of overall costs of LinkWater.
Asset Management2%
Capital Planning6%
Engineering Services
4%
Planned and unplanned maintenance
52%
Administration32%
Other4%

SINCLAIR KNIGHT MERZ PAGE 21
Figure 2 Percentage breakdown of costs per ML water supplied
5.1.1. Comparator water utility metrics
The publicly available information is limited to relatively high level information published in regulatory reviews and utility annual reports. Due to limited information there are “gaps” in the benchmarking information. It should also be noted that the comparison entities have different business models (range of services provided and hence assets owned and operated) to that of LinkWater. It is therefore anticipated that although a comparison can be made that it will require the reader to take into consideration the business model of the comparator entity and how this relates to the business model of LinkWater in order to appreciate the relevance of the comparison. SKM has based its interpretation of the data on the differences within the business model of LinkWater and those of the comparator entities.
5.1.2. Benchmark comparison and discussion – Australian Entities
Information for a number of water utilities within other Australian states and territories were gathered, these included Melbourne Water, Ben Lomond Water, Sydney Water, the South Australian Water Corporation and WA Water Corporation. Information collected included:
Total operating expenditure ($)
Water supplied (ML)
Employee costs ($)
Total revenue ($)
Number of full-time equivalents
30%
26%
39%
5%
Corporate costs
Operational costs
Maintenance costs
Variable costs
$11/ML
$83/ML
$63/ML
$56/ML
SINCLAIR KNIGHT MERZ PAGE 22
Non-current asset value ($)
Length of mains (km)
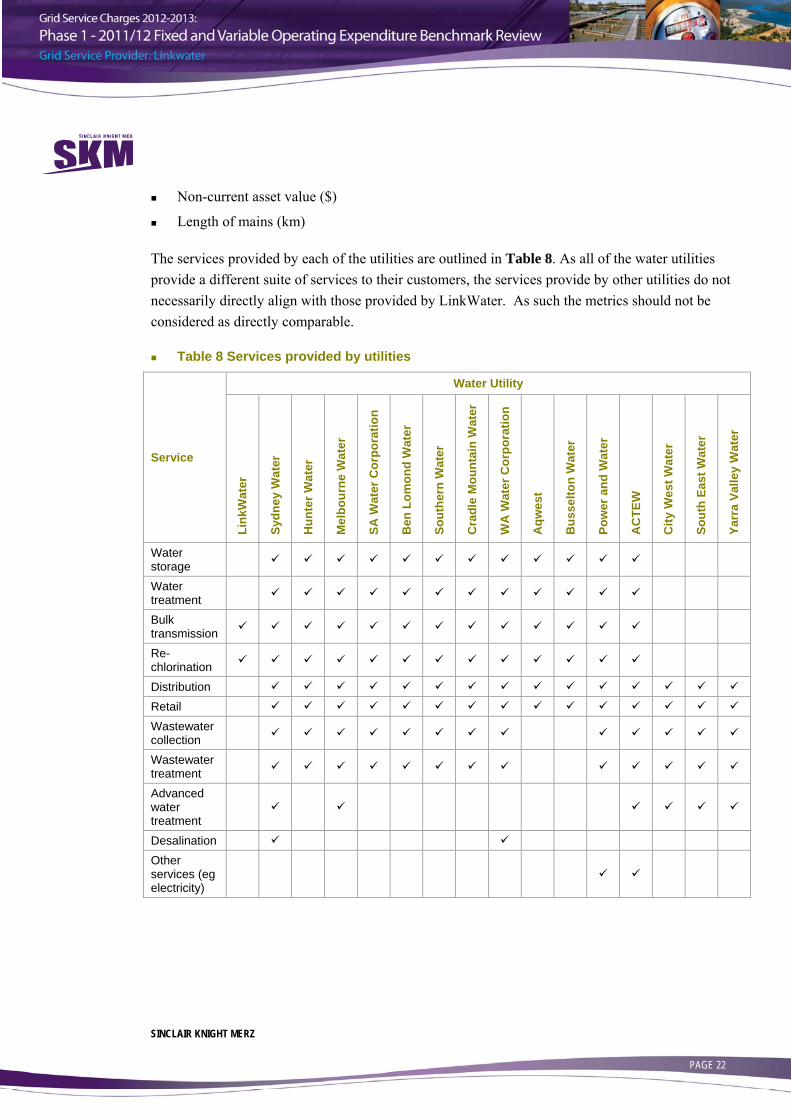
The services provided by each of the utilities are outlined in Table 8. As all of the water utilities provide a different suite of services to their customers, the services provide by other utilities do not necessarily directly align with those provided by LinkWater. As such the metrics should not be considered as directly comparable.
Table 8 Services provided by utilities
Service
Water Utility
Link
Wat
er
Sydn
ey W
ater
Hun
ter W
ater
Mel
bour
ne W
ater
SA W
ater
Cor
pora
tion
Ben
Lom
ond
Wat
er
Sout
hern
Wat
er
Cra
dle
Mou
ntai
n W
ater
WA
Wat
er C
orpo
ratio
n
Aqw
est
Bus
selto
n W
ater
Pow
er a
nd W
ater
AC
TEW
City
Wes
t Wat
er
Sout
h Ea
st W
ater
Yarr
a Va
lley
Wat
er
Water storage
Water treatment
Bulk transmission
Re-chlorination
Distribution
Retail
Wastewater collection
Wastewater treatment
Advanced water treatment
Desalination
Other services (eg electricity)

SINCLAIR KNIGHT MERZ PAGE 23
5.1.2.1. Total operating expenditure as a proportion of water supplied
SKM has developed a metric that details the proportion of the total operating expenditure to the water supplied. Table 9 below presents the information used to develop the metric.
Table 9 Total operating expenditure as a proportion of water supplied data
Water utility State Total operating expenditure ($) Water supplied (ML)
LinkWater QLD 45,121,492 223,944 City West Water Vic 134,113,000 89,875 South East Water Vic 372,000,000 123,251 Yarra Valley Water Vic 376,400,000 123,476 Melbourne Water Vic 201,400,000 351,761 SA Water Corporation SA 456,393,000 196,666 Ben Lomond Water Tas 33,297,000 19,158 Southern Water Tas 76,436,000 41,517 Cradle Mountain Water Tas 30,549,000 16,265 Water Corporation WA 707,128,000 358,995 Aqwest WA 6,452,011 5,690 Busselton Water WA 3,988,073 4,222 ACTEW ACT 106,509,000 40,914 Sydney Catchment Authority NSW 107,992,000 416,944 Sydney Water NSW 1,119,653,000 515,903 Hunter Water NSW 101,910,000 73,449 The values of these metrics are visually represented in Figure 3. This metric provides a high-level indication to the efficiency of the various entities in respect of total costs incurred in the supply of water. In interpreting the result for LinkWater and comparing it with the metrics of the other Australian entities, a lower proportion of operating expenditure to water supplied indicates, broadly, that the entity is more efficient.

SINCLAIR KNIGHT MERZ PAGE 24
Figure 3 Total operating expenditure as a proportion of water supplied - National
Figure 3 indicates that the overall operating expenditure per ML for LinkWater is substantially lower than the majority of the comparator utilities, with the exception of Melbourne Water and the Sydney Catchment Authority. It is not unexpected that the costs per ML supplied for LinkWater are be substantially lower than those of the majority of the comparator utilities given that the water services that LinkWater provides are materially less than those of the majority of the comparator utilities.
The overall cost per ML for the Sydney Catchment Authority is within the same range as that for LinkWater and this can be attributed to the fact that the Sydney Catchment Authority supplies untreated water to utilities, such as Sydney Water, for treatment and distribution to consumers and hence does not incur the costs associated with treatment and distribution which is comparable to LinkWater only providing bulk water distribution. SKM notes that the cost/ML ratio for Melbourne Water is much lower than the majority of the comparator utilities. This may be attributed to the low energy use water supply system in Melbourne, ie the vast majority of the water supply system is gravity fed, and therefore requires less energy and a resulting lower operating expenditure than for the other utilities.
SKM notes that the comparator water entities excluding Sydney Catchment Authority have a full suite of water services as indicated in Table 8 and it is therefore expected that the proportion of
201
1,492
3,018 3,048
573
2,321
1,738 1,841 1,878
1,970
1,134 944
2,603
259
2,170
1,387
0
500
1,000
1,500
2,000
2,500
3,000
3,500
Total O
pex ($) p
er W
ater Sup
plied (M
L)
SINCLAIR KNIGHT MERZ PAGE 25
total operating expenditure to water supplied should be proportionally higher than for an entity such as LinkWater which provides only bulk water. Apart from Melbourne Water and Sydney Catchment Authority the operating cost per ML metric developed for LinkWater is lower than the other comparator entities.
SKM considers that, based on the above information, LinkWater’s total operating expenditure as a proportion of water supplied is consistent with that of an efficient operator.
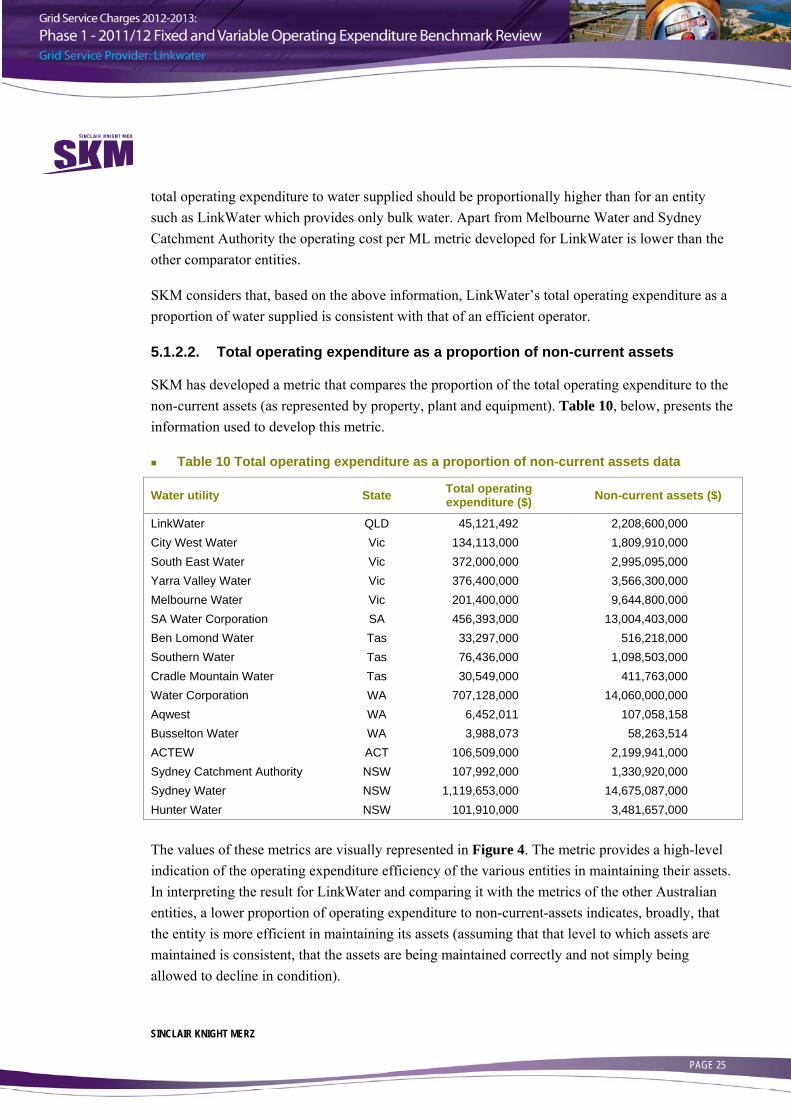
5.1.2.2. Total operating expenditure as a proportion of non-current assets
SKM has developed a metric that compares the proportion of the total operating expenditure to the non-current assets (as represented by property, plant and equipment). Table 10, below, presents the information used to develop this metric.
Table 10 Total operating expenditure as a proportion of non-current assets data
Water utility State Total operating expenditure ($) Non-current assets ($)
LinkWater QLD 45,121,492 2,208,600,000 City West Water Vic 134,113,000 1,809,910,000 South East Water Vic 372,000,000 2,995,095,000 Yarra Valley Water Vic 376,400,000 3,566,300,000 Melbourne Water Vic 201,400,000 9,644,800,000 SA Water Corporation SA 456,393,000 13,004,403,000 Ben Lomond Water Tas 33,297,000 516,218,000 Southern Water Tas 76,436,000 1,098,503,000 Cradle Mountain Water Tas 30,549,000 411,763,000 Water Corporation WA 707,128,000 14,060,000,000 Aqwest WA 6,452,011 107,058,158 Busselton Water WA 3,988,073 58,263,514 ACTEW ACT 106,509,000 2,199,941,000 Sydney Catchment Authority NSW 107,992,000 1,330,920,000 Sydney Water NSW 1,119,653,000 14,675,087,000 Hunter Water NSW 101,910,000 3,481,657,000 The values of these metrics are visually represented in Figure 4. The metric provides a high-level indication of the operating expenditure efficiency of the various entities in maintaining their assets. In interpreting the result for LinkWater and comparing it with the metrics of the other Australian entities, a lower proportion of operating expenditure to non-current-assets indicates, broadly, that the entity is more efficient in maintaining its assets (assuming that that level to which assets are maintained is consistent, that the assets are being maintained correctly and not simply being allowed to decline in condition).

SINCLAIR KNIGHT MERZ PAGE 26
Figure 4 Total operating expenditure as a proportion of non-current assets - National
Figure 4 indicates that LinkWater’s total operating expenditure as a proportion of non-current asset value is the second lowest of the comparator utilities. SKM considers the result to be as expected due to the relative low operation cost required for bulk water distribution in relation to that required for treatment and distribution and wastewater collection and treatment.
SKM notes that the total operating expenditure to asset value ratio for Melbourne Water is much lower than the majority of the reference utilities. This may be attributed, in part, to the low energy use water supply system in Melbourne, ie the vast majority of the water supply system is gravity fed, and therefore has a lower energy requirement and a resulting lower operating expenditure arising from lower electricity costs than the other utilities.
SKM considers that, based on the above information, LinkWater’s total operating expenditure as a proportion of non-current asset value is consistent with that expected of an efficient operator.
5.1.2.3. Total employee cost as a proportion of total operating expenditure
SKM has developed a metric that compares the proportion of the total employee cost to the total operating expenditure. Table 11, below, presents the information used to develop the metric.
0.020
0.074
0.124
0.106
0.021
0.035
0.065 0.070
0.074
0.050
0.060 0.068
0.048
0.081 0.076
0.029
0
0.02
0.04
0.06
0.08
0.1
0.12
0.14
Total O
pex ($) p
er Non
‐current assets ($)

SINCLAIR KNIGHT MERZ PAGE 27
Table 11 Total employee cost as a proportion of total operating expenditure data
Water utility State Employee costs ($) Total operating expenditure ($)
LinkWater QLD 16,088,627 45,121,492 City West Water Vic 26,441,000 134,113,000 South East Water Vic 47,465,000 372,000,000 Yarra Valley Water Vic 35,345,000 376,400,000 Melbourne Water Vic 75,065,000 201,400,000 SA Water Corporation SA 110,773,000 456,393,000 Ben Lomond Water Tas 14,003,000 33,297,000 Southern Water Tas 29,718,000 76,436,000 Cradle Mountain Water Tas 12,408,000 30,549,000 Water Corporation WA 439,000,000 707,128,000 Aqwest WA 3,226,154 6,452,011 Busselton Water WA 1,355,160 3,988,073 ACTEW ACT 7,770,000 106,509,000 Sydney Catchment Authority NSW 32,149,000 107,992,000 Sydney Water NSW 377,906,000 1,119,653,000 Hunter Water NSW 19,010,000 101,910,000 The values of these metrics are visually represented in Figure 5. This metric provides a high-level indication to the productivity of the staff employed of the various entities. In interpreting the result for LinkWater and comparing it with metrics derived for the other Australian entities, a lower proportion of employee cost to operating expenditure indicates, broadly, that the entity is more efficient and its staff more highly utilised and hence productive.

SINCLAIR KNIGHT MERZ PAGE 28
Figure 5 Total employee cost as a proportion of total operating expenditure - National
Figure 5 indicates that LinkWater’s total employee costs to total operating expenditure is comparable to the majority of the comparator utilities.
The relative high value for Melbourne Water is as expected since the operational expenditure is lower due to the vast majority of their water supply system being gravity fed. SKM has no explanation for the exceptional high value for Water Corporation (Western Australia) except that staff salaries and employment costs may be higher than in Eastern States as a result of the mining boom.
SKM considers that, based on the above information, LinkWater’s total employee cost as a proportion of total operating expenditure is consistent with that of an efficient operator.
5.1.2.4. Total operating expenditure as a proportion of total revenue
SKM has developed a metric that compares the proportion of the total operating expenditure to the total revenue. Table 12, below, presents the information used to develop the metric.
0.36
0.20
0.130.09
0.37
0.24
0.420.39 0.41
0.62
0.50
0.34
0.07
0.300.34
0.19
0
0.1
0.2
0.3
0.4
0.5
0.6
0.7
Employee
costs ($
) per Total Ope
x ($)

SINCLAIR KNIGHT MERZ PAGE 29
Table 12 Total operating expenditure as a proportion of total revenue data
Water utility State Total operating expenditure ($) Total Revenue ($)
LinkWater QLD 45,121,492 193,746,000 City West Water Vic 134,113,000 429,667,000 South East Water Vic 372,000,000 620,055,000 Yarra Valley Water Vic 376,400,000 659,130,000 Melbourne Water Vic 201,400,000 997,300,000 SA Water Corporation SA 456,393,000 1,154,703,000 Ben Lomond Water Tas 33,297,000 60,338,000 Southern Water Tas 76,436,000 124,989,000 Cradle Mountain Water Tas 30,549,000 51,249,000 Water Corporation WA 707,128,000 1,999,330,000 Aqwest WA 6,452,011 9,046,131 Busselton Water WA 3,988,073 7,932,726 ACTEW ACT 106,509,000 248,000,000 Sydney Catchment Authority NSW 107,992,000 194,218,000 Sydney Water NSW 1,119,653,000 2,305,962,000 Hunter Water NSW 101,910,000 261,707,000 The values of these metrics are visually represented in Figure 6. This metric provides a high-level indication to the efficiency of the various entities in delivering water. In interpreting the results for LinkWater and comparing it with the metrics of the other Australian entities, a lower proportion of operating expenditure to total revenue indicates, broadly, that the entity is more efficient.

SINCLAIR KNIGHT MERZ PAGE 30
Figure 6 Total operating expenditure as a proportion of total revenue - National
Figure 6 indicates that LinkWater’s operating expenditure to total revenue ratio is the second lowest of all the comparator utilities. This may be attributed to the relatively low operating expenditure required for operating a bulk water distribution network as compared to the entities that operate water treatment plants, wastewater services and water distribution networks.
Melbourne Water has the lowest operating expenditure to total revenue ratio and this is attributed to the vast majority of their water supply system being gravity fed, and therefore has a lower energy requirement and resulting lower operating expenditure arising from lower electricity costs.
SKM considers that, based on the above information, LinkWater’s total operating expenditure as a proportion of total revenue is consistent with that of an efficient operator.
5.1.2.5. Total revenue as a proportion of total full-time equivalents
SKM has developed a metric that details the proportion of the total revenue to the total full-time equivalents. Table 13, below, presents the information used to develop the metric.
Table 13 Total revenue as a proportion of total full-time equivalents data
Water utility State Total Revenue ($) Total FTEs
LinkWater QLD 193,746,000 134*
0.23
0.31
0.60 0.57
0.20
0.40
0.55
0.61 0.60
0.35
0.71
0.50
0.43
0.56
0.49
0.39
0
0.1
0.2
0.3
0.4
0.5
0.6
0.7
0.8
Total O
pex ($) p
er Total W
ater Sales Reven
ue ($
)

SINCLAIR KNIGHT MERZ PAGE 31
Water utility State Total Revenue ($) Total FTEs
City West Water Vic 429,667,000 372 South East Water Vic 620,055,000 500 Yarra Valley Water Vic 659,130,000 471 Melbourne Water Vic 997,300,000 841 SA Water Corporation SA 1,154,703,000 1,567 Ben Lomond Water Tas 60,338,000 184 Southern Water Tas 124,989,000 343 Cradle Mountain Water Tas 51,249,000 166 Water Corporation WA 1,999,330,000 3,015 Aqwest WA 9,046,131 36 Busselton Water WA 7,932,726 29 ACTEW ACT 248,000,000 - Sydney Catchment Authority NSW 194,218,000 246 Sydney Water NSW 2,305,962,000 3,005 Hunter Water NSW 261,707,000 481 *Permanent employees only.
The values of these metrics are visually represented in Figure 7. This metric provides a high-level indication to the efficiency of the various entities in terms of staff productivity. In interpreting the result for LinkWater and comparing it result with the metrics of the other Australian entities, a higher proportion of the total revenue to total full-time equivalents indicates, broadly, that the entity is more efficient and that staff have a higher degree of utilisation and hence are more productive.

SINCLAIR KNIGHT MERZ PAGE 32
Figure 7 Total revenue as a proportion of total full-time equivalents - National
Figure 7 indicates that LinkWater’s ratio of total revenue to total full-time equivalents is the highest of the comparator utilities. This may be attributed to the nature of the services provided by LinkWater compared to the reference utilities, ie water treatment and manufactured water services with staff only associated with these functions compared with water treatment, water mains distribution, wastewater collection and wastewater treatment services with staff associated with all aspects. Analysis of the values of the total revenue ratio to total full-time equivalents reveals that the higher values are within the well populated areas (Brisbane, Melbourne, Perth, Adelaide and Sydney) and that the lower values are within the less populated areas (parts of Western Australia, Hunter Valley and Tasmania). This is as expected since less full-time equivalents are required to undertake the operations and maintenance for a water system that has a compact footprint.
SKM considers that, based on the above information, LinkWater’s total revenue as a proportion of total full-time equivalents is consistent with that of an efficient operator.
1,446
1,155 1,240
1,399
1,186
737
327 364 309
663
251 274
‐
790 767
544
0
200
400
600
800
1000
1200
1400
1600
Total W
ater Sales Reven
ue($00
0s) p
er Total FTEs

SINCLAIR KNIGHT MERZ PAGE 33
5.1.2.6. Total full-time equivalents as a proportion of non-current assets
SKM has developed a metric that contrasts the proportion of the total full time equivalents to the non-current assets (as represented by property, plant and equipment). Table 14, below, presents the information used to develop the metric.
Table 14 Total full-time equivalents as a proportion of non-current assets data
Water utility State Total FTEs Non-current assets ($)
LinkWater QLD 134* 2,208,600,000 City West Water Vic 372 1,809,910,000 South East Water Vic 500 2,995,095,000 Yarra Valley Water Vic 471 3,566,300,000 Melbourne Water Vic 841 9,644,800,000 SA Water Corporation SA 1,567 13,004,403,000 Ben Lomond Water Tas 184 516,218,000 Southern Water Tas 343 1,098,503,000 Cradle Mountain Water Tas 166 411,763,000 Water Corporation WA 3,015 14,060,000,000 Aqwest WA 36 107,058,158 Busselton Water WA 29 58,263,514 ACTEW ACT - 2,199,941,000 Sydney Catchment Authority NSW 246 1,330,920,000 Sydney Water NSW 3,005 14,675,087,000 Hunter Water NSW 481 3,481,657,000 *Permanent employees only.
The values of these metrics are visually represented in Figure 8. This metric provides a high-level indication to the efficiency of the workforce and effectiveness of asset utilisation. In interpreting the results and comparing the metric for LinkWater with those of the other Australian entities, a lower proportion of total full time equivalents to non-current assets indicates, broadly, that the entity has small number of staff relative to the size of the entity.

SINCLAIR KNIGHT MERZ PAGE 34
Figure 8 Total full-time equivalents as a proportion of non-current assets - National
Figure 8 indicates that the full time equivalents as a proportion of non-current assets metric for LinkWater are comparable to and lower than the equivalent metrics of the comparator utilities. This can be attributed to LinkWater’s high value asset base and the relatively low number of full-time equivalents required to undertake the operations and maintenance of the infrastructure.
The three water entities (Ben Lomond Water, Southern Water and Cradle Mountain Water) are both within Tasmania and the higher metric value could be ascribed to the terrain operated in by these utilities and the associated additional cost arising from such.
SKM considers that, based on the above information, LinkWater’s total full-time equivalent as a proportion of non-current assets metric is consistent with that of an efficient operator.
0.06
0.21 0.17
0.13
0.09 0.12
0.36
0.31
0.40
0.21
0.34
0.50
‐
0.18 0.20
0.14
0
0.1
0.2
0.3
0.4
0.5
0.6
Total FTEs pe
r Non
‐current assets ($ m
illion)

SINCLAIR KNIGHT MERZ PAGE 35
5.1.2.7. Water supplied as a proportion of total full-time equivalents
SKM has developed a metric that contrasts the proportion of the water supplied to the total full time equivalents. Table 15, below, presents the information used to develop the metric.
Table 15 Water supplied as a proportion of total full-time equivalents data
Water utility State ML water supplied Total FTEs
LinkWater QLD 223,944 134* City West Water Vic 89,875 372 South East Water Vic 123,251 500 Yarra Valley Water Vic 123,476 471 Melbourne Water Vic 351,761 841 SA Water Corporation SA 196,666 1,567 Ben Lomond Water Tas 19,158 184 Southern Water Tas 41,517 343 Cradle Mountain Water Tas 16,265 166 Water Corporation WA 358,995 3,015 Aqwest WA 5,690 36 Busselton Water WA 4,222 29 ACTEW ACT 40,914 - Sydney Catchment Authority NSW 416,944 246 Sydney Water NSW 515,903 3,005 Hunter Water NSW 73,449 481 *Permanent employees only.
The values of these metrics are visually represented in Figure 9. In interpreting the result for LinkWater and comparing it with the metrics of the other Australian water entities, a higher proportion of water supplied to the total full time equivalents indicates, broadly, that the entity is more efficient.

SINCLAIR KNIGHT MERZ PAGE 36
Figure 9 Water supplied as a proportion of total full-time equivalents
Figure 9 indicates that LinkWater has the second highest ratio of total water supplied to total full-time equivalents. This is attributed to the nature of the services provided by the comparator utilities, ie water treatment, manufactured water, wastewater services, etc.
SKM notes that the metric for the Sydney Catchment Authority is significantly higher than the other reference utilities. This is attributed to the fact that a significant quantity of water is supplied by the Sydney Catchment Authority with a relatively small number of employees as no treatment of the water is conducted.
SKM notes that the water supplied as a proportion of total full-time equivalents for a number of utilities, such as Cradle Mountain Water and Sydney Water, are less than 200. This is attributed to the utilities providing both water and wastewater services to their customers and as such the total full-time equivalents includes staff associated with both water and wastewater services.
SKM considers that, based on the above information, LinkWater’s total water supplied as a proportion of total full-time equivalents is consistent with that of an efficient operator.
1,671
242 247 262
418
126 104 121 98 119 158 146
‐
1,695
172 153
0
200
400
600
800
1,000
1,200
1,400
1,600
1,800
Water Sup
plied (M
L) per Total FTEs

SINCLAIR KNIGHT MERZ PAGE 37
5.1.2.8. Total employee cost as a proportion of total full-time equivalents
SKM has developed a metric that contrasts the proportion of the total employee cost to the total of full-time equivalents. Table 16, below, presents the information used to develop the metric.
Table 16 Total employee cost as a proportion of total full-time equivalents data
Water utility State Employee costs ($) Total FTEs
LinkWater QLD 16,088,627 134* City West Water Vic 26,441,000 372 South East Water Vic 47,465,000 500 Yarra Valley Water Vic 35,345,000 471 Melbourne Water Vic 75,065,000 841 SA Water Corporation SA 110,773,000 1,567 Ben Lomond Water Tas 14,003,000 184 Southern Water Tas 29,718,000 343 Cradle Mountain Water Tas 12,408,000 166 Water Corporation WA 439,000,000 3,015 Aqwest WA 3,226,154 36 Busselton Water WA 1,355,160 29 ACTEW ACT 7,770,000 - Sydney Catchment Authority NSW 32,149,000 246 Sydney Water NSW 377,906,000 3,005 Hunter Water NSW 19,010,000 481 *Permanent employees only.
The values of these metrics are visually represented in Figure 10. In interpreting the result for LinkWater and comparing it with the metrics of the other Australian water entities, a lower proportion of total employee cost to total full-time equivalents indicates, broadly, that the entity is more efficient.

SINCLAIR KNIGHT MERZ PAGE 38
Figure 10 Total employee cost as a proportion of total full-time equivalents
Figure 10 indicates that LinkWater’s total employee cost to total full-time equivalents is comparable with the majority of the reference utilities.
SKM notes that the metrics for Busselton Water and Hunter Water are significantly lower than the reference utilities potentially indicating relative lower salaries for employees in these areas. However SKM has not been able to determine, definitively, the reason for the lower than expected value for the metrics for Busselton Water and Hunter Water.
SKM notes that the total employee cost as a proportion of total full-time equivalents for Water Corporation (Western Australia), Sydney Catchment Authority and Sydney Water are significantly higher than the other comparator utilities. SKM considers that this could be attributed to higher cost of living of the centrums, Sydney and Perth and hence relatively higher salaries in those areas.
SKM considers that, based on the above information, LinkWater’s total employee cost as a proportion of total full-time equivalents is consistent with that of an efficient operator.
120
71
95
75
89
71 76
87
75
146
90
47
‐
131 126
40
0
20
40
60
80
100
120
140
160
Employee
costs ($
000s) p
er Total FTEs

SINCLAIR KNIGHT MERZ PAGE 39
5.1.2.9. Total operating expenditure as a proportion of mains length
SKM has developed a metric that details the proportion of the total operating expenditure to the length of mains. Table 17, below, presents the information used to develop the metrics.
Table 17 Total operating expenditure as a proportion of mains length data
Water utility State Total operating expenditure ($) Mains Length (km)
LinkWater QLD 45,121,492 534 City West Water Vic 134,113,000 4,506 South East Water Vic 372,000,000 8,830 Yarra Valley Water Vic 376,400,000 8,643 Melbourne Water Vic 201,400,000 1,062 SA Water Corporation SA 456,393,000 26,552 Ben Lomond Water Tas 33,297,000 1,925 Southern Water Tas 76,436,000 3,008 Cradle Mountain Water Tas 30,549,000 1,328 Water Corporation WA 707,128,000 33,566 Aqwest WA 6,452,011 330 Busselton Water WA 3,988,073 281 ACTEW ACT 106,509,000 3,134 Sydney Catchment Authority NSW 107,992,000 - Sydney Water NSW 1,119,653,000 21,015 Hunter Water NSW 101,910,000 4,898 The values of these metrics are visually represented in Figure 11. This metric provides a high-level indication to the efficiency of the various entities in operating its assets. In interpreting the result for LinkWater and comparing it with the other Australian entities, a lower proportion of operating expenditure to total revenue indicates, broadly, that the entity is more efficient.

SINCLAIR KNIGHT MERZ PAGE 40
Figure 11 Total operating expenditure as a proportion of mains length
Figure 11 indicates that LinkWater’s ratio of total operating expenditure to mains length is the second highest of all the comparator utilities. It is to note that most, except for Melbourne Water, of the comparator utilities have extensive water distributions mains to supply water as part of their distribution and retail business. The public domain information does not draw a distinction between the length of mains for bulk distribution and reticulation.
Although, given the different nature of the assets (trunk mains and distribution) of the comparator utilities, the metrics on the water main assets of the comparator utilities may not be taken as absolute comparators, SKM considers that the high operating cost per km of linear asset (trunk main) exhibited by LinkWater compared to the majority of the comparator utilities indicates that LinkWater is not an efficient operator in this respect.
5.1.3. Benchmark comparison and discussion – International Entities
Information for a number of water utilities within other Australian states and territories was gathered, these included Anglian Water Services, Bristol Water, Portsmouth Water and Dee Valley in the United Kingdom; Emerald Coast Utilities Authority and Portland Water District in the United States of America. Information collected included:
Total operating expenditure ($)
84
30 42 44
190
17 17 25 23 21 20 14
34
‐
53
21
0
20
40
60
80
100
120
140
160
180
200
Total O
pex ($00
0s) p
er M
ains Len
gth (km)

SINCLAIR KNIGHT MERZ PAGE 41
Water supplied (ML)
Employee costs ($)
Total revenue ($)
Number of full-time equivalents
Non-current asset value ($)
Length of mains (km)
Exchange rates of 1 GBP = 1.48 AUD, 1 USD = 0.9 AUD and 1 CAD = 0.9 AUD (as at 28/02/2012) were used for the conversion of Great British Pounds, American dollars and Canadian dollars to Australian dollars.
The services provided by each of the utilities are outlined in Table 18. As all of the water utilities provide a different suite of services to their customers which do not align directly with those provided by LinkWater the metrics developed should not be considered as directly comparable.
Table 18 Services provided by utilities
Service
Water Utility
Link
Wat
er
Ang
lian
Wat
er
Serv
ices
Bris
tol W
ater
Port
smou
th W
ater
Dee
Val
ley
Nor
thum
bria
n W
ater
York
shire
Wat
er
Uni
ted
Util
ities
Seve
rn T
rent
Wat
er
Dw
r Cym
ru W
elsh
W
ater
Tham
es W
ater
Wes
sex
Wat
er
Sout
h W
est W
ater
Sout
hern
Wat
er
Emer
ald
Coa
st
Util
ities
Aut
horit
y Po
rtla
nd W
ater
D
istr
ict
Water storage
Water treatment
Bulk transmission
Chemical dosing
Distribution Retail Wastewater collection
Wastewater treatment
Desalination Other - Electricity

SINCLAIR KNIGHT MERZ PAGE 42
5.1.3.1. Total operating expenditure as a proportion of water supplied
SKM has developed a metric that details the proportion of the total operating expenditure to the water supplied. Table 19, below, presents the information used to develop the metrics.
Table 19 Total operating expenditure as a proportion of water supplied data
Water utility State Total operating expenditure ($) Water supplied (ML)
LinkWater Aus - QLD 45,121,492 223,944 Anglian Water UK 682,481,310 361,324 Bristol Water UK 73,103,100 87,147 Portsmouth Water UK 31,119,900 57,612 Dee Valley UK 16,944,690 21,637 Northumbrian Water UK 637,833,000 456,250 Yorkshire Water UK 814,086,000 478,628 United Utilities UK 1,371,657,000 730,000 Severn Trent UK 1,756,356,000 657,000 Dwr Cymru Welsh Water UK 388,962,000 297,475 Thames Water UK 921,837,000 949,000 Wessex Water UK 185,514,000 103,660 South West Water UK 381,318,000 164,611 Southern Water UK 619,164,000 210,240 Emerald Coast USA 57,543,750 39,788 Portland Water USA 22,908,117 25,686 The values of these metrics are visually represented in Figure 12. This metric provides a high-level indication to the efficiency of the various entities in respect of total costs incurred in the supply of water. In interpreting the result for LinkWater and comparing it with the metrics of the other international entities, a lower proportion of operating expenditure to water supplied indicates, broadly, that the entity is more efficient.

SINCLAIR KNIGHT MERZ PAGE 43
Figure 12 Total operating expenditure proportional to total water supplied - International
Figure 12 indicates that the overall operating expenditure per ML for LinkWater is substantially lower than the majority of the comparator utilities. It is not unexpected that the costs per ML supplied metric for LinkWater be substantially lower than that for comparator utilities given that the water services that LinkWater provides is limited to bulk distribution and therefore is less than the services provided by the comparator utilities.
SKM considers that, based on the above information, LinkWater total operating expenditure as a proportion of water supplied is consistent with that of an efficient operator.
5.1.3.2. Total operating expenditure as a proportion of non-current assets
SKM has developed a metric that compares the proportion of the total operating expenditure to the non-current assets (as represented by property, plant and equipment). Table 20, below, presents the information used to develop the metrics.
201
1,889
839
540 783
1,398
1,701 1,879
2,673
1,308
971
1,790
2,316
2,945
1,446
892
0
500
1,000
1,500
2,000
2,500
3,000
3,500
Total O
pex ($) p
er W
ater Sup
plied (M
L)
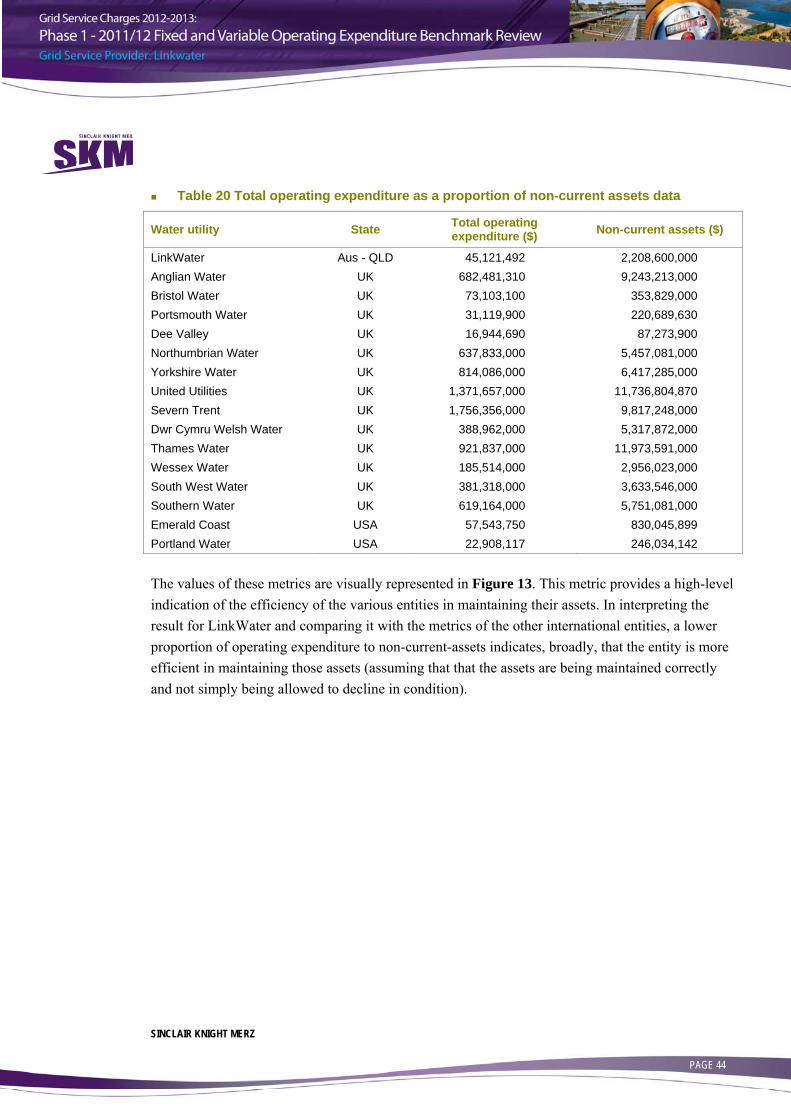
SINCLAIR KNIGHT MERZ PAGE 44
Table 20 Total operating expenditure as a proportion of non-current assets data
Water utility State Total operating expenditure ($) Non-current assets ($)
LinkWater Aus - QLD 45,121,492 2,208,600,000 Anglian Water UK 682,481,310 9,243,213,000 Bristol Water UK 73,103,100 353,829,000 Portsmouth Water UK 31,119,900 220,689,630 Dee Valley UK 16,944,690 87,273,900 Northumbrian Water UK 637,833,000 5,457,081,000 Yorkshire Water UK 814,086,000 6,417,285,000 United Utilities UK 1,371,657,000 11,736,804,870 Severn Trent UK 1,756,356,000 9,817,248,000 Dwr Cymru Welsh Water UK 388,962,000 5,317,872,000 Thames Water UK 921,837,000 11,973,591,000 Wessex Water UK 185,514,000 2,956,023,000 South West Water UK 381,318,000 3,633,546,000 Southern Water UK 619,164,000 5,751,081,000 Emerald Coast USA 57,543,750 830,045,899 Portland Water USA 22,908,117 246,034,142 The values of these metrics are visually represented in Figure 13. This metric provides a high-level indication of the efficiency of the various entities in maintaining their assets. In interpreting the result for LinkWater and comparing it with the metrics of the other international entities, a lower proportion of operating expenditure to non-current-assets indicates, broadly, that the entity is more efficient in maintaining those assets (assuming that that the assets are being maintained correctly and not simply being allowed to decline in condition).
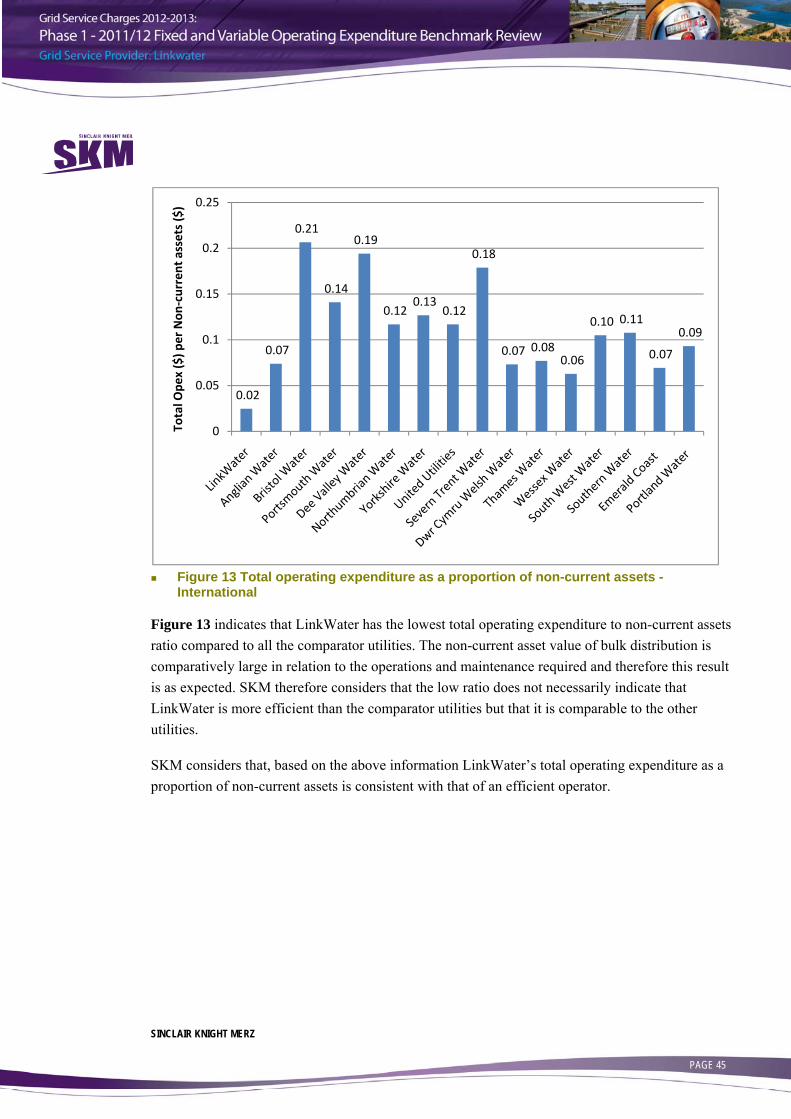
SINCLAIR KNIGHT MERZ PAGE 45
Figure 13 Total operating expenditure as a proportion of non-current assets -
International
Figure 13 indicates that LinkWater has the lowest total operating expenditure to non-current assets ratio compared to all the comparator utilities. The non-current asset value of bulk distribution is comparatively large in relation to the operations and maintenance required and therefore this result is as expected. SKM therefore considers that the low ratio does not necessarily indicate that LinkWater is more efficient than the comparator utilities but that it is comparable to the other utilities.
SKM considers that, based on the above information LinkWater’s total operating expenditure as a proportion of non-current assets is consistent with that of an efficient operator.
0.02
0.07
0.21
0.14
0.19
0.12 0.13
0.12
0.18
0.07 0.08 0.06
0.10 0.11
0.07
0.09
0
0.05
0.1
0.15
0.2
0.25
Total O
pex ($) p
er Non
‐current assets ($)

SINCLAIR KNIGHT MERZ PAGE 46
5.1.3.3. Total employee cost as a proportion of total operating expenditure
SKM has developed a metric that details the proportion of the total employee cost to the total operating expenditure. Table 21, below, presents the information used to develop the metric for LinkWater and each of the comparator utilities.
Table 21 Total employee cost as a proportion of total operating expenditure data
Water utility State Employee costs ($) Total operating expenditure ($)
LinkWater Aus - QLD 16,088,627 45,121,492 Anglian Water UK 114,351,300 682,481,310 Bristol Water UK 8,711,220 73,103,100 Portsmouth Water UK 3,676,470 31,119,900 Dee Valley UK 2,313,780 16,944,690 Northumbrian Water UK 155,379,000 637,833,000 Yorkshire Water UK 152,145,000 814,086,000 United Utilities UK 301,497,000 1,371,657,000 Severn Trent UK 495,390,000 1,756,356,000 Dwr Cymru Welsh Water UK 105,840,000 388,962,000 Thames Water UK 305,025,000 921,837,000 Wessex Water UK 94,374,000 185,514,000 South West Water UK 73,353,000 381,318,000 Southern Water UK 90,111,000 619,164,000 Emerald Coast USA 17,463,914 57,543,750 Portland Water USA 12,081,735 22,908,117 The values of these metrics are visually represented in Figure 14. This metric provides a high-level indication to the productivity of the staff employed by the various entities. In interpreting the result for LinkWater and comparing it with the metrics for the other international entities, a lower proportion of employee cost to operating expenditure indicates, broadly, that the entity is more efficient and its staff more highly utilised and hence productive.

SINCLAIR KNIGHT MERZ PAGE 47
Figure 14 Total employee cost as a proportion of the total operating expenditure -
International
Figure 14 indicates that LinkWater’s total employee cost to total operating expenditure ratio is comparable to the majority of the comparator organisations. SKM does however note that the data used in comparing the organisations does not reflect the percentage of cost that each utility spend on outsourcing.
SKM considers that, based on the above information LinkWater’s total employee costs as a proportion of total operating expenditure are consistent with those of an efficient operator.
5.1.3.4. Total operating expenditure as a proportion of total revenue
SKM has developed a metric that details the proportion of the total operating expenditure to the total revenue. Table 22, below, presents the information used to develop the metrics.
0.36
0.17 0.12 0.12 0.14
0.24
0.19 0.22
0.28 0.27
0.33
0.51
0.19 0.15
0.30
0.53
0
0.1
0.2
0.3
0.4
0.5
0.6
Employee
costs ($
) per Total Ope
x ($)

SINCLAIR KNIGHT MERZ PAGE 48
Table 22 Total operating expenditure as a proportion of total revenue data
Water utility State Total operating expenditure ($) Total Revenue ($)
LinkWater Aus - QLD 45,121,492 193,746,000 Anglian Water UK 682,481,310 1,605,681,000 Bristol Water UK 73,103,100 148,029,000 Portsmouth Water UK 31,119,900 52,207,050 Dee Valley UK 16,944,690 31,299,240 Northumbrian Water UK 637,833,000 1,085,007,000 Yorkshire Water UK 814,086,000 1,275,078,000 United Utilities UK 1,371,657,000 2,214,654,960 Severn Trent UK 1,756,356,000 2,504,733,000 Dwr Cymru Welsh Water UK 388,962,000 994,749,000 Thames Water UK 921,837,000 2,385,957,000 Wessex Water UK 185,514,000 432,474,000 South West Water UK 381,318,000 660,177,000 Southern Water UK 619,164,000 951,237,000 Emerald Coast USA 57,543,750 91,207,212 Portland Water USA 22,908,117 34,804,193 The values of these metrics are visually represented in Figure 15. This metric provides a high-level indication to the efficiency of the various entities in delivering water. In interpreting the result for LinkWater and comparing it with the metrics of the other international entities, a lower proportion of operating expenditure to total revenue indicates, broadly, that the entity is more efficient.

SINCLAIR KNIGHT MERZ PAGE 49
Figure 15 Total operating expenditure proportional to total revenue - International
Figure 15 indicates that LinkWater has the lowest operating expenditure to total revenue ratio of all the utilities and is considerably less than the average. This may be attributed to the nature of the services provided by LinkWater compared to the comparator utilities, ie bulk distribution compared to water treatment, water distribution, wastewater collection and wastewater treatment. SKM does not consider that this metric indicates that LinkWater is more efficient materially than the comparator utilities.
SKM considers that, based on the above information LinkWater’s total operating expenditure as a proportion of total revenue is consistent with that of an efficient operator.
5.1.3.5. Total revenue as a proportion of total full-time equivalents
SKM has developed a metric that details the proportion of the total revenue to the total full-time equivalents. Table 23, below, presents the information used to develop the metrics.
0.23
0.43
0.49
0.60 0.54
0.59 0.64 0.62
0.70
0.39 0.39 0.43
0.58
0.65 0.63 0.66
0
0.1
0.2
0.3
0.4
0.5
0.6
0.7
0.8
Total O
pex ($) p
er Total Reven
ue ($
000s)

SINCLAIR KNIGHT MERZ PAGE 50
Table 23 Total revenue as a proportion of total full-time equivalents data
Water utility State Total Revenue ($) Total FTEs
LinkWater Aus - QLD 193,746,000 134* Anglian Water UK 1,605,681,000 3,700 Bristol Water UK 148,029,000 443 Portsmouth Water UK 52,207,050 224 Dee Valley UK 31,299,240 175 Northumbrian Water UK 1,085,007,000 3,031 Yorkshire Water UK 1,275,078,000 2,329 United Utilities UK 2,214,654,960 4,735 Severn Trent UK 2,504,733,000 5,237 Dwr Cymru Welsh Water UK 994,749,000 1,727 Thames Water UK 2,385,957,000 4,886 Wessex Water UK 432,474,000 2,061 South West Water UK 660,177,000 1,300 Southern Water UK 951,237,000 1,562 Emerald Coast USA 91,207,212 530 Portland Water USA 34,804,193 109 *Permanent employees only.
The values of these metrics are visually represented in Figure 16. This metric provides a high-level indication to the efficiency of the various entities in terms of staff productivity. In interpreting the result for LinkWater and comparing it with the other international water entities, a higher proportion of the total revenue to total full-time equivalents indicates, broadly, that the entity is more efficient and that staff have a higher degree of utilisation and hence is more productive.

SINCLAIR KNIGHT MERZ PAGE 51
Figure 16 Total revenue proportional to full-time equivalent staff
Figure 16 indicates that LinkWater has the highest total revenue to full-time equivalent staff ratio of the utilities. SKM is unable to draw any comparison due to limited information being available on the business models of the international utilities to establish their policy in regard to outsourcing.
1,446
434 334
233 179
358
547 468 478
576 488
210
508 609
172
319
0
200
400
600
800
1000
1200
1400
1600
Total R
even
ue($00
0s) p
er Total FTEs

SINCLAIR KNIGHT MERZ PAGE 52
5.1.3.6. Total full-time equivalents as a proportion of non-current assets
SKM has developed a metric that details the proportion of the total full time equivalents to the non-current assets. Table 24, below, presents the information used to develop the metrics.
Table 24 Total full-time equivalents as a proportion of non-current assets data
Water utility State Total FTEs Non-current assets ($)
LinkWater Aus - QLD 134* 2,208,600,000 Anglian Water UK 3,700 9,243,213,000 Bristol Water UK 443 353,829,000 Portsmouth Water UK 224 220,689,630 Dee Valley UK 175 87,273,900 Northumbrian Water UK 3,031 5,457,081,000 Yorkshire Water UK 2,329 6,417,285,000 United Utilities UK 4,735 11,736,804,870 Severn Trent UK 5,237 9,817,248,000 Dwr Cymru Welsh Water UK 1,727 5,317,872,000 Thames Water UK 4,886 11,973,591,000 Wessex Water UK 2,061 2,956,023,000 South West Water UK 1,300 3,633,546,000 Southern Water UK 1,562 5,751,081,000 Emerald Coast USA 530 830,045,899 Portland Water USA 109 246,034,142 *Permanent employees only.
The values of these metrics are visually represented in Figure 17. This metric provides a high-level indication of the efficiency of the workforce and asset utilisation. In interpreting the result for LinkWater and comparing it with the metrics for the other international entities, a lower proportion of total full time equivalents to non-current assets indicates, broadly, that the entity has small number of staff relative to the size of the entity and therefore may be considered as utilising its staff efficiently.

SINCLAIR KNIGHT MERZ PAGE 53
Figure 17 Full-time equivalents proportional to the non-current asset value
Figure 17 indicates that LinkWater has a comparative low ratio of full-time equivalent to non-current asset value.
The service lines of a utility have a significant impact in determining the number of staff required to undertake operations and maintenance activities. Another factor that impacts on the full-time equivalent to non-current asset value ratio is the extent to which the utility relies on outsourcing of tasks. This information is not typically available in the public domain and therefore has not been taken into consideration. SKM is unable to comment on the efficiency of LinkWater in relation to the full-time equivalent to non-current asset ratio in benchmarking to the international comparator utilities other than that the data does indicate that LinkWater is an efficient operator in this respect.
0.06
0.40
1.25
1.02
2.01
0.56 0.36 0.40
0.53
0.32 0.41
0.70
0.36 0.27
0.64 0.44
0
0.5
1
1.5
2
2.5
Total FTEs pe
r Non
‐current assets ($million)

SINCLAIR KNIGHT MERZ PAGE 54
5.1.3.7. Water supplied as a proportion of total full-time equivalents
SKM has developed a metric that details the proportion of the water supplied to the total full time equivalents. Table 25, below, presents the information used to develop the metrics.
Table 25 Water supplied as a proportion of total full-time equivalents data
Water utility State Water supplied (ML) Total FTEs
LinkWater Aus - QLD 223,944 134* Anglian Water UK 361,324 3,700 Bristol Water UK 87,147 443 Portsmouth Water UK 57,612 224 Dee Valley UK 21,637 175 Northumbrian Water UK 456,250 3,031 Yorkshire Water UK 478,628 2,329 United Utilities UK 730,000 4,735 Severn Trent UK 657,000 5,237 Dwr Cymru Welsh Water UK 297,475 1,727 Thames Water UK 949,000 4,886 Wessex Water UK 103,660 2,061 South West Water UK 164,611 1,300 Southern Water UK 210,240 1,562 Emerald Coast USA 39,788 530 Portland Water USA 25,686 109 *Permanent employees only.
The values of these metrics are visually represented in Figure 18. In interpreting the result for LinkWater and comparing it with the metrics of the other international water entities, a higher proportion of water supplied to the total full time equivalents indicates, broadly, that the entity is more efficient.

SINCLAIR KNIGHT MERZ PAGE 55
Figure 18 Total water supplied proportional to total full-time equivalents - International
Figure 18 indicates LinkWater has an order of magnitude higher total water supplied to full-time equivalents metric compared to those of the comparator utilities. This is as expected since the comparator utilities have additional service lines to those of LinkWater.
SKM considers that, based on the above information, the LinkWater total water supplied as a proportion of total full-time equivalents metric is consistent with that of an efficient operator.
1,671
98 197
257 124 151
206 154 125 172 194
50 127 135 75
236
0
200
400
600
800
1,000
1,200
1,400
1,600
1,800
Water Sup
plied (M
L) per Total FTEs

SINCLAIR KNIGHT MERZ PAGE 56
5.1.3.8. Total employee cost as a proportion of total full-time equivalents
SKM has developed a metric that details the proportion of the total employee cost to the total full-time equivalent. Table 26, below, presents the information used to develop the metric.
Table 26 Total employee cost as a proportion of total full-time equivalents data
Water utility State Employee costs ($) Total FTEs
LinkWater Aus - QLD 16,088,627 134* Anglian Water UK 114,351,300 3,700 Bristol Water UK 8,711,220 443 Portsmouth Water UK 3,676,470 224 Dee Valley UK 2,313,780 175 Northumbrian Water UK 155,379,000 3,031 Yorkshire Water UK 152,145,000 2,329 United Utilities UK 301,497,000 4,735 Severn Trent UK 495,390,000 5,237 Dwr Cymru Welsh Water UK 105,840,000 1,727 Thames Water UK 305,025,000 4,886 Wessex Water UK 94,374,000 2,061 South West Water UK 73,353,000 1,300 Southern Water UK 90,111,000 1,562 Emerald Coast USA 17,463,914 530 Portland Water USA 12,081,735 109 *Permanent employees only.
The values of these metrics are visually represented in Figure 19. In interpreting the result for LinkWater and comparing it with the metrics for the other international water entities, a lower proportion of total employee cost to total full-time equivalents indicates, broadly, that the entity is more efficient.

SINCLAIR KNIGHT MERZ PAGE 57
Figure 19 Total employee cost proportional to total full-time equivalents
Figure 19 indicates that:
The values for the UK water entities vary significantly, however they are all lower than the metric for LinkWater
The values for the USA water entities vary significantly with one being significantly lower and the other comparable to but lower than the metric for LinkWater
From the data available SKM concludes that in respect of total employee costs as a ratio to total full time equivalents, LinkWater’s costs are higher than would be expected for an efficient operator.
120
31 20 16 13
51
65 64
95
61 62
46 56 58
33
111
0
20
40
60
80
100
120
140
Employee
costs ($
000s) p
er Total FTEs

SINCLAIR KNIGHT MERZ PAGE 58
5.1.3.9. Total operating expenditure as a proportion of mains length
SKM has developed a metric that details the proportion of the total operating expenditure to the length of mains. Table 27, below, presents the information used to develop the metrics.
Table 27 Total operating expenditure as a proportion of mains length data
Water utility State Total operating expenditure ($) Mains Length (km)
LinkWater Aus - QLD 45,121,492 534 Anglian Water UK 682,481,310 37,633 Bristol Water UK 73,103,100 6,670 Portsmouth Water UK 31,119,900 3,270 Dee Valley UK 16,944,690 1,966 Northumbrian Water UK 637,833,000 25,624 Yorkshire Water UK 814,086,000 31,154 United Utilities UK 1,371,657,000 42,000 Severn Trent UK 1,756,356,000 46,000 Dwr Cymru Welsh Water UK 388,962,000 27,000 Thames Water UK 921,837,000 31,000 Wessex Water UK 185,514,000 11,509 South West Water UK 381,318,000 15,101 Southern Water UK 619,164,000 13,658 Emerald Coast USA 57,543,750 2,700 Portland Water USA 30,290,058 1,608 The values of these metrics are visually represented in Figure 20. This metric provides a high-level indication to the effectiveness of the various entities in operating and maintaining linear assets such as water trunk mains. In interpreting the result for LinkWater and comparing it with the metrics for the other international bulk water entities, a lower proportion of operating expenditure to total revenue indicates, broadly, that the entity is more effective.
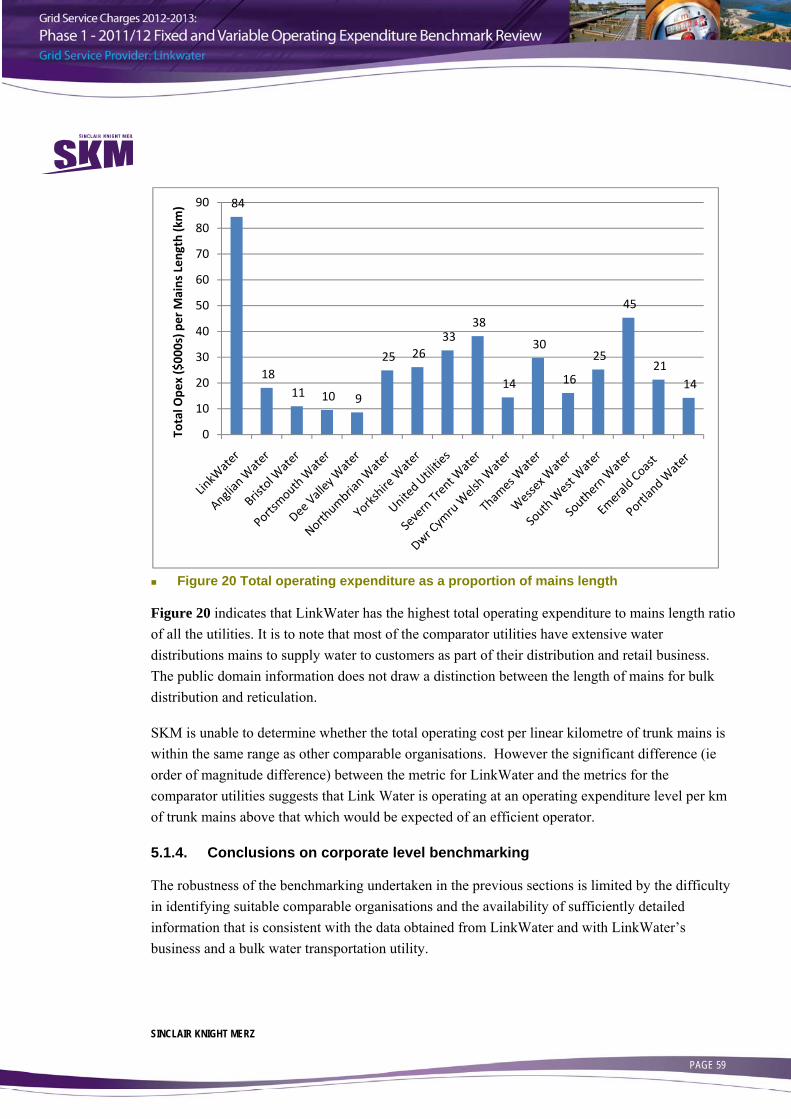
SINCLAIR KNIGHT MERZ PAGE 59
Figure 20 Total operating expenditure as a proportion of mains length
Figure 20 indicates that LinkWater has the highest total operating expenditure to mains length ratio of all the utilities. It is to note that most of the comparator utilities have extensive water distributions mains to supply water to customers as part of their distribution and retail business. The public domain information does not draw a distinction between the length of mains for bulk distribution and reticulation.
SKM is unable to determine whether the total operating cost per linear kilometre of trunk mains is within the same range as other comparable organisations. However the significant difference (ie order of magnitude difference) between the metric for LinkWater and the metrics for the comparator utilities suggests that Link Water is operating at an operating expenditure level per km of trunk mains above that which would be expected of an efficient operator.
5.1.4. Conclusions on corporate level benchmarking
The robustness of the benchmarking undertaken in the previous sections is limited by the difficulty in identifying suitable comparable organisations and the availability of sufficiently detailed information that is consistent with the data obtained from LinkWater and with LinkWater’s business and a bulk water transportation utility.
84
18 11 10 9
25 26 33
38
14
30
16
25
45
21 14
0
10
20
30
40
50
60
70
80
90
Total O
pex ($00
0s) p
er M
ains Len
gth (km)

SINCLAIR KNIGHT MERZ PAGE 60
There are a number of variables that impact on the effectiveness of the comparisons between the different utilities. These include not only differences in services provided but also differences in: operating environments; regulatory approaches; geographies; climatic conditions; and water resource management issues. The comparator utilities that were identified by SKM vary appreciably in size, roles, responsibilities and customer bases.
Nonetheless, SKM has been able to establish a range of reasonable “high level” operating expenditure benchmarks to enable a comparison to be drawn between LinkWater and the comparator utilities both nationally and internationally. These comparisons generally indicate that LinkWater’s performance in relation to organisational efficiency, spend efficiency, workforce effectiveness and asset utilisation are broadly within the same range as the comparator utilities, as summarised below Table 28.
Table 28 Summary of benchmarking
Metric National organisations International organisations
Total operating expenditure as a proportion of water supplied
Consistent with that expected of an efficient operator
Consistent with that expected of an efficient operator
Total operating expenditure as a proportion of non-current assets
Consistent with that expected of an efficient operator
Consistent with that expected of an efficient operator
Total employee cost as a proportion of total operating expenditure
Consistent with that expected of an efficient operator
Consistent with that expected of an efficient operator
Total operating expenditure as a proportion of total revenue
Consistent with that expected of an efficient operator
Consistent with that expected of an efficient operator
Total revenue as a proportion of total full-time equivalents
Consistent with that expected of an efficient operator
Insufficient information
Total full-time equivalents as a proportion of non-current assets
Consistent with that expected of an efficient operator
Insufficient information
Water supplied as a proportion of total full-time equivalents
Consistent with that expected of an efficient operator
Consistent with that expected of an efficient operator
Total employee cost as a proportion of total full-time equivalents
Consistent with that expected of an efficient operator
Not consistent with an efficient operator
Total operating expenditure as a proportion of mains length
Not consistent with an efficient operator
Not consistent with an efficient operator
The information used for the comparator utilities was sourced from public domain. The most commonly sourced documents were annual reports and regulator price reviews.

SINCLAIR KNIGHT MERZ PAGE 61
6. Benchmarking by Asset Grouping This section addresses benchmarking at an asset group level for water quality facilities, reservoirs, pump stations and bulk transfer pipelines.
6.1. Water quality facilities
This section covers the benchmarking of LinkWater’s water quality facilities as an asset group. Water quality facilities serve the primary purpose of maintaining chlorine residual within the trunk mains network.
6.1.1. LinkWater metrics
LinkWater owns, operates and maintains seven water quality facilities. Each facility contains chemical storage, dosing pumps and monitoring equipment. An overview of the information provided on the LinkWater water quality facilities asset group is outlined below in Table 29.
Table 29 Water quality facility asset group information
Capacity (ML/d)
Water treated
(ML) Average age (Yrs)
Variable operating costs ($)
Planned maintenance
costs ($)
Unplanned maintenance
costs ($) Asset
value ($) 54,345 18,769 7 1,042,821 3,484,518 1,000,464 6,550,506
Metrics developed for water quality facilities are outlined below in Table 30.
Table 30 Water quality facility metrics
Metric Metric Unit
Variable operating costs/Variable operating costs (total) 0.32 Ratio Energy costs/Energy costs (total) 0.19 Ratio Chemical costs/Chemical costs (total) 1.00 Ratio Variable operating costs/Asset value 0.019 Ratio Variable operating costs/ML water treated 55.87 $/ML Energy costs/ML water treated 27.40 $/ML Chemical costs/ML water treated 28.16 $/ML Planned maintenance costs/Asset value 0.063 Ratio Planned maintenance costs/ML water treated 185.65 $/ML Unplanned maintenance costs/Asset value 0.018 Ratio Unplanned maintenance costs/ML water treated 53.30 $/ML Total maintenance costs/Asset value 0.081 Ratio Total maintenance costs/ML water treated 238.96 $/ML Planned maintenance costs/Unplanned maintenance costs 3.48 Ratio (Total maintenance costs/Age)/ML water treated 36.76 $/ML

SINCLAIR KNIGHT MERZ PAGE 62
Metric Metric Unit
Total variable operating & maintenance costs/Asset value 0.099 Ratio Total variable operating & maintenance costs/ML water treated 294.52 $/ML LinkWater does not allocate corporate overhead costs to assets as it has not been required to do so in the past and doesn’t have an agreed mechanism to enable allocation of such costs in the time available for this review. As such a breakdown of expenditure within the asset grouping can only be determined for operational expenditure, as presented below in Figure 21. The figure indicates that the planned maintenance costs associated with the operation of water quality facilities comprises the most significant portion of the operational costs.
Figure 21 Percentage breakdown of operational costs per ML water treated for water
quality facilities
6.1.2. Comparator water utility asset group metrics
No information on water quality facilities had been provided by interstate regulators or water utilities at the time of drafting of this report; as such no benchmarking has been undertaken in this area.
6.2. Water pump stations
This section covers the metrics of LinkWater’s pumping station facilities as an asset group. Water pumping stations serve the primary purpose of transporting water from one place to another within the trunk mains network.
9%
10%
63%
18%
Energy costs
Chemical costs
Planned maintenance costs
Unplanned maintenance costs
$27.4/ML
$185.7/ML
$28.2/ML
$53.3/ML

SINCLAIR KNIGHT MERZ PAGE 63
6.2.1. LinkWater metrics
LinkWater owns, operates and maintains 22 water pump stations. The stations vary in age and capacity. Eight of the pump stations were developed in response to the drought with 15 of the stations being non-drought assets. It should be noted that a number of pump stations within the LinkWater network are non-operational as required by the SEQ Water Grid Manager operating plan. An overview of the information provided on the LinkWater water pump station asset group is outlined below in Table 31.
Table 31 Water pump station asset group information
Capacity (ML/annum)
Water transported
(ML) Average
age Variable
operating costs ($)
Planned maintenance
costs ($)
Unplanned maintenance
costs ($) Asset value
($)
1,178,633 153,315 25 2,030,139 2,944,998 1,093,602 192,604,217 Metrics developed for water pumping stations are outlined below in Table 32.
Table 32 Water pumping station metrics
Metric Value Unit
Variable operating costs/Variable operating costs (total) 0.61 Ratio Energy costs/Energy costs (total) 0.73 $ Energy costs/ML water transported 13.24 $/ML Energy costs/Capacity (ML/yr) 1.72 $/ML Planned maintenance costs/Asset value 0.015 Ratio Planned maintenance costs/ML water transported 19.21 $/ML Unplanned maintenance costs/Asset value 0.0057 Ratio Unplanned maintenance costs/ML water transported 7.13 $/ML Total maintenance costs/Asset value 0.021 Ratio Total maintenance costs/ML water transported 26.34 $/ML Planned maintenance costs/Unplanned maintenance costs 2.69 Ratio (Total maintenance costs/Age)/ML water transported 1.05 $/ML (Total maintenance costs/Age)/Capacity (ML/yr) 0.14 $/ML Total variable operating & maintenance costs/Asset value 0.032 Ratio Total variable operating & maintenance costs/ML water transported 39.58 $/ML Total variable operating & maintenance costs/Capacity (ML/yr) 5.15 $/ML
As mentioned earlier LinkWater does not allocate corporate overhead costs to assets. As such a breakdown of expenditure within the asset grouping can only be determined for operational expenditure, as presented below in Figure 22. This figure indicates that the planned maintenance costs associated with the operation of water quality facilities comprises the most significant portion of the operational costs.
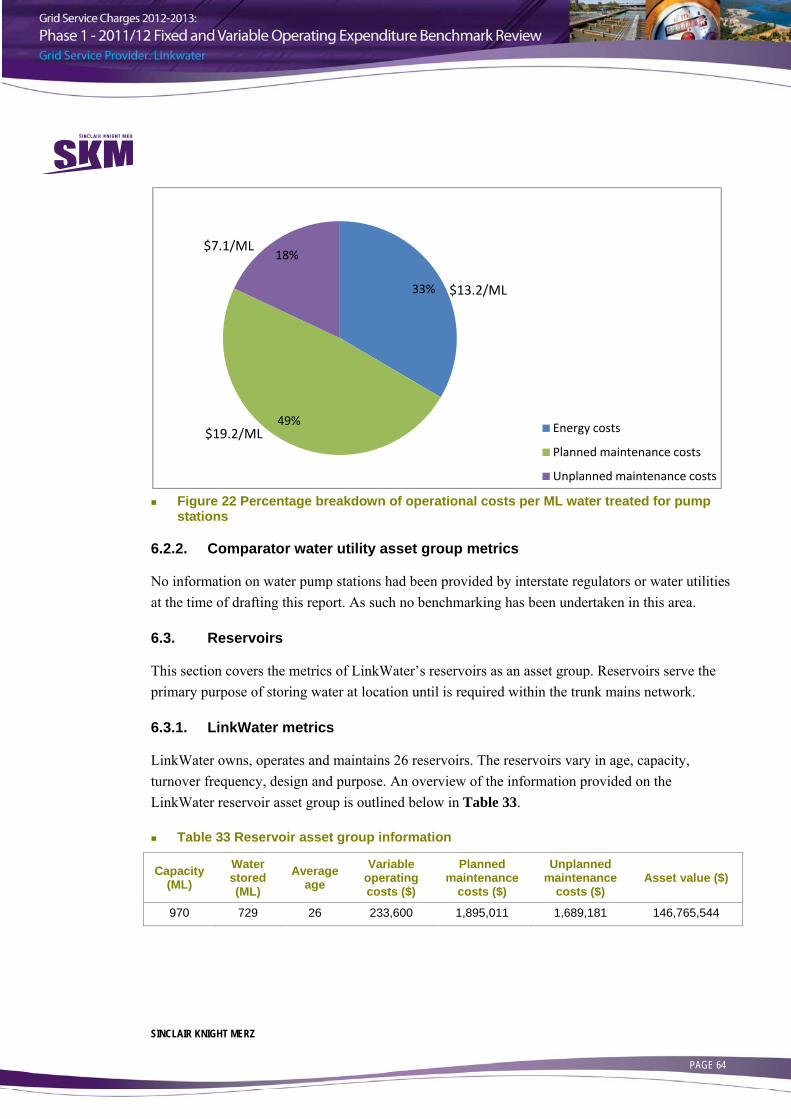
SINCLAIR KNIGHT MERZ PAGE 64
Figure 22 Percentage breakdown of operational costs per ML water treated for pump
stations
6.2.2. Comparator water utility asset group metrics
No information on water pump stations had been provided by interstate regulators or water utilities at the time of drafting this report. As such no benchmarking has been undertaken in this area.
6.3. Reservoirs
This section covers the metrics of LinkWater’s reservoirs as an asset group. Reservoirs serve the primary purpose of storing water at location until is required within the trunk mains network.
6.3.1. LinkWater metrics
LinkWater owns, operates and maintains 26 reservoirs. The reservoirs vary in age, capacity, turnover frequency, design and purpose. An overview of the information provided on the LinkWater reservoir asset group is outlined below in Table 33.
Table 33 Reservoir asset group information
Capacity (ML)
Water stored (ML)
Average age
Variable operating costs ($)
Planned maintenance
costs ($)
Unplanned maintenance
costs ($) Asset value ($)
970 729 26 233,600 1,895,011 1,689,181 146,765,544
33%
49%
18%
Energy costs
Planned maintenance costs
Unplanned maintenance costs
$19.2/ML
$7.1/ML
$13.2/ML
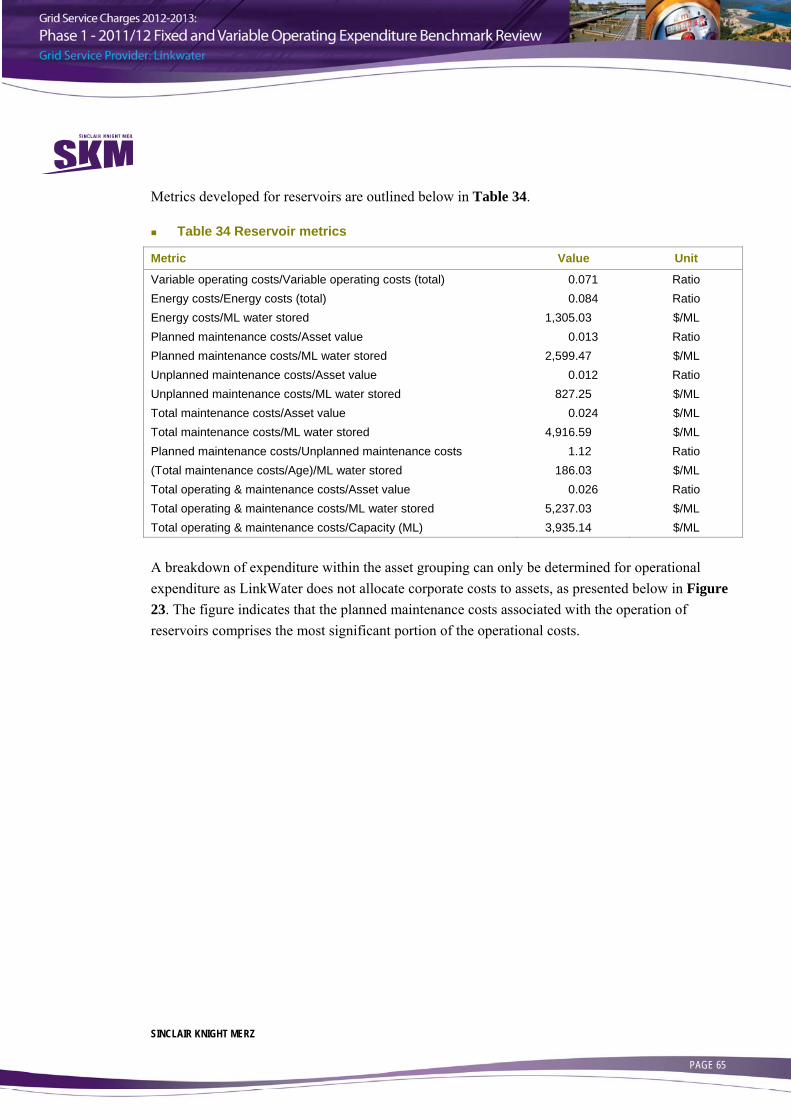
SINCLAIR KNIGHT MERZ PAGE 65
Metrics developed for reservoirs are outlined below in Table 34.
Table 34 Reservoir metrics
Metric Value Unit
Variable operating costs/Variable operating costs (total) 0.071 Ratio Energy costs/Energy costs (total) 0.084 Ratio Energy costs/ML water stored 1,305.03 $/ML Planned maintenance costs/Asset value 0.013 Ratio Planned maintenance costs/ML water stored 2,599.47 $/ML Unplanned maintenance costs/Asset value 0.012 Ratio Unplanned maintenance costs/ML water stored 827.25 $/ML Total maintenance costs/Asset value 0.024 $/ML Total maintenance costs/ML water stored 4,916.59 $/ML Planned maintenance costs/Unplanned maintenance costs 1.12 Ratio (Total maintenance costs/Age)/ML water stored 186.03 $/ML Total operating & maintenance costs/Asset value 0.026 Ratio Total operating & maintenance costs/ML water stored 5,237.03 $/ML Total operating & maintenance costs/Capacity (ML) 3,935.14 $/ML A breakdown of expenditure within the asset grouping can only be determined for operational expenditure as LinkWater does not allocate corporate costs to assets, as presented below in Figure 23. The figure indicates that the planned maintenance costs associated with the operation of reservoirs comprises the most significant portion of the operational costs.
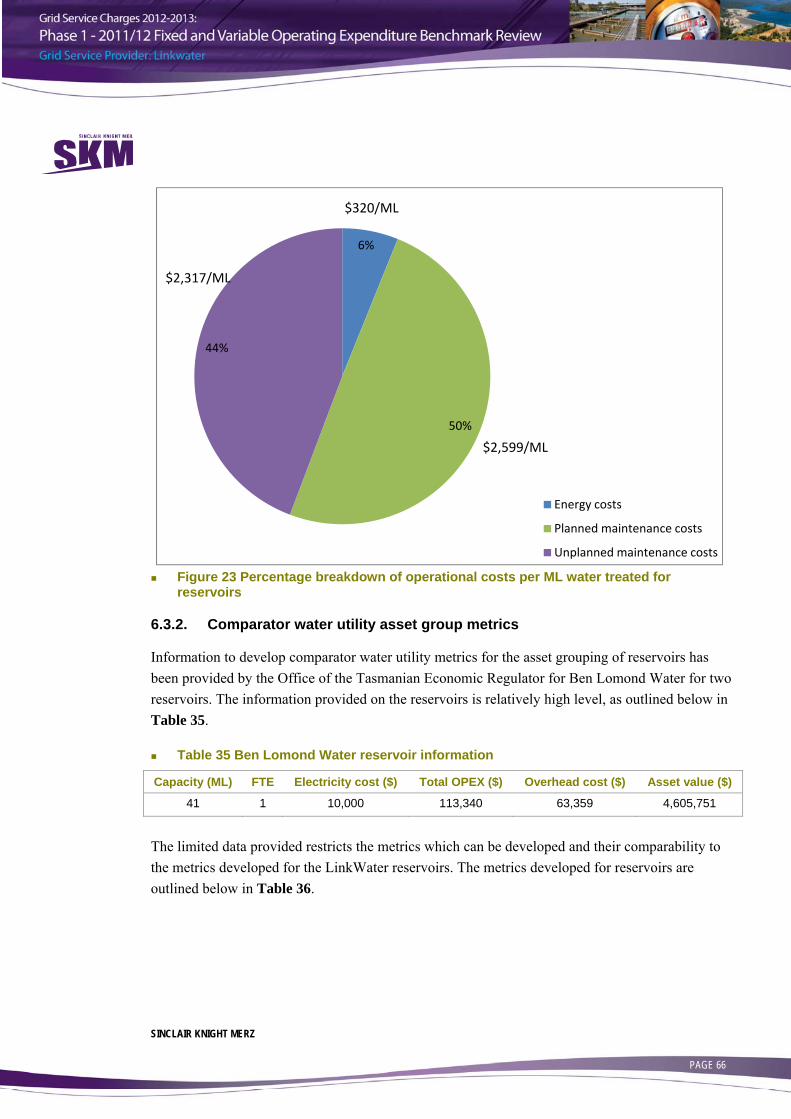
SINCLAIR KNIGHT MERZ PAGE 66
Figure 23 Percentage breakdown of operational costs per ML water treated for
reservoirs
6.3.2. Comparator water utility asset group metrics
Information to develop comparator water utility metrics for the asset grouping of reservoirs has been provided by the Office of the Tasmanian Economic Regulator for Ben Lomond Water for two reservoirs. The information provided on the reservoirs is relatively high level, as outlined below in Table 35.
Table 35 Ben Lomond Water reservoir information
Capacity (ML) FTE Electricity cost ($) Total OPEX ($) Overhead cost ($) Asset value ($)
41 1 10,000 113,340 63,359 4,605,751
The limited data provided restricts the metrics which can be developed and their comparability to the metrics developed for the LinkWater reservoirs. The metrics developed for reservoirs are outlined below in Table 36.
6%
50%
44%
Energy costs
Planned maintenance costs
Unplanned maintenance costs
$2,317/ML
$2,599/ML
$320/ML
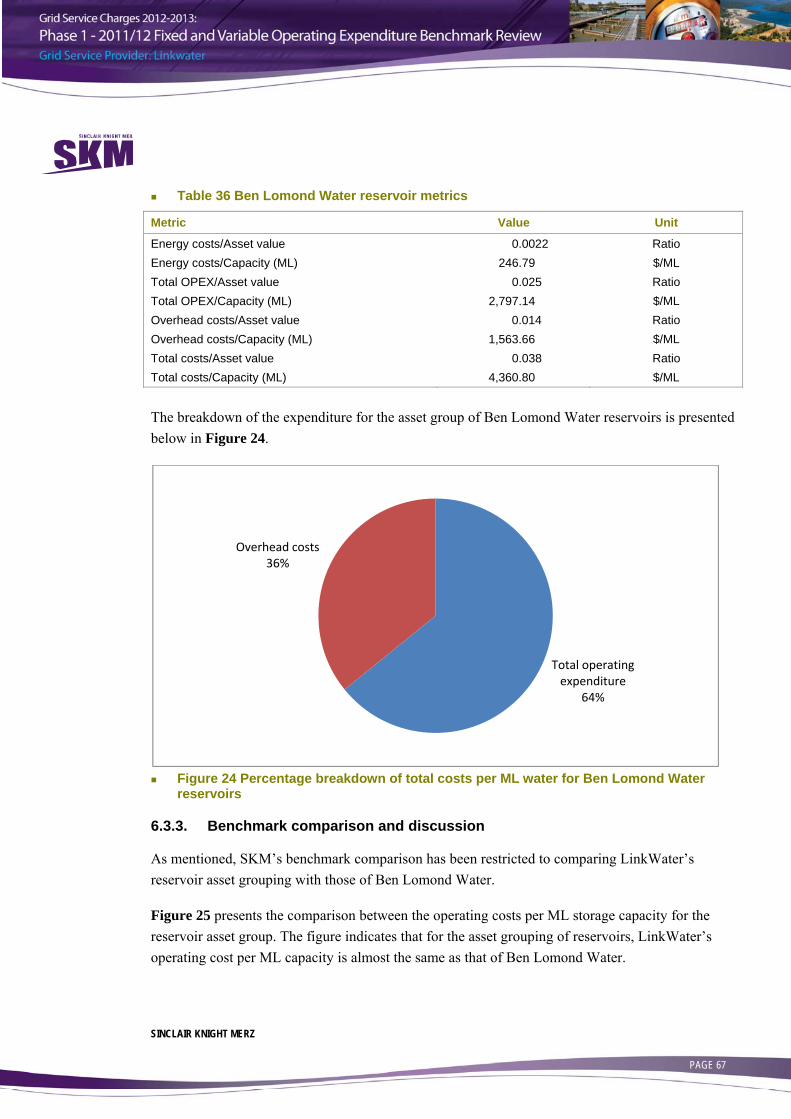
SINCLAIR KNIGHT MERZ PAGE 67
Table 36 Ben Lomond Water reservoir metrics
Metric Value Unit
Energy costs/Asset value 0.0022 Ratio Energy costs/Capacity (ML) 246.79 $/ML Total OPEX/Asset value 0.025 Ratio Total OPEX/Capacity (ML) 2,797.14 $/ML Overhead costs/Asset value 0.014 Ratio Overhead costs/Capacity (ML) 1,563.66 $/ML Total costs/Asset value 0.038 Ratio Total costs/Capacity (ML) 4,360.80 $/ML The breakdown of the expenditure for the asset group of Ben Lomond Water reservoirs is presented below in Figure 24.
Figure 24 Percentage breakdown of total costs per ML water for Ben Lomond Water
reservoirs
6.3.3. Benchmark comparison and discussion
As mentioned, SKM’s benchmark comparison has been restricted to comparing LinkWater’s reservoir asset grouping with those of Ben Lomond Water.
Figure 25 presents the comparison between the operating costs per ML storage capacity for the reservoir asset group. The figure indicates that for the asset grouping of reservoirs, LinkWater’s operating cost per ML capacity is almost the same as that of Ben Lomond Water.
Total operating expenditure
64%
Overhead costs36%
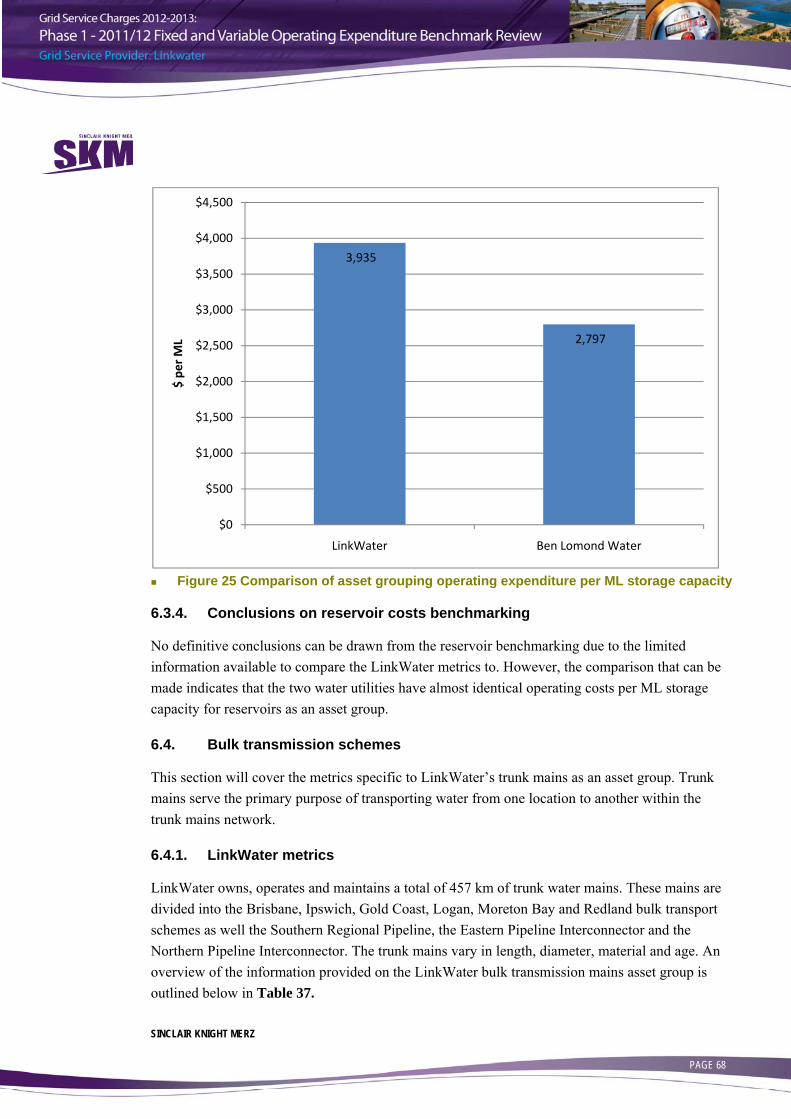
SINCLAIR KNIGHT MERZ PAGE 68
Figure 25 Comparison of asset grouping operating expenditure per ML storage capacity
6.3.4. Conclusions on reservoir costs benchmarking
No definitive conclusions can be drawn from the reservoir benchmarking due to the limited information available to compare the LinkWater metrics to. However, the comparison that can be made indicates that the two water utilities have almost identical operating costs per ML storage capacity for reservoirs as an asset group.
6.4. Bulk transmission schemes
This section will cover the metrics specific to LinkWater’s trunk mains as an asset group. Trunk mains serve the primary purpose of transporting water from one location to another within the trunk mains network.
6.4.1. LinkWater metrics
LinkWater owns, operates and maintains a total of 457 km of trunk water mains. These mains are divided into the Brisbane, Ipswich, Gold Coast, Logan, Moreton Bay and Redland bulk transport schemes as well the Southern Regional Pipeline, the Eastern Pipeline Interconnector and the Northern Pipeline Interconnector. The trunk mains vary in length, diameter, material and age. An overview of the information provided on the LinkWater bulk transmission mains asset group is outlined below in Table 37.
3,935
2,797
$0
$500
$1,000
$1,500
$2,000
$2,500
$3,000
$3,500
$4,000
$4,500
LinkWater Ben Lomond Water
$ pe
r ML

SINCLAIR KNIGHT MERZ PAGE 69
Table 37 Bulk transmission main asset group information
Length (km)
Water transported
(ML)
Average diameter
(mm) Average
age Planned
maintenance costs ($)
Unplanned maintenance
costs ($) Asset value ($)
457 370,303 963 55 345,336 1,990,151 1,624,480,702
Metrics developed for reservoirs are outlined below in Table 38.
Table 38 Bulk transmission scheme metrics
Metric Value Unit
Planned maintenance costs/km linear pipeline 756.14 $/km Planned maintenance costs/ML water transported 0.93 $/ML Planned maintenance costs/Asset value 0.00021 Ratio Unplanned maintenance costs/km linear pipeline 4,357.58 $/km Unplanned maintenance costs/ML water transported 5.37 $/ML Unplanned maintenance costs/Asset value 0.0012 Ratio Total maintenance costs/Asset value 0.0014 Ratio Total maintenance costs/ML water transported 6.31 $/ML Planned maintenance costs/Unplanned maintenance costs 0.17 Ratio (Total maintenance costs/Age)/km linear pipeline 92.98 $/km (Total maintenance costs/Age)/ML water transported 0.18 $/ML As LinkWater does not allocate corporate overhead costs to assets a breakdown of expenditure can only be determined for operational expenditure, as presented below in Figure 26. The figure indicates that the unplanned maintenance costs associated with the transportation of water is significantly greater than the planned maintenance costs. This is to be expected due to the passive nature of the assets and the fact that the majority of the assets are below ground and hence frequent visual condition monitoring is not practicable. Unplanned maintenance costs occur when failures of the asset occurs. A risk and condition based approach to assessing potential failures and to enable effective planned maintenance to occur could be undertaken to increase understanding and reduce non-scheduled maintenance.

SINCLAIR KNIGHT MERZ PAGE 70
Figure 26 Percentage breakdown of operational costs per ML water transported for bulk
transmission schemes
6.4.2. Comparator water utility asset group metrics
As mentioned, at the time of development of this draft report, information to develop comparator water utility metrics for the asset grouping of reservoirs has been provided by the Office of the Tasmanian Economic Regulator for Ben Lomond Water for two bulk water transmission schemes. The information provided on the bulk water transmission schemes is limited to a relatively high level, as outlined below in Table 39.
Table 39 Ben Lomond Water bulk water transmission scheme information
Length (km)
Water transported (ML)
Diameter range (mm) FTE
Total OPEX ($)
Overhead cost ($)
Asset value ($)
153 9,503 150 - 840 3 NA 632,451 32,365,000
The limited data provided restricts the metrics which can be developed and their comparability to the metrics developed for the LinkWater bulk water transmission schemes. The metrics developed for bulk water transmission are outlined below in Table 40.
15%
85%
Planned maintenance costs
Unplanned maintenance costs
$5.4/ML
$0.9/ML

SINCLAIR KNIGHT MERZ PAGE 71
Table 40 Ben Lomond Water bulk transmission scheme metrics
Metric Value Unit
Overhead costs/Asset value 0.02 Ratio Overhead costs/ML water transported 66.55 $/ML Overhead costs/km linear pipeline 4,126.33 $/km For the Ben Lomond Water bulk transmission schemes, only overhead costs were provided. SKM therefore assumes from this that Ben Lomond Water does not allocate operating costs to the schemes.
6.4.3. Benchmark comparison and discussion and conclusions
At the time of development of the draft report, benchmark information had only been provided by OTTER for two of the Ben Lomond Water bulk transmission schemes. As such SKM’s benchmark comparison has been restricted to comparing LinkWater’s bulk transmission scheme asset grouping with those of Ben Lomond Water. No comparison can be conducted with Ben Lomond Water’s bulk transmission schemes as only information on overhead costs allocated to the asset group has been provided whereas LinkWater does not allocate overhead costs to assets.
6.5. Asset group benchmarking overall summary
At the time of development of the draft report, benchmark information had only been provided by OTTER for Ben Lomond Water on reservoirs and bulk transmission schemes. As such SKM’s benchmark comparison has been restricted to comparing LinkWater’s reservoir and bulk transmission scheme asset groupings with those of Ben Lomond Water. This limited information results in no definitive conclusions being able to be drawn from the benchmarking at the time of writing this draft report.

SINCLAIR KNIGHT MERZ PAGE 72
7. Asset specific benchmarking – Water quality facilities
This section addresses benchmarking at an asset specific level of water quality facilities.
7.1. Chambers Flat Water Quality Facility
The Chamber Flat Water Quality Facility was constructed in 2008 and has the capacity to treat 47,450 ML/annum. The primary purpose of the facility is to maintain chlorine level within the trunk mains network. It is co-located with the Chambers Flat Pump Station between the North Beaudesert Reservoir and the Stapylton Reservoir.
7.1.1. LinkWater metrics
An overview of the information provided for Chambers Flat Water Quality Facility is outlined below in Table 41.
Table 41 Chambers Flat Water Quality Facility information
Facility Capacity (ML/annum)
Water treated
(ML) Average
age
Variable operating costs ($)
Planned maintenance
costs ($)
Unplanned maintenance
costs ($) Asset
value ($)
Chambers Flat 47,450 13,716 4 560,029 529,445 53,950 6,311,428
Metrics developed for Chambers Flat Water Quality Facility are outlined below in Table 42.
Table 42 Chambers Flat Water Quality Facility metrics
Metric Value Unit
Asset value/ML water treated 460.15 $/ML FTE/ML water treated 0.00017 FTE/ML FTE/Capacity (ML/day) 0.000048 FTE/ML Variable operating costs/ML water treated 40.83 $/ML Variable operating costs/Asset value 0.089 Ratio Energy costs/ML water treated 27.33 $/ML Chemical costs/ML water treated 13.50 $/ML Planned maintenance costs/Asset value 0.084 Ratio Planned maintenance costs/ML water treated 38.60 $/ML Unplanned maintenance costs/Asset value 0.0085 Ratio Unplanned maintenance costs/ML water treated 3.93 $/ML Planned maintenance costs/Unplanned maintenance costs 9.81 Ratio Total maintenance costs/Asset value 0.092 Ratio Total maintenance costs/ML water treated 42.53 $/ML

SINCLAIR KNIGHT MERZ PAGE 73
Metric Value Unit
(Total maintenance costs/Age)/ML water treated 10.63 $/ML Total variable operating & maintenance costs/Asset value 0.18 Ratio Total variable operating & maintenance costs/ML water treated 83.36 $/ML A breakdown of expenditure within the asset grouping can only be determined for operational expenditure as LinkWater does not allocate corporate costs. This breakdown is presented below in Figure 27. The figure indicates that the planned maintenance costs comprise the most significant portion of the operational costs.
Figure 27 Percentage breakdown of operational costs per ML water treated for
Chambers Flat Water Quality Facility
7.1.2. Comparator water utility asset metrics
No information on water quality facilities had been provided by interstate regulators or water utilities at the time of drafting of this report. As such no benchmarking has been undertaken for the Chambers Flat Water Quality Facility.
7.2. Alexandra Hills Water Quality Facility
The Alexandra Hills Water Quality Facility has the capacity to treat 6,570 ML/annum. The primary purpose of the facility is to maintain chlorine residual within the trunk mains network.
33%
16%
46%
5%
Energy costs
Chemical costs
Planned maintenance costs
Unplanned maintenance costs
$27.3/ML
$38.6/ML
$13.5/ML
$3.9/ML

SINCLAIR KNIGHT MERZ PAGE 74
7.2.1. LinkWater metrics
An overview of the information provided for Alexandra Hills Water Quality Facility is outlined below in Table 43.
Table 43 Alexandra Hills Water Quality Facility information
Facility Capacity (ML/annum)
Water treated
(ML) Average
age
Variable operating costs ($)
Planned maintenance
costs ($)
Unplanned maintenance
costs ($)
Asset value
($)
Alexandra Hills 6,570 4,948 NA 34,434 190,277 0 239,077
Metrics developed for Alexandra Hills Water Quality Facility are outlined below in Table 44.
Table 44 Alexandra Hills Water Quality Facility metrics
Metric Value Unit
Asset value/ML water treated 48.32 $/ML FTE/ML water treated 0.00015 FTE/ML FTE/Capacity (ML/day) 0.00011 FTE/ML Variable operating costs/ML water treated 6.96 $/ML Variable operating costs/Asset value 0.14 Ratio Energy costs/ML water treated 3.23 $/ML Chemical costs/ML water treated 3.73 $/ML Planned maintenance costs/Asset value 0.80 Ratio Planned maintenance costs/ML water treated 38.46 $/ML Unplanned maintenance costs/Asset value NA Ratio Unplanned maintenance costs/ML water treated NA $/ML Planned maintenance costs/Unplanned maintenance costs NA Ratio Total maintenance costs/Asset value 0.80 Ratio Total maintenance costs/ML water treated 38.46 $/ML (Total maintenance costs/Age)/ML water treated NA $/ML Total variable operating & maintenance costs/Asset value 0.94 Ratio Total variable operating & maintenance costs/ML water treated 45.41 $/ML As LinkWater does not allocate corporate overhead costs to assets, a breakdown of expenditure can only be determined for operational expenditure. This is as presented below in Figure 28. The figure indicates that the planned maintenance costs comprise the most significant portion of the operational costs.

SINCLAIR KNIGHT MERZ PAGE 75
Figure 28 Percentage breakdown of operational costs per ML water treated for
Alexandra Hills Water Quality Facility
7.2.2. Comparator water utility asset metrics
No information on water quality facilities had been provided by interstate regulators or water utilities at the time of drafting of this report. As such no benchmarking has been undertaken for the Alexandra Hills Water Quality Facility.
7.3. Summary and conclusions on water quality facility benchmarking
At the time of development of this draft report, no benchmark information had been provided on assets comparable to LinkWater water quality facilities. This limited information results in no definitive conclusions being able to be drawn from the benchmarking at the time of writing this draft report.
7%
8%
85%
0%
Energy costs
Chemical costs
Planned maintenance costs
Unplanned maintenance costs
$3.7/ML
$0/ML $3.2/ML
$38.5/ML

SINCLAIR KNIGHT MERZ PAGE 76
8. Asset specific benchmarking – Pump stations This section addresses benchmarking at an asset specific level of pump stations.
8.1. Bundamba Pump Station
The Bundamba Pump Station was constructed in 2009 and has the capacity to pump 60,000 ML/year. The pump station is part of the Southern Regional Water Pipeline network, Northern Leg, which provides bi-directional flow capability between the Gold Coast and Brisbane. The pump station consists of two variable speed drive (VSD) pumps at 1984 L/s each in a duty and standby arrangement and one VSD pump at 900 L/s (duty).
8.1.1. LinkWater metrics
An overview of the information provided for the Bundamba Pump Station is outlined below in Table 45. For the 2011/12 period the Bundamba Pump Station was not operational under a proposed mode of operation based on operating strategy as provided by SEQ Water Grid Manager.
Table 45 Bundamba Pump Station information
Pump Station
Capacity (ML/yr)
Water transported
(ML) Age
Variable operating costs ($)
Planned maintenance
costs ($)
Unplanned maintenance
costs ($)
Asset value ($)
Bundamba 60,000 0 3 2,167 129,817 9,747 24,901,846
Metrics developed for Bundamba Pump Station are outlined below in Table 46.
Table 46 Bundamba Pump Station metrics
Metric Value Unit
Asset value/ML water transported NA $/ML Asset value/Capacity (ML/yr) 415.03 $/ML FTE/ML water transported NA FTE/ML FTE/Capacity (ML/yr) 0.0000074 FTE/ML Energy costs/ML water transported NA $/ML Energy costs/Capacity (ML/yr) 0.036 $/ML Planned maintenance costs/Asset value 0.0052 Ratio Planned maintenance costs/ML water transported NA $/ML Planned maintenance costs/Capacity (ML/yr) 2.16 $/ML Unplanned maintenance costs/Asset value 0.00039 Ratio Unplanned maintenance costs/ML water transported NA $/ML Unplanned maintenance costs/Capacity (ML/yr) 0.16 $/ML Planned maintenance costs/Unplanned maintenance costs 13.32 Ratio Total maintenance costs/Asset value 0.0056 Ratio

SINCLAIR KNIGHT MERZ PAGE 77
Metric Value Unit
Total maintenance costs/ML water transported NA $/ML Total maintenance costs/Capacity (ML/yr) 2.33 $/ML (Total maintenance costs/Age)/ML water transported NA $/ML (Total maintenance costs/Age)/Capacity (ML/yr) 0.78 $/ML Total variable operating & maintenance costs/Asset value 0.0057 Ratio Total variable operating & maintenance costs/ML water transported NA $/ML A breakdown of expenditure within the asset grouping can only be determined for operational expenditure as LinkWater does not allocate corporate costs. This is presented below in Figure 29. The figure indicates that the planned maintenance costs comprise the most significant portion of the operational costs.
Figure 29 Percentage breakdown of operational costs per ML water transportation
capacity for Bundamba Pump Station
8.1.2. Comparator water utility asset metrics
No information on pump stations had been provided by interstate regulators or water utilities at the time of drafting of this report. As such no benchmarking has been undertaken for the Bundamba Pump Station.
8.2. Cameron’s Hill Pump Station
The Cameron’s Hill Pump Station was constructed in 1984 and has the capacity to transport 240,000 ML/year. The pump station is part of the Brisbane – Mount Crosby to Green Hill bulk transport scheme which provides water from the Mount Crosby Water Treatment Plant to the Green
1%
92%
7%
Energy costs
Planned maintenance costs
Unplanned maintenance costs
$2.2/ML
$0.2/ML $0.04/ML

SINCLAIR KNIGHT MERZ PAGE 78
Hill reservoirs. The pump station consists of two direct on line (DOL) pumps at 1800 L/s each in a duty and standby arrangement.
8.2.1. LinkWater metrics
An overview of the information provided for the Cameron’s Hill Pump Station is outlined below in Table 47. For the 2011/12 period the Cameron’s Hill Pump Station was not operational under a proposed mode of operation based on operating strategy as provided by SEQ Water Grid Manager.
Table 47 Cameron’s Hill Pump Station information
Pump Station
Capacity (ML/yr)
Water transported
(ML) Age
Variable operating costs ($)
Planned maintenance
costs ($)
Unplanned maintenance
costs ($)
Asset value ($)
Cameron’s Hill
240,000 0 28 470 26,508 677 957,451
Metrics developed for Cameron’s Hill Pump Station are outlined below in Table 48.
Table 48 Cameron’s Hill Pump Station metrics
Metric Value Unit
Asset value/ML water transported NA $/ML Asset value/Capacity (ML/yr) 3.99 $/ML FTE/ML water transported NA FTE/ML
FTE/Capacity (ML/yr) 0.0000003 FTE/ML
Energy costs/ML water transported NA $/ML Energy costs/Capacity (ML/yr) 0.002 $/ML Planned maintenance costs/Asset value 0.028 Ratio Planned maintenance costs/ML water transported NA $/ML Planned maintenance costs/Capacity (ML/yr) 0.11 $/ML Unplanned maintenance costs/Asset value 0.0007 Ratio Unplanned maintenance costs/ML water transported NA $/ML Unplanned maintenance costs/Capacity (ML/yr) 0.0028 $/ML Planned maintenance costs/Unplanned maintenance costs 39.16 Ratio Total maintenance costs/Asset value 0.028 Ratio Total maintenance costs/ML water transported NA $/ML Total maintenance costs/Capacity (ML/yr) 0.11 $/ML (Total maintenance costs/Age)/ML water transported NA $/ML (Total maintenance costs/Age)/Capacity (ML/yr) 0.004 $/ML Total variable operating & maintenance costs/Asset value 0.03 Ratio Total variable operating & maintenance costs/ML water transported NA $/ML Total variable operating & maintenance costs/Capacity (ML/yr) 0.12 $/ML

SINCLAIR KNIGHT MERZ PAGE 79
Due to no water being transported through the pump station the metrics have been developed based on the ML per year capacity of the pump station. Even though no water was transported though the station, there are still energy and maintenance costs associated with it due to the need to maintain operability in the event that the SEQ Water Grid Manager operational strategy changes.
As LinkWater does not allocate corporate overhead costs to assets, a breakdown of expenditure can only be determined for operational expenditure. This is as presented below in Figure 30. The figure indicates that the planned maintenance costs comprise the most significant portion of the operational costs as may be expected for an asset that is not being operated.
Figure 30 Percentage breakdown of operational costs per ML water transportation
capacity for Cameron’s Hill Pump Station
8.2.2. Comparator water utility asset metrics
No information on pump stations had been provided by interstate regulators or water utilities at the time of drafting of this report. As such no benchmarking has been undertaken for the Cameron’s Hill Pump Station.
8.3. Mudgeeraba Pump Station
The Mudgeeraba Pump Station was constructed in 1977 and has the capacity to transport 35,000 ML/year. The pump station is part of the Gold Coast – Mudgeeraba Supply Main bulk transport scheme which provides water from the Mudgeeraba Water Treatment Plant to Tarrant Drive, which connects to the Tarrant Drive to Elanora bulk transport scheme. The pump station consists of two pumps at 600 L/s each in a duty and standby arrangement.
2%
96%
2%
Energy costs
Planned maintenance costs
Unplanned maintenance costs
$0.003/ML $0.002/ML
$0.11/ML

SINCLAIR KNIGHT MERZ PAGE 80
8.3.1. LinkWater metrics
An overview of the information provided for the Mudgeeraba Pump Station is outlined below in Table 49. For the 2011/12 period the Mudgeeraba Pump Station was not operational under proposed mode of operation based on operating strategy as provided by SEQ Water Grid Manager.
Table 49 Mudgeeraba Pump Station information
Pump Station
Capacity (ML/yr)
Water transported
(ML) Age
Variable operating costs ($)
Planned maintenance
costs ($)
Unplanned maintenance
costs ($)
Asset value ($)
Mudgeeraba 35,000 0 35 1,348 25,943 475 746,998 Metrics developed for Mudgeeraba Pump Station are outlined below in Table 50.
Table 50 Mudgeeraba Pump Station metrics
Metric Value Unit
Asset value/ML water transported NA $/ML Asset value/Capacity (ML/yr) 21.34 $/ML FTE/ML water transported NA FTE/ML FTE/Capacity (ML/yr) 0.0000033 FTE/ML Energy costs/ML water transported NA $/ML Energy costs/Capacity (ML/yr) 0.039 $/ML Planned maintenance costs/Asset value 0.035 Ratio Planned maintenance costs/ML water transported NA $/ML Planned maintenance costs/Capacity (ML/yr) 0.74 $/ML Unplanned maintenance costs/Asset value 0.00064 Ratio Unplanned maintenance costs/ML water transported NA $/ML Unplanned maintenance costs/Capacity (ML/yr) 0.014 $/ML Planned maintenance costs/Unplanned maintenance costs 54.62 Ratio Total maintenance costs/Asset value 0.035 Ratio Total maintenance costs/ML water transported NA $/ML Total maintenance costs/Capacity (ML/yr) 0.75 $/ML (Total maintenance costs/Age)/ML water transported NA $/ML (Total maintenance costs/Age)/Capacity (ML/yr) 0.022 $/ML Total variable operating & maintenance costs/Asset value 0.037 Ratio Total variable operating & maintenance costs/ML water transported NA $/ML Total variable operating & maintenance costs/Capacity (ML/yr) 0.79 $/ML Due to no water being transported through the pump station the metrics have been developed based on the ML per year capacity of the pump station. Even though no water was transported though the station, there are still energy and maintenance costs associated with it due to the need maintain operability in the event that the SEQ Water Grid Manager operational strategy changes.

SINCLAIR KNIGHT MERZ PAGE 81
A breakdown of expenditure within the asset grouping can only be determined for operational expenditure as LinkWater does not allocate corporate costs. This is presented below in Figure 31. The figure indicates that the planned maintenance costs comprise the most significant portion of the operational costs.
Figure 31 Percentage breakdown of operational costs per ML water transportation
capacity for Mudgeeraba Pump Station
8.3.2. Comparator water utility asset metrics
No information on pump stations had been provided by interstate regulators or water utilities at the time of drafting of this report. As such no benchmarking has been undertaken for the Mudgeeraba Pump Station.
8.4. North Pine Pump Station
The North Pine Pump Station was constructed in 1973 and has the capacity to transport 90,000 ML/year. The pump station is part of the Brisbane – North Pine Water Treatment Plant to Aspley bulk transport scheme which provides water from the North Pine Water Treatment Plant to the Aspley Reservoir. The site has two pump stations with North Pine No. 1 consisting of four pumps at 2000 L/s each in a three pumps duty and one pump standby arrangement and North Pine No. 2 consisting of four pumps at 1500 L/s each in a three pumps duty and one pump standby arrangement.
5%
93%
2%
Energy costs
Planned maintenance costs
Unplanned maintenance costs
$0.04/ML $0.01/ML
$0.7/ML

SINCLAIR KNIGHT MERZ PAGE 82
8.4.1. LinkWater metrics
An overview of the information provided for the North Pine Pump Station is outlined below in Table 51.
Table 51 North Pine Pump Station information
Pump Station
Capacity (ML/yr)
Water transported
(ML) Age
Variable operating costs ($)
Planned maintenance
costs ($)
Unplanned maintenance
costs ($) Asset value ($)
North Pine 90,000 31,500 39 342,437 221,427 39,015 1,054,957
Metrics developed for North Pine Pump Station are outlined below in Table 52.
Table 52 North Pine Pump Station metrics
Metric Value Unit
Asset value/ML water transported 33.49 $/ML Asset value/Capacity (ML/yr) 11.72 $/ML FTE/ML water transported 0.000060 FTE/ML FTE/Capacity (ML/yr) 0.000021 FTE/ML Energy costs/ML water transported 10.87 $/ML Energy costs/Capacity (ML/yr) 3.80 $/ML Planned maintenance costs/Asset value 0.21 Ratio Planned maintenance costs/ML water transported 7.03 $/ML Planned maintenance costs/Capacity (ML/yr) 2.46 $/ML Unplanned maintenance costs/Asset value 0.037 Ratio Unplanned maintenance costs/ML water transported 1.24 $/ML Unplanned maintenance costs/Capacity (ML/yr) 0.43 $/ML Planned maintenance costs/Unplanned maintenance costs 5.68 Ratio Total maintenance costs/Asset value 0.25 Ratio Total maintenance costs/ML water transported 8.27 $/ML Total maintenance costs/Capacity (ML/yr) 2.89 $/ML (Total maintenance costs/Age)/ML water transported 0.21 $/ML (Total maintenance costs/Age)/Capacity (ML/yr) 0.074 $/ML Total variable operating & maintenance costs/Asset value 0.57 Ratio Total variable operating & maintenance costs/ML water transported 19.14 $/ML Total variable operating & maintenance costs/Capacity (ML/yr) 6.70 $/ML Due to no water being transported through the pump station the metrics have been developed based on the ML per year capacity of the pump station. Even though no water was transported though the station, there are still energy and maintenance costs associated with it due to the need maintain operability in the event that the SEQ Water Grid Manager operational strategy changes.

SINCLAIR KNIGHT MERZ PAGE 83
As LinkWater does not allocate corporate overhead costs to assets, a breakdown of expenditure can only be determined for operational expenditure. This is presented below in Figure 32. The figure indicates that the energy costs comprise the most significant portion of the operational costs.
Figure 32 Percentage breakdown of operational costs per ML water transported for
North Pine Pump Station
8.4.2. Comparator water utility asset metrics
No information on water quality facilities had been provided by interstate regulators or water utilities at the time of drafting of this report. As such no benchmarking has been undertaken for the North Pine Pump Station.
8.5. Trinder Park Pump Station
The Trinder Park Pump Station was constructed in 1983 and has the capacity to transport 40,000 ML/year. The pump station is part of the Logan – Logan Central Supply bulk transport scheme which provides water between the Kuraby Reservoir and the Kimberley Park Reservoir. The pump station consists of three pumps at 900 L/s each in a two pumps duty and one pump standby arrangement.
8.5.1. LinkWater metrics
An overview of the information provided for the Trinder Park Pump Station is outlined below in Table 53.
57%
37%
6%
Energy costs
Planned maintenance costs
Unplanned maintenance costs
$1.2/ML
$7.0/ML
$10.9/ML

SINCLAIR KNIGHT MERZ PAGE 84
Table 53 Trinder Park Pump Station information
Pump Station
Capacity (ML/yr)
Water transported
(ML) Age
Variable operating costs ($)
Planned maintenance
costs ($)
Unplanned maintenance
costs ($) Asset value ($)
Trinder Park 40,000 3,411 29 40,539 155,116 27,264 1,454,713
Metrics developed for Trinder Park Pump Station are outlined below in Table 54.
Table 54 Trinder Park Pump Station metrics
Metric Value Unit
Asset value/ML water transported 426.48 $/ML Asset value/Capacity (ML/yr) 36.37 $/ML FTE/ML water transported 0.00010 FTE/ML FTE/Capacity (ML/yr) 0.0000089 FTE/ML Energy costs/ML water transported 11.88 $/ML Energy costs/Capacity (ML/yr) 1.01 $/ML Planned maintenance costs/Asset value 0.11 Ratio Planned maintenance costs/ML water transported 45.48 $/ML Planned maintenance costs/Capacity (ML/yr) 3.88 $/ML Unplanned maintenance costs/Asset value 0.019 Ratio Unplanned maintenance costs/ML water transported 7.99 $/ML Unplanned maintenance costs/Capacity (ML/yr) 0.68 $/ML Planned maintenance costs/Unplanned maintenance costs 5.69 Ratio Total maintenance costs/Asset value 0.13 Ratio Total maintenance costs/ML water transported 53.47 $/ML Total maintenance costs/Capacity (ML/yr) 4.56 $/ML (Total maintenance costs/Age)/ML water transported 1.84 $/ML (Total maintenance costs/Age)/Capacity (ML/yr) 0.16 $/ML Total variable operating & maintenance costs/Asset value 0.15 Ratio Total variable operating & maintenance costs/ML water transported 65.35 $/ML Total variable operating & maintenance costs/Capacity (ML/yr) 5.57 $/ML A breakdown of expenditure within the asset grouping can only be determined for operational expenditure as LinkWater does not allocate corporate costs. This is presented below in Figure 33. The figure indicates that the planned maintenance costs comprise the most significant portion of the operational costs.

SINCLAIR KNIGHT MERZ PAGE 85
Figure 33 Percentage breakdown of operational costs per ML water transported for
Trinder Park Pump Station
8.5.2. Comparator water utility asset metrics
No information on pump stations had been provided by interstate regulators or water utilities at the time of drafting of this report. As such no benchmarking has been undertaken for the Trinder Park Pump Station.
8.6. Summary and conclusions on pump station benchmarking
At the time of development of this draft report, no benchmark information had been provided on assets comparable to LinkWater’s water pump stations. This limited information results in no definitive conclusions being able to be drawn from the benchmarking.
18%
70%
12%
Energy costs
Planned maintenance costs
Unplanned maintenance costs
$11.9/ML
$45.5/ML
$8.0/ML

SINCLAIR KNIGHT MERZ PAGE 86
9. Asset specific benchmarking – Reservoirs This section will cover benchmarking at an asset specific level of reservoirs. The assets identified and agreed with the Authority have been addressed individually.
9.1. Aspley Reservoir
The Aspley Reservoir was constructed in 1971 and has a capacity of 91 ML. The reservoir is part of the Brisbane bulk transport scheme and is fed from the North Pine Water Treatment Plant.
9.1.1. LinkWater metrics
An overview of the information provided for the Aspley Reservoir is outlined below in Table 55.
Table 55 Aspley Reservoir information
Reservoir Capacity
(ML)
Water stored (ML)
Age Variable
operating costs ($)
Planned maintenance
costs ($)
Unplanned maintenance
costs ($) Asset value ($)
Aspley 91 50 41 7,300 111,575 63,590 10,466,220 Metrics developed for Aspley Reservoir are outlined below in Table 56.
Table 56 Aspley Reservoir metrics
Metric Value Unit
Asset value/ML water stored 209,324.39 $/ML FTE/ML water stored 0.0079 FTE/ML FTE/Capacity (ML) 0.0043 FTE/ML Variable operating costs/ML water stored 146.00 $/ML Variable operating costs/Asset value 0.00070 Ratio Planned maintenance costs/Asset value 0.011 Ratio Planned maintenance costs/ML water stored 2,231.50 $/ML Unplanned maintenance costs/Asset value 0.006 Ratio Unplanned maintenance costs/ML water stored 1,271.80 $/ML Total maintenance costs/Asset value 0.017 Ratio Total maintenance costs/ML water stored 3,503.30 $/ML Planned maintenance costs/Unplanned maintenance costs 1.75 Ratio (Total maintenance costs/Age)/ML water stored 85.45 $/ML Total operating & maintenance costs/Asset value 0.017 Ratio Total operating & maintenance costs/ML water stored 3,649.30 $/ML Total operating & maintenance costs/Capacity (ML) 2,005.11 $/ML

SINCLAIR KNIGHT MERZ PAGE 87
As LinkWater does not allocate corporate overhead costs to assets, a breakdown of expenditure can only be determined for operational expenditure. This is presented below in Figure 34. The figure indicates that the planned maintenance costs comprise the most significant portion of the operational costs.
Figure 34 Percentage breakdown of operational costs per ML water stored for Aspley
Reservoir
9.1.2. Comparator water utility asset metrics
Information on reservoirs provided by interstate regulators or water utilities at the time of drafting of this report is not comparable to Aspley Reservoir as such no benchmarking comparison has been conducted.
9.2. Green Hill Reservoirs
The Green Hill reservoir complex consists of two reservoirs, both of which were constructed in 1968. Green Hill Reservoir No. 1 has a capacity of approximately 77 ML and Green Hill Reservoir No. 2 has a capacity of approximately 80 ML. The reservoirs are part of the Brisbane bulk transport scheme and are fed from the Mt Crosby Water Treatment Plant.
9.2.1. LinkWater metrics
An overview of the information provided for the Green Hill reservoir complex is outlined below in Table 57.
4%
61%
35%
Energy costs
Planned maintenance costs
Unplanned maintenance costs
$2,232/ML
$1,272/ML
$146/ML

SINCLAIR KNIGHT MERZ PAGE 88
Table 57 Green Hill reservoir complex information
Reservoir Capacity
(ML)
Water stored (ML)
Age Variable
operating costs ($)
Planned maintenance
costs ($)
Unplanned maintenance
costs ($) Asset value ($)
Green Hill 157 87 44 14,600 167,550 13,448 14,586,518 Metrics developed for Green Hill reservoirs are outlined below in Table 58.
Table 58 Green Hill reservoir complex metrics
Metric Value Unit
Asset value/ML water stored 167,661.13 $/ML FTE/ML water stored 0.0065 FTE/ML FTE/Capacity (ML) 0.0036 FTE/ML Variable operating costs/ML water stored 167.82 $/ML Variable operating costs/Asset value 0.0010 Ratio Planned maintenance costs/Asset value 0.011 Ratio Planned maintenance costs/ML water stored 1,925.86 $/ML Unplanned maintenance costs/Asset value 0.00092 Ratio Unplanned maintenance costs/ML water stored 154.57 $/ML Total maintenance costs/Asset value 0.012 Ratio Total maintenance costs/ML water stored 2,080.44 $/ML Planned maintenance costs/Unplanned maintenance costs 12.46 Ratio (Total maintenance costs/Age)/ML water stored 47.28 $/ML Total operating & maintenance costs/Asset value 0.013 Ratio Total operating & maintenance costs/ML water stored 2,248.25 $/ML Total operating & maintenance costs/Capacity (ML) 1,247.44 $/ML A breakdown of expenditure within the asset grouping can only be determined for operational expenditure as LinkWater does not allocate corporate costs. This is presented below in Figure 35. The figure indicates that the planned maintenance costs comprise the most significant portion of the operational costs.

SINCLAIR KNIGHT MERZ PAGE 89
Figure 35 Percentage breakdown of operational costs per ML water stored for Green Hill
reservoir complex
9.2.2. Comparator water utility asset metrics
Information on reservoirs provided by interstate regulators or water utilities at the time of drafting of this report is not comparable to Green Hill reservoir complex as such no benchmarking comparison has been conducted.
9.3. Narangba Reservoirs
The Narangba reservoir complex consists of three reservoirs. Narangba Reservoir No. 1 was constructed in 1977 and has a capacity of 9.1 ML, Narangba Reservoir No. 2 was constructed in 1993 and has a capacity of 16.5 ML and Narangba Reservoir No. 3 was constructed in 1993 and has a capacity of 14.5 ML. The reservoirs are part of the Moreton Bay bulk transport scheme and are fed from the North Pine Water Treatment Plant.
9.3.1. LinkWater metrics
An overview of the information provided for the Narangba reservoir complex is outlined below in Table 59.
Table 59 Narangba reservoir complex information
Reservoir Capacity
(ML)
Water stored (ML)
Average Age
Variable operating costs ($)
Planned maintenance
costs ($)
Unplanned maintenance
costs ($) Asset value ($)
Narangba 40 27 24 21,900 165,635 46,428 7,574,463
7%
86%
7%
Energy costs
Planned maintenance costs
Unplanned maintenance costs
$168/ML $155/ML
$1,926 /ML

SINCLAIR KNIGHT MERZ PAGE 90
Metrics developed for Narangba reservoir complex are outlined below in Table 60.
Table 60 Narangba reservoir complex metrics
Metric Value Unit
Asset value/ML water stored 280,535.67 $/ML FTE/ML water stored 0.022 FTE/ML FTE/Capacity (ML) 0.015 FTE/ML Variable operating costs/ML water stored 811.11 $/ML Variable operating costs/Asset value 0.003 Ratio Planned maintenance costs/Asset value 0.022 Ratio Planned maintenance costs/ML water stored 6,134.63 $/ML Unplanned maintenance costs/Asset value 0.0061 Ratio Unplanned maintenance costs/ML water stored 1,719.56 $/ML Total maintenance costs/Asset value 0.028 Ratio Total maintenance costs/ML water stored 7,854.19 $/ML Planned maintenance costs/Unplanned maintenance costs 3.57 Ratio (Total maintenance costs/Age)/ML water stored 224.41 $/ML Total operating & maintenance costs/Asset value 0.031 Ratio Total operating & maintenance costs/ML water stored 8,665.30 $/ML Total operating & maintenance costs/Capacity (ML) 5834.49 $/ML As LinkWater does not allocate corporate overhead costs to assets, a breakdown of expenditure can only be determined for operational expenditure. This is presented below in Figure 36. The figure indicates that the planned maintenance costs comprise the most significant portion of the operational costs.

SINCLAIR KNIGHT MERZ PAGE 91
Figure 36 Percentage breakdown of operational costs per ML water stored for Narangba
reservoir complex
9.3.2. Comparator water utility asset metrics
Information on reservoirs provided by interstate regulators or water utilities at the time of drafting of this report is not comparable to Narangba reservoir complex as such no benchmarking comparison has been conducted.
9.4. Stapylton Reservoir
The Stapylton Reservoir was constructed in 2009 and has a capacity of 25 ML. The reservoir is part of the Southern Regional Pipeline – Central Leg which provides bi-directional flow capability between Brisbane and the Gold Coast.
9.4.1. LinkWater metrics
An overview of the information provided for the Stapylton Reservoir is outlined below in Table 61.
Table 61 Stapylton Reservoir information
Reservoir Capacity
(ML)
Water stored (ML)
Age Variable
operating costs ($)
Planned maintenance
costs ($)
Unplanned maintenance
costs ($) Asset value ($)
Stapylton 25 15 3 7,300 35,661 245,103 28,311,009 Metrics developed for Stapylton Reservoir are outlined below in Table 62.
9%
71%
20%
Energy costs
Planned maintenance costs
Unplanned maintenance costs
$811/ML
$1,720/ML
$6,135 /ML

SINCLAIR KNIGHT MERZ PAGE 92
Table 62 Stapylton Reservoir metrics
Metric Value Unit
Asset value/ML water stored 1,887,400.57 $/ML FTE/ML water stored 0.014 FTE/ML FTE/Capacity (ML) 0.0083 FTE/ML Variable operating costs/ML water stored 486.67 $/ML Variable operating costs/Asset value 0.00026 Ratio Planned maintenance costs/Asset value 0.0013 Ratio Planned maintenance costs/ML water stored 2,377.40 $/ML Unplanned maintenance costs/Asset value 0.0087 Ratio Unplanned maintenance costs/ML water stored 16,340.20 $/ML Total maintenance costs/Asset value 0.0099 Ratio Total maintenance costs/ML water stored 18,717.60 $/ML Planned maintenance costs/Unplanned maintenance costs 0.15 Ratio (Total maintenance costs/Age)/ML water stored 6,239.20 $/ML Total operating & maintenance costs/Asset value 0.010 Ratio Total operating & maintenance costs/ML water stored 19,204.27 $/ML Total operating & maintenance costs/Capacity (ML) 11,522.56 $/ML A breakdown of expenditure within the asset grouping can only be determined for operational expenditure as LinkWater does not allocate corporate costs. This is presented below in Figure 36. The figure indicates that unplanned maintenance costs accounts for the largest portion of operating expenditure, approximately $245,000 which is almost seven times the planned maintenance costs. When compared with the other LinkWater reservoirs, the unplanned maintenance costs are very high.

SINCLAIR KNIGHT MERZ PAGE 93
Figure 37 Percentage breakdown of operational costs per ML water stored for Stapylton
Reservoir
9.4.2. Comparator water utility asset metrics
Information to develop comparator water utility metrics for specific assets has been provided by the Office of the Tasmanian Economic Regulator for Ben Lomond Water for two reservoirs, the Rocherlea Complex and the Distillery Creek Complex. The Rocherlea Complex reservoirs have a capacity of 23 ML, while the Distillery Creek Complex reservoirs have a capacity of 18 ML. The information provided on the Rocherlea Complex and the Distillery Creek Complex reservoirs is limited to information of a relatively high level, as outlined below in Table 63.
Table 63 Rocherlea Complex and Distillery Creek Complex reservoirs information
Plant Capacity (ML) FTEs Total OPEX
($) Electricity costs ($)
Overhead cost ($)
Asset value($)
Rocherlea 23 0.5 60,170 5,000 39,375 3,374,533 Distillery Creek 18 0.5 53,170 5,000 23,985 1,231,218 The limited data provided restricts the metrics which can be developed and how comparable they are to the metrics developed for Stapylton Reservoir. The metrics developed for the reservoirs are outlined below in Table 64.
3%
12%
85% Energy costs
Planned maintenance costs
Unplanned maintenance costs
$487/ML
$2,377/ML
$16,340/ML

SINCLAIR KNIGHT MERZ PAGE 94
Table 64 Ben Lomond Water reservoir metrics
Metric Rocherlea Complex Distillery Creek Complex Unit
Asset value/Capacity (ML) 149,846.05 68,401.00 $/ML FTE/Capacity (ML) 0.022 0.028 FTE/ML Energy costs/Capacity (ML) 222.02 277.78 $/ML Energy costs/Asset value 0.0015 0.0041 Ratio Total operating expenditure/Capacity (ML) 2,671.85 2,953.89 $/ML Total operating expenditure/Asset value 0.018 0.043 Ratio Overhead costs/Capacity (ML) 1,748.43 1,332.49 $/ML Overhead costs/Asset value 0.012 0.019 Ratio Total costs/Capacity (ML) 4,420.27 4,286.38 $/ML Total costs/Asset value 0.029 0.063 Ratio 9.4.3. Benchmark comparison and discussion
At the time of development of the draft report, benchmark information had only been provided by OTTER, on behalf of Ben Lomond Water, for two comparable reservoir complexes, Rocherlea and Distillery Creek. As such a benchmarking comparison has only been undertaken between Stapylton Reservoir, Rocherlea Complex reservoirs and Distillery Creek Complex reservoirs. Figure 38 presents the storage capacities of the reservoirs which are comparable in respect to storage volume. There are many other attributes associated with reservoirs which may affect the operational costs including dam wall length, height, construction, dam circumference and managed catchment area. Information on these variables would need to be known to determine if the reservoirs are truly comparable.

SINCLAIR KNIGHT MERZ PAGE 95
Figure 38 Storage capacities for Stapylton Reservoir, Rocherlea Complex reservoirs
and Distillery Creek Complex reservoirs
Figure 39 Comparison of operating expenditure per ML water storage capacity
Figure 39 presents a comparison between the operating costs per ML water storage for Staplyton Reservoir (LinkWater), Rocherlea Complex reservoirs and Distillery Creek Complex reservoirs. The figure indicates that the operating cost per ML water treated for Staplyton Reservoir is significantly higher than both Rocherlea and Distillery Creek reservoirs. As discussed earlier, a significant portion of the Staplyton Reservoir operating costs are associated with unplanned
25
23
18
0
5
10
15
20
25
30
Stapylton Rocherlea Distillery Creek
Storage capa
city (M
L)
11,523
2,672 2,954
$0
$2,000
$4,000
$6,000
$8,000
$10,000
$12,000
$14,000
Stapylton Rocherlea Distillery Creek
$ pe
r ML
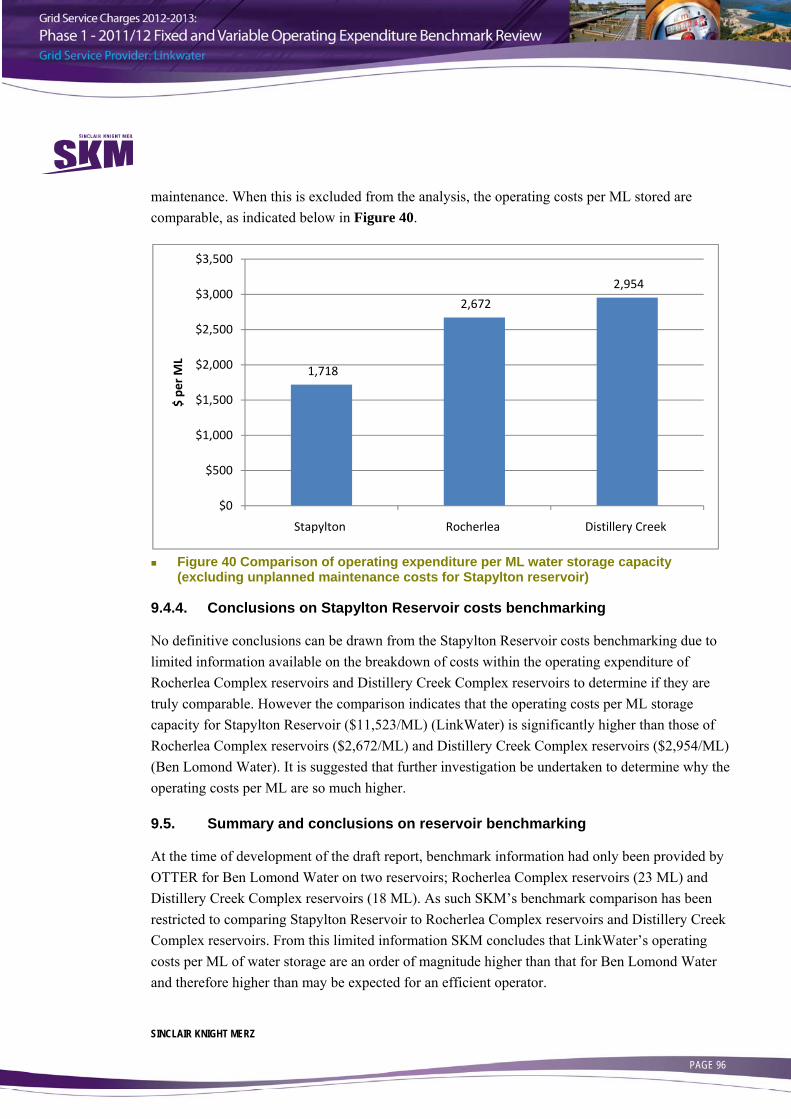
SINCLAIR KNIGHT MERZ PAGE 96
maintenance. When this is excluded from the analysis, the operating costs per ML stored are comparable, as indicated below in Figure 40.
Figure 40 Comparison of operating expenditure per ML water storage capacity
(excluding unplanned maintenance costs for Stapylton reservoir)
9.4.4. Conclusions on Stapylton Reservoir costs benchmarking
No definitive conclusions can be drawn from the Stapylton Reservoir costs benchmarking due to limited information available on the breakdown of costs within the operating expenditure of Rocherlea Complex reservoirs and Distillery Creek Complex reservoirs to determine if they are truly comparable. However the comparison indicates that the operating costs per ML storage capacity for Stapylton Reservoir ($11,523/ML) (LinkWater) is significantly higher than those of Rocherlea Complex reservoirs ($2,672/ML) and Distillery Creek Complex reservoirs ($2,954/ML) (Ben Lomond Water). It is suggested that further investigation be undertaken to determine why the operating costs per ML are so much higher.
9.5. Summary and conclusions on reservoir benchmarking
At the time of development of the draft report, benchmark information had only been provided by OTTER for Ben Lomond Water on two reservoirs; Rocherlea Complex reservoirs (23 ML) and Distillery Creek Complex reservoirs (18 ML). As such SKM’s benchmark comparison has been restricted to comparing Stapylton Reservoir to Rocherlea Complex reservoirs and Distillery Creek Complex reservoirs. From this limited information SKM concludes that LinkWater’s operating costs per ML of water storage are an order of magnitude higher than that for Ben Lomond Water and therefore higher than may be expected for an efficient operator.
1,718
2,672
2,954
$0
$500
$1,000
$1,500
$2,000
$2,500
$3,000
$3,500
Stapylton Rocherlea Distillery Creek
$ pe
r ML
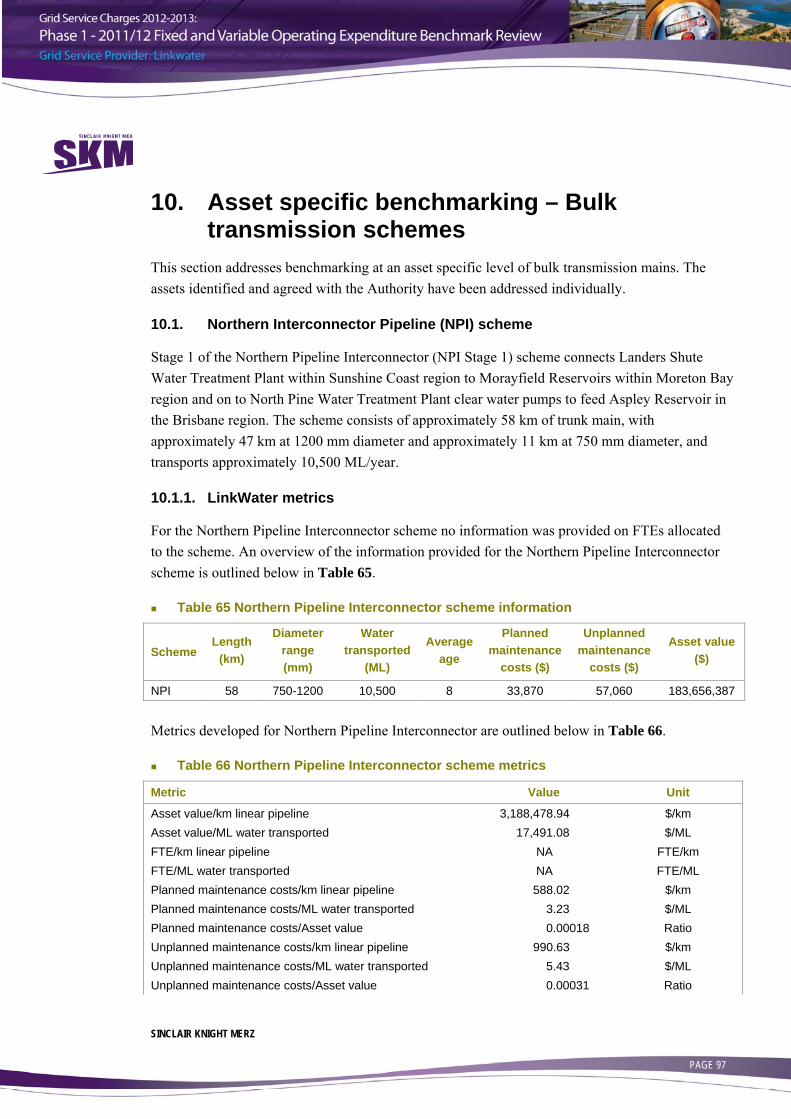
SINCLAIR KNIGHT MERZ PAGE 97
10. Asset specific benchmarking – Bulk transmission schemes
This section addresses benchmarking at an asset specific level of bulk transmission mains. The assets identified and agreed with the Authority have been addressed individually.
10.1. Northern Interconnector Pipeline (NPI) scheme
Stage 1 of the Northern Pipeline Interconnector (NPI Stage 1) scheme connects Landers Shute Water Treatment Plant within Sunshine Coast region to Morayfield Reservoirs within Moreton Bay region and on to North Pine Water Treatment Plant clear water pumps to feed Aspley Reservoir in the Brisbane region. The scheme consists of approximately 58 km of trunk main, with approximately 47 km at 1200 mm diameter and approximately 11 km at 750 mm diameter, and transports approximately 10,500 ML/year.
10.1.1. LinkWater metrics
For the Northern Pipeline Interconnector scheme no information was provided on FTEs allocated to the scheme. An overview of the information provided for the Northern Pipeline Interconnector scheme is outlined below in Table 65.
Table 65 Northern Pipeline Interconnector scheme information
Scheme Length
(km)
Diameter range (mm)
Water transported
(ML)
Average age
Planned maintenance
costs ($)
Unplanned maintenance
costs ($)
Asset value ($)
NPI 58 750-1200 10,500 8 33,870 57,060 183,656,387 Metrics developed for Northern Pipeline Interconnector are outlined below in Table 66.
Table 66 Northern Pipeline Interconnector scheme metrics
Metric Value Unit
Asset value/km linear pipeline 3,188,478.94 $/km Asset value/ML water transported 17,491.08 $/ML FTE/km linear pipeline NA FTE/km FTE/ML water transported NA FTE/ML Planned maintenance costs/km linear pipeline 588.02 $/km Planned maintenance costs/ML water transported 3.23 $/ML Planned maintenance costs/Asset value 0.00018 Ratio Unplanned maintenance costs/km linear pipeline 990.63 $/km Unplanned maintenance costs/ML water transported 5.43 $/ML Unplanned maintenance costs/Asset value 0.00031 Ratio

SINCLAIR KNIGHT MERZ PAGE 98
Metric Value Unit
Total maintenance costs/km linear pipeline 1,578.65 $/km Total maintenance costs/ML water transported 8.66 $/ML Total maintenance costs/Asset value 0.00050 Ratio Planned maintenance costs/Unplanned maintenance costs 0.59 Ratio (Total maintenance costs/Age)/km linear pipeline 189.44 $/km (Total maintenance costs/Age)/ML water transported 1.04 $/ML As LinkWater does not allocate corporate overhead costs to assets, a breakdown of expenditure can only be determined for operational expenditure. This is presented below in Figure 41. The figure indicates that unplanned maintenance costs associated with the scheme accounts for the largest portion of expenditure.
Figure 41 Percentage breakdown of operational costs per ML water transported for the
Northern Pipeline Interconnector scheme
10.1.2. Comparator water utility asset metrics
Information on bulk transport schemes provided by interstate regulators or water utilities at the time of drafting of this report are not comparable to Northern Pipeline Interconnector scheme as such no benchmarking comparison has been conducted.
10.2. Anstead to Runcorn scheme
The Anstead to Runcorn scheme connects the Mount Crosby Water Treatment Plant to Green Hill and Rocklea to Kuraby schemes. The scheme includes twin 1350 mm mains crossing the Brisbane River, dual mains through Darra and the Learoyd Road pump station. The scheme consists of
37%
63%
Planned maintenance costs
Unplanned maintenance costs
$5.4/ML
$3.2/ML

SINCLAIR KNIGHT MERZ PAGE 99
approximately 24.4 km of trunk main, with diameters ranging between 900 mm and 1650 mm, and transports approximately 23,574 ML/year.
10.2.1. LinkWater metrics
For the Anstead to Runcorn scheme no information was provided on FTEs allocated to the scheme. An overview of the information provided for the Anstead to Runcorn scheme is outlined below in Table 67.
Table 67 Anstead to Runcorn scheme information
Scheme Length
(km)
Diameter range (mm)
Water transported
(ML)
Average age
Planned maintenance
costs ($)
Unplanned maintenance
costs ($)
Asset value ($)
Anstead to Runcorn
24.4 900-1650 23,574 22 1,841 8,700 91,653,290
Metrics developed for Anstead to Runcorn scheme are outlined below in Table 68.
Table 68 Anstead to Runcorn scheme metrics
Metric Value Unit
Asset value/km linear pipeline 3,756,282.37 $/km Asset value/ML water transported 3,887.83 $/ML FTE/km linear pipeline NA FTE/km FTE/ML water transported NA FTE/ML Planned maintenance costs/km linear pipeline 75.45 $/km Planned maintenance costs/ML water transported 0.078 $/ML Planned maintenance costs/Asset value 0.000020 Ratio Unplanned maintenance costs/km linear pipeline 356.56 $/km Unplanned maintenance costs/ML water transported 0.37 $/ML Unplanned maintenance costs/Asset value 0.000095 Ratio Total maintenance costs/km linear pipeline 432.01 $/km Total maintenance costs/ML water transported 0.45 $/ML Total maintenance costs/Asset value 0.00012 Ratio Planned maintenance costs/Unplanned maintenance costs 0.21 Ratio (Total maintenance costs/Age)/km linear pipeline 19.64 $/km (Total maintenance costs/Age)/ML water transported 0.020 $/ML As LinkWater does not allocate corporate overhead costs to assets, a breakdown of expenditure can only be determined for operational expenditure. This is presented below in Figure 42. The figure indicates that unplanned maintenance costs associated with the scheme accounts for the largest portion of expenditure.
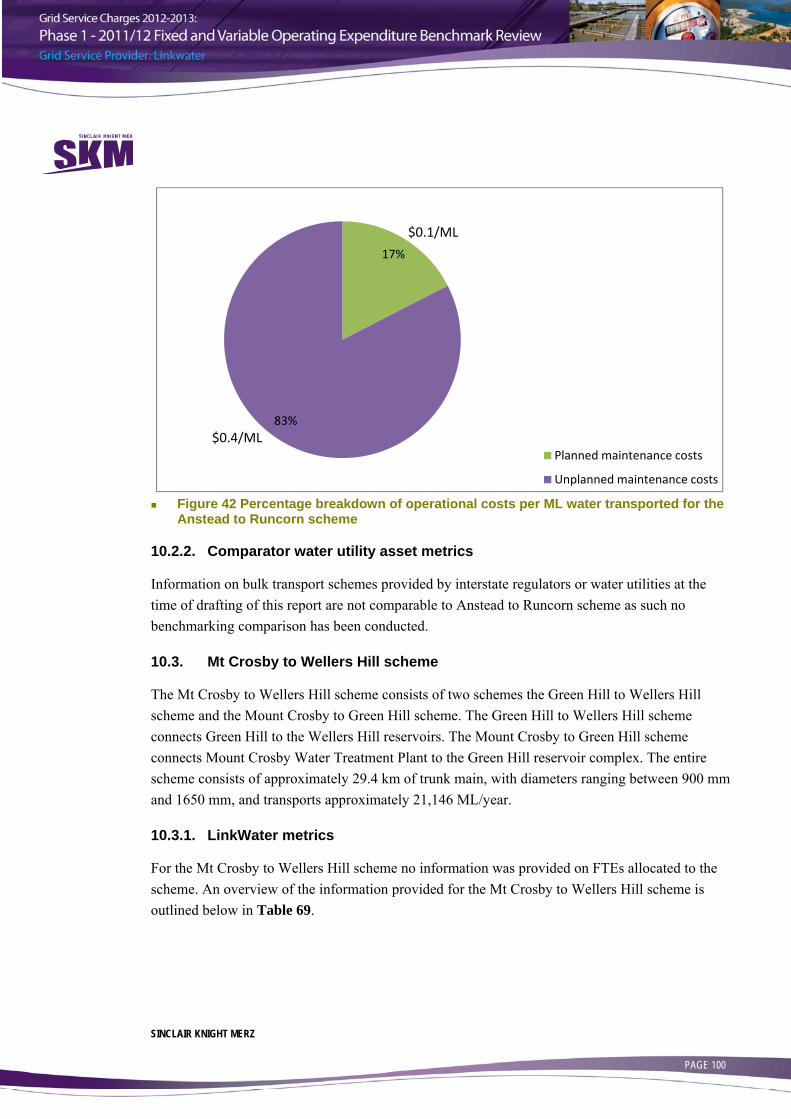
SINCLAIR KNIGHT MERZ PAGE 100
Figure 42 Percentage breakdown of operational costs per ML water transported for the
Anstead to Runcorn scheme
10.2.2. Comparator water utility asset metrics
Information on bulk transport schemes provided by interstate regulators or water utilities at the time of drafting of this report are not comparable to Anstead to Runcorn scheme as such no benchmarking comparison has been conducted.
10.3. Mt Crosby to Wellers Hill scheme
The Mt Crosby to Wellers Hill scheme consists of two schemes the Green Hill to Wellers Hill scheme and the Mount Crosby to Green Hill scheme. The Green Hill to Wellers Hill scheme connects Green Hill to the Wellers Hill reservoirs. The Mount Crosby to Green Hill scheme connects Mount Crosby Water Treatment Plant to the Green Hill reservoir complex. The entire scheme consists of approximately 29.4 km of trunk main, with diameters ranging between 900 mm and 1650 mm, and transports approximately 21,146 ML/year.
10.3.1. LinkWater metrics
For the Mt Crosby to Wellers Hill scheme no information was provided on FTEs allocated to the scheme. An overview of the information provided for the Mt Crosby to Wellers Hill scheme is outlined below in Table 69.
17%
83%
Planned maintenance costs
Unplanned maintenance costs
$0.1/ML
$0.4/ML

SINCLAIR KNIGHT MERZ PAGE 101
Table 69 Mt Crosby to Wellers Hill scheme information
Scheme Length
(km)
Diameter range (mm)
Water transported
(ML)
Average age
Planned maintenance
costs ($)
Unplanned maintenance
costs ($)
Asset value ($)
Mt Crosby to Wellers Hill
29.4 900-1650 21,146 52 84,485 8,700 96,566,436
Metrics developed for Mt Crosby to Wellers Hill scheme are outlined below in Table 70.
Table 70 Mt Crosby to Wellers Hill scheme metrics
Metric Value Unit
Asset value/km linear pipeline 3,284,572.65 $/km Asset value/ML water transported 4,566.55 $/ML FTE/km linear pipeline NA FTE/km FTE/ML water transported NA FTE/ML Planned maintenance costs/km linear pipeline 2,873.64 $/km Planned maintenance costs/ML water transported 4.00 $/ML Planned maintenance costs/Asset value 0.00087 Ratio Unplanned maintenance costs/km linear pipeline 295.92 $/km Unplanned maintenance costs/ML water transported 0.41 $/ML Unplanned maintenance costs/Asset value 0.00009 Ratio Total maintenance costs/km linear pipeline 3,169.56 $/km Total maintenance costs/ML water transported 4.41 $/ML Total maintenance costs/Asset value 0.00096 Ratio Planned maintenance costs/Unplanned maintenance costs 9.71 Ratio (Total maintenance costs/Age)/km linear pipeline 60.95 $/km (Total maintenance costs/Age)/ML water transported 0.085 $/ML A breakdown of expenditure within the asset grouping can only be determined for operational expenditure as LinkWater does not allocate corporate costs. This is presented below in Figure 43. The figure indicates that planned maintenance costs associated with the scheme accounts for the largest portion of expenditure.
The ratio of planned maintenance cost to unplanned maintenance cost indicates that 10 of all maintenance costs are as a result of a failure or significant deterioration of an item that results in maintenance being undertaken that has not been scheduled. The relatively low portion of costs associate with unplanned maintenance indicates that the planned maintenance activities are effective.
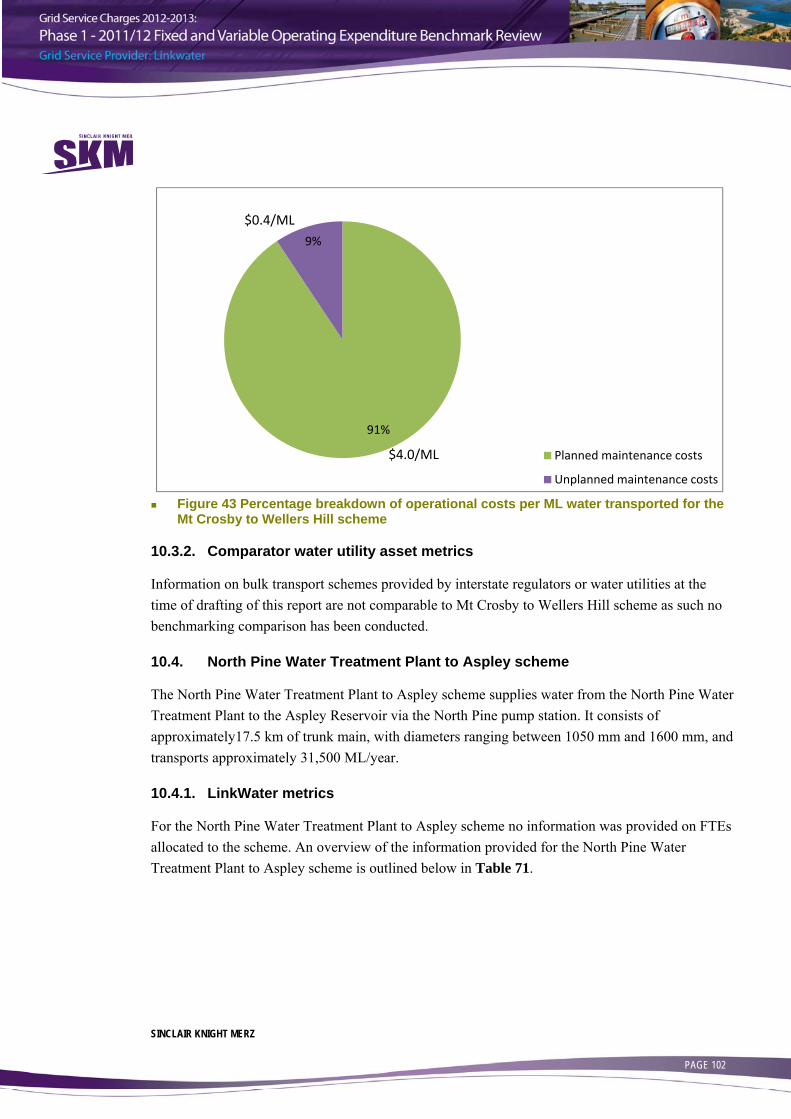
SINCLAIR KNIGHT MERZ PAGE 102
Figure 43 Percentage breakdown of operational costs per ML water transported for the
Mt Crosby to Wellers Hill scheme
10.3.2. Comparator water utility asset metrics
Information on bulk transport schemes provided by interstate regulators or water utilities at the time of drafting of this report are not comparable to Mt Crosby to Wellers Hill scheme as such no benchmarking comparison has been conducted.
10.4. North Pine Water Treatment Plant to Aspley scheme
The North Pine Water Treatment Plant to Aspley scheme supplies water from the North Pine Water Treatment Plant to the Aspley Reservoir via the North Pine pump station. It consists of approximately17.5 km of trunk main, with diameters ranging between 1050 mm and 1600 mm, and transports approximately 31,500 ML/year.
10.4.1. LinkWater metrics
For the North Pine Water Treatment Plant to Aspley scheme no information was provided on FTEs allocated to the scheme. An overview of the information provided for the North Pine Water Treatment Plant to Aspley scheme is outlined below in Table 71.
91%
9%
Planned maintenance costs
Unplanned maintenance costs
$0.4/ML
$4.0/ML

SINCLAIR KNIGHT MERZ PAGE 103
Table 71 North Pine Water Treatment Plant to Aspley scheme information
Scheme Length
(km)
Diameter range (mm)
Water transported
(ML)
Average age
Planned maintenance
costs ($)
Unplanned maintenance
costs ($)
Asset value ($)
North Pine WTP to Aspley
17.5 1050-1600 31,500 41 12,890 16,180 34,526,966
Metrics developed for North Pine Water Treatment Plant to Aspley scheme are outlined below in Table 72.
Table 72 North Pine Water Treatment Plant to Aspley scheme metrics
Metric Value Unit
Asset value/km linear pipeline 1,972,969.46 $/km Asset value/ML water transported 1,096.09 $/ML FTE/km linear pipeline NA FTE/km FTE/ML water transported NA FTE/ML Planned maintenance costs/km linear pipeline 736.57 $/km Planned maintenance costs/ML water transported 0.41 $/ML Planned maintenance costs/Asset value 0.00037 Ratio Unplanned maintenance costs/km linear pipeline 924.57 $/km Unplanned maintenance costs/ML water transported 0.51 $/ML Unplanned maintenance costs/Asset value 0.00047 Ratio Total maintenance costs/km linear pipeline 1,661.14 $/km Total maintenance costs/ML water transported 0.92 $/ML Total maintenance costs/Asset value 0.00084 Ratio Planned maintenance costs/Unplanned maintenance costs 0.80 Ratio (Total maintenance costs/Age)/km linear pipeline 40.52 $/km (Total maintenance costs/Age)/ML water transported 0.023 $/ML As LinkWater does not allocate corporate overhead costs to assets, a breakdown of expenditure can only be determined for operational expenditure. This is presented below in Figure 44. The figure indicates that unplanned maintenance costs associated with the scheme are higher than planned maintenance costs. This suggests that planned maintenance activities are not as effective as may be expected for an efficient operator.
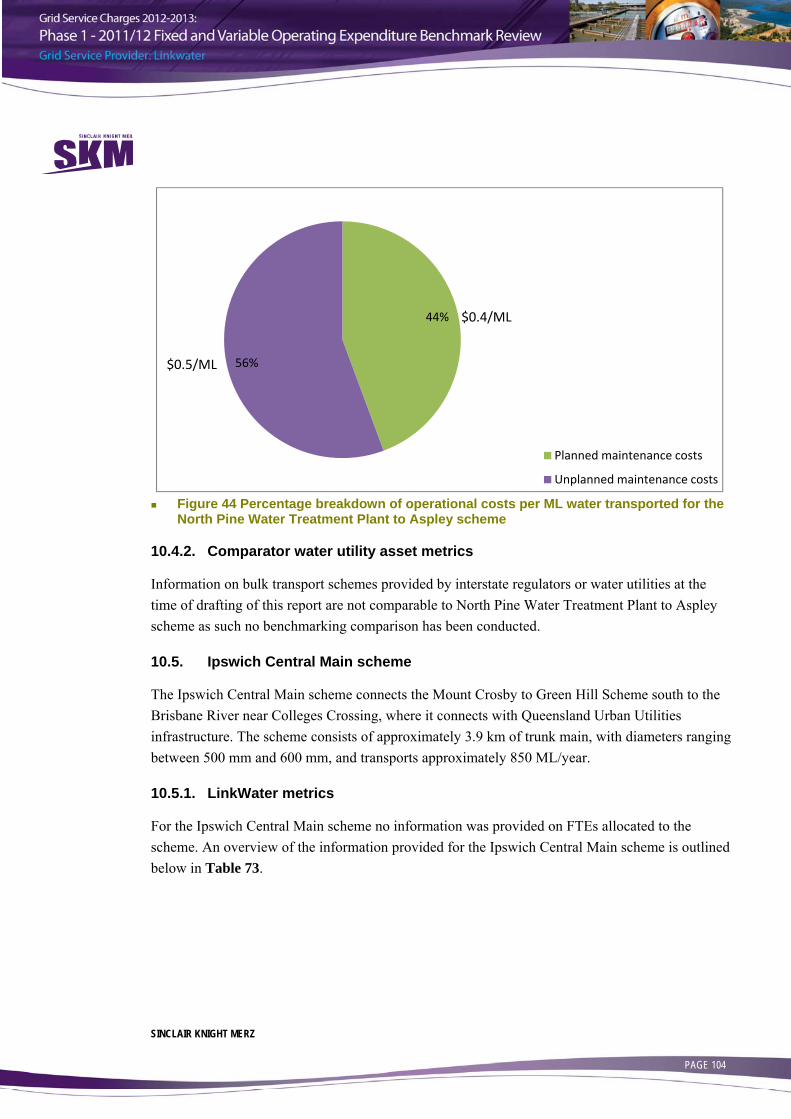
SINCLAIR KNIGHT MERZ PAGE 104
Figure 44 Percentage breakdown of operational costs per ML water transported for the
North Pine Water Treatment Plant to Aspley scheme
10.4.2. Comparator water utility asset metrics
Information on bulk transport schemes provided by interstate regulators or water utilities at the time of drafting of this report are not comparable to North Pine Water Treatment Plant to Aspley scheme as such no benchmarking comparison has been conducted.
10.5. Ipswich Central Main scheme
The Ipswich Central Main scheme connects the Mount Crosby to Green Hill Scheme south to the Brisbane River near Colleges Crossing, where it connects with Queensland Urban Utilities infrastructure. The scheme consists of approximately 3.9 km of trunk main, with diameters ranging between 500 mm and 600 mm, and transports approximately 850 ML/year.
10.5.1. LinkWater metrics
For the Ipswich Central Main scheme no information was provided on FTEs allocated to the scheme. An overview of the information provided for the Ipswich Central Main scheme is outlined below in Table 73.
44%
56%
Planned maintenance costs
Unplanned maintenance costs
$0.5/ML
$0.4/ML

SINCLAIR KNIGHT MERZ PAGE 105
Table 73 Ipswich Central Main scheme information
Scheme Length
(km)
Diameter range (mm)
Water transported
(ML)
Average age
Planned maintenance
costs ($)
Unplanned maintenance
costs ($)
Asset value ($)
Ipswich Central Main
3.9 500-600 850 66 3,688 13,090 2,213,056
Metrics developed for Ipswich Central Main scheme are outlined below in Table 74.
Table 74 Ipswich Central Main scheme metrics
Metric Value Unit
Asset value/km linear pipeline 567,450.14 $/km Asset value/ML water transported 2,603.59 $/ML FTE/km linear pipeline NA FTE/km FTE/ML water transported NA FTE/ML Planned maintenance costs/km linear pipeline 945.64 $/km Planned maintenance costs/ML water transported 4.34 $/ML Planned maintenance costs/Asset value 0.0017 Ratio Unplanned maintenance costs/km linear pipeline 3,356.41 $/km Unplanned maintenance costs/ML water transported 15.40 $/ML Unplanned maintenance costs/Asset value 0.0059 Ratio Total maintenance costs/km linear pipeline 4,302.05 $/km Total maintenance costs/ML water transported 19.74 $/ML Total maintenance costs/Asset value 0.0076 Ratio Planned maintenance costs/Unplanned maintenance costs 0.28 Ratio (Total maintenance costs/Age)/km linear pipeline 65.18 $/km (Total maintenance costs/Age)/ML water transported 0.30 $/ML A breakdown of expenditure within the asset grouping can only be determined for operational expenditure as LinkWater does not allocate corporate costs. This is presented below in Figure 45. The figure indicates that the unplanned maintenance costs associated with the scheme accounts for the largest portion of expenditure. SKM considers that the scheduled maintenance plan is not performing as expected or that a single incident has caused the fairly high unplanned cost to incur.

SINCLAIR KNIGHT MERZ PAGE 106
Figure 45 Percentage breakdown of operational costs per ML water transported for the
Ipswich Central Main scheme
10.5.2. Comparator water utility asset metrics
Information on bulk transport schemes provided by interstate regulators or water utilities at the time of drafting of this report are not comparable to Ipswich Central Main scheme as such no benchmarking comparison has been conducted.
10.6. Tarrant Drive to Elanora scheme
The Tarrant Drive to Elanora scheme connects to the Mudgeeraba Supply Main scheme near Tarrant Drive and runs in a south-east direction to Elanora break of head tank. It consists of approximately 12.6 km of trunk main, with diameters ranging between 600 mm and 960 mm, and transports approximately 21,007 ML/year.
10.6.1. LinkWater metrics
For the Tarrant Drive to Elanora scheme no information was provided on FTEs allocated to the scheme or planned and unplanned maintenance costs. An overview of the information provided for the Tarrant Drive to Elanora scheme is outlined below in Table 75.
22%
78%
Planned maintenance costs
Unplanned maintenance costs
$15.4/ML
$4.3/ML

SINCLAIR KNIGHT MERZ PAGE 107
Table 75 Tarrant Drive to Elanora scheme information
Scheme Length
(km)
Diameter range (mm)
Water transported
(ML)
Average age
Planned maintenance
costs ($)
Unplanned maintenance
costs ($)
Asset value ($)
Tarrant Drive to Elanora
12.6 600-960 21,007 19 - - 9,235,776
Metrics developed for Tarrant Drive to Elanora scheme are outlined below in Table 76.
Table 76 Tarrant Drive to Elanora scheme metrics
Metric Value Unit
Asset value/km linear pipeline 732,998.13 $/km Asset value/ML water transported 439.65 $/ML FTE/km linear pipeline NA FTE/km FTE/ML water transported NA FTE/ML Planned maintenance costs/km linear pipeline NA $/km Planned maintenance costs/ML water transported NA $/ML Planned maintenance costs/Asset value NA Ratio Unplanned maintenance costs/km linear pipeline NA $/km Unplanned maintenance costs/ML water transported NA $/ML Unplanned maintenance costs/Asset value NA Ratio Total maintenance costs/km linear pipeline NA $/km Total maintenance costs/ML water transported NA $/ML Total maintenance costs/Asset value NA Ratio Planned maintenance costs/Unplanned maintenance costs NA Ratio (Total maintenance costs/Age)/km linear pipeline NA $/km (Total maintenance costs/Age)/ML water transported NA $/ML 10.6.2. Comparator water utility asset metrics
Information on bulk transport schemes provided by interstate regulators or water utilities at the time of drafting of this report are not comparable to Tarrant Drive to Elanora scheme.
10.6.3. Benchmark comparison and discussion
At the time of development of the draft report, the benchmark information provided is not comparable to Tarrant Drive to Elanora scheme; as such no benchmarking comparison has been conducted.
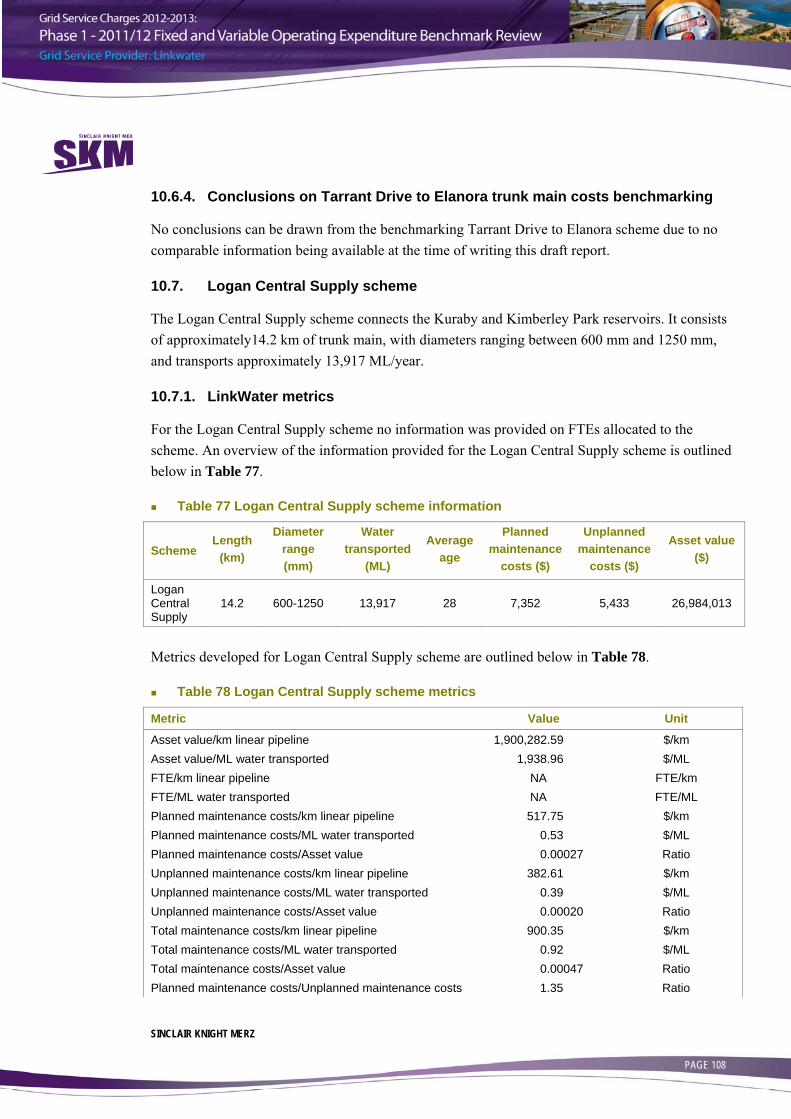
SINCLAIR KNIGHT MERZ PAGE 108
10.6.4. Conclusions on Tarrant Drive to Elanora trunk main costs benchmarking
No conclusions can be drawn from the benchmarking Tarrant Drive to Elanora scheme due to no comparable information being available at the time of writing this draft report.
10.7. Logan Central Supply scheme
The Logan Central Supply scheme connects the Kuraby and Kimberley Park reservoirs. It consists of approximately14.2 km of trunk main, with diameters ranging between 600 mm and 1250 mm, and transports approximately 13,917 ML/year.
10.7.1. LinkWater metrics
For the Logan Central Supply scheme no information was provided on FTEs allocated to the scheme. An overview of the information provided for the Logan Central Supply scheme is outlined below in Table 77.
Table 77 Logan Central Supply scheme information
Scheme Length
(km)
Diameter range (mm)
Water transported
(ML)
Average age
Planned maintenance
costs ($)
Unplanned maintenance
costs ($)
Asset value ($)
Logan Central Supply
14.2 600-1250 13,917 28 7,352 5,433 26,984,013
Metrics developed for Logan Central Supply scheme are outlined below in Table 78.
Table 78 Logan Central Supply scheme metrics
Metric Value Unit
Asset value/km linear pipeline 1,900,282.59 $/km Asset value/ML water transported 1,938.96 $/ML FTE/km linear pipeline NA FTE/km FTE/ML water transported NA FTE/ML Planned maintenance costs/km linear pipeline 517.75 $/km Planned maintenance costs/ML water transported 0.53 $/ML Planned maintenance costs/Asset value 0.00027 Ratio Unplanned maintenance costs/km linear pipeline 382.61 $/km Unplanned maintenance costs/ML water transported 0.39 $/ML Unplanned maintenance costs/Asset value 0.00020 Ratio Total maintenance costs/km linear pipeline 900.35 $/km Total maintenance costs/ML water transported 0.92 $/ML Total maintenance costs/Asset value 0.00047 Ratio Planned maintenance costs/Unplanned maintenance costs 1.35 Ratio

SINCLAIR KNIGHT MERZ PAGE 109
Metric Value Unit
(Total maintenance costs/Age)/km linear pipeline 32.16 $/km (Total maintenance costs/Age)/ML water transported 0.033 $/ML As LinkWater does not allocate corporate overhead costs to assets, a breakdown of expenditure can only be determined for operational expenditure. This is presented below in Figure 46. The figure indicates that planned and unplanned maintenance costs associated with the scheme accounts are fairly equal suggesting that planned maintenance activities are not as effective as may be expected of an efficient operator.
Figure 46 Percentage breakdown of operational costs per ML water transported for the
Logan Central Supply scheme
10.7.2. Comparator water utility asset metrics
Information on bulk transport schemes provided by interstate regulators or water utilities at the time of drafting of this report are not comparable to Logan Central Supply scheme as such no benchmarking comparison has been conducted.
10.8. Narangba to North Pine Water Treatment Plant scheme
This Narangba to North Pine Water Treatment Plant scheme transports water between the Narangba Reservoirs and the North Pine pump station. The scheme consists of approximately 18 km of trunk main, with approximately 9 km at 750 mm diameter and approximately 9 km at 500 mm diameter, and transports approximately 2,600 ML/year.
58%
42%
Planned maintenance costs
Unplanned maintenance costs
$0.5/ML
$0.4/ML

SINCLAIR KNIGHT MERZ PAGE 110
10.8.1. LinkWater metrics
For the Narangba to North Pine Water Treatment Plant scheme no information was provided on FTEs allocated to the scheme. An overview of the information provided for the Narangba to North Pine Water Treatment Plant scheme is outlined below in Table 79.
Table 79 Narangba to North Pine Water Treatment Plant scheme information
Scheme Length
(km)
Diameter range (mm)
Water transported
(ML)
Average age
Planned maintenance
costs ($)
Unplanned maintenance
costs ($)
Asset value ($)
Narangba to North Pine WTP
18.0 500-750 2,600 23 18,416 18,317 95,534,902
Metrics developed for Narangba to North Pine Water Treatment Plant scheme are outlined below in Table 80.
Table 80 Narangba to North Pine Water Treatment Plant scheme metrics
Metric Value Unit
Asset value/km linear pipeline 5,307,494.55 $/km Asset value/ML water transported 36,744.19 $/ML FTE/km linear pipeline NA FTE/km FTE/ML water transported NA FTE/ML Planned maintenance costs/km linear pipeline 1,023.11 $/km Planned maintenance costs/ML water transported 7.08 $/ML Planned maintenance costs/Asset value 0.00019 Ratio Unplanned maintenance costs/km linear pipeline 1,017.61 $/km Unplanned maintenance costs/ML water transported 7.05 $/ML Unplanned maintenance costs/Asset value 0.00019 Ratio Total maintenance costs/km linear pipeline 2,040.72 $/km Total maintenance costs/ML water transported 14.13 $/ML Total maintenance costs/Asset value 0.00038 Ratio Planned maintenance costs/Unplanned maintenance costs 1.01 Ratio (Total maintenance costs/Age)/km linear pipeline 88.73 $/km (Total maintenance costs/Age)/ML water transported 0.61 $/ML A breakdown of expenditure within the asset grouping can only be determined for operational expenditure as LinkWater does not allocate corporate costs. This is presented below in Figure 47. The figure indicates that planned and unplanned maintenance costs associated with the scheme accounts are equal suggesting that planned maintenance activities are not as effective as may be expected of an efficient operator.

SINCLAIR KNIGHT MERZ PAGE 111
Figure 47 Percentage breakdown of operational costs per ML water transported for the
Narangba to North Pine Water Treatment Plant scheme
10.8.2. Comparator water utility asset metrics
Information on bulk transport schemes provided by interstate regulators or water utilities at the time of drafting of this report are not comparable to Narangba to North Pine Water Treatment Plant scheme as such no benchmarking comparison has been conducted.
10.9. Heinemann Rd to Alex Hills trunk main
The Heinemann Road to Alex Hills scheme connects the Heinemann Road Reservoirs to Alex Hills Reservoirs and facilitates bidirectional flow and supply to Mount Cotton Reservoir. The scheme consists of approximately 12 km of trunk main, with diameter ranging between 300 mm and 450 mm diameter, and transports approximately 1,800 ML/year.
10.9.1. LinkWater metrics
For the Heinemann Road to Alex Hills scheme no information was provided on FTEs allocated to the scheme or planned and unplanned maintenance costs. An overview of the information provided for the Heinemann Road to Alex Hills scheme is outlined below in Table 81.
50%50%
Planned maintenance costs
Unplanned maintenance costs
$7.0/ML $7.1/ML

SINCLAIR KNIGHT MERZ PAGE 112
Table 81 Heinemann Road to Alex Hills scheme information
Scheme Length
(km)
Diameter range (mm)
Water transported
(ML)
Average age
Planned maintenance
costs ($)
Unplanned maintenance
costs ($)
Asset value ($)
Heinemann Road to Alex Hills
12.0 300-450 1,800 33 NA NA 10,029,226
Metrics developed for Heinemann Road to Alex Hills scheme are outlined below in Table 82.
Table 82 Heinemann Road to Alex Hills scheme metrics
Metric Value Unit
Asset value/km linear pipeline 835,768.87 $/km Asset value/ML water transported 5,571.79 $/ML FTE/km linear pipeline NA FTE/km FTE/ML water transported NA FTE/ML Planned maintenance costs/km linear pipeline NA $/km Planned maintenance costs/ML water transported NA $/ML Planned maintenance costs/Asset value NA Ratio Unplanned maintenance costs/km linear pipeline NA $/km Unplanned maintenance costs/ML water transported NA $/ML Unplanned maintenance costs/Asset value NA Ratio Total maintenance costs/km linear pipeline NA $/km Total maintenance costs/ML water transported NA $/ML Total maintenance costs/Asset value NA Ratio Planned maintenance costs/Unplanned maintenance costs NA Ratio (Total maintenance costs/Age)/km linear pipeline NA $/km (Total maintenance costs/Age)/ML water transported NA $/ML 10.9.2. Comparator water utility asset metrics
Information to develop comparator water utility metrics for specific assets has been provided by the Office of the Tasmanian Economic Regulator for Ben Lomond Water for two bulk water schemes, West Tamar and North Esk. The West Tamar scheme consists of 46 km of pipeline with diameters ranging between 150 mm and 450 mm. The North Esk scheme consists of 108 km of pipeline with diameters ranging between 150 mm and 840 mm (ie comparable to the diameter of the trunk mains for LinkWater). The information provided on the West Tamar and North Esk bulk transmission schemes is limited to a relatively high level, as outlined below in Table 83.

SINCLAIR KNIGHT MERZ PAGE 113
Table 83 West Tamar Pipeline and North Esk schemes information
Scheme Length (km)
Diameter range (mm)
Water transported
(ML) FTE
Total OPEX
($) Overhead cost ($)
Asset value ($)
West Tamar 46 150-450 2,771 1.5 NA 141,185 7,225,000 North Esk 108 100-840 6,732 1.5 NA 491,266 25,140,000
The limited data provided restricts the metrics which can be developed and their comparability to the metrics developed for Heinemann Road to Alex Hills scheme. For the schemes only overhead costs were provided, this indicates that Ben Lomond Water does not allocate operating costs to the schemes. The metrics developed for the plants are outlined below in Table 84.
Table 84 West Tamar Pipeline and North Esk schemes metrics
Metric West Tamar North Esk Unit
Asset value/km linear pipeline 158,217.45 233,627.92 $/km Asset value/ML water transported 2,607.36 3,734.40 $/ML FTE/km linear pipeline 0.033 0.014 FTE/km FTE/ML water transported 0.00054 0.00022 FTE/ML Overhead costs/km linear pipeline 3,091.76 4,565.37 $/km Overhead costs/ML water transported 50.95 72.97 $/ML Overhead costs/Asset value 0.020 0.020 Ratio 10.9.3. Benchmark comparison and discussion
At the time of development of the draft report, benchmark information had only been provided by OTTER, on behalf of Ben Lomond Water, for two comparable bulk transmission schemes, West Tamar and North Esk. The Heinemann Road to Alex Hills scheme was selected as the most comparable scheme based on the diameter of the pipes within the scheme. No comparison can be conducted with Ben Lomond Water’s bulk transmission schemes as only information on overhead costs allocated to the asset has been provided whereas LinkWater does not allocate overhead costs to assets and no information has been provided on the planned and unplanned maintenance costs for the Heinemann Road to Alex Hills scheme. As such no conclusion can be drawn from the benchmarking Heinemann Road to Alex Hills scheme due to insufficient information available to compare to at the time of writing this draft report.
10.10. Trunk main asset benchmarking summary
At the time of development of the draft report, benchmark information had only been provided by OTTER for Ben Lomond Water on two bulk transmission schemes; West Tamar and North Esk schemes. As such SKM’s benchmark comparison has been restricted to comparing Heinemann Road to Alex Hills scheme to the West Tamar and North Esk schemes. This limited information

SINCLAIR KNIGHT MERZ PAGE 114
results in no definitive conclusions being able to be drawn from the benchmarking at the time of writing this draft report. The only conclusion capable of being drawn from the analysis is that LinkWater’s scheduled maintenance activities are not as effective as would be expected when comparing non-scheduled maintenance activities to scheduled maintenance activities for a number of assets. However further analysis into the reasons for such relatively high non-scheduled maintenance costs is required before definitive conclusions may be drawn.

SINCLAIR KNIGHT MERZ PAGE 115
11. Duplication of effort – LinkWater, contractors and SEQ Water Grid Manager
This section deals with the analysis and identification of potential duplication of effort relating to fixed operating costs between LinkWater, its contractors and the Water Grid Manager.
11.1. Methodology
The functions of the utility were characterised by key words and key activities obtained from organisational charts and functional descriptions (since the assets owned and operated by LinkWater are different to those of Seqwater, the list of key activities identified for LinkWater is slightly different to that identified for Seqwater). This information when analysed provided the following list of key activities shown in Table 85. These activities were then used to compare effort across LinkWater, LinkWater alliance contractors and the SEQ Water Grid Manager in these areas.
Table 85 Key Activities and Descriptions
Key Activity Description
Administration General Administration and other support services Agency Contract Management Management of water grid participants contracts Asset Engineering Engineering support for assets Asset maintenance EMC Maintenance of electrical civil and mechanical (EMC) assets Asset maintenance I&C Maintenance & support for SCADA and instrumentation Asset Planning Capital Planning and approvals for capital investment for assets Asset planning Strategic Management of the asset portfolio with development of long term
plans Compliance Management and Regulation
Management of compliance systems and management of regulatory issues
Corporate Governance Board support, corporate legal counsel, corporate regulatory support, Office of the CEO
Corporate Knowledge Management Management of records Corporate Support General corporate support. Environment and Sustainability Environmental and sustainability services Facilities Management Building management, land management. Finance Financial management , transaction processing Fleet Supply and support for fleet Human Resource Management HR and organisational development Information and Communication Technology
Information and Communication Technology
Legal Services Legal Services Operations Pipe Networks Transport network operations Procurement Purchasing contract management

SINCLAIR KNIGHT MERZ PAGE 116
Key Activity Description
Project Delivery Delivery of capital projects Relationship management Stake holder management& public relations Risk Management Risk management, insurance Water Quality Management Water quality testing and compliance Work Place Health and Safety Organisation safety and compliance
11.2. Overview of LinkWater information
LinkWater operates maintains and develops the bulk water trunk mains facilities in South East Queensland, they provide the link between the bulk water production organisation (Seqwater) and the distribution and retail entities.
The organisation consists of the following departments as is shown in Figure 48:
Corporate Services –Human Resources, Communications, Health and Safety, Environment, Knowledge Management
Business Services - Finance, Regulation, Business Analysis
Legal Services - Legal, Governance
Project Services - Project Delivery, Project Controls
Operational Services- Infrastructure planning, Strategic Asset management, Service Delivery
LinkWater provided organisational charts showing functions down to level 4 as well as detailed functional descriptions.
Figure 48 LinkWater Organisation
11.3. Overview of Alliance Contractor information
United Utilities with Transfield Services provide Operation and Maintenance services for the LinkWater Assets. No information on the structure of United Utilities has been provided. The Operation and Maintenance Deed is the primary source of information. The interaction with LinkWater is via the Service Contracts Manager.
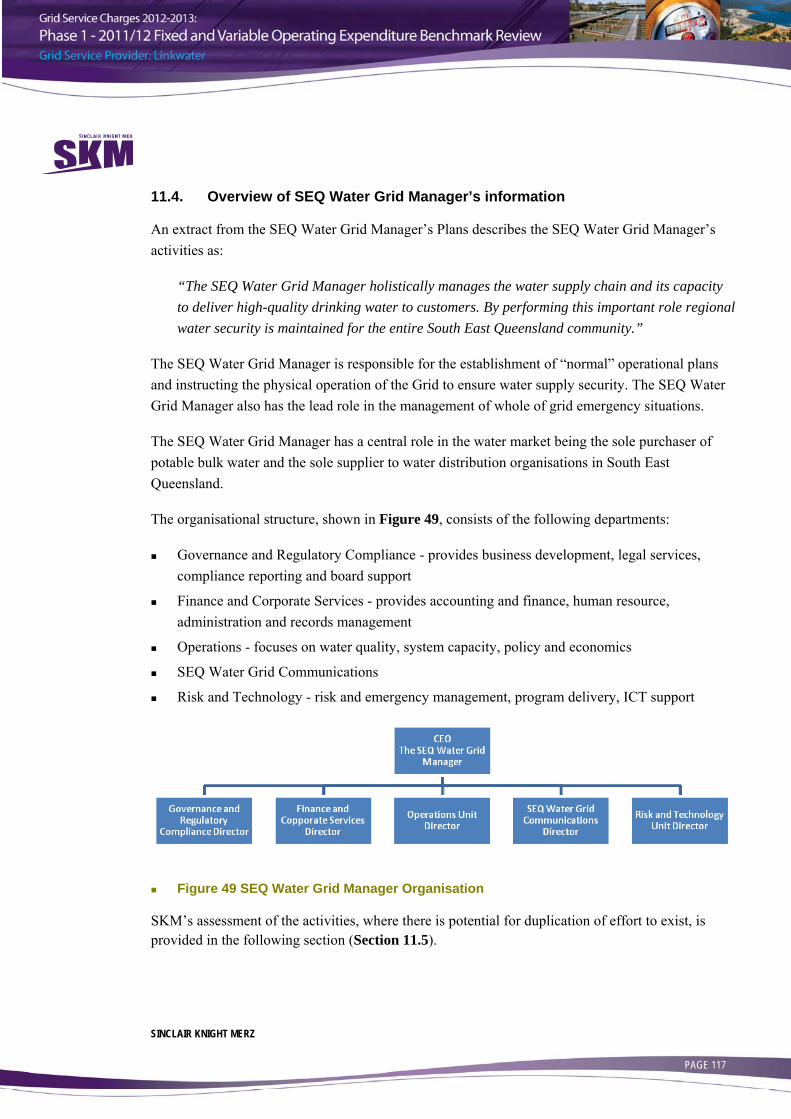
SINCLAIR KNIGHT MERZ PAGE 117
11.4. Overview of SEQ Water Grid Manager’s information
An extract from the SEQ Water Grid Manager’s Plans describes the SEQ Water Grid Manager’s activities as:
“The SEQ Water Grid Manager holistically manages the water supply chain and its capacity to deliver high-quality drinking water to customers. By performing this important role regional water security is maintained for the entire South East Queensland community.”
The SEQ Water Grid Manager is responsible for the establishment of “normal” operational plans and instructing the physical operation of the Grid to ensure water supply security. The SEQ Water Grid Manager also has the lead role in the management of whole of grid emergency situations.
The SEQ Water Grid Manager has a central role in the water market being the sole purchaser of potable bulk water and the sole supplier to water distribution organisations in South East Queensland.
The organisational structure, shown in Figure 49, consists of the following departments:
Governance and Regulatory Compliance - provides business development, legal services, compliance reporting and board support
Finance and Corporate Services - provides accounting and finance, human resource, administration and records management
Operations - focuses on water quality, system capacity, policy and economics
SEQ Water Grid Communications
Risk and Technology - risk and emergency management, program delivery, ICT support
Figure 49 SEQ Water Grid Manager Organisation
SKM’s assessment of the activities, where there is potential for duplication of effort to exist, is provided in the following section (Section 11.5).

SINCLAIR KNIGHT MERZ PAGE 118
11.5. Analysis of information and discussion on potential duplication
SKM’s assessment of the activities where potential duplication of effort exists is provided in this section. SKM has also undertaken a subjective analysis as to the level of potential duplication of effort and hence likely cost savings arising from removal of that duplication of effort. SKM has represented this assessment in the following table by using the legend ‘L’, ‘M’ and ‘H’ to represent low, medium or high levels of duplication and hence levels of potential cost savings. This same legend may also be read as a recommended order of priority for any future investigation into actual cost savings that may be achieved through removal of any duplication of effort.
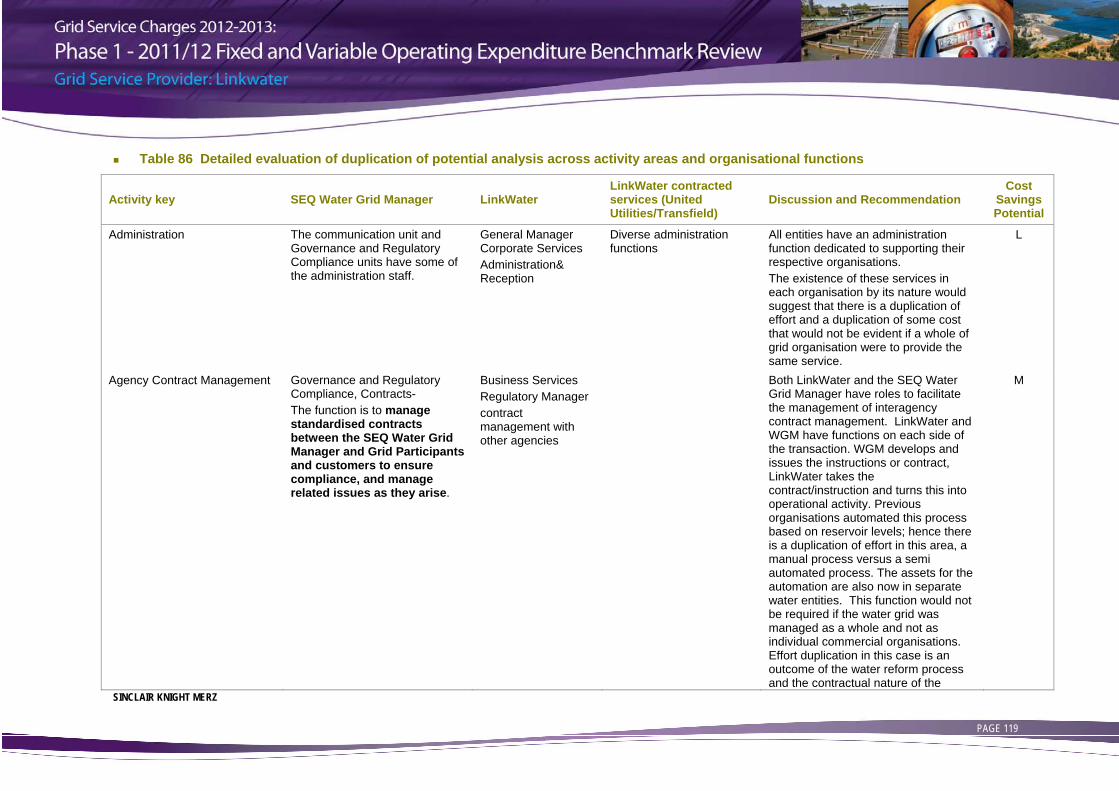
SINCLAIR KNIGHT MERZ PAGE 119
Table 86 Detailed evaluation of duplication of potential analysis across activity areas and organisational functions
Activity key SEQ Water Grid Manager LinkWater LinkWater contracted services (United Utilities/Transfield)
Discussion and Recommendation Cost
Savings Potential
Administration The communication unit and Governance and Regulatory Compliance units have some of the administration staff.
General Manager Corporate Services Administration& Reception
Diverse administration functions
All entities have an administration function dedicated to supporting their respective organisations. The existence of these services in each organisation by its nature would suggest that there is a duplication of effort and a duplication of some cost that would not be evident if a whole of grid organisation were to provide the same service.
L
Agency Contract Management Governance and Regulatory Compliance, Contracts- The function is to manage standardised contracts between the SEQ Water Grid Manager and Grid Participants and customers to ensure compliance, and manage related issues as they arise.
Business Services Regulatory Manager contract management with other agencies
Both LinkWater and the SEQ Water Grid Manager have roles to facilitate the management of interagency contract management. LinkWater and WGM have functions on each side of the transaction. WGM develops and issues the instructions or contract, LinkWater takes the contract/instruction and turns this into operational activity. Previous organisations automated this process based on reservoir levels; hence there is a duplication of effort in this area, a manual process versus a semi automated process. The assets for the automation are also now in separate water entities. This function would not be required if the water grid was managed as a whole and not as individual commercial organisations. Effort duplication in this case is an outcome of the water reform process and the contractual nature of the
M
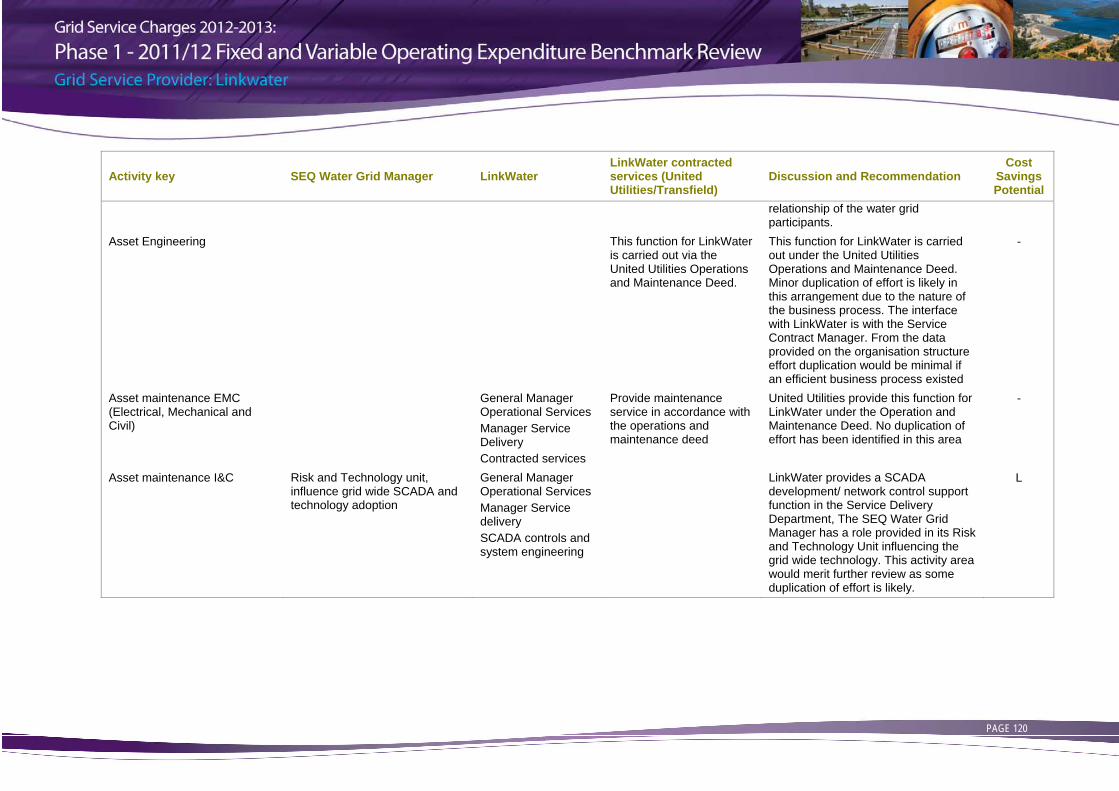
PAGE 120
Activity key SEQ Water Grid Manager LinkWater LinkWater contracted services (United Utilities/Transfield)
Discussion and Recommendation Cost
Savings Potential
relationship of the water grid participants.
Asset Engineering This function for LinkWater is carried out via the United Utilities Operations and Maintenance Deed.
This function for LinkWater is carried out under the United Utilities Operations and Maintenance Deed. Minor duplication of effort is likely in this arrangement due to the nature of the business process. The interface with LinkWater is with the Service Contract Manager. From the data provided on the organisation structure effort duplication would be minimal if an efficient business process existed
-
Asset maintenance EMC (Electrical, Mechanical and Civil)
General Manager Operational Services Manager Service Delivery Contracted services
Provide maintenance service in accordance with the operations and maintenance deed
United Utilities provide this function for LinkWater under the Operation and Maintenance Deed. No duplication of effort has been identified in this area
-
Asset maintenance I&C Risk and Technology unit, influence grid wide SCADA and technology adoption
General Manager Operational Services Manager Service delivery SCADA controls and system engineering
LinkWater provides a SCADA development/ network control support function in the Service Delivery Department, The SEQ Water Grid Manager has a role provided in its Risk and Technology Unit influencing the grid wide technology. This activity area would merit further review as some duplication of effort is likely.
L

PAGE 121
Activity key SEQ Water Grid Manager LinkWater LinkWater contracted services (United Utilities/Transfield)
Discussion and Recommendation Cost
Savings Potential
Asset Planning Capital General Manager Operational Services Infrastructure planning Environmental and statutory approvals infrastructure planning
United Utilities is required to provide proposals, scopes and pricing for “additional works “under the Operation and Maintenance deed.
LinkWater provides this activity through the infrastructure planning team in the Operational Services Department. United Utilities is required to provide proposals, scopes and pricing for additional works under the Operation and Maintenance deed. The business process for this function has the planning being done by LinkWater and the result of this planning (depending on value) would be provided to United Utilities to provide pricing. Duplication of effort is likely in this area arising from the need for LinkWater to review and verify the proposals for capital works proposed by United Utilities. As such this area merits further investigation.
M
Asset planning Strategic The SEQ Water Grid Manager provides a holistic view to strategic planning through the policy team of the Operations Department
General Manager Operational Services infrastructure planning - system modelling strategic assets management - asset capital planning
Strategic planning is provided by the Operational Services Department within the Strategic Asset Management department and also the infrastructure team for system modelling. The SEQ Water Grid Manager also provides this capability through the policy team in the operations unit. Duplication of effort is probable in this area between the SEQ Water Grid Manager and LinkWater. This area would merit further investigation.
M

PAGE 122
Activity key SEQ Water Grid Manager LinkWater LinkWater contracted services (United Utilities/Transfield)
Discussion and Recommendation Cost
Savings Potential
Compliance Management and Regulation
Governance and Regulatory Compliance, Business Performance Reporting- Manage and coordinate compliance reporting across all business units.
General Manager Business Services Regulatory Manager Regulatory reporting and compliance
Compliance and regulatory issues are the responsibility of the Business Services department, Regulation Manager for LinkWater. The SEQ Water grid Manager provides this corporate service through the Governance and Regulatory Compliance unit. The existence of these services in each organisation by its nature would suggest that there is a duplication of effort and a duplication of some cost that would not be evident if a whole of grid organisation were to provide the same service.
L
Corporate Governance The SEQ Water Grid Manager provides this functionality via the Governance and Regulatory Compliance department for board management functions and operational planning via the Operations Unit. The Risk and Technology unit provide a governance function for grid technology coordination.
General Manager Corporate Services Alliance Stake Holder Manager Alliance management for construction operations and management. Manage the government and industry relationship Government and industry liaison Manage the government and industry
This activity is delivered for LinkWater by Corporate services (Alliance Stakeholder Manager and Governance and Industry Liaison) and the Legal Services Department (Governance Manager). The SEQ Water Grid Manager has a Governance and Regulatory Compliance Department that covers Board Management, Strategic Operational Planning. The Risk and Technology Unit also provide part of this function. The existence of these services in each organisation by its nature would suggest that there is a duplication of effort and a duplication of some cost that would not be evident if a whole of grid organisation were to provide the same service.
L

PAGE 123
Activity key SEQ Water Grid Manager LinkWater LinkWater contracted services (United Utilities/Transfield)
Discussion and Recommendation Cost
Savings Potential
relationshipGeneral Manager legal Services Governance management
Corporate Knowledge Management
Finance and Corporate Services, Knowledge and Records Management
General Manager Business Services SAP business Analyst - corporate information system support General Manager Corporate Services Knowledge Manger, records QES Manager - Management Systems General Manager Operational Services- Infrastructure planning- GIS information management
For LinkWater, service is provided by Business Services -SAP Business Analyst Corporate Services – Knowledge Manager, QES Manager Operational Services – Infrastructure Planning (GIS) For the SEQ Water Grid Manager the service is provides by Financial and Corporate Services – Knowledge and Records Management The existence of these services in each organisation by its nature would suggest that there is a duplication of effort and a duplication of some cost that would not be evident if a whole of grid organisation were to provide the same service.
M

PAGE 124
Activity key SEQ Water Grid Manager LinkWater LinkWater contracted services (United Utilities/Transfield)
Discussion and Recommendation Cost
Savings Potential
Corporate Support Finance and Corporate Services-- policy, document and knowledge management, human resources, workforce planning and office administration.
General Manager Corporate Services
Finance and Corporate Services-- policy, document and knowledge management, human resources, workforce planning and office administration.
The SEQ Water Grid Manager’s Finance and Corporate Services department provides this service. LinkWater service provision is under the Corporate services department. The existence of these services in each organisation by its nature would suggest that there is a duplication of effort and a duplication of some cost that would not be evident if a whole of grid organisation were to provide the same service.
M
Environment and Sustainability General Manager Corporate Services QES Manager Environment and sustainability
LinkWater provides this within the QES Managers role of the Corporate Services department. No effort duplication has been identified for this function
-
Facilities Management General Manager Operational Services infrastructure planning Network Corridor Property – Management and administration of the Property portfolio on behalf of LinkWater.
LinkWater’s Operational Services Department provides facility management for their network corridor. No duplication of effort has been identified for this activity.
-

PAGE 125
Activity key SEQ Water Grid Manager LinkWater LinkWater contracted services (United Utilities/Transfield)
Discussion and Recommendation Cost
Savings Potential
Finance Finance and Corporate Services Providing financial support and operation, encompassing treasury, financial management, management planning, reporting and analysis.
General Manager Business Services financial control Group Accountant Tax Accountant
For LinkWater this service is within the Business Services department. The corresponding service for the SEQ Water Grid Manager is covered in the Finance and Corporate Services department. The existence of these services in each organisation by its nature would suggest that there is a duplication of effort and a duplication of some cost that would not be evident if a whole of grid organisation were to provide the same service.
M
Fleet Not Addressed in organisational information - assumed to be by via QFleet
This function has not appeared within information provided by either organisation.
-
Human Resource Management Finance and Corporate Services - Human Resources
Corporate Services General Manager Human resource Manager
Both LinkWater and the SEQ Water Grid Manager have these services within their respective corporate services groups The existence of these services in each organisation by its nature would suggest that there is a duplication of effort and a duplication of some cost that would not be evident if a whole of grid organisation were to provide the same service.
M

PAGE 126
Activity key SEQ Water Grid Manager LinkWater LinkWater contracted services (United Utilities/Transfield)
Discussion and Recommendation Cost
Savings Potential
Information and Communication Technology(ICT)
Risk and Technology unit ICT and project delivery services at both an organisational and whole-of-Grid level
General Manager Corporate Services Knowledge Manager IT project Manager IT systems Coordination
For LinkWater the ICT function is supported by Corporate Services – Knowledge Manager, IT projects and IT system coordination The SEQ Water Grid Manager’s Risk and Technology unit covers this function. The existence of these services in each organisation by its nature would suggest that there is a duplication of effort and a duplication of some cost that would not be evident if a whole of grid organisation were to provide the same service.
M
Legal Services Governance and Regulatory Compliance- Legal- lead the legal drafting and preparation of a wide range of commercial arrangements for the SEQ Water Grid Manager.
General Manager Legal Services Legal Manager
Both organisations have Legal services. The existence of these services in each organisation by its nature would suggest that there is a duplication of effort and a duplication of some cost that would not be evident if a whole of grid organisation were to provide the same service.
L
Operations Pipe Networks General Manager Operational Services Manager Service delivery Network operations Management
LinkWater has an alliance contract with United Utilities for Operation and maintenance services. This is managed by the service delivery team. No effort duplication was identified for this activity.
-
Procurement No specific functions were identified for the organisations for this activity. This activity will appear in various forms in each department or section; some
-

PAGE 127
Activity key SEQ Water Grid Manager LinkWater LinkWater contracted services (United Utilities/Transfield)
Discussion and Recommendation Cost
Savings Potential
effort duplication may become evident with further study.
Project Delivery Project Services program management Project controls Procurement Project cost control Project systems and quality Contracts
Provide Additional Services - Supply proposal, scope, time table methods and price for work on defined assets.
The Project Services Department for LinkWater provides project management, contracts management, cost control, systems and quality and procurement processes. United Utilities has within the Operations and Maintenance deed clause that require them to undertake similar project delivery activities, “Provides Additional Services”. The function of this activity indicates some overlap between LinkWater and the United Utilities contract. This is only likely to be on areas of work associated with the contract. SKM assess the effort duplication to be worthy of further investigation.
M

PAGE 128
Activity key SEQ Water Grid Manager LinkWater LinkWater contracted services (United Utilities/Transfield)
Discussion and Recommendation Cost
Savings Potential
Relationship management SEQ Water Grid Communications Unit Media-Providing an effective media relations function for SEQ Water Grid Manager. Communications-Providing SEQ Water Grid Manager branding, marketing and proactive communication activities.
General Manager Corporate Services Corporate communications Manager Community Stake holder engagement Communications
The corporate communications Manager provides communication and community and stake holder engagement services for LinkWater, A similar service is provided by the Communications unit for the SEQ Water Grid Manager. The existence of these services in each organisation by its nature would suggest that there is a duplication of effort and a duplication of some cost that would not be evident if a whole of grid organisation were to provide the same service.
M
Risk Management The SEQ Water Grid Manager has a risk focus combined with emergency management.
General Manager Operational Services Emergency operations support
Network Operations support
The SEQ Water Grid Manager has a risk focus combined with emergency management provided in the Risk and Technology unit, LinkWater has not specifically identified this function. The existence of these services in each organisation by its nature would suggest that there is a duplication of effort and a duplication of some cost that would not be evident if a whole of grid organisation were to provide the same service.
L
Water Quality Management Operations unit- Water Quality, Water Quality Monitoring and compliance
General Manager Operational Services Manager Service delivery Water quality and compliance
LinkWater’s Operational Services department delivers this function via the service delivery Manager; Also the SEQ Water Grid Manger’s Operations Unit provides a similar activity in their Water Quality Team. The existence of these services in
M

PAGE 129
Activity key SEQ Water Grid Manager LinkWater LinkWater contracted services (United Utilities/Transfield)
Discussion and Recommendation Cost
Savings Potential
each organisation by its nature would suggest that there is a duplication of effort. There is merit in investigating this area to confirm the specific nature of the activities for each organisation.
Work Place Health and Safety General Manager Corporate Services QES Manager Workplace Health and Safety
LinkWater has WPH&S obligations serviced by the QES Manager. It is expected the United Utilities would perform their duties for WPH&S within their organisation, no information has been provided to identify this function, however SKM considers that because each organisation is obliged to carry out this activity it is inevitable that there will be duplication of effort in the activity.
L

SINCLAIR KNIGHT MERZ PAGE 130
11.6. Summary and conclusions – duplication of effort analysis
A summary of the organisational duplication analysis is provided below in Table 87 below in which those areas where no appreciable duplication of effort has been identified have been omitted.
Table 87 Summary of organisational duplication of effort analysis
Activity SEQ Water Grid Manager LinkWater United Utilities &
Transfield Services Potential cost
saving
Administration L Agency Contract Management M
Asset Maintenance I&C M Asset Planning Capital M Asset Planning Strategic M
Compliance Management and Regulation
L
Corporate Governance L Corporate Knowledge Management M
Corporate Support M Finance M Human Resource Management M
Information and Communication Technology (ICT)
M
Legal Services L Project Delivery M Relationship management M
Risk Management L
Water Quality Management M
Work Place Health and Safety L
SKM has identified a number of key activities that will merit investigation to understand to what degree overlaps may exist. It could be argued that for functions of a corporate nature (finance, human resources etc) there will inevitability be some level of duplication and hence inefficiency arising from having multiple organisational support functions within the water grid. Further there would be an element of the corporate overhead costs arising from this arrangement that would be associated with the areas of functional duplication.
PAGE 131
Based on the information provided and SKM’s knowledge of the industry the following areas of activity that are undertaken by both LinkWater and the SEQ Water Grid Manager have been identified as those areas that display the highest amount of duplication of effort and hence cost savings potential of all 29 areas assessed. SKM considered these areas to be of highest priority for any future investigation to establish, definitively, the extent of duplication and any corresponding gains in efficiency and hence cost savings that would arise from removal of that duplication.
Corporate functions such as: Corporate Support; Human Resource Management; Finance exist across both organisations and contain sufficient numbers of full time equivalents as to merit further investigation as a priority area
Agency Contract Management: Effort duplication in this case is an outcome of the water reform process in that both LinkWater and the SEQ Water Grid Manager have roles to facilitate the management of interagency contracts
Asset planning with a strategic focus involves the SEQ Water Grid Manager and LinkWater. Both organisations have a very strong need for this function to ensure the appropriate delivery of the water service as a whole and to manage the assets base for that delivery
Asset maintenance I&C, SCADA systems are important to the overall management of the water network. Link Water has this service provided by staff with in the service delivery team. The Water Grid Manager also has a strong interest in the delivery of appropriate technology supported by the Risk and Technology unit. Link Water has a lead role in the SCADA protocols Project
Corporate Knowledge Management are areas that exist in both LinkWater and the Water Grid Manager and is, in part, a function of the reporting requirements of both organisations
Relationship Management: Both LinkWater and the Water Grid Manager have strong relationship management teams. A portion of the LinkWater activity is directed at informing the affected public about planned maintenance activities. The presentation of organisational attributed to the broad public audience is present in both organisations
Water Quality Management is another area where both organisations have strong teams .Both organisations have a significant need for skills in this area to manage the water quality for the network
Based on the information provided and SKM’s knowledge of the industry the following areas of activity that are undertaken by both LinkWater and LinkWater’s alliance contractors have been identified as those areas that display the highest amount of duplication of effort and hence cost savings potential of all 29 areas assessed. SKM considered these areas to be of highest priority for

PAGE 132
any future investigation to establish, definitively, the extent of duplication and any corresponding gains in efficiency and hence cost savings that would arise from removal of that duplication.
Asset planning capital: LinkWater has a strong team in the project services department, the service providers are also required by the contract to provide planning scoping and pricing services. It is understood that these services (planning scoping and pricing) are incidental to the main contracted work and relate directly to services provided under the contract and are not related to the delivery of major projects. Duplication of effort is likely to arise from the need for LinkWater to review and analyse the proposals for capital works submitted by its alliance contractors prior to approving such capital works resulting in both organisations undertaking options analysis and ranking of capital works projects
Corporate functions such as: Corporate Support; Human Resource Management; Finance exist across both organisations. The Corporate Support function contains sufficient numbers of full time equivalents as to merit further investigation as a priority area
Project delivery: the Operations and Maintenance Deed between LinkWater and United Utilities requires United Utilities to undertake similar project delivery activities to those undertaken by LinkWater’s Project Services Department

SINCLAIR KNIGHT MERZ PAGE 133
12. Summary and conclusions SKM has undertaken a review of the 2011/12 fixed and variable operating expenditure of LinkWater with the aim of benchmarking LinkWater’s key cost parameters against relevant comparator water utilities and identifying any potential duplication of effort relating to fixed operating costs between LinkWater, its contractors and the SEQ Water Grid Manager. The following section presents our conclusions from this review.
12.1. Benchmarking Methodology
Benchmarking was undertaken based on the fixed and variable operating expenditure of LinkWater for the 2011/12 period. Information provided by LinkWater was reviewed and benchmarking metrics were developed. Limited information was compiled on national comparator water utilities due to the limited time available for the organisations to respond to requests for information. Similarly, limited public domain information is available for international utilities. This restricted the comparisons that could be made between LinkWater and other similar organisations.
SKM notes that the majority of the organisations approached expressed an interest in participating in the benchmarking process and it is SKM’s opinion that if additional time were allowed for the organisations to respond and additional effort is put into progressing responses from the organisations, than a more robust benchmarking exercise will be capable of being undertaken.
The benchmarking was broken down into three sections – corporate level, asset group level and asset specific level. A number of issues were encountered during this process including availability of data and coarseness of data. Due to the limited information obtained, at the time of production of this draft report, limited conclusions can be drawn.
12.2. Corporate level benchmarking
The corporate level benchmarking undertaken has been undertaken for LinkWater as a whole. Information available for LinkWater included total expenditure, total operating costs, total variable costs and number of FTEs employed. Information collected from other national and international water utilities to be able to compare metrics included:
Total operating expenditure ($)
Water supplied (ML)
Employee costs ($)
Total revenue ($)
Number of full-time equivalents
Non-current asset value ($)

PAGE 134
Length of mains (km)
Making use of the above information the following metrics were developed for each of the national and international water utilities and the values compared to that of LinkWater:
Total operating expenditure as a proportion of total water supplied
Total operating expenditure as a proportion of non-current assets
Total employee cost as a proportion of total operating expenditure
Total operating expenditure as a proportion of total revenue
Total revenue as a proportion of total full-time equivalents
Total full-time equivalents as a proportion of non-current assets
Total water supplied as a proportion of the total full-time equivalents
Total employee cost as a proportion of the total full-time equivalents
Total operating expenditure as a proportion of mains length
The majority of the comparator utilities have a larger suite of water and wastewater services that LinkWater provides. This has been taken into consideration when comparing the various metrics developed.
The conclusion from this study is that LinkWater is efficient in organisational issues and spending, has an effective workforce and utilises its asset efficiently. However analysis of planned to unplanned maintenance expenditure ratios suggests that, for some assets, preventative maintenance activities are not as effective as would be expected from an efficient operator.
12.3. Benchmarking by Asset Grouping
Benchmarking was undertaken for reservoirs only due to no information being available on water quality facilities or pump stations as an asset group and due to the information available on bulk transmission schemes being limited and was not comparable with that provided by LinkWater. Nevertheless, benchmarking has shown that the operating costs per ML water storage capacity for the Ben Lomond Water reservoirs and the LinkWater reservoirs are very similar. However, SKM considers that the high operating cost per km of linear asset (trunk main) exhibited by LinkWater compared to the majority of the comparator utilities indicates that LinkWater is not an efficient operator in this respect.
12.4. Asset specific benchmarking
Benchmarking was again only undertaken for reservoirs due to no information being available on individual water quality facilities or pump stations and due to the information available on individual bulk transmission schemes being limited and not comparable with that provided by
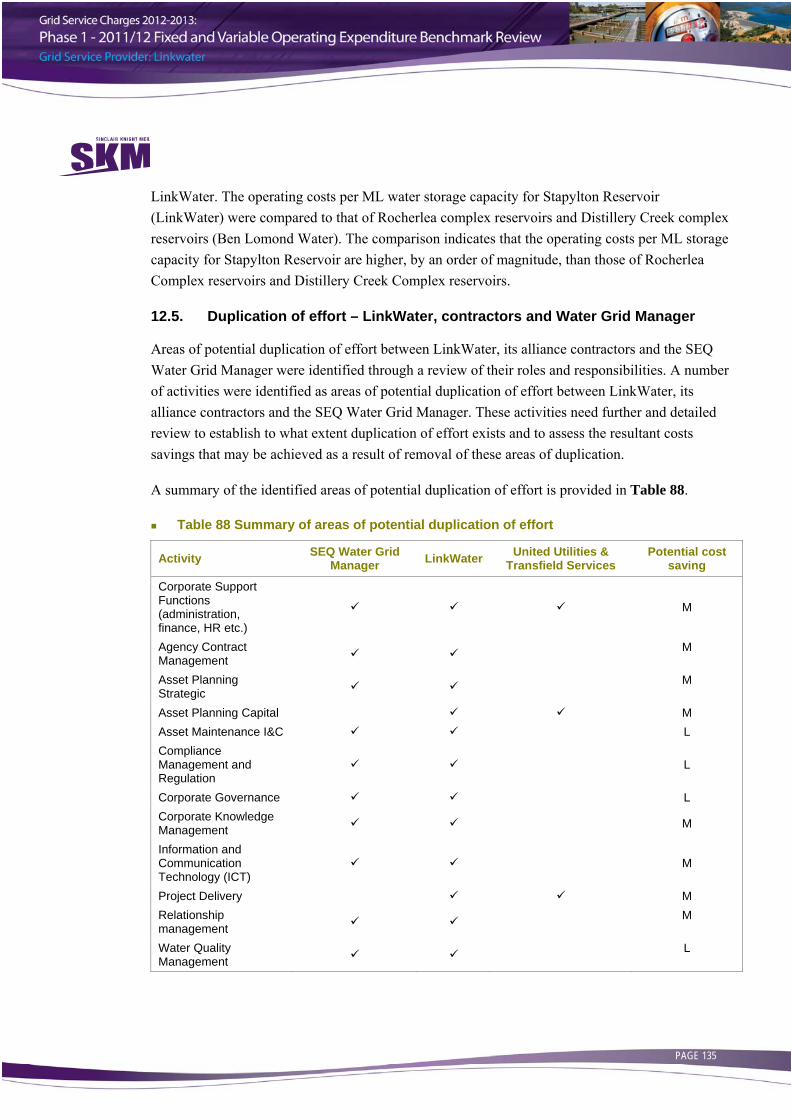
PAGE 135
LinkWater. The operating costs per ML water storage capacity for Stapylton Reservoir (LinkWater) were compared to that of Rocherlea complex reservoirs and Distillery Creek complex reservoirs (Ben Lomond Water). The comparison indicates that the operating costs per ML storage capacity for Stapylton Reservoir are higher, by an order of magnitude, than those of Rocherlea Complex reservoirs and Distillery Creek Complex reservoirs.
12.5. Duplication of effort – LinkWater, contractors and Water Grid Manager
Areas of potential duplication of effort between LinkWater, its alliance contractors and the SEQ Water Grid Manager were identified through a review of their roles and responsibilities. A number of activities were identified as areas of potential duplication of effort between LinkWater, its alliance contractors and the SEQ Water Grid Manager. These activities need further and detailed review to establish to what extent duplication of effort exists and to assess the resultant costs savings that may be achieved as a result of removal of these areas of duplication.
A summary of the identified areas of potential duplication of effort is provided in Table 88.
Table 88 Summary of areas of potential duplication of effort
Activity SEQ Water Grid Manager LinkWater United Utilities &
Transfield Services Potential cost
saving
Corporate Support Functions (administration, finance, HR etc.)
M
Agency Contract Management M
Asset Planning Strategic M
Asset Planning Capital M Asset Maintenance I&C L Compliance Management and Regulation
L
Corporate Governance L Corporate Knowledge Management M
Information and Communication Technology (ICT)
M
Project Delivery M Relationship management
M
Water Quality Management L
PAGE 136
12.6. Conclusions
SKM has conducted benchmarking of LinkWater’s 2011/12 fixed and variable operating expenditure against comparator water utilities in so far as is possible with the information available at the time of writing this draft report. The information provided by LinkWater was sufficient to develop the proposed metrics however the limited information available for comparator organisations restricted the metrics that could be developed for the benchmarking exercise. To support further studies it is recommended that an extended benchmarking study is conducted to allow the capture of relevant information from other water utilities to enable the development of relevant comparator metrics. The benchmarking undertaken, however, suggests that LinkWater’s costs are generally comparable to comparator water utilities when taking into account differences in business structure and asset specifications and that LinkWater’s costs are generally in keeping with those of an efficient operator. However, SKM considers that the high operating cost per km of linear asset (trunk main) exhibited by LinkWater compared to the majority of the comparator utilities indicates that LinkWater is not an efficient operator in this respect.
In respect to the duplication of effort, SKM has identified a number of areas that warrant further and more detailed investigation of duplication of effort, in particular in the areas of asset planning and water quality management and capital project planning.

PAGE 137
Appendix A Terms of Reference Phase 1 – 2011-12 fixed and variable operating expenditure (Opex) review
The Authority requires a detailed review of the current level of fixed operating costs (including overhead and fixed employee costs) and variable costs incurred by the GSPs. The assessment would be performed on data submitted by the bulk entities for the 2011-12 period, as well as additional data requested from the GSPs as appropriate.
The consultancy is intended to build upon the review of operating costs conducted during the 2011-12 GSC investigation. The consultancy will:
a) benchmark the GSPs against key cost parameters at relevant comparator organisations and good industry practice. Benchmark assessments may include parameters such as FTEs to water volume ratio, FTE to asset capacity ratio, maintenance to asset value ratio, operational costs to overhead costs ratio, total fixed costs to water volume ratio etc;
b) identify any duplication of effort relating to fixed operating costs between GSPs, their contractors and the WGM; and
c) identify any potential efficiency improvements and achievable operating cost (fixed and variable) savings as a result of the Seqwater-Water Secure merger on 1 July 2011.
The consultant will use a bottom up, needs-based assessment of costs on a functional level in order to understand what costs within a function are directed to which activities.
While noting that non-direct (indirect and overhead) cost categories are not standardised across the GSPs, the consultancy will review the following fixed operating cost activities:
a) Asset Management;
b) Capital Planning;
c) Engineering Services;
d) Planned and unplanned maintenance; and
e) Administration.
The consultancy will review all component costs of the above activities including internal and external (contractor’s) costs to identify potential efficiency improvements.
In order to establish the basis for an assessment of the GSP’s proposed overhead and fixed employee costs, the consultant will need to outline:
a) the services provided by the bulk entities’ head offices;
b) major overhead and fixed employee cost categories and their key cost drivers (and how they are tied into the GSP’s respective business objectives);
c) high level indicators to assess the relative efficiency of cost components using appropriate comparators, good industry practice and available benchmarking data. Examples of such

PAGE 138
indicators could include FTEs as a proportion of overhead costs, overhead costs as a percentage of total operating costs, or proprietary benchmarking tools which establish rates of efficiency; and
d) given constraints related to employee retention, how the Authority could assess the potential for efficiency gains once the GSP’s provide their projected expenditure for 2012-13. This could include quantum and timing of any potential efficiency gains.
In regard to variable costs, the consultancy should review potential savings in energy and chemical costs, within the constraints of demand forecasts defined by the Government.
The Authority’s objective is to have this phase complete by 29 February 2012.
Phase 2 – 2012-13 GSC Draft Report investigation
The Authority is required to publish a Draft Report detailing recommended Grid Service Charges for 2012-13 by 30 April 2012. The Authority requires assistance in assessing the prudency and efficiency of the GSP’s proposed capital and operating costs for 2012-13.
Phase 2 will commence following the receipt of the GSP’s information submissions on 29 February 2012, to be completed by 23 March 2012. Phase 2 is comprised of three components.
Component 1 – Prudency and Efficiency of 2012-13 forecast Operating Expenditure
The consultant must assess whether each of the GSPs’ submitted operating costs proposed for 2012-13 are prudent and efficient. The assessment of prudency and efficiency of operating expenditure will review a representative sample, to be agreed with the Authority, of each GSP’s forecast operating costs. The sample should include the top 10% of operating expenditure items by value and, preferably, at least 50% of the total operating expenditure.
In assessing prudency and efficiency, the consultant must:
a) assess whether the GSPs’ policies and procedures for operational expenditure represent good industry practice;
b) assess the standards of service adopted by each GSP and whether these standards have been approved by external agencies. The consultant should where appropriate refer to broader benchmark analysis of Phase 1;
c) assess whether the GSPs’ operating expenditure is prudent. Operating expenditure is prudent if it is required to meet the GSP’s requirements relating to:
i. its Grid Contract;
ii. the South East Queensland System Operating Plan; and
iii. production forecasts for the regulatory period are to consistent with the grid instructions forecast in the Operating Strategy (or any successor documents) and any relevant information provided to the GSPs in accordance with the system operating plan;
PAGE 139
d) assess whether the GSPs’ operating expenditure is efficient. Operating expenditure is efficient if it is undertaken in a least-cost manner over the life of the relevant assets and is consistent with relevant benchmarks. In assessing efficiency, the consultant must have regard to the conditions prevailing in relevant markets, historical trends in operating expenditure and the potential for efficiency gains or economies of scale; and
e) assess the appropriateness of any allocation methodology of overhead operating costs.
Component 2 – Prudency and Efficiency of 2011-12 estimated actual Capital Expenditure
The consultant must assess the prudency and efficiency of 2011-12 non-drought5 capital expenditure for each GSP that:
a) was not submitted to the Authority as part of GSPs’ forecast capital expenditure during the 2011-12 GSC investigation; and
b) is material, where materiality is defined as exceeding $2 million;
The Authority does not expect that this will be a large number of items, but may include some material capital expenditure to rectify damage caused by the January 2011 floods that was not included in the GSPs’ 2011-12 submissions.
The consultant must also assess the efficiency only of the 2011-12 non-drought capital expenditure for each GSP that:
a) was submitted to the Authority as part of GSPs’ forecast capital expenditure during the 2011-12 GSC investigation; and
b) differs significantly (more than 30%) from the forecast costs submitted by the GSP during the 2011-12 investigation.
Again, the Authority does not expect that this will be a large number of items. If the total number of items to be reviewed exceeds 15, the Authority will agree a representative sample with the consultant.
Component 3 – Prudency and Efficiency of 2012-13 forecast Capital Expenditure
The consultant must assess the prudency and efficiency of a representative sample of 2012-13 forecast non-drought capital expenditure for each GSP. The sample, to be agreed with the Authority, should include all capital expenditure projects exceeding $2 million in value, the top 10% of capital expenditure projects by value and at least 50% of total capital expenditure.
For any capital expenditure project that was commenced in 2011-12, but will incur expenditure during 2012-13, the consultant must take into account the Authority findings in its investigation of 2011-12 GSCs.
5 Non-drought capital expenditure refers to capital expenditure that was not required as part of the Water Regulation 2002 or the Regional Water Security Program. As a consequence, it excludes many of the largest capital expenditure projects undertaken by the GSPs, such as the Hinze Dam raising or the Northern Pipeline Interconnector Stage 2.

PAGE 140
The definition of prudency and efficiency to be adopted by the consultant are the same as those in Component 2 above.
The consultant must also assess:
a) whether the entities’ policies and procedures for forecasting capital expenditure represent good industry practice. In particular, the policies and procedures must reflect strategic development plans, integrate risk and asset management planning, corporate directives, be consistent with external drivers, and incorporated robust procurement practices;
b) whether corporate or overheads costs have been appropriately assigned to capital expenditure projects.
For the purposes of the Phase 2 review, capital expenditure is prudent if it required as a result of a legal obligation, growth in demand (consistent with the grid instructions forecast in the Operating Strategy (or any successor documents) and any relevant information provided to the GSPs in accordance with the system operating plan); renewal of existing infrastructure that is currently used and useful, or it achieves an increase in reliability or quality of supply that is explicitly endorsed or desired by the WGM.
Capital expenditure is efficient if:
a) the scope of the works (which reflects the general characteristics of the capital item) is the best means of achieving the desired outcomes after having regard to the options available, including the substitution possibilities between capex and opex and non-drought network alternatives such as demand management;
b) the standard of the works conforms with technical, design and construction requirements in legislation, industry and other standards, codes and manuals. Compatibility with existing and adjacent infrastructure is relevant as is consideration of modern engineering equivalents and technologies; and
c) the cost of the defined scope and standard of works is consistent with conditions prevailing in the markets for engineering, equipment supply and construction. The consultant must substantiate it view with references to relevant interstate and international benchmarks and information sources. For example, the source of comparable units and indexes must be given and the efficiency of costs justified. The consultant should identify the reasons for any costs higher than normal commercial levels.
Phase 3 – 2012-13 GSC Final Report investigation
Following the publication of the Authority’s Draft Report, the Authority will receive submissions from GSPs and other stakeholders. These submissions may include updated information or challenge the technical findings included in the Authority’s Draft Report.
The consultant must assist the Authority in responding to stakeholder submissions by:

PAGE 141
a) considering its Phase 2 recommendations in light of new information; and
b) responding to technical matters included in stakeholder submissions.
The extent of work required for Phase 3 will depend on the complexity of submissions received from stakeholders.
Phase 3 will commence in May 2012 after the receipt of stakeholder submissions and will be complete by mid-June 2012. More precise dates will be negotiated with the consultant as the project progresses.

PAGE 142
Appendix B LinkWater Data
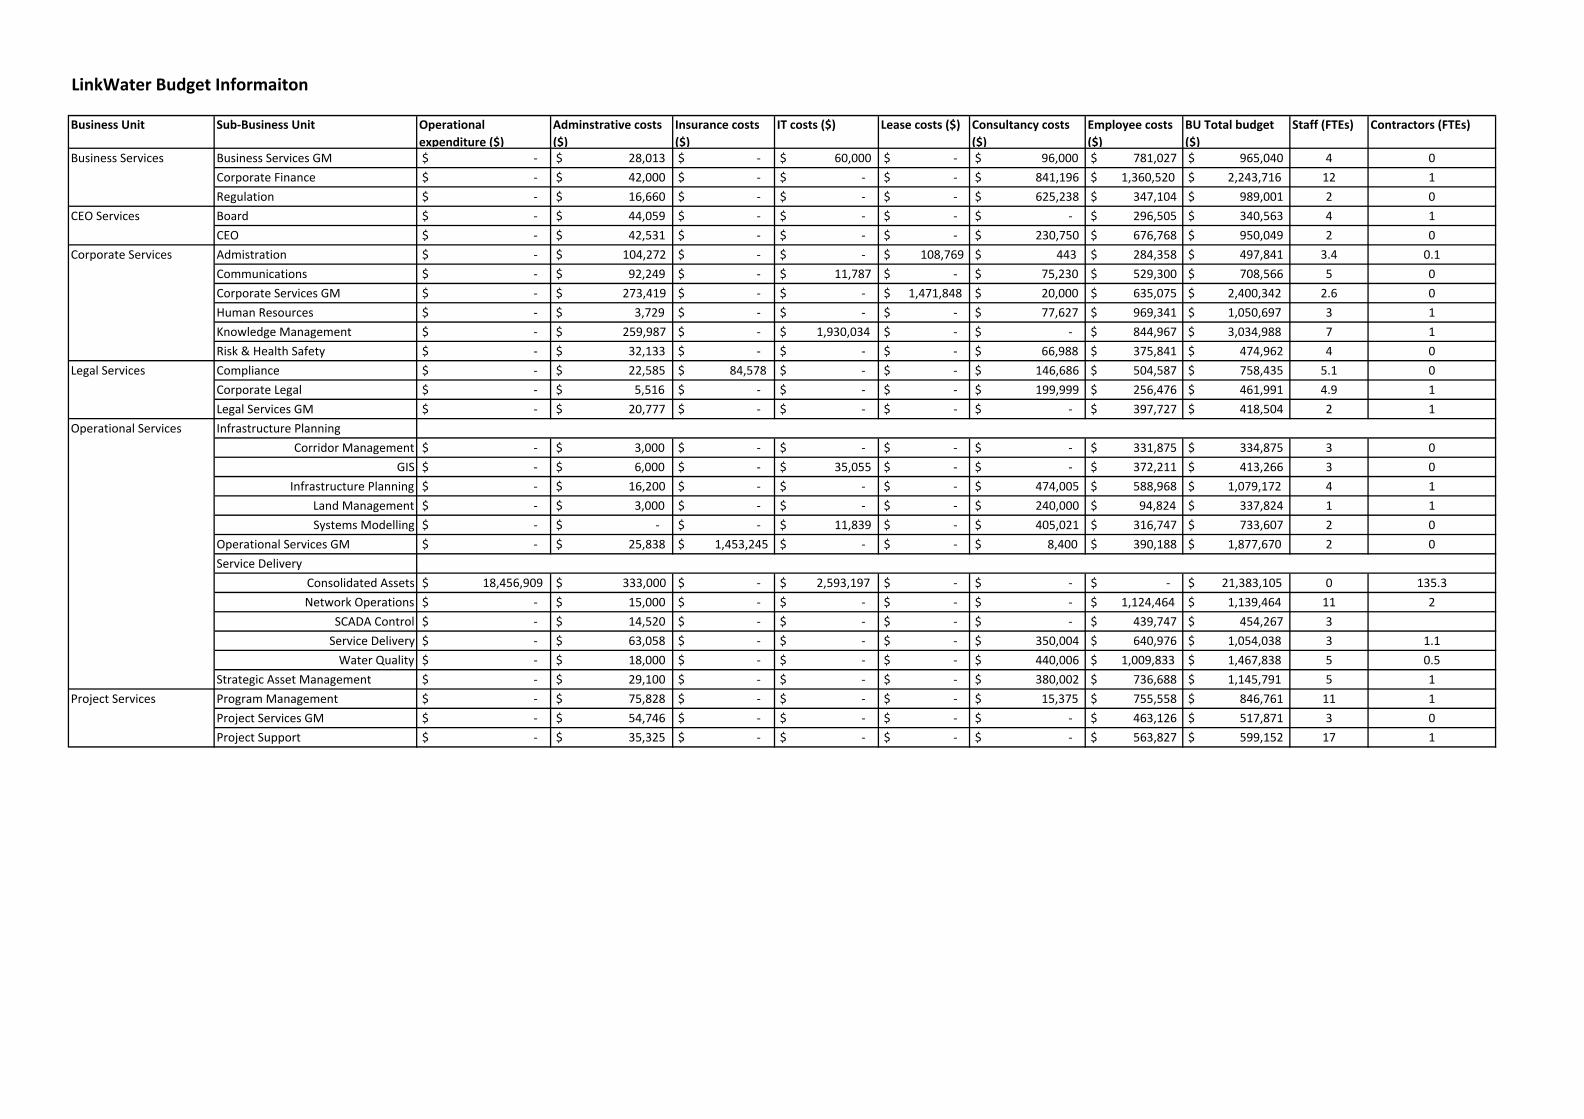
LinkWater Budget Informaiton
Business Unit Sub‐Business Unit Operational expenditure ($)
Adminstrative costs ($)
Insurance costs ($)
IT costs ($) Lease costs ($) Consultancy costs ($)
Employee costs ($)
BU Total budget ($)
Staff (FTEs) Contractors (FTEs)
Business Services Business Services GM $ ‐ $ 28,013 $ ‐ $ 60,000 $ ‐ $ 96,000 $ 781,027 $ 965,040 4 0
Corporate Finance $ ‐ $ 42,000 $ ‐ $ ‐ $ ‐ $ 841,196 $ 1,360,520 $ 2,243,716 12 1
Regulation $ ‐ $ 16,660 $ ‐ $ ‐ $ ‐ $ 625,238 $ 347,104 $ 989,001 2 0
CEO Services Board $ ‐ $ 44,059 $ ‐ $ ‐ $ ‐ $ ‐ $ 296,505 $ 340,563 4 1
CEO $ ‐ $ 42,531 $ ‐ $ ‐ $ ‐ $ 230,750 $ 676,768 $ 950,049 2 0
Corporate Services Admistration $ ‐ $ 104,272 $ ‐ $ ‐ $ 108,769 $ 443 $ 284,358 $ 497,841 3.4 0.1
Communications $ ‐ $ 92,249 $ ‐ $ 11,787 $ ‐ $ 75,230 $ 529,300 $ 708,566 5 0
Corporate Services GM $ ‐ $ 273,419 $ ‐ $ ‐ $ 1,471,848 $ 20,000 $ 635,075 $ 2,400,342 2.6 0
Human Resources $ ‐ $ 3,729 $ ‐ $ ‐ $ ‐ $ 77,627 $ 969,341 $ 1,050,697 3 1
Knowledge Management $ ‐ $ 259,987 $ ‐ $ 1,930,034 $ ‐ $ ‐ $ 844,967 $ 3,034,988 7 1
Risk & Health Safety $ ‐ $ 32,133 $ ‐ $ ‐ $ ‐ $ 66,988 $ 375,841 $ 474,962 4 0
Legal Services Compliance $ ‐ $ 22,585 $ 84,578 $ ‐ $ ‐ $ 146,686 $ 504,587 $ 758,435 5.1 0
Corporate Legal $ ‐ $ 5,516 $ ‐ $ ‐ $ ‐ $ 199,999 $ 256,476 $ 461,991 4.9 1
Legal Services GM $ ‐ $ 20,777 $ ‐ $ ‐ $ ‐ $ ‐ $ 397,727 $ 418,504 2 1
Operational Services Infrastructure Planning
Corridor Management $ ‐ $ 3,000 $ ‐ $ ‐ $ ‐ $ ‐ $ 331,875 $ 334,875 3 0
GIS $ ‐ $ 6,000 $ ‐ $ 35,055 $ ‐ $ ‐ $ 372,211 $ 413,266 3 0
Infrastructure Planning $ ‐ $ 16,200 $ ‐ $ ‐ $ ‐ $ 474,005 $ 588,968 $ 1,079,172 4 1
Land Management $ ‐ $ 3,000 $ ‐ $ ‐ $ ‐ $ 240,000 $ 94,824 $ 337,824 1 1
Systems Modelling $ ‐ $ ‐ $ ‐ $ 11,839 $ ‐ $ 405,021 $ 316,747 $ 733,607 2 0
Operational Services GM $ ‐ $ 25,838 $ 1,453,245 $ ‐ $ ‐ $ 8,400 $ 390,188 $ 1,877,670 2 0
Service Delivery
Consolidated Assets $ 18,456,909 $ 333,000 $ ‐ $ 2,593,197 $ ‐ $ ‐ $ ‐ $ 21,383,105 0 135.3
Network Operations $ ‐ $ 15,000 $ ‐ $ ‐ $ ‐ $ ‐ $ 1,124,464 $ 1,139,464 11 2
SCADA Control $ ‐ $ 14,520 $ ‐ $ ‐ $ ‐ $ ‐ $ 439,747 $ 454,267 3
Service Delivery $ ‐ $ 63,058 $ ‐ $ ‐ $ ‐ $ 350,004 $ 640,976 $ 1,054,038 3 1.1
Water Quality $ ‐ $ 18,000 $ ‐ $ ‐ $ ‐ $ 440,006 $ 1,009,833 $ 1,467,838 5 0.5
Strategic Asset Management $ ‐ $ 29,100 $ ‐ $ ‐ $ ‐ $ 380,002 $ 736,688 $ 1,145,791 5 1
Project Services Program Management $ ‐ $ 75,828 $ ‐ $ ‐ $ ‐ $ 15,375 $ 755,558 $ 846,761 11 1
Project Services GM $ ‐ $ 54,746 $ ‐ $ ‐ $ ‐ $ ‐ $ 463,126 $ 517,871 3 0
Project Support $ ‐ $ 35,325 $ ‐ $ ‐ $ ‐ $ ‐ $ 563,827 $ 599,152 17 1

LinkWater Asset Informaiton
Asset Type Asset Capacity Units Diameter (mm) Duty Head (m) Asset Value ($) Year constructed Asset Age Water treated (ML) Water stored (ML) Water transported (ML)Water Quality Facilities Chambers Flat Water Quality Facility 47,450 ML/day ― ― $ 6,311,428.43 2008 4.0 13716 ― ―
Alexandra Hills Water Quality Facility 6,570 ML/day ― ― $ 239,077.12 4948 ― ― Other 325 ML/day ― ― $ 49,111,415.00 2003 9.0 105 ― ―
Pump Stations Bundamba PS (SRWP) (Large) 60,000 ML/year ― 85.0 $ 24,901,846.12 2009 3.0 ― ― 0Cameron’s Hill PS 240,000 ML/year ― 25.0 $ 957,451.36 1984 28.0 ― ― 0Mudgeeraba PS 35,000 ML/year ― 70.0 $ 746,998.43 1977 35.0 ― ― 0North Pine PS (1, 3 & 5) 90,000 ML/year ― 65.0 $ 1,054,956.76 1973 39.0 ― ― 31,500Trinder Park PS 40,000 ML/year ― 25.0 $ 1,454,713.38 1983 29.0 ― ― 3,411Other 713,633 ML/year ― $ 163,488,251.00 1995 17.0 ― ― 118,404
Reservoirs Aspley Reservoir 91 ML ― ― $ 10,466,219.72 1971 41.0 ― 50 ― Green Hill Reservoirs 157 ML ― ― $ 14,586,518.00 1968 44.0 ― 87 ― Narangba Reservoirs 40 ML ― ― $ 7,574,463.00 1988 24.3 ― 27 ― Stapylton Reservoir 25 ML ― ― $ 28,311,008.51 2009 3.0 ― 15 ― Other 657 ML $ 85,827,335.00 1988 24.0 550 ―
Bulk Transmission Schemes Anstead to Runcorn scheme 2.2 km 1650 ― $ 91,653,289.84 1988 24.0 ― ― 23,574Bulk Transmission Schemes Anstead to Runcorn scheme 2.2 km 1650 $ 91,653,289.84 1988 24.0 23,5740.2 km 1350 ― ― 2012.0 ― ― ― 3.3 km 1650 ― ― 2012.0 ― ― ― 3.6 km 1650/900. ― ― 2012.0 ― ― ― 2.6 km 1500/750. ― ― 2012.0 ― ― ― 7.6 km 1200 ― ― 2012.0 ― ― ― 4.9 km 1050 ― ― 2012.0 ― ― ―
Green Hill to Wellers Hill scheme 1.6 km 1350 ― $ 24,239,081.00 1958 54.0 ― ― 21,1460.9 km 1350 ― ― 1954 58.0 ― ― ― 4.1 km 1200 ― ― 1954 58.0 ― ― ― 0.3 km 900 ― ― 1962 50.0 ― ― ― 2.7 km 1200 ― ― 1959 53.0 ― ― ― 0.3 km 1500 ― ― 1967 45.0 ― ― ― 2.1 km 1350 ― ― 1972 40.0 ― ― ―
Mt Crosby to Green Hill scheme 4.5 km 1650 ― $ 72,327,355.00 1967 ― ― ― 8.5 km 1650/1500/1050. ― ― 1963 49.0 ― ― ― 2.0 km 1650/1050. ― ― 1956.5 55.5 ― ― ― 2.4 km 1650/1350. ― ― 1958.5 53.5 ― ― ―
North Pine WTP to Aspley scheme 0.2 km 1600 ― $ 34,526,965.62 1971 41.0 ― ― 31,500North Pine WTP to Aspley scheme 0.2 km 1600 $ 34,526,965.62 1971 41.0 31,50011.1 km 1200 ― ― 1972 40.0 ― ― ― 6.2 km 1050 ― ― 1970 42.0 ― ― ―
Ipswich Central Main scheme 1.1 km 600 ― $ 2,213,055.53 1937 75.0 ― ― 8502.8 km 500 ― ― 1955 57.0 ― ― ―
Tarrant Drive to Elanora scheme 5.6 km 960/600. ― $ 9,235,776.45 1978 34.0 ― ― 21,0071.5 km 750 ― ― 1995.5 16.5 ― ― ― 5.5 km 600 ― ― 2005 7.0 ― ― ―
Logan Central Supply scheme 2.4 km 1250/900. ― $ 26,984,012.71 1978 34.0 ― ― 13,9177.3 km 600/600. ― ― 1987.5 24.5 ― ― 4.5 km 600 ― ― 1987.5 24.5 ― ―
Narangba to North Pine WTP scheme 9.0 km 750 ― $ 95,534,901.85 1996 16.0 ― ― 2,6009.0 km 500 ― ― 1983 29.0 ― ―
Heinemann Rd to Alex Hills scheme 1.7 km 450 ― $ 10,029,226.41 1979 33.0 ― ― 1,8001.2 km 375 ― ― 1977 35.0 ― ― 3.8 km 450/375. ― ― 1988.5 23.5 ― ― 2.9 km 450 ― ― 1977 35.0 ― ― 2.4 km 450/300. ― ― 1973.5 38.5 ― ―
NPI scheme 47.0 km 1200 ― $ 183,656,387.16 2007 5.0 ― ― 10,500NPI scheme 47.0 km 1200 $ 183,656,387.16 2007 5.0 10,5002.6 km 750 ― ― 2009 3 ― ― 8.0 km 750 ― ― 1995 17 ― ―
Other Schemes 267.1 km Variable ― $ 1,074,080,650.00 1938 74 ― ― 243,408SCADA Systems All Assets ― ― ― ― $ 2,326,200.00 ― ― ― ― Buildings & Equipment All Assets ― ― ― ― $ 2,838,151.00 ― ― ― ― Plant & Equipment All Assets ― ― ― ― $ 6,318,723.00 ― ― ― ― Intangibles ― ― ― ― $ 6,782,882.00 ― ― ― ― ― Assets Under Construction ― ― ― ― $ 10,887,723.00 ― ― ― ― ―
From QCA report: ML Water Supplied 223,944 Total Fixed Operating 42,621,492.00$ Variable Operating Costs 2,500,000.00$ Fixed Operating ‐ Corporate Costs 14,180,035.00$ Fixed Operating ‐ Operational Costs 9,965,241.00$ Fixed Operating ‐ Maintenance Costs 18,476,216.00$

LinkWater Asset Informaiton cont.
Asset Type Staff (FTEs) Contractors (FTEs) Planned maintenance costs ($) Unplanned maintenace costs ($) Electricity costs ($) Chemical costs ($)Water Quality Facilities Not allocated 2.27 $ 529,445.00 $ 53,950.00 $ 374,910.00 $ 185,119.28
Not allocated 0.72 $ 190,277.00 $ ‐ $ 15,964.87 $ 18,469.00 Not allocated $ 2,764,796.00 $ 946,514.00 $ 123,358.00 $ 325,000.00
Pump Stations Not allocated 0.45 $ 129,817.00 $ 9,747.00 $ 2,167.00 ― Not allocated 0.07 $ 26,508.00 $ 677.00 $ 470.00 ― Not allocated 0.11 $ 25,943.00 $ 475.00 $ 1,348.00 ― Not allocated 1.89 $ 221,427.00 $ 39,015.00 $ 342,437.00 ― Not allocated 0.36 $ 155,116.00 $ 27,264.00 $ 40,539.00 ― Not allocated $ 2,386,187.00 $ 1,016,424.00 $ 1,643,178.00
Reservoirs Not allocated 0.39 $ 111,575.00 $ 63,590.00 $ 7,300.00 ― Not allocated 0.56 $ 167,550.00 $ 13,448.00 $ 14,600.00 ― Not allocated 0.59 $ 165,635.00 $ 46,428.00 $ 21,900.00 ― Not allocated 0.21 $ 35,661.00 $ 245,103.00 $ 7,300.00 ― Not allocated ― $ 1,414,590.00 $ 1,320,612.00 $ 182,500.00
Bulk Transmission Schemes Not allocated ― $ 1,841.00 $ 8,700.00 ― ― Bulk Transmission Schemes Not allocated $ 1,841.00 $ 8,700.00 Not allocated ― ― ― ― ― Not allocated ― ― ― ― ― Not allocated ― ― ― ― ― Not allocated ― ― ― ― ― Not allocated ― ― ― ― ― Not allocated ― ― ― ― ― Not allocated ― $ 84,485.00 $ 8,700.00 ― ― Not allocated ― ― ― ― ― Not allocated ― ― ― ― ― Not allocated ― ― ― ― ― Not allocated ― ― ― ― ― Not allocated ― ― ― ― ― Not allocated ― ― ― ― ― Not allocated ― ― ― ― ― Not allocated ― ― ― ― ― Not allocated ― ― ― ― ― Not allocated ― ― ― ― ― Not allocated ― $ 12,890.00 $ 16,180.00 ― ― Not allocated $ 12,890.00 $ 16,180.00 Not allocated ― ― ― ― ― Not allocated ― ― ― ― ― Not allocated ― $ 3,688.00 $ 13,090.00 ― ― Not allocated ― ― ― ― ― Not allocated ― $ ‐ $ ‐ ― ― Not allocated ― ― ― ― ― Not allocated ― ― ― ― ― Not allocated ― $ 7,352.00 $ 5,433.00 ― ― Not allocated ― ― ― ― ― Not allocated ― ― ― ― ― Not allocated ― $ 18,416.00 $ 18,317.00 ― ― Not allocated ― ― ― ― ― Not allocated ― $ ‐ $ ‐ ― ― Not allocated ― ― ― ― ― Not allocated ― ― ― ― ― Not allocated ― ― ― ― ― Not allocated ― ― ― ― ― Not allocated ― $ 33,870.00 $ 57,060.00 ― ― Not allocated $ 33,870.00 $ 57,060.00 Not allocated ― ― ― ― ― Not allocated ― ― ― ― ― Not allocated ― $ 182,794.00 $ 1,862,671.00 ― ―
SCADA Systems ― ― ― ― ― ― Buildings & Equipment ― ― ― ― ― ― Plant & Equipment ― ― ― ― ― ― Intangibles ― ― ― ― ― ― Assets Under Construction ― ― ― ― ― ―