Embed Size (px)
Citation preview
1
Pharmacy Dispensing Cost Analysis for the State of Maryland
Prepared for the Maryland Department of Health and Mental Hygiene Baltimore, Maryland December 7, 2011
2
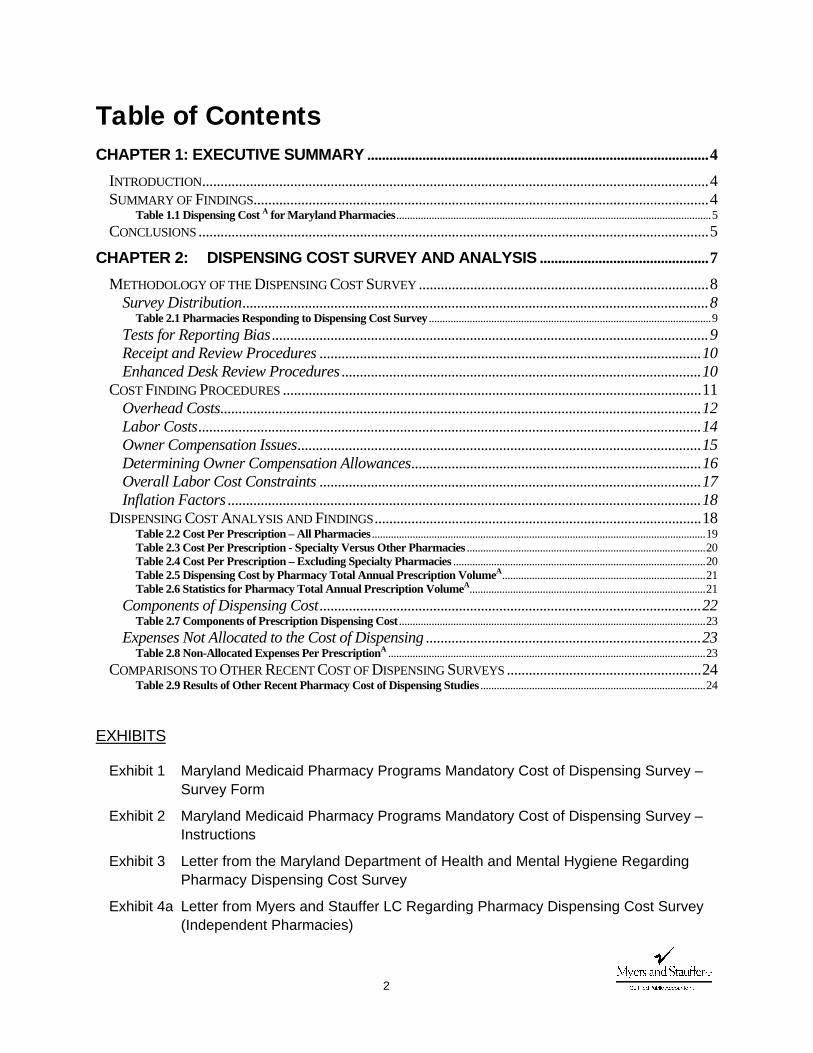
Table of Contents CHAPTER 1: EXECUTIVE SUMMARY ............................................................................................. 4
INTRODUCTION .......................................................................................................................................... 4 SUMMARY OF FINDINGS ............................................................................................................................ 4
Table 1.1 Dispensing Cost A for Maryland Pharmacies .................................................................................................................... 5 CONCLUSIONS ........................................................................................................................................... 5
CHAPTER 2: DISPENSING COST SURVEY AND ANALYSIS .............................................. 7 METHODOLOGY OF THE DISPENSING COST SURVEY ............................................................................... 8
Survey Distribution ............................................................................................................................... 8 Table 2.1 Pharmacies Responding to Dispensing Cost Survey ........................................................................................................ 9
Tests for Reporting Bias ....................................................................................................................... 9 Receipt and Review Procedures ........................................................................................................ 10 Enhanced Desk Review Procedures .................................................................................................. 10
COST FINDING PROCEDURES .................................................................................................................. 11 Overhead Costs ................................................................................................................................... 12 Labor Costs ......................................................................................................................................... 14 Owner Compensation Issues .............................................................................................................. 15 Determining Owner Compensation Allowances ............................................................................... 16 Overall Labor Cost Constraints ........................................................................................................ 17 Inflation Factors ................................................................................................................................. 18
DISPENSING COST ANALYSIS AND FINDINGS ......................................................................................... 18 Table 2.2 Cost Per Prescription – All Pharmacies ........................................................................................................................... 19 Table 2.3 Cost Per Prescription - Specialty Versus Other Pharmacies ........................................................................................ 20 Table 2.4 Cost Per Prescription – Excluding Specialty Pharmacies ............................................................................................. 20 Table 2.5 Dispensing Cost by Pharmacy Total Annual Prescription VolumeA ........................................................................... 21 Table 2.6 Statistics for Pharmacy Total Annual Prescription VolumeA ....................................................................................... 21
Components of Dispensing Cost ........................................................................................................ 22 Table 2.7 Components of Prescription Dispensing Cost ................................................................................................................. 23
Expenses Not Allocated to the Cost of Dispensing ........................................................................... 23 Table 2.8 Non-Allocated Expenses Per PrescriptionA ..................................................................................................................... 23
COMPARISONS TO OTHER RECENT COST OF DISPENSING SURVEYS ..................................................... 24 Table 2.9 Results of Other Recent Pharmacy Cost of Dispensing Studies ................................................................................... 24
EXHIBITS
Exhibit 1 Maryland Medicaid Pharmacy Programs Mandatory Cost of Dispensing Survey – Survey Form
Exhibit 2 Maryland Medicaid Pharmacy Programs Mandatory Cost of Dispensing Survey –Instructions
Exhibit 3 Letter from the Maryland Department of Health and Mental Hygiene Regarding Pharmacy Dispensing Cost Survey
Exhibit 4a Letter from Myers and Stauffer LC Regarding Pharmacy Dispensing Cost Survey (Independent Pharmacies)

3
Exhibit 4b Letter from Myers and Stauffer LC Regarding Pharmacy Dispensing Cost Survey (Chain Pharmacies)
Exhibit 5a First Survey Reminder / Extension Letter (Independent Pharmacies)
Exhibit 5b First Survey Reminder / Extension Letter (Chain Pharmacies)
Exhibit 6a Second Survey Reminder / Extension Letter (Independent Pharmacies)
Exhibit 6b Second Survey Reminder / Extension Letter (Chain Pharmacies)
Exhibit 7a Desk Review Notification Letter (Independent Pharmacies)
Exhibit 7b Desk Review Notification Letter (Chain Pharmacies)
Exhibit 8 Summary of Enhanced Desk Review Findings
Exhibit 9 Construction and Application of Owner Pharmacist Salary Limits
Exhibit 10 Table of Inflation Factors for Dispensing Cost Survey
Exhibit 11 Histogram of Pharmacy Dispensing Cost
Exhibit 12 Pharmacy Cost of Dispensing Survey Data - Statistical Summary
Exhibit 13 Table of Zip Codes, Counties and Urban Versus Rural Designations Exhibit 14 Charts Relating to Pharmacy Prescription Volume:
A: Histogram of Pharmacy Total Prescription Volume B: Relationship Between Dispensing Cost per Prescription and Total Prescription
Volume
Exhibit 15 Summary of Pharmacy Attributes
Exhibit 16 Chart of Components of Cost of Dispensing per Prescription
4
Chapter 1: Executive Summary Introduction
Under contract to the Maryland Department of Health and Mental Hygiene, Myers and Stauffer LC performed a study of pharmacy dispensing cost. The dispensing study followed the methodology and used a survey instrument similar to those used by Myers and Stauffer in Medicaid pharmacy engagements in several other states. There were 1,410 pharmacy providers enrolled in the Maryland Medicaid Pharmacy Programs. All 1,410 pharmacies were requested to submit survey information for this study. Myers and Stauffer performed basic desk review procedures to test completeness and accuracy for all dispensing cost surveys submitted. Additionally, expanded desk review procedures which required the submission of supporting documentation from the sample pharmacies were performed for 20 pharmacies to validate reported costs. There were 1,111 pharmacies that filed cost surveys that could be included in this analysis.1 Data from these surveys was used to calculate the average cost of dispensing at each pharmacy and results from these pharmacies were tabulated and subjected to statistical analysis.
Summary of Findings
The significant findings of the study are as follows:
1 Some pharmacies submitted surveys that were incomplete or contained data errors that precluded their use in this study. As time permitted, pharmacies that submitted incomplete or erroneous survey information were contacted for clarification. However, not all pharmacies responded to these requests for additional information, and those surveys were not included in the final analysis.
5
Dispensing Cost
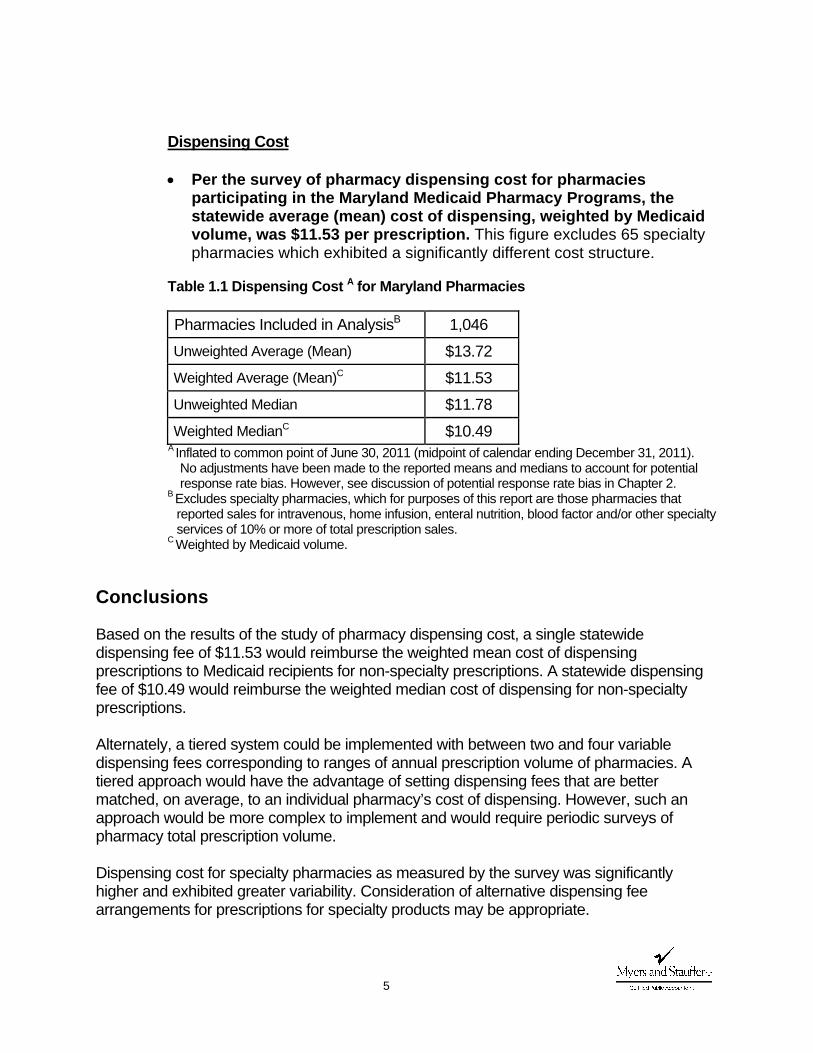
• Per the survey of pharmacy dispensing cost for pharmacies
participating in the Maryland Medicaid Pharmacy Programs, the statewide average (mean) cost of dispensing, weighted by Medicaid volume, was $11.53 per prescription. This figure excludes 65 specialty pharmacies which exhibited a significantly different cost structure.
Table 1.1 Dispensing Cost A for Maryland Pharmacies
Pharmacies Included in AnalysisB 1,046 Unweighted Average (Mean) $13.72 Weighted Average (Mean)C $11.53 Unweighted Median $11.78 Weighted MedianC $10.49
A Inflated to common point of June 30, 2011 (midpoint of calendar ending December 31, 2011). No adjustments have been made to the reported means and medians to account for potential response rate bias. However, see discussion of potential response rate bias in Chapter 2.
B Excludes specialty pharmacies, which for purposes of this report are those pharmacies that reported sales for intravenous, home infusion, enteral nutrition, blood factor and/or other specialty services of 10% or more of total prescription sales.
C Weighted by Medicaid volume.
Conclusions
Based on the results of the study of pharmacy dispensing cost, a single statewide dispensing fee of $11.53 would reimburse the weighted mean cost of dispensing prescriptions to Medicaid recipients for non-specialty prescriptions. A statewide dispensing fee of $10.49 would reimburse the weighted median cost of dispensing for non-specialty prescriptions. Alternately, a tiered system could be implemented with between two and four variable dispensing fees corresponding to ranges of annual prescription volume of pharmacies. A tiered approach would have the advantage of setting dispensing fees that are better matched, on average, to an individual pharmacy’s cost of dispensing. However, such an approach would be more complex to implement and would require periodic surveys of pharmacy total prescription volume.
Dispensing cost for specialty pharmacies as measured by the survey was significantly higher and exhibited greater variability. Consideration of alternative dispensing fee arrangements for prescriptions for specialty products may be appropriate.
6
A change in pharmacy dispensing fees to levels that approximate the average cost of dispensing would be most appropriately considered only if revisions to the current methodology for ingredient reimbursement are considered. Currently, the Maryland Medicaid Pharmacy Program’s ingredient reimbursement is primarily based on the lesser of the Average Wholesale Price (AWP) minus 12%, the Wholesale Acquisition Cost (WAC) plus 8% or the Direct Price (DP) plus 8% and also incorporates the Federal Upper Limit (FUL) and a State Maximum Allowable Cost (SMAC) for generic drugs. The Centers for Medicare and Medicaid Services (CMS) have recently launched an initiative to develop the National Average Drug Acquisition Cost (NADAC) reference file which will be a nationally derived average acquisition cost benchmark made available for the use of state Medicaid pharmacy programs. CMS has indicated that state Medicaid programs adopting the NADAC would need to set reasonable dispensing fees that appropriately recognize the professional services rendered by pharmacists. Myers and Stauffer’s contract with the Department of Health and Mental Hygiene includes the task of modeling potential reimbursement scenarios utilizing alternative dispensing fee structures along with an ingredient reimbursement methodology derived from the published NADAC reference file when it becomes available to states.
7
Chapter 2: Dispensing Cost Survey and Analysis
The Maryland Department of Health and Mental Hygiene, engaged Myers and Stauffer LC to perform a study of costs incurred by pharmacies participating in the Maryland Medicaid Pharmacy Programs to dispense prescription medications. There are two primary components related to the provision of prescription medications: dispensing cost and drug ingredient cost. Dispensing cost consists of the overhead and labor costs incurred by a pharmacy to fill prescription medications. In its final rule to implement provisions of the Deficit Reduction Act of 2005 (DRA), the Centers for Medicare and Medicaid Services (CMS) has provided some basic guidelines for appropriate costs to be reimbursed via a Medicaid pharmacy dispensing fee. CMS guidelines state:
“Dispensing fee means the fee which— (1) Is incurred at the point of sale or service and pays for costs in excess of the ingredient cost of a covered outpatient drug each time a covered outpatient drug is dispensed; (2) Includes only pharmacy costs associated with ensuring that possession of the appropriate covered outpatient drug is transferred to a Medicaid recipient. Pharmacy costs include, but are not limited to, reasonable costs associated with a pharmacist’s time in checking the computer for information about an individual’s coverage, performing drug utilization review and preferred drug list review activities, measurement or mixing of the covered outpatient drug, filling the container, beneficiary counseling, physically providing the completed prescription to the Medicaid beneficiary, delivery, special packaging, and overhead associated with maintaining the facility and equipment necessary to operate the pharmacy; and (3) Does not include administrative costs incurred by the State in the operation of the covered outpatient drug benefit including systems costs for interfacing with pharmacies.” 2
2 See “Medicaid Program; Prescription Drugs; Final Rule.” Federal Register, 72: 136 (17 July 2007), p. 39,240. These guidelines are codified at 42 CFR 47.502.
8
In order to determine costs incurred to dispense pharmaceuticals to recipients of the Maryland Medicaid Pharmacy Programs, Myers and Stauffer utilized a survey method consistent with CMS guidelines and the methodology of previous surveys conducted by Myers and Stauffer in several states.
Methodology of the Dispensing Cost Survey
Survey Distribution
Myers and Stauffer obtained from the Department a list of pharmacy providers currently enrolled in the Maryland Medicaid Pharmacy Programs. According to the provider list, there were 1,410 pharmacy providers enrolled in the program. Surveys were mailed to all 1,410 pharmacy providers on June 24, 2011. Each sampled pharmacy received a copy of the cost survey (Exhibit 1), instructions for the survey (Exhibit 2), a letter of explanation from the Department of Health and Mental Hygiene (Exhibit 3) and a letter of explanation from Myers and Stauffer (Exhibit 4a and Exhibit 4b). Concerted efforts to encourage participation were made to enhance the survey response rate. Additional letters were sent on July 14, 2011 to remind pharmacies of the survey and extend the original due date of July 15, 2011 to July 29, 2011. (Exhibit 5a and Exhibit 5b). On July 28, 2011, an additional letter was mailed extending the due date for the survey by two weeks to August 12, 2011(Exhibit 6a and Exhibit 6b). In addition to reminder letters and due date extensions, efforts were made to assist pharmacies with completion of the survey. The survey forms, instructions and a letter of explanation from Myers and Stauffer offered pharmacy owners the option of having Myers and Stauffer complete certain sections of the survey if copies of financial statements and/or tax returns were submitted. A toll-free telephone number was listed on the survey form and pharmacists were instructed to call to resolve any questions they had concerning completion of the survey form. Providers were given instructions to report themselves as ineligible for the survey if they met certain criteria. Pharmacies were to be deemed ineligible if they had closed their pharmacy, had a change of ownership, or had less than six months of cost data available (e.g., due to a pharmacy that recently opened, or changed ownership). Of the 1,410 surveyed pharmacies, 50 pharmacies were determined to be ineligible to participate (based on the returned surveys).
Surveys were accepted through August 24, 2011. As indicated in Table 2.1, there were 1,111 pharmacies (out of 1,360 eligible pharmacies) that submitted a usable cost survey for this study, which is a response rate of 81.7%.
9
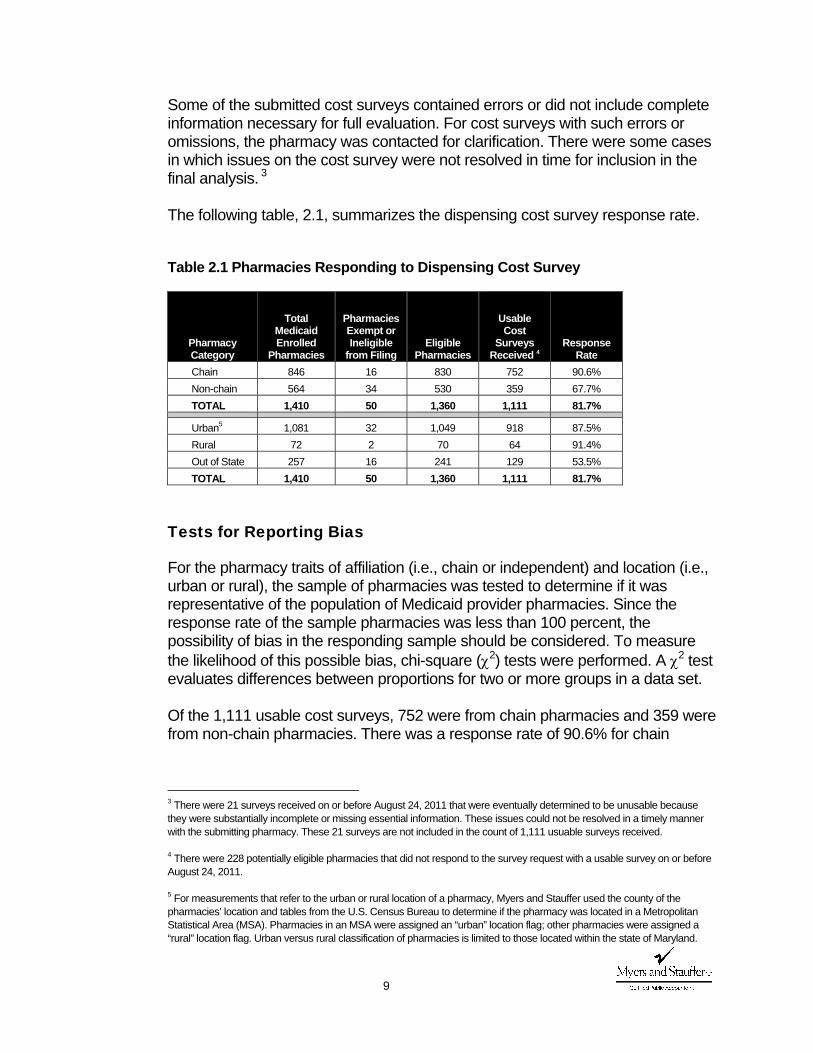
Some of the submitted cost surveys contained errors or did not include complete information necessary for full evaluation. For cost surveys with such errors or omissions, the pharmacy was contacted for clarification. There were some cases in which issues on the cost survey were not resolved in time for inclusion in the final analysis. 3 The following table, 2.1, summarizes the dispensing cost survey response rate.
Table 2.1 Pharmacies Responding to Dispensing Cost Survey
Pharmacy Category
Total Medicaid Enrolled
Pharmacies
Pharmacies Exempt or Ineligible
from Filing Eligible
Pharmacies
Usable Cost
Surveys Received 4
Response Rate
Chain 846 16 830 752 90.6% Non-chain 564 34 530 359 67.7% TOTAL 1,410 50 1,360 1,111 81.7%
Urban5 1,081 32 1,049 918 87.5% Rural 72 2 70 64 91.4% Out of State 257 16 241 129 53.5% TOTAL 1,410 50 1,360 1,111 81.7%
Tests for Reporting Bias
For the pharmacy traits of affiliation (i.e., chain or independent) and location (i.e., urban or rural), the sample of pharmacies was tested to determine if it was representative of the population of Medicaid provider pharmacies. Since the response rate of the sample pharmacies was less than 100 percent, the possibility of bias in the responding sample should be considered. To measure the likelihood of this possible bias, chi-square (χ2) tests were performed. A χ2 test evaluates differences between proportions for two or more groups in a data set. Of the 1,111 usable cost surveys, 752 were from chain pharmacies and 359 were from non-chain pharmacies. There was a response rate of 90.6% for chain
3 There were 21 surveys received on or before August 24, 2011 that were eventually determined to be unusable because they were substantially incomplete or missing essential information. These issues could not be resolved in a timely manner with the submitting pharmacy. These 21 surveys are not included in the count of 1,111 usuable surveys received. 4 There were 228 potentially eligible pharmacies that did not respond to the survey request with a usable survey on or before August 24, 2011. 5 For measurements that refer to the urban or rural location of a pharmacy, Myers and Stauffer used the county of the pharmacies’ location and tables from the U.S. Census Bureau to determine if the pharmacy was located in a Metropolitan Statistical Area (MSA). Pharmacies in an MSA were assigned an “urban” location flag; other pharmacies were assigned a “rural” location flag. Urban versus rural classification of pharmacies is limited to those located within the state of Maryland.
10
pharmacies compared to a response rate of 67.7% for independent pharmacies. The results of the χ2 test indicated that the difference was statistically significant. A χ2 test was also performed with respect to the urban versus rural location of the pharmacy for responding pharmacies that were located in the state of Maryland. The results of this test indicated that the difference in response rate for pharmacies in urban versus rural locations (a response rate of 87.5% for urban pharmacies compared to a response rate of 91.4% for rural pharmacies) was not statistically significant.
Receipt and Review Procedures
For confidentiality purposes, each pharmacy was randomly assigned a four-digit identification number and each cost survey was carefully examined. A desk review was performed for 100% of all surveys received. This review identified incomplete cost surveys and pharmacies submitting these incomplete cost surveys were contacted by telephone to obtain information necessary for completion. The desk review process also incorporated a number of tests to determine the reasonableness of the reported data. In many instances, pharmacies were contacted to correct or provide confirmation of reported survey data that was indicated for review as a result of these tests for reasonableness. For approximately one-third of surveys received from non-chain pharmacies, the surveys were submitted with a tax return or financial statement. Myers and Stauffer had indicated in the survey instructions that this type of supporting documentation could be sent in lieu of completion of certain portions of the survey form. The desk review process included steps to complete or confirm survey data when such documentation was available. Enhanced Desk Review Procedures
In addition to the desk review procedures, a random sample of 40 pharmacies that responded to the cost of dispensing survey were sent a request for supporting documentation to verify the survey data submitted (Exhibit 7a and Exhibit 7b) . These pharmacies were requested to submit financial statements or a tax return to verify reported expenses, a prescription dispensing report to verify the total number of prescriptions dispensed for the fiscal year and a store diagram or blueprint to verify the pharmacy’s reported square footage. Of the 40 randomly sampled pharmacies, responses with the requested information were received from 20 pharmacies. 6
6 Responses to the request for documentation for the enhanced desk review procedures were accepted through August 31, 2011.
11
The submitted documentation was reviewed and compared against the previously submitted survey data. If warranted by the supporting documentation, adjustments to the submitted data were made. Myers and Stauffer calculated the cost of dispensing associated with each of these pharmacies (using the cost allocation procedures described subsequently in this report) using both the survey data as submitted and the adjusted survey data. While there were both positive and negative impacts to the calculated pharmacy cost of dispensing as a result of the enhanced desk review procedures, there was no indication of significant and systemic overstating or understating of costs reported on the survey (Exhibit 8).
Cost Finding Procedures
For all pharmacies, the basic formula used to determine the average dispensing cost per prescription was to calculate the total dispensing-related cost and divide it by the total number of prescriptions dispensed:
Determining the result of this equation becomes more complex since not all costs are strictly related to the prescription dispensing function of the pharmacy. Most pharmacies are also engaged in lines of business other than the dispensing of prescription drugs. For example, many pharmacies have a retail business with sales of over-the-counter (OTC) drugs and other non-medical items. Some pharmacies are involved in the sale of durable medical equipment. The existence of these other lines of business necessitates that procedures be taken to isolate the costs involved in the prescription dispensing function of the pharmacy. Cost finding is the process of recasting cost data using rules or formulas in order to accomplish an objective. In this study, the objective is to estimate the cost of dispensing prescriptions to Medicaid recipients. To accomplish this objective, some pharmacy costs must be allocated between the prescription dispensing function and other business activities. This process identified the reasonable and allowable costs necessary for prescription dispensing to Medicaid recipients. Dispensing cost consists of two main components: overhead and labor. The cost finding rules employed to determine each of these components are described in the following sections.
Dispensed onsPrescripti of Number TotalCost Related Dispensing )(Allowable Total Cost Dispensing Average =
12
Overhead Costs
Overhead cost per prescription was calculated by summing the allocated overhead of each pharmacy and dividing this sum by the number of prescriptions dispensed. We allocated overhead expenses that were reported for the entire pharmacy to the prescription department based on one of the following allocation methods: Sales ratio – prescription sales divided by total sales. Area ratio – prescription department floor space (in square feet) divided by
total floor space. All, or 100% – overhead costs that are entirely related to prescription
functions. None, or 0% – overhead costs that are entirely related to non-prescription
functions. Overhead costs that were considered entirely prescription-related include: Prescription department licenses. Prescription delivery expense. Prescription computer expense. Prescription containers and labels (For many pharmacies the costs
associated with prescription containers and labels is captured in their cost of goods sold. Subsequently, it was often the case that a pharmacy was unable to report expenses for prescription containers and labels. In order to maintain consistency, a minimum allowance for prescription containers and labels was determined to use for pharmacies that did not report an expense amount for containers and labels. The allowance was set at the 95th percentile of prescription containers and labels expense per prescription for pharmacies that did report prescription containers and labels expense: $0.5524 per prescription).
Certain other expenses that were separately identified on lines 22a-22r 7 of the cost survey (Exhibit 1).
Overhead costs that were not allocated as a prescription expense include: Income taxes 8
7 “Other” expenses were analyzed to determine the appropriate basis for allocation of each expense: sales ratio, area ratio, 100% related to dispensing cost or 0% (not allocated). 8 Income taxes are not considered an operational cost because they are based upon the profit of the pharmacy operation. Although a separate line was provided for the state income taxes of corporate filers, these costs were not included in this study as a prescription cost. This provides equal treatment to each pharmacy, regardless of the type of ownership.
13
Bad debts 9 Advertising 10 Charitable Contributions 11 Certain costs reported on Lines 22a through 22r of the cost survey (Exhibit 1)
were occasionally excluded. An example is freight expense, which usually relates only to nonprescription purchases or cost of goods sold.
The remaining expenses were assumed to be related to both prescription and nonprescription sales. Joint cost allocation is necessary to avoid understating or overstating the cost of filling a prescription. Those overhead costs allocated on the area ratio (as previously defined) include:
Depreciation Real estate taxes Rent 12 Repairs
9 The exclusion of bad debts from the calculation of dispensing costs is consistent with Medicare cost reporting principles. See Provider Reimbursement Manual, CMS Pub.15-1, Section 304. “The allowance of unrecovered costs attributable to such bad debts in the calculation of reimbursement by the Program results from the expressed intent of Congress that the costs of services covered by the Program will not be borne by individuals not covered, and the costs of services not covered by the Program will not be borne by the Program.” It is recognized that some bad debts may be the result of Medicaid co-payments that were not collected. However, it was not possible to isolate the amount of bad debts attributable to uncollected Medicaid co-payments from the survey data. Additionally, there may be programmatic policy reasons to exclude uncollected Medicaid co-payments from the calculation of the cost of dispensing. Inclusion of cost for uncollected co-payments in the dispensing fee might serve to remove incentives for pharmacies to collect Medicaid co-payments when applicable. Given that co-payments were established to bring about some measure of cost containment, it may not be in the best interest of a Medicaid pharmacy program to allow uncollected co-payments to essentially be recaptured in a pharmacy dispensing fee. 10 The exclusion of most types of advertising expense is consistent with Medicare cost reporting principles. See Provider Reimbursement Manual, CMS Pub. 15.1, Section 2136.2. “Costs of advertising to the general public which seeks to increase patient utilization of the provider's facilities are not allowable.” 11 Individual proprietors and partners are not allowed to deduct charitable contributions as a business expense for federal income tax purposes. Any contributions made by their business are deducted along with personal contributions as itemized deductions. However, corporations are allowed to deduct contributions as a business expense for federal income tax purposes. Thus, while Line 13 on the cost report recorded the business contributions of a corporation, none of these costs were allocated as a prescription expense. This provides equal treatment for each type of ownership. 12 The survey instrument included these special instructions for reporting rent: “Overhead costs reported on the cost report must be resulting from arms-length transactions between non-related parties. Related parties include, but are not limited to, those related by family, by business or financial association, and by common ownership or control. The most common non-arms-length transaction involves rental of property between related parties. The only allowable expense of such transactions for cost determination purposes would be the actual costs of ownership (depreciation, taxes, interest, etc., for the store area only).” This treatment of related-party expenses is consistent with Medicare cost reporting principles. See Provider Reimbursement Manual, CMS Pub. 15-2, Section 3614: “Cost applicable to home office costs, services, facilities, and supplies furnished to you by organizations related to you by common ownership or control are includable in your allowable cost at the cost to the related organizations. However, such cost must not exceed the amount a prudent and cost conscious buyer pays for comparable services, facilities, or supplies that are purchased elsewhere.”
14
Utilities The costs in these categories were considered a function of floor space.13
The floor space ratio was increased by a factor of 2.0 from that reported on the original cost survey to allow for waiting and counseling areas for patients and prescription department office area. The resulting ratio was adjusted downward, when necessary, not to exceed the sales ratio (in order to avoid allocating 100% of these costs in the instance where the prescription department occupies the majority of the area of the store).
Overhead costs allocated using the sales ratio include:
Personal property taxes Other taxes Insurance Interest Accounting and legal fees Telephone and supplies Dues and publications
Labor Costs
Labor costs are calculated by allocating total salaries, payroll taxes, and benefits based on the percent of time spent in the prescription department. The allocations for each labor category were summed and then divided by the number of prescriptions dispensed to calculate labor cost per prescription. There are various classifications of salaries and wages requested on the cost survey (Lines 1a-4 of Page 5 of the cost survey – Exhibit 1) due to the different cost treatment given to each labor classification. Although some employee pharmacists spent a portion of their time performing nonprescription duties, it was assumed in this study that their economic productivity when performing nonprescription functions was less than their productivity when performing prescription duties. The total salaries, payroll taxes, and benefits of employee pharmacists (Lines 2a to 2j of Page 5 of the cost survey – Exhibit 1) were multiplied by a factor based upon the percent of prescription time. Therefore, a higher percentage of salaries, payroll taxes, and benefits was allocated to prescription labor costs than would have been allocated if a simple
13 Allocation of certain expenses using a ratio based on square footage is consistent with Medicare cost reporting principles. See Provider Reimbursement Manual, CMS Pub. 15-2, Section 3617.

15
percent of time allocation were utilized. Specifically, the percent of prescription time indicated was adjusted by the following formula: 14
))(%1())(%2(
TimeRxTimeRx
+
The allocation of salaries, payroll taxes, and benefits for all other prescription employees (Lines 3a-3h of Page 5 of the cost survey – Exhibit 1) was based directly upon the percentage of time spent in the prescription department as indicated on the individual cost survey. For example, if the reported percentage of prescription time was 75 percent and total salaries were $10,000, then the allocated prescription cost would be $7,500. Owner Compensation Issues
The allocation of salaries, payroll taxes, and benefits of the owner pharmacists (Lines 1a-1e of Page 5 of the cost survey – Exhibit 1) was based upon the same modified percentage as that used for employee pharmacists. However, limitations were placed upon the allocated salaries, payroll taxes, and benefits of owner pharmacists. Since compensation reported for owner pharmacists are not costs that have arisen from arm's length negotiations, they are not similar to other costs. A pharmacy owner has a different approach toward other expenses than toward his/her own salary. In fact, owners often pay themselves above the market costs of securing the services of an employee pharmacist. This excess effectively represents a withdrawal of business profits, not a cost of dispensing. Some owners may underpay themselves for business reasons, which would also misrepresent the true dispensing cost. A factor considered in determining the allocation of owner's salaries was the variability in productivity. For example, one owner pharmacist may dispense 30,000 prescriptions per year while another may dispense 5,000. Those owner pharmacists who dispensed a greater number of prescriptions were allowed a higher salary than were owner pharmacists who dispensed a smaller number of prescriptions. Since variance is not nearly as great with respect to employee pharmacists, the owner pharmacist's salary was subjected to limits based upon employee pharmacists' salaries per prescription.
14 Example: An employee pharmacist spends 90 percent of his/her time in the prescription department. The 90 percent factor would be modified to 95 percent: (2)(0.9)/(1+0.9) = 0.95. Thus, 95 percent of the reported salaries, payroll taxes, and benefits would be allocated to the prescription department. It should be noted that most employee pharmacists spent 100 percent of their time in the prescription department.
16
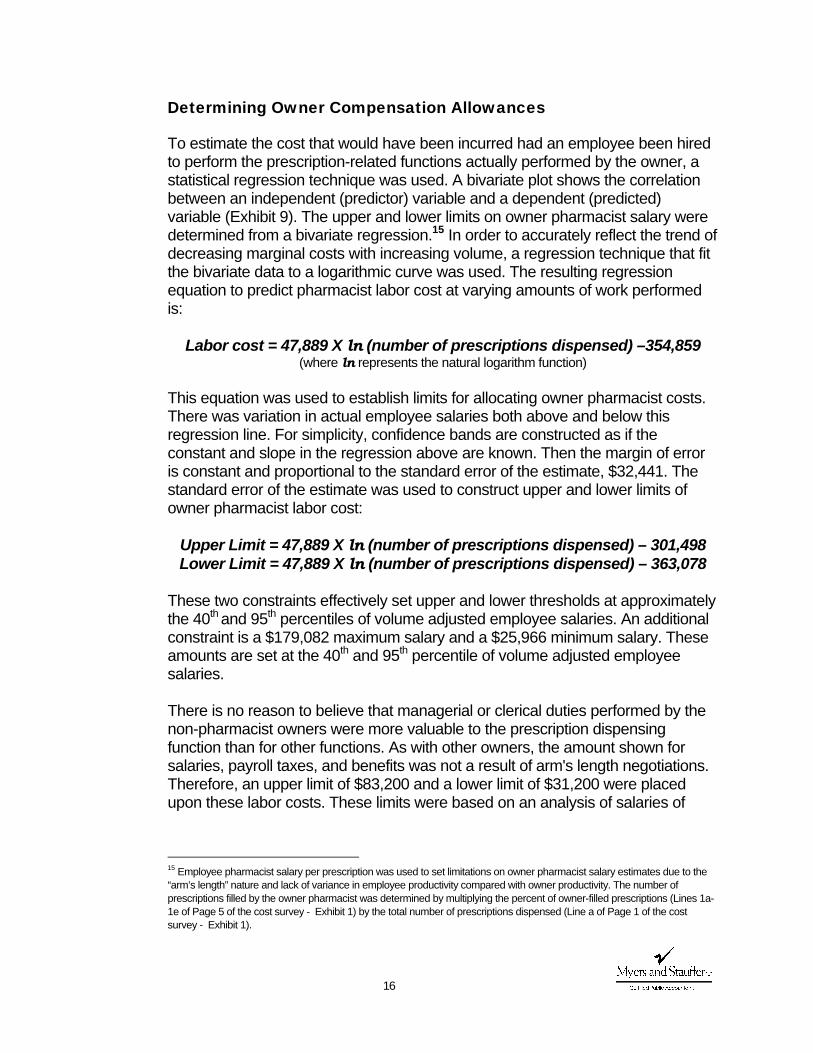
Determining Owner Compensation Allowances
To estimate the cost that would have been incurred had an employee been hired to perform the prescription-related functions actually performed by the owner, a statistical regression technique was used. A bivariate plot shows the correlation between an independent (predictor) variable and a dependent (predicted) variable (Exhibit 9). The upper and lower limits on owner pharmacist salary were determined from a bivariate regression.15 In order to accurately reflect the trend of decreasing marginal costs with increasing volume, a regression technique that fit the bivariate data to a logarithmic curve was used. The resulting regression equation to predict pharmacist labor cost at varying amounts of work performed is:
Labor cost = 47,889 X ln (number of prescriptions dispensed) –354,859 (where ln represents the natural logarithm function)
This equation was used to establish limits for allocating owner pharmacist costs. There was variation in actual employee salaries both above and below this regression line. For simplicity, confidence bands are constructed as if the constant and slope in the regression above are known. Then the margin of error is constant and proportional to the standard error of the estimate, $32,441. The standard error of the estimate was used to construct upper and lower limits of owner pharmacist labor cost:
Upper Limit = 47,889 X ln (number of prescriptions dispensed) – 301,498 Lower Limit = 47,889 X ln (number of prescriptions dispensed) – 363,078
These two constraints effectively set upper and lower thresholds at approximately the 40th and 95th percentiles of volume adjusted employee salaries. An additional constraint is a $179,082 maximum salary and a $25,966 minimum salary. These amounts are set at the 40th and 95th percentile of volume adjusted employee salaries. There is no reason to believe that managerial or clerical duties performed by the non-pharmacist owners were more valuable to the prescription dispensing function than for other functions. As with other owners, the amount shown for salaries, payroll taxes, and benefits was not a result of arm's length negotiations. Therefore, an upper limit of $83,200 and a lower limit of $31,200 were placed upon these labor costs. These limits were based on an analysis of salaries of
15 Employee pharmacist salary per prescription was used to set limitations on owner pharmacist salary estimates due to the “arm’s length” nature and lack of variance in employee productivity compared with owner productivity. The number of prescriptions filled by the owner pharmacist was determined by multiplying the percent of owner-filled prescriptions (Lines 1a-1e of Page 5 of the cost survey - Exhibit 1) by the total number of prescriptions dispensed (Line a of Page 1 of the cost survey - Exhibit 1).
17
employee pharmacists and were adjusted based on the reported time worked by the owner non-pharmacist. A sensitivity analysis of the owner labor limits was performed in order to determine the impact of the limits on the overall analysis of pharmacy dispensing cost. Of the 1,111 pharmacies in the cost analysis, owner limits impacted 248 pharmacies, or 22.3%. Of these, 69 pharmacies had costs reduced as a result of application of these limits (on the basis that a portion of owner salary “cost” appeared to represent a withdrawal of profits from the business), and 179 pharmacies had costs increased as a result of the limits (on the basis that owner salaries appeared to be below their market value). In total, the final estimate of average pharmacy dispensing cost per prescription was decreased by approximately $0.09 as a result of the owner salary limits. Overall Labor Cost Constraints
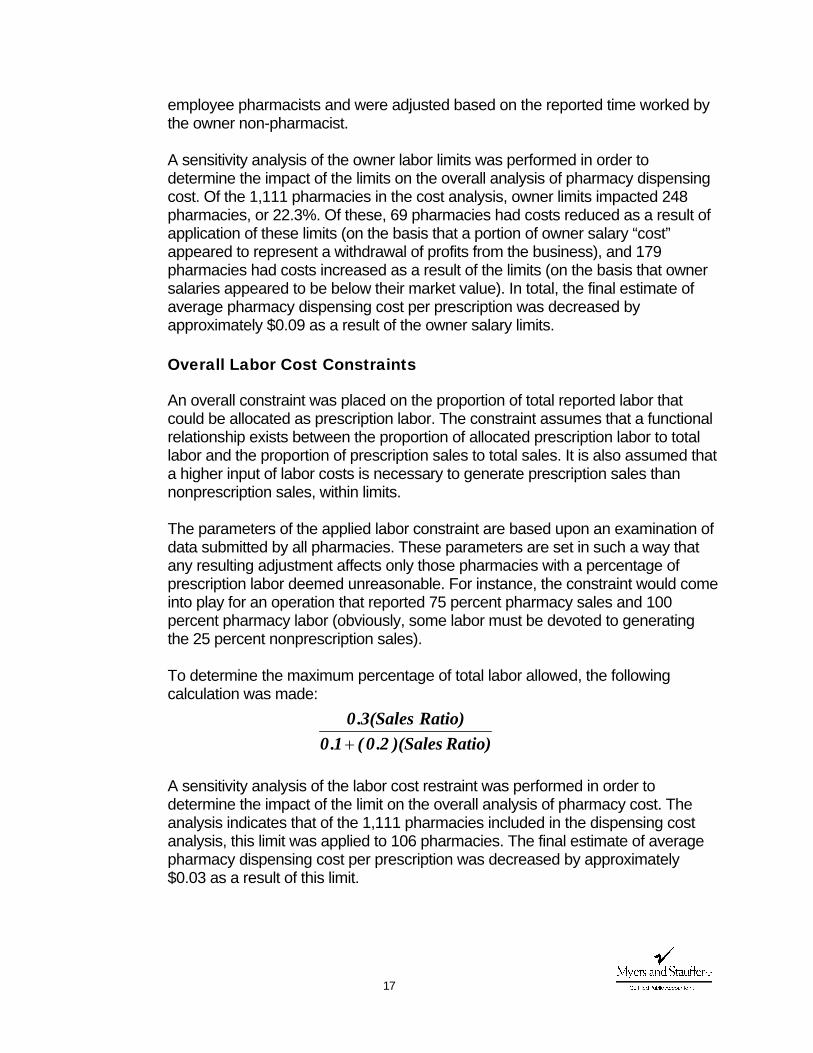
An overall constraint was placed on the proportion of total reported labor that could be allocated as prescription labor. The constraint assumes that a functional relationship exists between the proportion of allocated prescription labor to total labor and the proportion of prescription sales to total sales. It is also assumed that a higher input of labor costs is necessary to generate prescription sales than nonprescription sales, within limits. The parameters of the applied labor constraint are based upon an examination of data submitted by all pharmacies. These parameters are set in such a way that any resulting adjustment affects only those pharmacies with a percentage of prescription labor deemed unreasonable. For instance, the constraint would come into play for an operation that reported 75 percent pharmacy sales and 100 percent pharmacy labor (obviously, some labor must be devoted to generating the 25 percent nonprescription sales). To determine the maximum percentage of total labor allowed, the following calculation was made:
A sensitivity analysis of the labor cost restraint was performed in order to determine the impact of the limit on the overall analysis of pharmacy cost. The analysis indicates that of the 1,111 pharmacies included in the dispensing cost analysis, this limit was applied to 106 pharmacies. The final estimate of average pharmacy dispensing cost per prescription was decreased by approximately $0.03 as a result of this limit.
Ratio))(Sales2.0(1.0Ratio)(Sales3.0
+
18
Inflation Factors
All allocated costs for overhead and labor were totaled and multiplied by an inflation factor. Inflation factors are intended to reflect cost changes from the middle of the reporting period of a particular pharmacy to a common fiscal period ending December 31, 2011 (specifically from the midpoint of the pharmacy’s fiscal year to June 30, 2011 which is the midpoint of the fiscal period ending December 31, 2011). The midpoint and terminal month indices used were taken from the Employment Cost Index, (all civilian, all workers; seasonally adjusted) (Exhibit 10). The use of inflation factors is preferred in order for pharmacy cost data from various fiscal years to be compared uniformly.
Dispensing Cost Analysis and Findings
The dispensing costs for all pharmacies in the sample are summarized in the following tables and paragraphs. Findings for all pharmacies in the sample are presented collectively, and additionally are presented for subsets of the sample based on pharmacy characteristics. There are several statistical measurements that may be used to express the central tendency of a distribution, the most common of which are the average, or mean, and the median. Findings are presented in the forms of means and medians, both weighted and unweighted. 16 As is typically the case with dispensing cost surveys, statistical “outliers” are a common occurrence. These outlier pharmacies have dispensing costs that are not typical of the majority of pharmacies. Medians are sometimes preferred to averages (i.e., the arithmetic mean) in situations where the magnitude of outlier values results in an average that does not represent what is thought of as “average” or normal in the common sense.
16 Different Measures of Central Tendency: Unweighted mean: the arithmetic average cost for all pharmacies. Weighted mean: the average cost of all prescriptions dispensed by pharmacies included in the sample, weighted by prescription volume. The resulting number is the average cost for all prescriptions, rather than the average for all pharmacies as in the unweighted mean. This implies that low volume pharmacies have a smaller impact on the weighted average than high volume pharmacies. This approach, in effect, sums all costs in the sample and divides that sum by the total of all prescriptions in the sample. The weighting factor can be either total prescription volume or Medicaid prescription volume.
Median: the value that divides a set of observations (such as dispensing cost) in half. In the case of this survey, the median is the dispensing cost such that the cost of one half of the pharmacies in the set are less than or equal to the median and the dispensing costs of the other half are greater than or equal to the median. Weighted Median: this is determined by finding the pharmacy observation that encompasses the middle value prescription. The implication is that one half of the prescriptions were dispensed at a cost of the weighted median or less, and one half were dispensed at the cost of the weighted median or more. Suppose, for example, that there were 1,000,000 Medicaid prescriptions dispensed by the pharmacies in the sample. If the pharmacies were arrayed in order of dispensing cost, the median weighted by Medicaid volume, is the dispensing cost of the pharmacy that dispensed the middle, or 500,000th prescription.
19
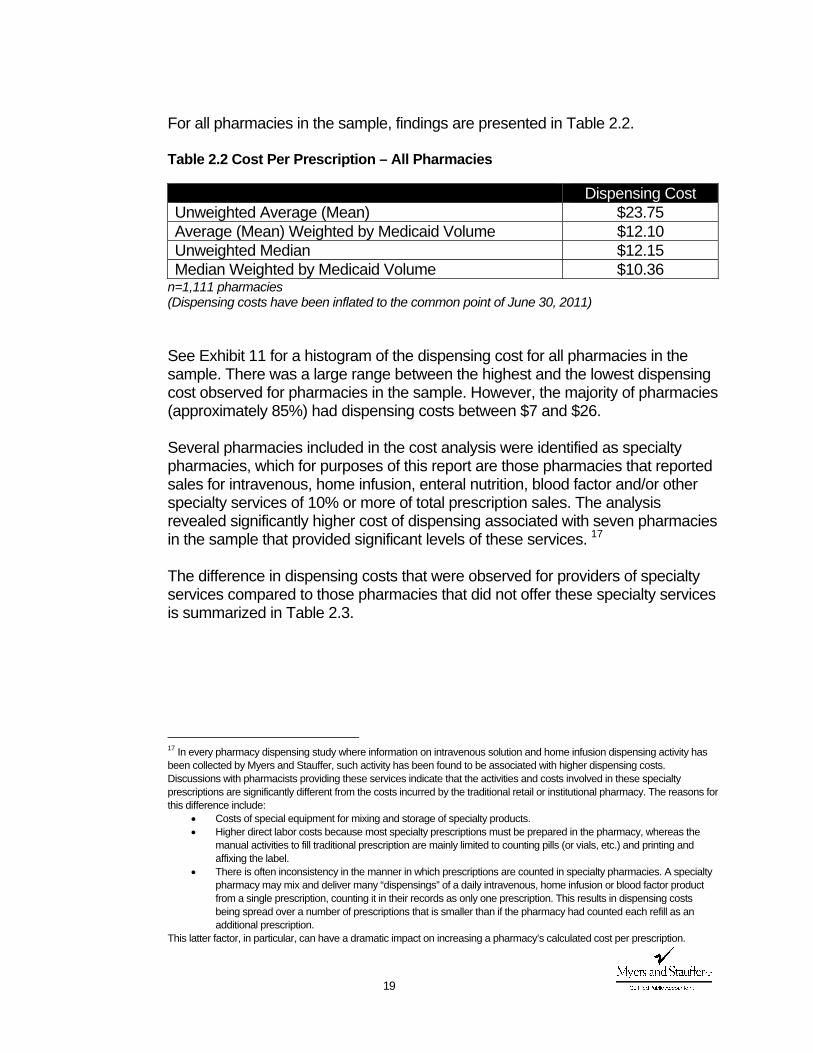
For all pharmacies in the sample, findings are presented in Table 2.2. Table 2.2 Cost Per Prescription – All Pharmacies
Dispensing Cost Unweighted Average (Mean) $23.75 Average (Mean) Weighted by Medicaid Volume $12.10 Unweighted Median $12.15 Median Weighted by Medicaid Volume $10.36
n=1,111 pharmacies (Dispensing costs have been inflated to the common point of June 30, 2011) See Exhibit 11 for a histogram of the dispensing cost for all pharmacies in the sample. There was a large range between the highest and the lowest dispensing cost observed for pharmacies in the sample. However, the majority of pharmacies (approximately 85%) had dispensing costs between $7 and $26.
Several pharmacies included in the cost analysis were identified as specialty pharmacies, which for purposes of this report are those pharmacies that reported sales for intravenous, home infusion, enteral nutrition, blood factor and/or other specialty services of 10% or more of total prescription sales. The analysis revealed significantly higher cost of dispensing associated with seven pharmacies in the sample that provided significant levels of these services. 17 The difference in dispensing costs that were observed for providers of specialty services compared to those pharmacies that did not offer these specialty services is summarized in Table 2.3.
17 In every pharmacy dispensing study where information on intravenous solution and home infusion dispensing activity has been collected by Myers and Stauffer, such activity has been found to be associated with higher dispensing costs. Discussions with pharmacists providing these services indicate that the activities and costs involved in these specialty prescriptions are significantly different from the costs incurred by the traditional retail or institutional pharmacy. The reasons for this difference include:
• Costs of special equipment for mixing and storage of specialty products. • Higher direct labor costs because most specialty prescriptions must be prepared in the pharmacy, whereas the
manual activities to fill traditional prescription are mainly limited to counting pills (or vials, etc.) and printing and affixing the label.
• There is often inconsistency in the manner in which prescriptions are counted in specialty pharmacies. A specialty pharmacy may mix and deliver many “dispensings” of a daily intravenous, home infusion or blood factor product from a single prescription, counting it in their records as only one prescription. This results in dispensing costs being spread over a number of prescriptions that is smaller than if the pharmacy had counted each refill as an additional prescription.
This latter factor, in particular, can have a dramatic impact on increasing a pharmacy’s calculated cost per prescription.
20
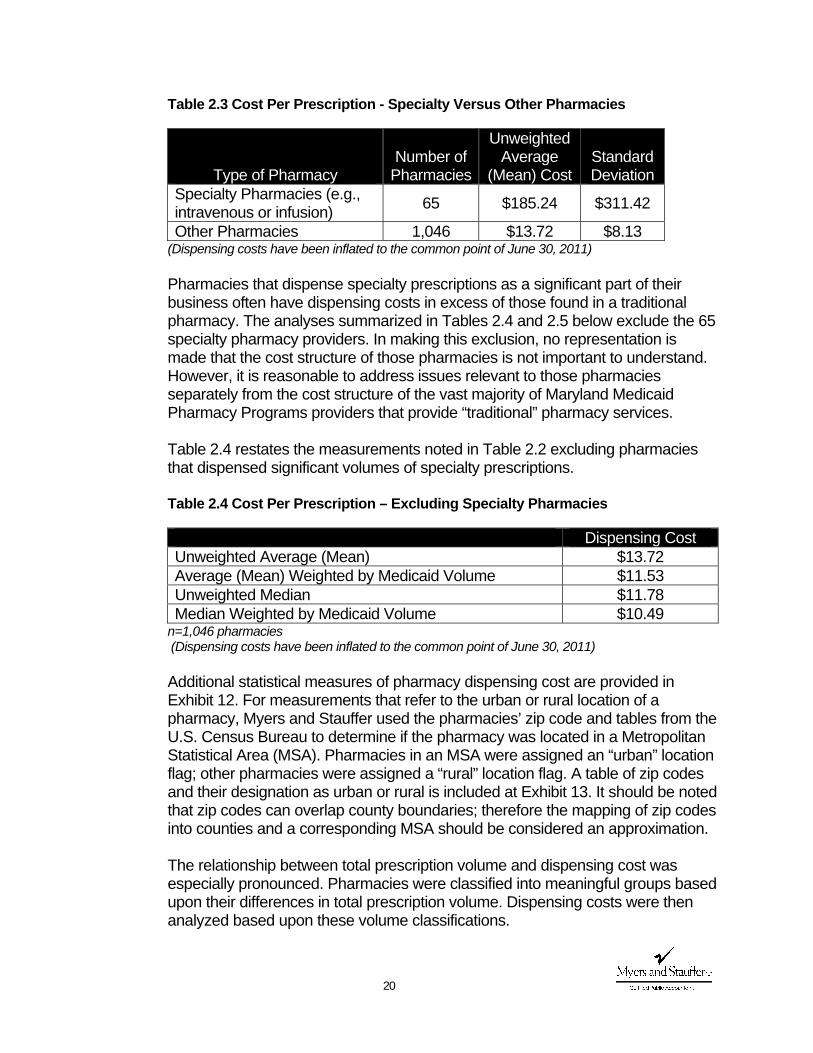
Table 2.3 Cost Per Prescription - Specialty Versus Other Pharmacies
Type of Pharmacy Number of
Pharmacies
Unweighted Average
(Mean) Cost Standard Deviation
Specialty Pharmacies (e.g., intravenous or infusion) 65 $185.24 $311.42
Other Pharmacies 1,046 $13.72 $8.13 (Dispensing costs have been inflated to the common point of June 30, 2011) Pharmacies that dispense specialty prescriptions as a significant part of their business often have dispensing costs in excess of those found in a traditional pharmacy. The analyses summarized in Tables 2.4 and 2.5 below exclude the 65 specialty pharmacy providers. In making this exclusion, no representation is made that the cost structure of those pharmacies is not important to understand. However, it is reasonable to address issues relevant to those pharmacies separately from the cost structure of the vast majority of Maryland Medicaid Pharmacy Programs providers that provide “traditional” pharmacy services. Table 2.4 restates the measurements noted in Table 2.2 excluding pharmacies that dispensed significant volumes of specialty prescriptions. Table 2.4 Cost Per Prescription – Excluding Specialty Pharmacies
Dispensing Cost Unweighted Average (Mean) $13.72 Average (Mean) Weighted by Medicaid Volume $11.53 Unweighted Median $11.78 Median Weighted by Medicaid Volume $10.49
n=1,046 pharmacies (Dispensing costs have been inflated to the common point of June 30, 2011) Additional statistical measures of pharmacy dispensing cost are provided in Exhibit 12. For measurements that refer to the urban or rural location of a pharmacy, Myers and Stauffer used the pharmacies’ zip code and tables from the U.S. Census Bureau to determine if the pharmacy was located in a Metropolitan Statistical Area (MSA). Pharmacies in an MSA were assigned an “urban” location flag; other pharmacies were assigned a “rural” location flag. A table of zip codes and their designation as urban or rural is included at Exhibit 13. It should be noted that zip codes can overlap county boundaries; therefore the mapping of zip codes into counties and a corresponding MSA should be considered an approximation. The relationship between total prescription volume and dispensing cost was especially pronounced. Pharmacies were classified into meaningful groups based upon their differences in total prescription volume. Dispensing costs were then analyzed based upon these volume classifications.
21
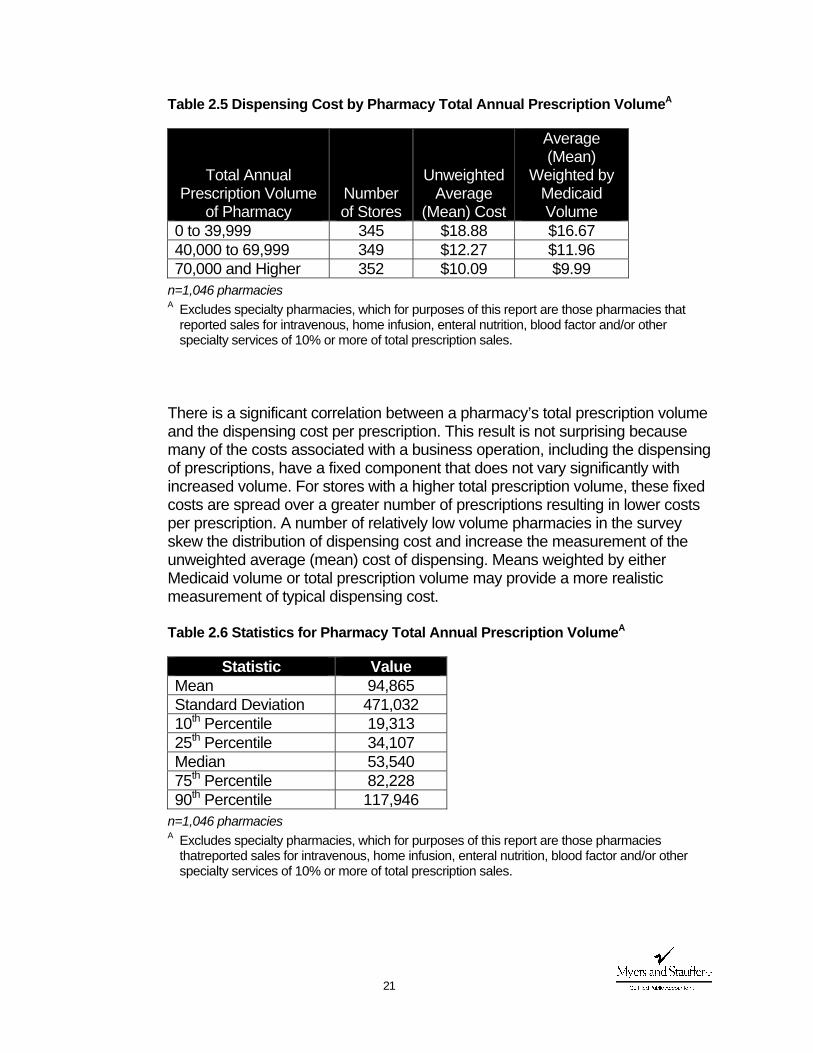
Table 2.5 Dispensing Cost by Pharmacy Total Annual Prescription VolumeA
Total Annual Prescription Volume
of Pharmacy Number of Stores
Unweighted Average
(Mean) Cost
Average (Mean)
Weighted by Medicaid Volume
0 to 39,999 345 $18.88 $16.67 40,000 to 69,999 349 $12.27 $11.96 70,000 and Higher 352 $10.09 $9.99
n=1,046 pharmacies
A Excludes specialty pharmacies, which for purposes of this report are those pharmacies that reported sales for intravenous, home infusion, enteral nutrition, blood factor and/or other specialty services of 10% or more of total prescription sales.
There is a significant correlation between a pharmacy’s total prescription volume and the dispensing cost per prescription. This result is not surprising because many of the costs associated with a business operation, including the dispensing of prescriptions, have a fixed component that does not vary significantly with increased volume. For stores with a higher total prescription volume, these fixed costs are spread over a greater number of prescriptions resulting in lower costs per prescription. A number of relatively low volume pharmacies in the survey skew the distribution of dispensing cost and increase the measurement of the unweighted average (mean) cost of dispensing. Means weighted by either Medicaid volume or total prescription volume may provide a more realistic measurement of typical dispensing cost. Table 2.6 Statistics for Pharmacy Total Annual Prescription VolumeA
Statistic Value Mean 94,865 Standard Deviation 471,032 10th Percentile 19,313 25th Percentile 34,107 Median 53,540 75th Percentile 82,228 90th Percentile 117,946
n=1,046 pharmacies
A Excludes specialty pharmacies, which for purposes of this report are those pharmacies thatreported sales for intravenous, home infusion, enteral nutrition, blood factor and/or other specialty services of 10% or more of total prescription sales.
22
A histogram of pharmacy total annual prescription volume and a scatter-plot of the relationship between dispensing cost per prescription and total prescription volume are included in Exhibit 14.
Several pharmacy attributes were collected on the cost survey. A summary of these attributes is provided at Exhibit 15.
Components of Dispensing Cost
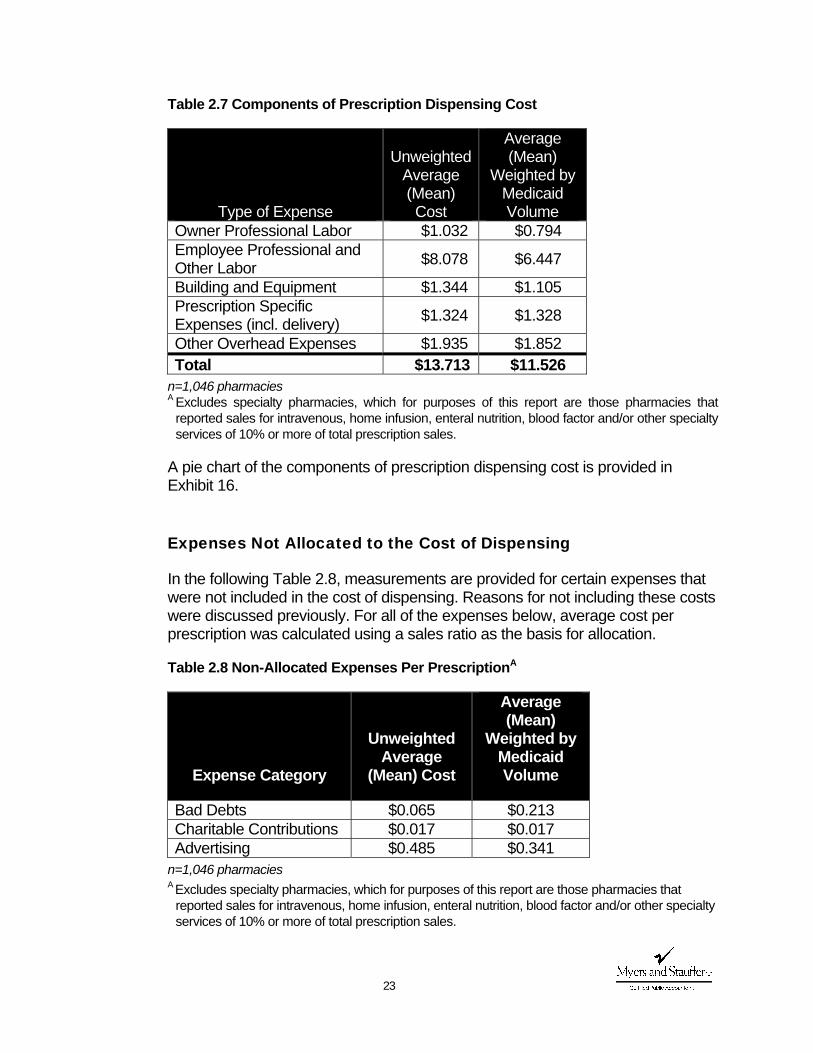
The dispensing cost of the surveyed pharmacies was broken down into the various components of overhead and labor related costs. Table 2.7 displays the means of the various cost components for pharmacies in the sample. Labor-related expenses accounted for approximately 60% to 70% of overall prescription disensing costs. Expenses in Table 2.7 are classified as follows:
Owner professional labor – owner’s labor costs were subject to constraints in
recognition of its special circumstances as previously noted. Employee professional labor consists of employee pharmacists. Other labor
includes the cost of delivery persons, interns, technicians, clerks and any other employee with time spent performing the prescription dispensing function of the pharmacy.
Building and equipment expense includes depreciation, rent, building ownership costs, repairs, utilities and any other expenses related to building and equipment.
Prescription-specific expense includes pharmacist-related dues and subscriptions, prescription containers and labels, prescription-specific computer expenses, prescription-specific delivery expenses (other than direct labor costs) and any other expenses that are specific to the prescription dispensing function of the pharmacy.
Other overhead expenses consist of all other expenses that were allocated to the prescription dispensing function of the pharmacy including interest, insurance, telephone, and legal and professional fees.
23
Table 2.7 Components of Prescription Dispensing Cost
Type of Expense
Unweighted Average (Mean) Cost
Average (Mean)
Weighted by Medicaid Volume
Owner Professional Labor $1.032 $0.794 Employee Professional and Other Labor $8.078 $6.447
Building and Equipment $1.344 $1.105 Prescription Specific Expenses (incl. delivery) $1.324 $1.328
Other Overhead Expenses $1.935 $1.852 Total $13.713 $11.526
n=1,046 pharmacies
A Excludes specialty pharmacies, which for purposes of this report are those pharmacies that reported sales for intravenous, home infusion, enteral nutrition, blood factor and/or other specialty services of 10% or more of total prescription sales.
A pie chart of the components of prescription dispensing cost is provided in Exhibit 16. Expenses Not Allocated to the Cost of Dispensing
In the following Table 2.8, measurements are provided for certain expenses that were not included in the cost of dispensing. Reasons for not including these costs were discussed previously. For all of the expenses below, average cost per prescription was calculated using a sales ratio as the basis for allocation.
Table 2.8 Non-Allocated Expenses Per PrescriptionA
Expense Category
Unweighted Average
(Mean) Cost
Average (Mean)
Weighted by Medicaid Volume
Bad Debts $0.065 $0.213 Charitable Contributions $0.017 $0.017 Advertising $0.485 $0.341
n=1,046 pharmacies
A Excludes specialty pharmacies, which for purposes of this report are those pharmacies that reported sales for intravenous, home infusion, enteral nutrition, blood factor and/or other specialty services of 10% or more of total prescription sales.
24
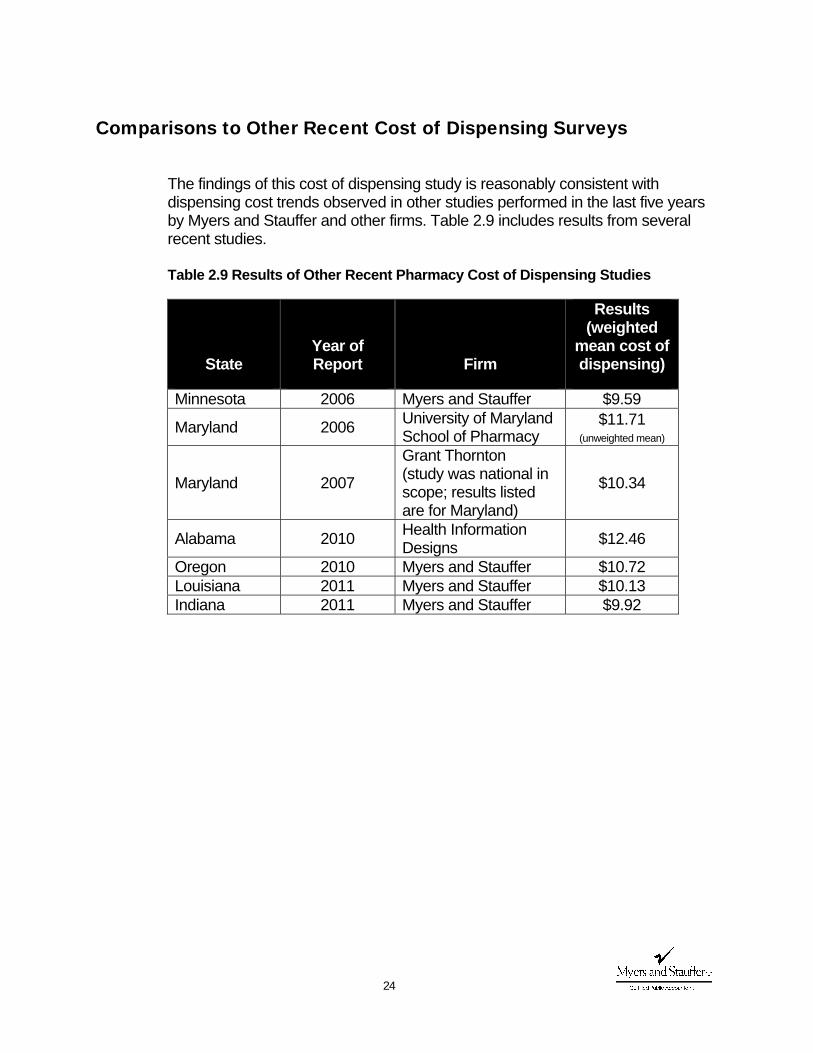
Comparisons to Other Recent Cost of Dispensing Surveys
The findings of this cost of dispensing study is reasonably consistent with dispensing cost trends observed in other studies performed in the last five years by Myers and Stauffer and other firms. Table 2.9 includes results from several recent studies. Table 2.9 Results of Other Recent Pharmacy Cost of Dispensing Studies
State Year of Report Firm
Results (weighted
mean cost of dispensing)
Minnesota 2006 Myers and Stauffer $9.59
Maryland 2006 University of Maryland School of Pharmacy
$11.71 (unweighted mean)
Maryland 2007
Grant Thornton (study was national in scope; results listed are for Maryland)
$10.34
Alabama 2010 Health Information Designs $12.46
Oregon 2010 Myers and Stauffer $10.72 Louisiana 2011 Myers and Stauffer $10.13 Indiana 2011 Myers and Stauffer $9.92
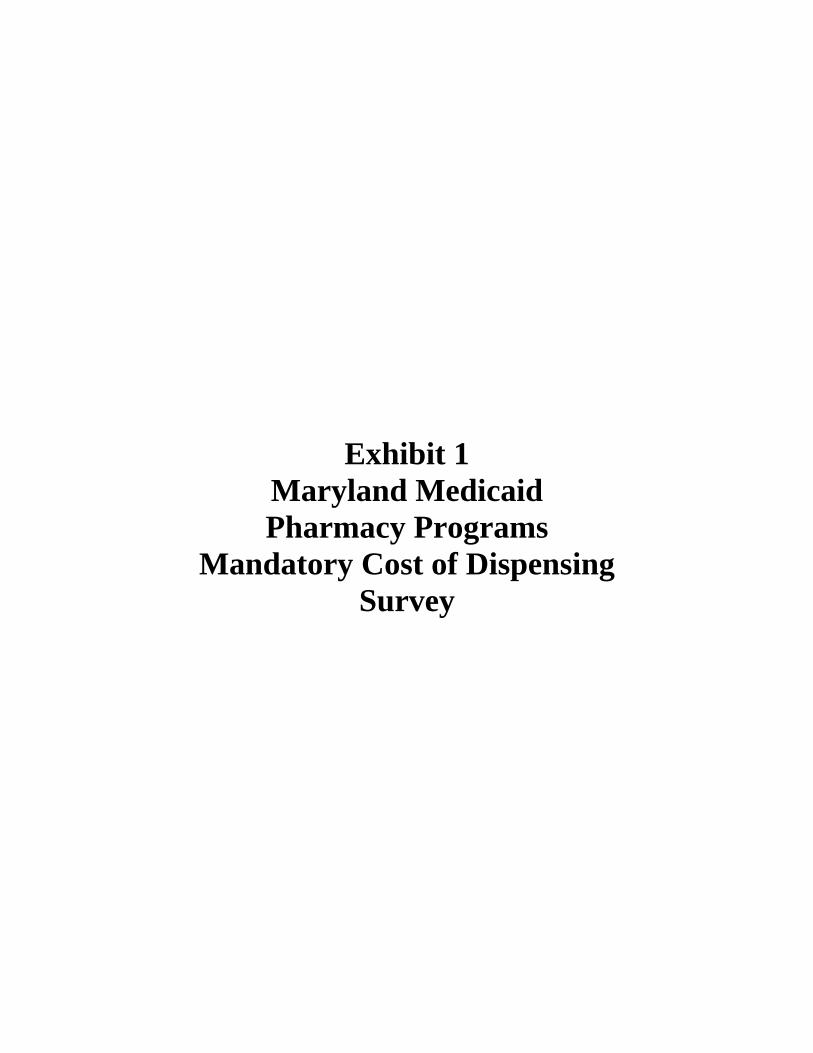
Exhibit 1 Maryland Medicaid Pharmacy Programs
Mandatory Cost of Dispensing Survey

M&S Use Only Prov. No. (NPI)
ROUND ALL AMOUNTS TO NEAREST DOLLAR OR WHOLE NUMBERComplete and return by July 15, 2011Instructions are enclosed. Call toll free (800) 374‐6858 or e‐mail [email protected] if you have any questions.
Telephone No. ( )
Fax No. ( )
City County State Zip Code
DECLARATION BY OWNER AND PREPARER
Name of Pharmacy
Street Address
I declare that I have examined this cost report including accompanying schedules and statements, and to the best of my knowledge and belief, it is true, correct, complete, and in agreement with the related financial
Return Completed Forms to:Myers and Stauffer LC11440 Tomahawk Creek ParkwayLeawood, Kansas 66211
© Myers and Stauffer LC, 2011
Your Signature Print/Type Name Title/Position Date
Preparer's Signature (other than owner) Title/Position Date
Preparer's Street Address City and State Zip Phone Number
SECTION IA ‐‐ PHARMACY ATTRIBUTESAll Pharmacies should complete lines (a) through (k).
List the total number of all prescriptions dispensed during the fiscal year as follows:
1. New 2. Refill 3. Total
What is the approximate percentage of prescriptions dispensed for the following classifications?1. Medicaid Fee for Service_____% 2. Medicaid Managed Care _______%3. Other 3rd Party _______% 4. Cash _______%What is the approximate percentage of payments received from the following classifications?1. Medicaid Fee for Service_____% 2. Medicaid Managed Care _______%3. Other 3rd Party _______% 4. Cash _______%Ownership Affiliation1. □ Independent (1 to 3 units) 2. □ Chain (4 or more units)3. □ Institutional (service to LTC facilities only) 4. □ Other (specify) _____________________________Type of Ownership1. □ Individual 2. □ Corporation 3. □ Partnership 4. □ Other (specify) ________(d)
(a)
(b)
(c)
I declare that I have examined this cost report including accompanying schedules and statements, and to the best of my knowledge and belief, it is true, correct, complete, and in agreement with the related financial statements or federal income tax return, except as explained in the reconciliation. Declaration of preparer (other than owner) is based on all information of which preparer has any knowledge.
© Myers and Stauffer LC, 2011

MARYLAND MEDICAID PHARMACY PROGRAMS MANDATORY COST OF DISPENSING SURVEY
Page 2Location1. □ Medical Office Building 2. □ Shopping Center3. □ Stand Alone Building 4. □ Grocery Store / Mass Merchant5. □ Hospital Outpatient Dept. 6. □ Other (specify) _________Does your pharmacy purchase drugs through the 340B Drug Pricing Program?1. □ Yes 2. □ NoIf yes, are prescriptions dispensed through the Maryland Medicaid Pharmacy Program provided through340B inventory?1. □ Yes 2. □ No
1. □ Yes 2. □ No(h) How many hours per week is your pharmacy open? ___________ Hours(i) How many years has a pharmacy operated at this location? _____________ Years(j) Do you provide 24‐hour emergency services for pharmaceuticals? 1. □ Yes 2. □ No(k) What percentage of prescriptions dispensed were generic products?_______%
(l)Do you dispense in anything other than traditional packaging to long‐term care facilities?If yes, indicate how:1. □ Unit Dose 2. □ Modified Unit Dose (Bingo cards/blister packs)3. □ Both 4. □ No Unit DoseWhat is the approximate percent of all prescriptions dispensed in unit dose packaging? __________%If you checked box 1, 2, or 3 of (m), what percent of unit dose packaging is:1. Purchased from manufacturers _____% 2. Prepared in the pharmacy _______%
Do you own your building or lease from a related party (i.e., yourself, family member, or related corporation)? If so, mark yes and refer to special instructions for reporting building rent.
(e)
(g)
(f)
(m)
What is the approximate percent of your prescriptions dispensed to long‐term care facilities?________%
If your pharmacy dispenses prescriptions to long‐term care facilities, complete lines (l) through (n).
If h id d li i lt di i l t li ( ) th h ( )
(n)
© Myers and Stauffer LC, 2011
(o) What percent of total prescriptions filled are delivered? ______________%(p) What percent of Medicaid prescriptions filled are delivered? ______________%
Does your pharmacy deliver prescriptions by mail (U.S. Postal Service, FedEx, UPS, etc.)? 1. □ Yes 2. □ NoIf yes, what is the approximate percentage of the total number of prescriptions that are deliveredby mail? ________%
1. □ Yes 2. □ NoIf yes, what is the dollar amount of your sales for IV / infusion Rxs $_________________,enteral nutrition Rxs $_________________ blood factors or derivatives $_________________other specialty products or services $_________________ specify other products or services ______________What is the approximate percent of your prescriptions dispensed that are compounded? ________%For prescriptions that are compounded, what is the average number of minutes spentpreparing a prescription? ___________
SECTION IB ‐‐ OTHER INFORMATION
(s)
(q)
If your pharmacy provides delivery, specialty or compounding services, complete lines (o) through (s) as applicable.
Are you presently providing specialty products or services (e.g., IV, infusion, enteral nutrition, blood factors or derivatives)?
(r)
List any additional information you feel contributes significantly to your cost of filling a prescription. Attach additional pages if needed.
© Myers and Stauffer LC, 2011
MARYLAND MEDICAID PHARMACY PROGRAMS MANDATORY COST OF DISPENSING SURVEY
ROUND ALL AMOUNTS TO NEAREST DOLLAR OR WHOLE NUMBER Page 3
SECTION IIA ‐‐ SALES AND FLOOR SPACE
Line No.
Sales (Excluding Sales Tax) (1)
Cost of Goods Sold (2)
Floor Space (Retail area only). Measure. Do not estimate. Sq. Ft Sq. Ft. (3)
SECTION IIB ‐‐ OVERHEAD EXPENSES
The following information is from fiscal / tax year ending……………………….. _____ /_____ /_____ (4)
2010 Tax Form Number
1040C
1065
1120
1120S Total
Expense
Myers and Stauffer Use
Only Line No.
13 16a 20 14 Depreciation (this fiscal year only ‐ not accumulated)………… (5)
23 14 17 12 Taxes (a) Personal Property Taxes Paid……………………………… (6a)
(b) Real Estate Taxes………………………………………………….. (6b)
(c) Payroll Taxes…………………………………………………….... (6c)
(d) Sales Tax (6d)
(e) State Income Tax (Corporations Only)……………….. (6e)
(6f)
Total Store Including Prescription Drugs
Prescription Drugs Only
Complete this section using your internal financial statement or tax return. If you are using a tax return, please refer to the line numbers in the left columns that correspond to federal income tax return lines.
(f) Any other taxes (specify each type and amount)………………………………………………………………….
© Myers and Stauffer LC, 2011
(6f)
20b 13 16 11 Rent (a) Building Rent (See Instructions)………………………….. (7a)
20a 13 16 11 (b) Equipment and Other……………………………………………… (7b)
21 11 14 9 Repairs……………………………………………………………………………………………… (8)
15 20 26 19 Insurance (a) Workers Comp. and Employee Medical……….. (9a)
15 20 26 19 (b) Other………………………………………………………………….. (9b)
16a&b 15 18 13 Interest……………………………………………………………………………………………… (10)
17 20 26 19 Legal and Professional Fees……………………………………………………….. (11)
27 20 26 19 Dues and Publications………………………………………………………………….. (12)
27 12 15 10 Bad Debts (this fiscal year only ‐ not accumulated)…………………. (13)
19 Charitable Contributions (Corporations Only) (14)
25 20 26 19 Utilities (a) Telephone ……………………………………………………………… (15)
25 20 26 19 (16)
18&22 20 26 19 (17)
8 20 22 16 Advertising ………………………………………………………………………………………. (18)
27 20 26 19 Computer Expenses …………………………………………………………………………… (19)
9,27 20 26 19 Rx Delivery Expenses ………………………………………………………………………… (20)
27 20 26 19 Rx Containers and Labels (See Instructions) (21)
Operating and Office Supplies (Exclude Rx containers and labels) ………………………………………………………………………………………
amount)………………………………………………………………….
(b) Heat, Water, Lights, Sewer, Trash and other Utilities ……………………………………………………
© Myers and Stauffer LC, 2011
MARYLAND MEDICAID PHARMACY PROGRAMS MANDATORY COST OF DISPENSING SURVEY
Page 4Other non‐labor expenses not included elsewhere
Total Expense
Myers and Stauffer Use
Only Line No.
(a)____________________________________________________________________ (22a)
(b)____________________________________________________________________ (22b)
(c)____________________________________________________________________ (22c)
(d)____________________________________________________________________ (22d)
(e)____________________________________________________________________ (22e)
(f)____________________________________________________________________ (22f)
(g)____________________________________________________________________ (22g)
Examples: Security, janitorial, bank fees, credit card fees, franchise fees, switching fees, e‐prescribing transaction fees, accreditation fees, continuing education, restocking fees, postage, robotics expenses, etc.
© Myers and Stauffer LC, 2011
(h)____________________________________________________________________ (22h)
(i)____________________________________________________________________ (22i)
(j)____________________________________________________________________ (22j)
(k)____________________________________________________________________ (22k)
(l)____________________________________________________________________ (22l)
(m)____________________________________________________________________ (22m)
(n)____________________________________________________________________ (22n)
(o)____________________________________________________________________ (22o)
(p)____________________________________________________________________ (22p)
(q)____________________________________________________________________ (22q)
(r)____________________________________________________________________ (22r)
Total Overhead Expenses [Add Line (5) through Line (22)] (23)© Myers and Stauffer LC, 2011
MARYLAND MEDICAID PHARMACY PROGRAMS MANDATORY COST OF DISPENSING SURVEY
SECTION IIC ‐‐ PERSONNEL COSTS ‐‐ List each person separately (except Line 4). Attach schedule if necessary. Page 5
Average Weekly Hours
Check if RPh
Estimate Percent of
Rxs Dispensed by Each RPh
Annual Salaries, Bonuses and/or Drawings
No. Weeks Employed This Fiscal
Year
Total Store Including Rx Dept.
Rx Dispensing Related Duties
Only *Line No.
(a) (1a)
(b) (1b)
(c) (1c)
(d) (1d)
(e) (1e)
(a) (2a)
(b) (2b)
(c) (2c)
(d) (2d)
(e) (2e)
(f) (2f)
(g) (2g)
(h) (2h)
(i) (2i)
(j) (2j)
Subtotal: 100% XXXXX XXXXX XXXXX XXXXX (2k)
(a) XXX XXXXXXXXX (3a)
(b) XXX XXXXXXXXX (3b)
(c) XXX XXXXXXXXX (3c)
(d) XXX XXXXXXXXX (3d)
(e) XXX XXXXXXXXX (3e)
(f) XXX XXXXXXXXX (3f)
(g) XXX XXXXXXXXX (3g)
(h) XXX XXXXXXXXX (3h)
(4)
(5)
(6)
TOTAL ‐ Salaries and Benefits (7)
* For purposes of this survey, time associated with the performance of Medication Therapy Management (MTM) activities should not be considered "dispensing related duties".
Other Employee Benefits
Owners, Individual Proprietors, Partners, and Stockholders
Employee and Relief Pharmacists
Other Employees with Time in Rx Dept. (including technicians, delivery personnel, etc.)
All Non‐Rx Employee Salaries
Pension, Profit‐sharing etc.
© Myers and Stauffer LC, 2011
MARYLAND MEDICAID PHARMACY PROGRAMS MANDATORY COST OF DISPENSING SURVEY
Page 6
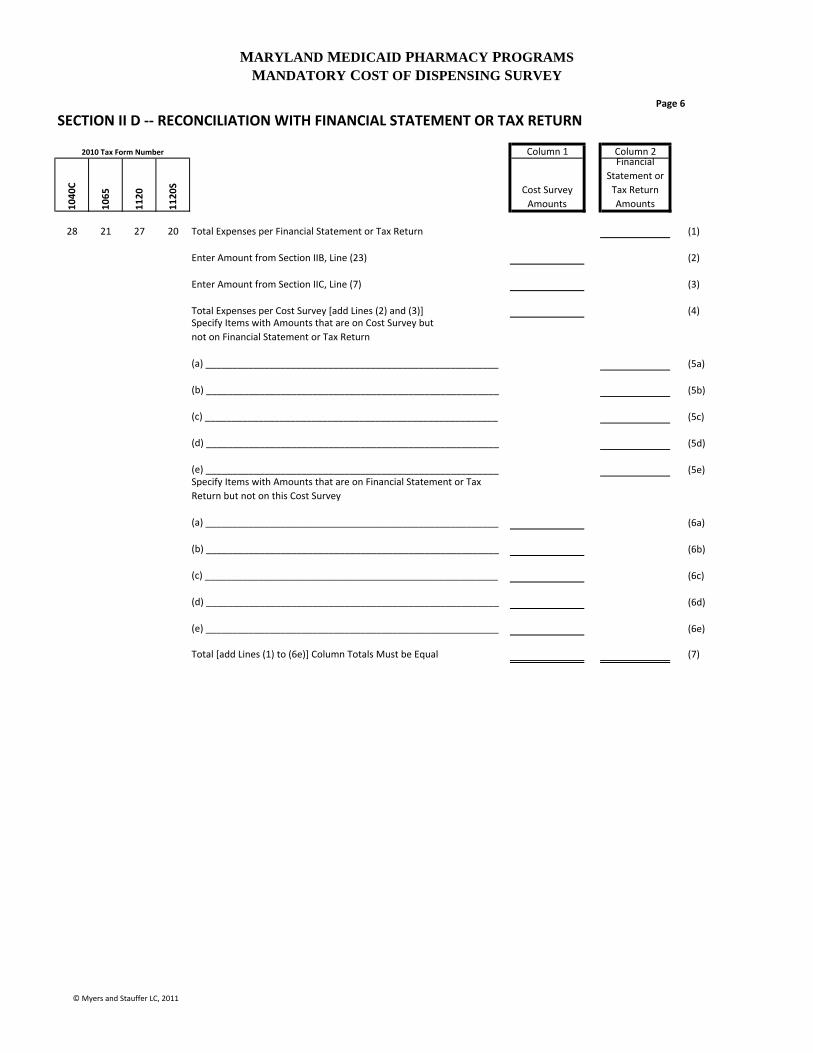
SECTION II D ‐‐ RECONCILIATION WITH FINANCIAL STATEMENT OR TAX RETURN
2010 Tax Form Number
1040
C
1065
1120
1120
S
28 21 27 20 Total Expenses per Financial Statement or Tax Return (1)
Enter Amount from Section IIB, Line (23) (2)
Enter Amount from Section IIC, Line (7) (3)
Total Expenses per Cost Survey [add Lines (2) and (3)] (4)
(5a)
(5b)
(5c)
(5d)
(5e)
(6a)
(6b)
(6c)
(6d)
(6e)
(7)
Column 1 Column 2
Cost Survey Amounts
Financial Statement or Tax Return Amounts
Specify Items with Amounts that are on Cost Survey but not on Financial Statement or Tax Return
(c) _______________________________________________________
(b) _______________________________________________________
(c) _______________________________________________________
(d) _______________________________________________________
(a) _______________________________________________________
(e) _______________________________________________________Specify Items with Amounts that are on Financial Statement or Tax Return but not on this Cost Survey
(a) _______________________________________________________
(b) _______________________________________________________
(d) _______________________________________________________
(e) _______________________________________________________
Total [add Lines (1) to (6e)] Column Totals Must be Equal
© Myers and Stauffer LC, 2011
Exhibit 2 Maryland Medicaid Pharmacy Programs
Mandatory Cost of Dispensing Survey Instructions
Survey forms by Myers and Stauffer LC
Page 16/2011
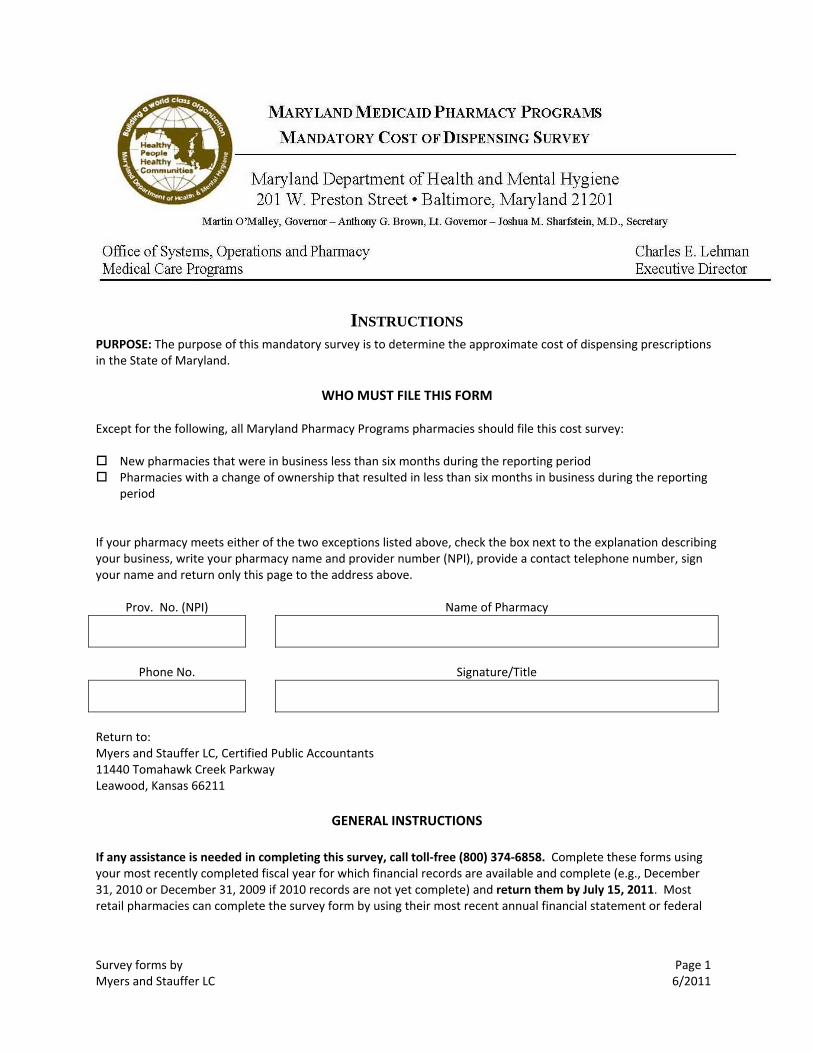
INSTRUCTIONS PURPOSE: The purpose of this mandatory survey is to determine the approximate cost of dispensing prescriptions in the State of Maryland.
WHO MUST FILE THIS FORM
Except for the following, all Maryland Pharmacy Programs pharmacies should file this cost survey:
New pharmacies that were in business less than six months during the reporting period Pharmacies with a change of ownership that resulted in less than six months in business during the reporting period
If your pharmacy meets either of the two exceptions listed above, check the box next to the explanation describing your business, write your pharmacy name and provider number (NPI), provide a contact telephone number, sign your name and return only this page to the address above.
Prov. No. (NPI) Name of Pharmacy
Phone No. Signature/Title
Return to: Myers and Stauffer LC, Certified Public Accountants 11440 Tomahawk Creek Parkway Leawood, Kansas 66211
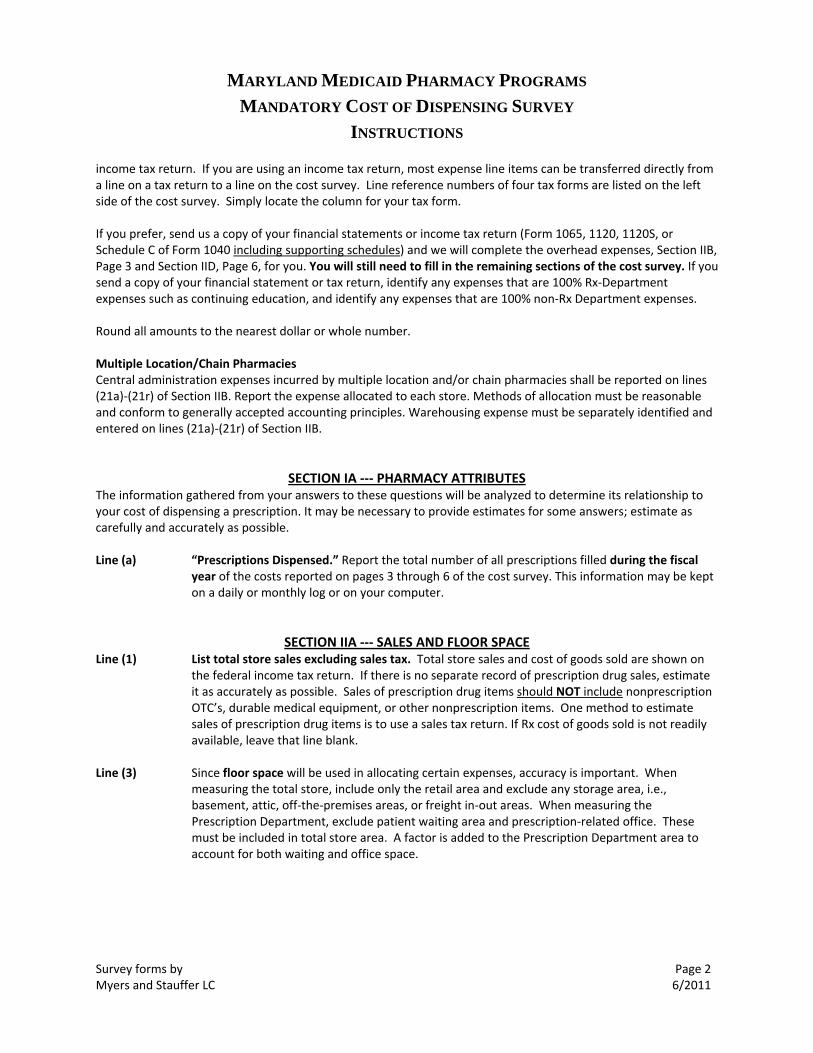
GENERAL INSTRUCTIONS
If any assistance is needed in completing this survey, call toll‐free (800) 374‐6858. Complete these forms using your most recently completed fiscal year for which financial records are available and complete (e.g., December 31, 2010 or December 31, 2009 if 2010 records are not yet complete) and return them by July 15, 2011. Most retail pharmacies can complete the survey form by using their most recent annual financial statement or federal
MARYLAND MEDICAID PHARMACY PROGRAMS
MANDATORY COST OF DISPENSING SURVEY INSTRUCTIONS
Survey forms by Myers and Stauffer LC
Page 26/2011
income tax return. If you are using an income tax return, most expense line items can be transferred directly from a line on a tax return to a line on the cost survey. Line reference numbers of four tax forms are listed on the left side of the cost survey. Simply locate the column for your tax form. If you prefer, send us a copy of your financial statements or income tax return (Form 1065, 1120, 1120S, or Schedule C of Form 1040 including supporting schedules) and we will complete the overhead expenses, Section IIB, Page 3 and Section IID, Page 6, for you. You will still need to fill in the remaining sections of the cost survey. If you send a copy of your financial statement or tax return, identify any expenses that are 100% Rx‐Department expenses such as continuing education, and identify any expenses that are 100% non‐Rx Department expenses. Round all amounts to the nearest dollar or whole number. Multiple Location/Chain Pharmacies Central administration expenses incurred by multiple location and/or chain pharmacies shall be reported on lines (21a)‐(21r) of Section IIB. Report the expense allocated to each store. Methods of allocation must be reasonable and conform to generally accepted accounting principles. Warehousing expense must be separately identified and entered on lines (21a)‐(21r) of Section IIB.
SECTION IA ‐‐‐ PHARMACY ATTRIBUTES The information gathered from your answers to these questions will be analyzed to determine its relationship to your cost of dispensing a prescription. It may be necessary to provide estimates for some answers; estimate as carefully and accurately as possible. Line (a) “Prescriptions Dispensed.” Report the total number of all prescriptions filled during the fiscal
year of the costs reported on pages 3 through 6 of the cost survey. This information may be kept on a daily or monthly log or on your computer.
SECTION IIA ‐‐‐ SALES AND FLOOR SPACE Line (1) List total store sales excluding sales tax. Total store sales and cost of goods sold are shown on
the federal income tax return. If there is no separate record of prescription drug sales, estimate it as accurately as possible. Sales of prescription drug items should NOT include nonprescription OTC’s, durable medical equipment, or other nonprescription items. One method to estimate sales of prescription drug items is to use a sales tax return. If Rx cost of goods sold is not readily available, leave that line blank.
Line (3) Since floor space will be used in allocating certain expenses, accuracy is important. When
measuring the total store, include only the retail area and exclude any storage area, i.e., basement, attic, off‐the‐premises areas, or freight in‐out areas. When measuring the Prescription Department, exclude patient waiting area and prescription‐related office. These must be included in total store area. A factor is added to the Prescription Department area to account for both waiting and office space.
MARYLAND MEDICAID PHARMACY PROGRAMS
MANDATORY COST OF DISPENSING SURVEY INSTRUCTIONS
Survey forms by Myers and Stauffer LC
Page 36/2011
SECTION IIB ‐‐‐ OVERHEAD EXPENSES [FINANCIAL STATEMENT OR TAX RETURN CAN BE SUBSTITUTED]
Overhead costs reported on the cost survey must be resulting from arms‐length transactions between non‐related parties. Related parties include, but are not limited to, those related by family, by business or financial association, and by common ownership or control. The most common non‐arms‐length transaction involves rental of property between related parties. The only allowable expense of such transactions for cost determination purposes would be the actual costs of ownership (depreciation, taxes, interest, etc., for the store area only). The rental amount will be disallowed. Show this as a reconciling item in Section IID. Line (6a) & (6b) Personal Property Taxes and Real Estate Taxes. Include only personal property taxes or real
estate taxes paid on property used in this pharmacy’s business. Line (6c) Payroll Taxes. Include the employer’s share of Social Security, Medicare and state/federal
unemployment taxes. Line (7a) Building Rent. Include only rent that applies to the store. Report only rental expense incurred by
transactions between non‐related parties. See the first paragraph of this section for expenses allowed in lieu of rent paid to a related party.
Line (17) Operating and Office Supplies. If prescription containers and labels are included in your supplies,
exclude them from this line and show them on line (21). Line (20) Rx Delivery Expenses. If you deliver Rx items only, include expenses paid for your delivery
vehicle here, including expenses paid to a delivery service for delivery of Rx items. These expenses should not be duplicated on any other line. If your delivery vehicle is used by other departments of the pharmacy or for miscellaneous purposes, do not enter anything on this line and enter delivery expenses on line (22a)‐(22r).
Line (21) Rx Containers and Labels. The cost of prescription containers and labels should be included here
if separately identified on your financial statement or as “other deductions” on your federal income tax return. If this expense is included in cost of goods sold on your federal income tax return and if your accounting records are such that this figure is difficult to determine, leave this line blank. An allowance will be made for Rx containers and labels.
Lines (22a)‐(22r) Other Overhead Expenses. On these lines identify any non‐labor expenses not already included
on your cost survey but listed on your financial statement or as other deductions on your federal income tax return. Identify each item and the amount, rather than labeling all such expenses as "miscellaneous.” If you wish, you can simply attach a schedule that lists these expenses. Clearly label any items that are 100% Rx‐related or that are 100% non‐Rx‐related.
SECTION IIC ‐‐‐ PERSONNEL COSTS [LINES (24a)‐(30)] Lines (1a)‐(2j) Percent of Prescriptions Dispensed. Provide your best estimate of the percentage of
prescriptions dispensed by each pharmacist. Notice: This column must total line 2k (100%). Lines (1a)‐(5h) Average Weekly Hours. You may not have detailed records of where each employee worked;
however, provide your best estimate of an average or “typical” week. Report the average number of hours the employee worked per week in the “Total Store” column. The “Rx Dispensing
MARYLAND MEDICAID PHARMACY PROGRAMS
MANDATORY COST OF DISPENSING SURVEY INSTRUCTIONS
Survey forms by Myers and Stauffer LC
Page 46/2011
Related Duties Only” column shall show the average number of hours per week spent performing Rx‐related duties. Rx‐related duties are defined as time spent filling prescriptions as well as doing the related administrative work including ordering and stocking prescription ingredients, taking inventory, maintaining prescription files, third party reimbursement claims management and delivering prescriptions. For purposes of this survey, time associated with the performance of Medication Therapy Management (MTM) activities should not be considered "dispensing related duties". Pharmacists providing consultation to long‐term care facilities must be identified and listed separately.
Lines (1a)‐(1e) Owners. All individual proprietors, partners, or stockholders shall list their total drawings and/or
salaries for the year. Do not show net profit as the owner’s salary but only actual drawings or salary. For those owners who took no salary or drawings, show zero to indicate you have not overlooked this line – an allowance for salary will be imputed based on time worked and/or prescriptions dispensed.
Lines (3a)‐(3h) Other Employees with Time in Rx. Dept. Rx Technicians, nonprofessional, clerical, and delivery
personnel who perform Rx‐related duties shall be listed. Line (4) All Non‐Rx Employees. List total salaries for all employees who spend no time in Rx‐related
duties. Lines (5)&(6) Pension, profit sharing etc. and Other Employee Benefits. List total expenses associated with
pension plans, retirement plans and other employee benefits not reported elsewhere. These labor‐related expenses will be allocated to employee salaries.
SECTION IID ‐‐‐ RECONCILIATION WITH FINANCIAL STATEMENT OR FEDERAL INCOME TAX RETURN
The purpose of this reconciliation is to ensure that all expenses have been included and that none have been duplicated. For example, pharmacies operating as sole proprietors will normally need to list owner’s salaries, drawings, and benefits as a reconciling item. Other examples of reconciling items are the 50% meals deduction, rent paid to related party, etc.
Exhibit 3 Letter from the
Maryland Department of Health and Mental Hygiene
for Pharmacy Cost Survey
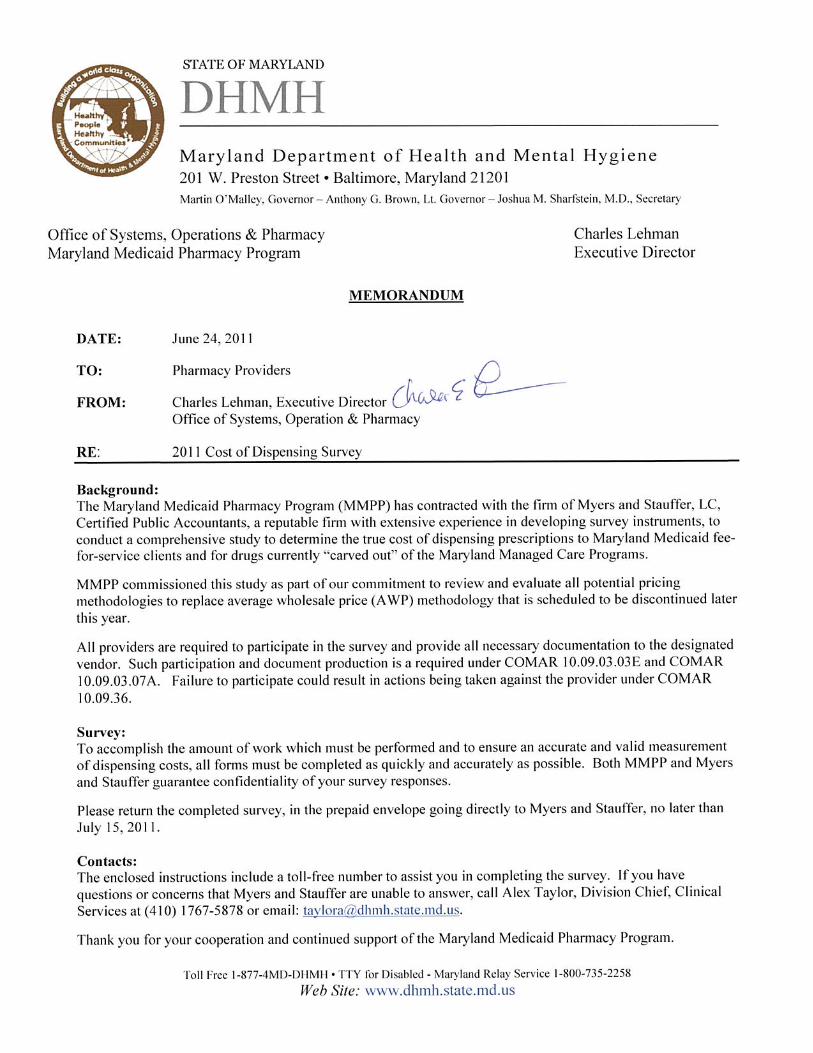
Exhibit 4a Letter from
Myers and Stauffer for Pharmacy Survey
(Independent Pharmacies)
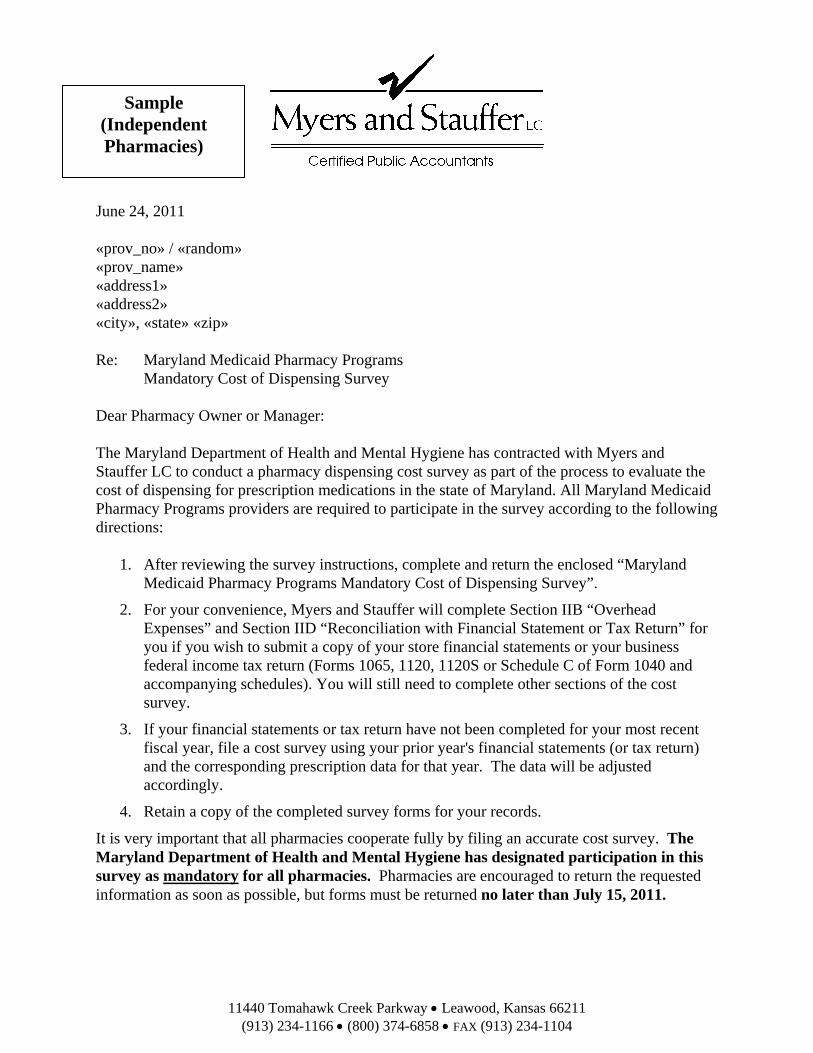
11440 Tomahawk Creek Parkway • Leawood, Kansas 66211 (913) 234-1166 • (800) 374-6858 • FAX (913) 234-1104
June 24, 2011 «prov_no» / «random» «prov_name» «address1» «address2» «city», «state» «zip» Re: Maryland Medicaid Pharmacy Programs
Mandatory Cost of Dispensing Survey Dear Pharmacy Owner or Manager: The Maryland Department of Health and Mental Hygiene has contracted with Myers and Stauffer LC to conduct a pharmacy dispensing cost survey as part of the process to evaluate the cost of dispensing for prescription medications in the state of Maryland. All Maryland Medicaid Pharmacy Programs providers are required to participate in the survey according to the following directions:
1. After reviewing the survey instructions, complete and return the enclosed “Maryland Medicaid Pharmacy Programs Mandatory Cost of Dispensing Survey”.
2. For your convenience, Myers and Stauffer will complete Section IIB “Overhead Expenses” and Section IID “Reconciliation with Financial Statement or Tax Return” for you if you wish to submit a copy of your store financial statements or your business federal income tax return (Forms 1065, 1120, 1120S or Schedule C of Form 1040 and accompanying schedules). You will still need to complete other sections of the cost survey.
3. If your financial statements or tax return have not been completed for your most recent fiscal year, file a cost survey using your prior year's financial statements (or tax return) and the corresponding prescription data for that year. The data will be adjusted accordingly.
4. Retain a copy of the completed survey forms for your records.
It is very important that all pharmacies cooperate fully by filing an accurate cost survey. The Maryland Department of Health and Mental Hygiene has designated participation in this survey as mandatory for all pharmacies. Pharmacies are encouraged to return the requested information as soon as possible, but forms must be returned no later than July 15, 2011.
Sample (Independent Pharmacies)

Maryland Medicaid Pharmacy Programs Mandatory Cost of Dispensing Survey June 24, 2011 Page 2 of 2 Send completed forms to: Myers and Stauffer LC Certified Public Accountants 11440 Tomahawk Creek Parkway
Leawood, Kansas 66211 You may return the survey using the enclosed Business Reply Label with any envelope. Postage will be paid by Myers and Stauffer. It is very important that pharmacies respond with accurate information. All submitted surveys must be reviewed and validated by staff at Myers and Stauffer. If our review yields the need for additional inquiries, Myers and Stauffer staff will contact you. Additionally, Myers and Stauffer staff will be performing additional review procedures for a limited number of pharmacies to validate survey responses. If your pharmacy is selected for additional procedures, you will be contacted by Myers and Stauffer and you will be required to submit additional documentation in support of the information reported on the survey. If you have any questions, please call toll free at 1-800-374-6858 or send an e-mail to [email protected]. Your cooperation in providing the information for this survey is greatly appreciated. Sincerely,
T. Allan Hansen Project Manager [email protected]
Exhibit 4b Letter from
Myers and Stauffer for Pharmacy Survey (Chain Pharmacies)
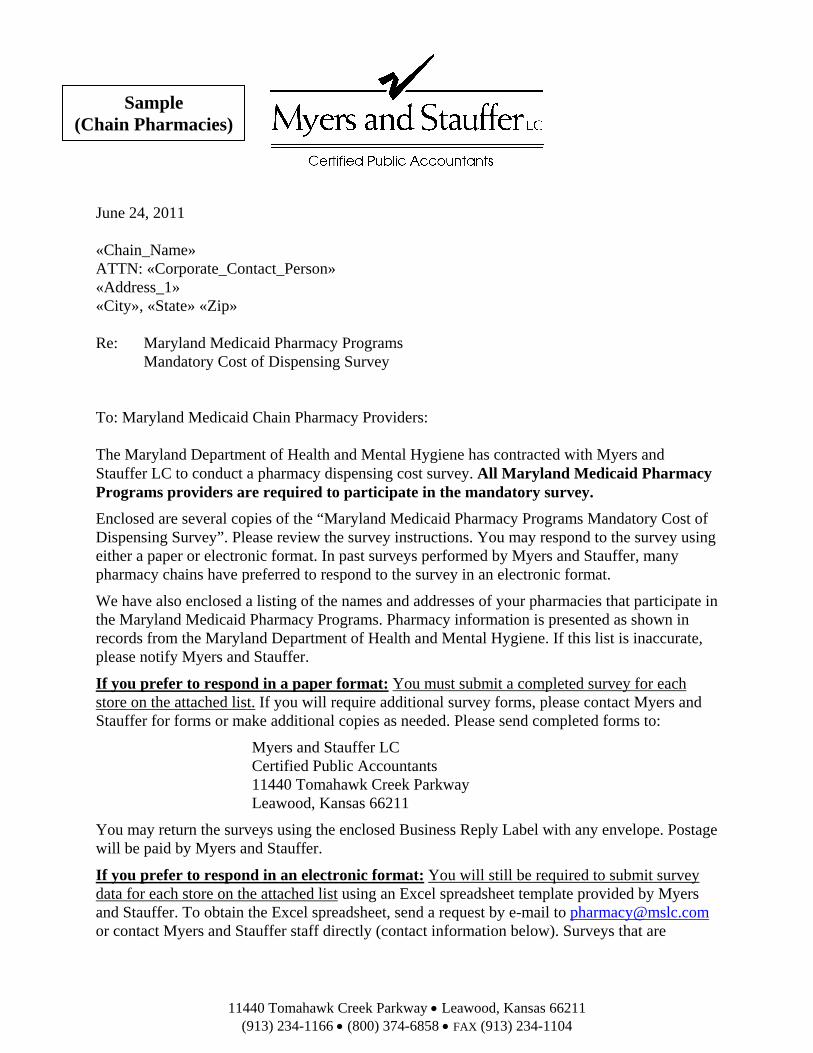
11440 Tomahawk Creek Parkway • Leawood, Kansas 66211 (913) 234-1166 • (800) 374-6858 • FAX (913) 234-1104
June 24, 2011 «Chain_Name» ATTN: «Corporate_Contact_Person» «Address_1» «City», «State» «Zip» Re: Maryland Medicaid Pharmacy Programs
Mandatory Cost of Dispensing Survey To: Maryland Medicaid Chain Pharmacy Providers: The Maryland Department of Health and Mental Hygiene has contracted with Myers and Stauffer LC to conduct a pharmacy dispensing cost survey. All Maryland Medicaid Pharmacy Programs providers are required to participate in the mandatory survey.
Enclosed are several copies of the “Maryland Medicaid Pharmacy Programs Mandatory Cost of Dispensing Survey”. Please review the survey instructions. You may respond to the survey using either a paper or electronic format. In past surveys performed by Myers and Stauffer, many pharmacy chains have preferred to respond to the survey in an electronic format.
We have also enclosed a listing of the names and addresses of your pharmacies that participate in the Maryland Medicaid Pharmacy Programs. Pharmacy information is presented as shown in records from the Maryland Department of Health and Mental Hygiene. If this list is inaccurate, please notify Myers and Stauffer.
If you prefer to respond in a paper format: You must submit a completed survey for each store on the attached list. If you will require additional survey forms, please contact Myers and Stauffer for forms or make additional copies as needed. Please send completed forms to:
Myers and Stauffer LC Certified Public Accountants 11440 Tomahawk Creek Parkway Leawood, Kansas 66211
You may return the surveys using the enclosed Business Reply Label with any envelope. Postage will be paid by Myers and Stauffer.
If you prefer to respond in an electronic format: You will still be required to submit survey data for each store on the attached list using an Excel spreadsheet template provided by Myers and Stauffer. To obtain the Excel spreadsheet, send a request by e-mail to [email protected] or contact Myers and Stauffer staff directly (contact information below). Surveys that are
Sample (Chain Pharmacies)
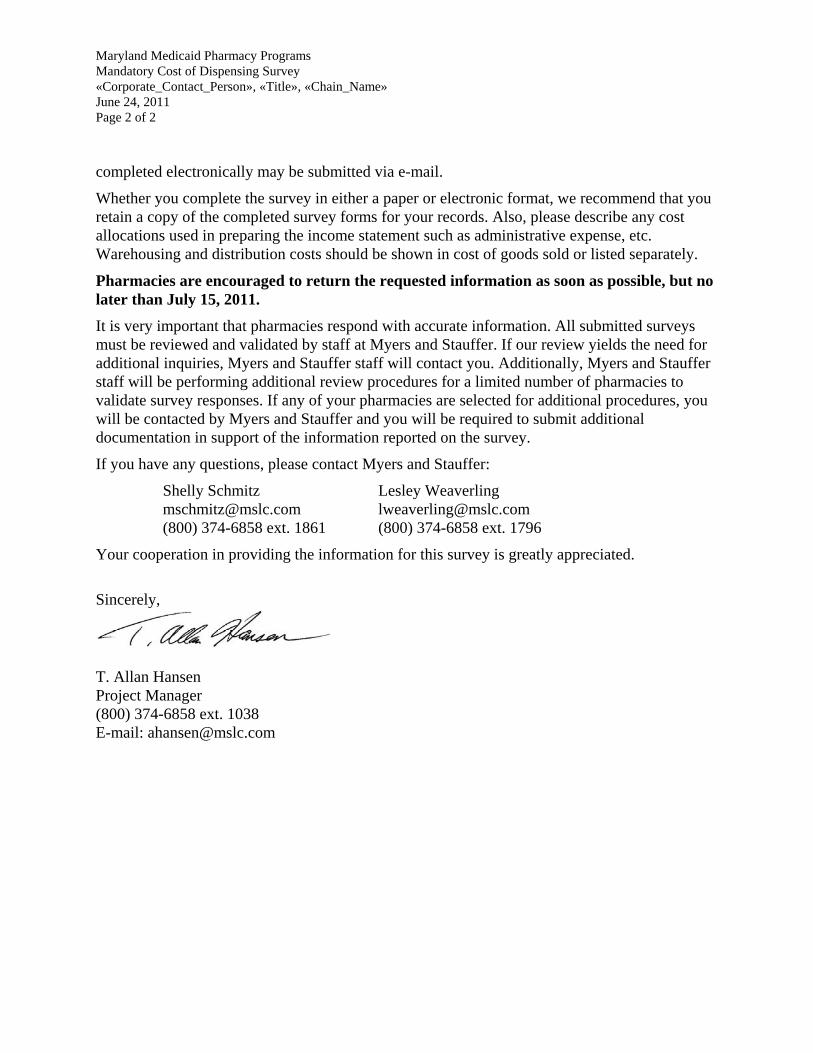
Maryland Medicaid Pharmacy Programs Mandatory Cost of Dispensing Survey «Corporate_Contact_Person», «Title», «Chain_Name» June 24, 2011 Page 2 of 2 completed electronically may be submitted via e-mail.
Whether you complete the survey in either a paper or electronic format, we recommend that you retain a copy of the completed survey forms for your records. Also, please describe any cost allocations used in preparing the income statement such as administrative expense, etc. Warehousing and distribution costs should be shown in cost of goods sold or listed separately.
Pharmacies are encouraged to return the requested information as soon as possible, but no later than July 15, 2011.
It is very important that pharmacies respond with accurate information. All submitted surveys must be reviewed and validated by staff at Myers and Stauffer. If our review yields the need for additional inquiries, Myers and Stauffer staff will contact you. Additionally, Myers and Stauffer staff will be performing additional review procedures for a limited number of pharmacies to validate survey responses. If any of your pharmacies are selected for additional procedures, you will be contacted by Myers and Stauffer and you will be required to submit additional documentation in support of the information reported on the survey.
If you have any questions, please contact Myers and Stauffer:
Shelly Schmitz [email protected] (800) 374-6858 ext. 1861
Lesley Weaverling [email protected] (800) 374-6858 ext. 1796
Your cooperation in providing the information for this survey is greatly appreciated.
Sincerely,
T. Allan Hansen Project Manager (800) 374-6858 ext. 1038 E-mail: [email protected]
Exhibit 5a First Survey
Reminder / Extension Letter (Independent Pharmacies)
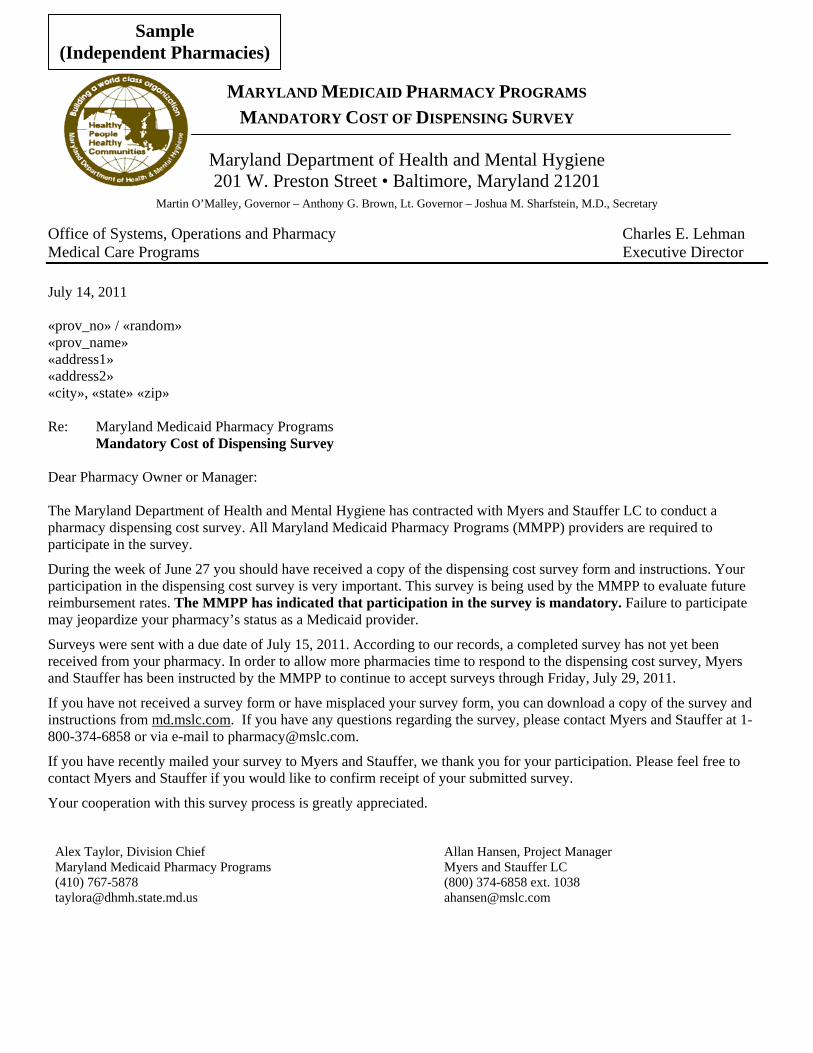
MARYLAND MEDICAID PHARMACY PROGRAMS MANDATORY COST OF DISPENSING SURVEY
Maryland Department of Health and Mental Hygiene 201 W. Preston Street • Baltimore, Maryland 21201
Martin O’Malley, Governor – Anthony G. Brown, Lt. Governor – Joshua M. Sharfstein, M.D., Secretary Office of Systems, Operations and Pharmacy Charles E. Lehman Medical Care Programs Executive Director July 14, 2011 «prov_no» / «random» «prov_name» «address1» «address2» «city», «state» «zip» Re: Maryland Medicaid Pharmacy Programs
Mandatory Cost of Dispensing Survey Dear Pharmacy Owner or Manager: The Maryland Department of Health and Mental Hygiene has contracted with Myers and Stauffer LC to conduct a pharmacy dispensing cost survey. All Maryland Medicaid Pharmacy Programs (MMPP) providers are required to participate in the survey.
During the week of June 27 you should have received a copy of the dispensing cost survey form and instructions. Your participation in the dispensing cost survey is very important. This survey is being used by the MMPP to evaluate future reimbursement rates. The MMPP has indicated that participation in the survey is mandatory. Failure to participate may jeopardize your pharmacy’s status as a Medicaid provider.
Surveys were sent with a due date of July 15, 2011. According to our records, a completed survey has not yet been received from your pharmacy. In order to allow more pharmacies time to respond to the dispensing cost survey, Myers and Stauffer has been instructed by the MMPP to continue to accept surveys through Friday, July 29, 2011.
If you have not received a survey form or have misplaced your survey form, you can download a copy of the survey and instructions from md.mslc.com. If you have any questions regarding the survey, please contact Myers and Stauffer at 1-800-374-6858 or via e-mail to [email protected].
If you have recently mailed your survey to Myers and Stauffer, we thank you for your participation. Please feel free to contact Myers and Stauffer if you would like to confirm receipt of your submitted survey.
Your cooperation with this survey process is greatly appreciated.
Alex Taylor, Division Chief Maryland Medicaid Pharmacy Programs (410) 767-5878 [email protected]
Allan Hansen, Project Manager Myers and Stauffer LC (800) 374-6858 ext. 1038 [email protected]
Sample (Independent Pharmacies)
Exhibit 5b First Survey
Reminder / Extension Letter (Chain Pharmacies)
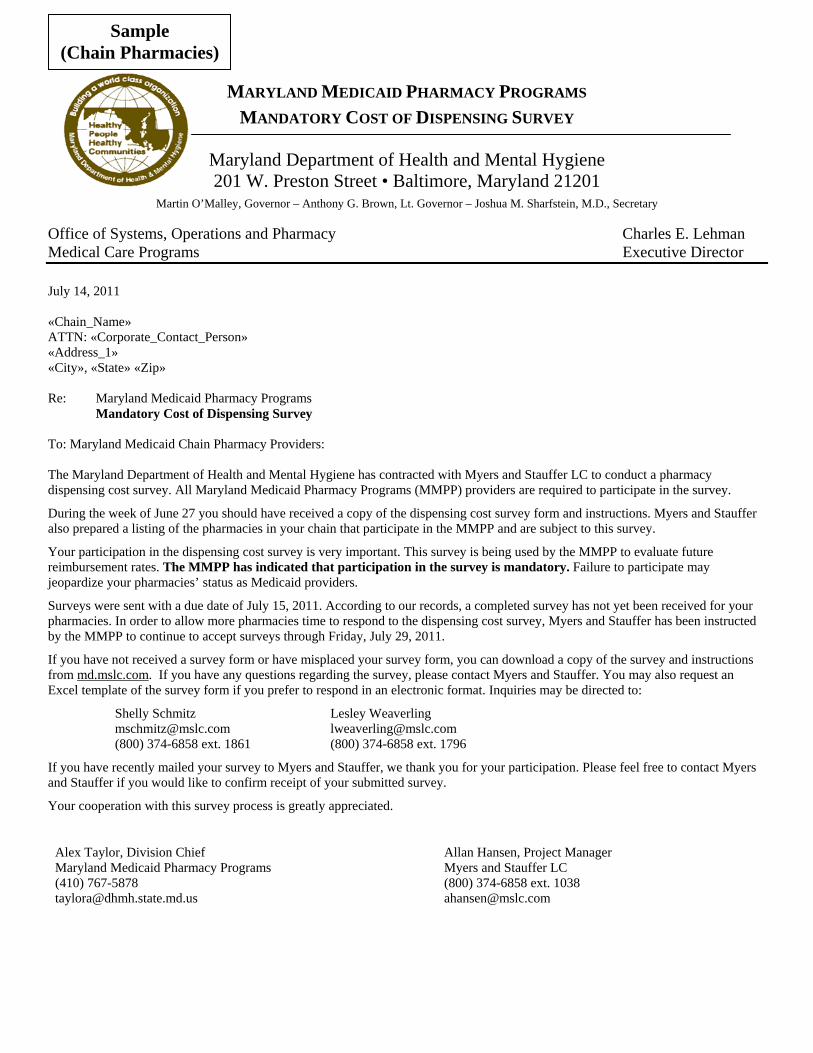
MARYLAND MEDICAID PHARMACY PROGRAMS MANDATORY COST OF DISPENSING SURVEY
Maryland Department of Health and Mental Hygiene 201 W. Preston Street • Baltimore, Maryland 21201
Martin O’Malley, Governor – Anthony G. Brown, Lt. Governor – Joshua M. Sharfstein, M.D., Secretary Office of Systems, Operations and Pharmacy Charles E. Lehman Medical Care Programs Executive Director July 14, 2011 «Chain_Name» ATTN: «Corporate_Contact_Person» «Address_1» «City», «State» «Zip» Re: Maryland Medicaid Pharmacy Programs
Mandatory Cost of Dispensing Survey To: Maryland Medicaid Chain Pharmacy Providers: The Maryland Department of Health and Mental Hygiene has contracted with Myers and Stauffer LC to conduct a pharmacy dispensing cost survey. All Maryland Medicaid Pharmacy Programs (MMPP) providers are required to participate in the survey.
During the week of June 27 you should have received a copy of the dispensing cost survey form and instructions. Myers and Stauffer also prepared a listing of the pharmacies in your chain that participate in the MMPP and are subject to this survey.
Your participation in the dispensing cost survey is very important. This survey is being used by the MMPP to evaluate future reimbursement rates. The MMPP has indicated that participation in the survey is mandatory. Failure to participate may jeopardize your pharmacies’ status as Medicaid providers.
Surveys were sent with a due date of July 15, 2011. According to our records, a completed survey has not yet been received for your pharmacies. In order to allow more pharmacies time to respond to the dispensing cost survey, Myers and Stauffer has been instructed by the MMPP to continue to accept surveys through Friday, July 29, 2011.
If you have not received a survey form or have misplaced your survey form, you can download a copy of the survey and instructions from md.mslc.com. If you have any questions regarding the survey, please contact Myers and Stauffer. You may also request an Excel template of the survey form if you prefer to respond in an electronic format. Inquiries may be directed to:
Shelly Schmitz [email protected] (800) 374-6858 ext. 1861
Lesley Weaverling [email protected] (800) 374-6858 ext. 1796
If you have recently mailed your survey to Myers and Stauffer, we thank you for your participation. Please feel free to contact Myers and Stauffer if you would like to confirm receipt of your submitted survey.
Your cooperation with this survey process is greatly appreciated.
Alex Taylor, Division Chief Maryland Medicaid Pharmacy Programs (410) 767-5878 [email protected]
Allan Hansen, Project Manager Myers and Stauffer LC (800) 374-6858 ext. 1038 [email protected]
Sample (Chain Pharmacies)
Exhibit 6a Second Survey
Reminder / Extension Letter (Independent Pharmacies)

MARYLAND MEDICAID PHARMACY PROGRAMS MANDATORY COST OF DISPENSING SURVEY
Maryland Department of Health and Mental Hygiene 201 W. Preston Street • Baltimore, Maryland 21201
Martin O’Malley, Governor – Anthony G. Brown, Lt. Governor – Joshua M. Sharfstein, M.D., Secretary Office of Systems, Operations and Pharmacy Charles E. Lehman Medical Care Programs Executive Director July 28, 2011 «prov_no» / «random» «prov_name» «address1» «address2» «city», «state» «zip» Re: Maryland Medicaid Pharmacy Programs
Mandatory Cost of Dispensing Survey Dear Pharmacy Owner or Manager: The Maryland Department of Health and Mental Hygiene has contracted with Myers and Stauffer LC to conduct a pharmacy dispensing cost survey. All Maryland Medicaid Pharmacy Programs (MMPP) providers are required to participate in the survey.
During the week of June 27 you should have received a copy of the dispensing cost survey form and instructions. Your participation in the dispensing cost survey is very important. This survey is being used by the MMPP to evaluate future reimbursement rates. The MMPP has indicated that participation in the survey is mandatory. Failure to participate may jeopardize your pharmacy’s status as a Medicaid provider.
The initial due date for the survey was July 15, 2011, which was subsequently extended to July 29, 2011. In order to allow more pharmacies time to respond to the dispensing cost survey, Myers and Stauffer has been instructed by the MMPP to continue to accept surveys through Friday, August 12, 2011. This will be the final extension of the survey due date.
According to our records, a completed survey has not yet been received from your pharmacy. If you have recently mailed your survey to Myers and Stauffer, we thank you for your participation. Please feel free to contact Myers and Stauffer if you would like to confirm receipt of your submitted survey.
If you have not received a survey form or have misplaced your survey form, you can download a copy of the survey and instructions from md.mslc.com. If you have any questions regarding the survey, please contact Myers and Stauffer at 1-800-374-6858 or via e-mail to [email protected].
Your cooperation with this survey process is greatly appreciated. Alex Taylor, Division Chief Maryland Medicaid Pharmacy Programs (410) 767-5878 [email protected]
Allan Hansen, Project Manager Myers and Stauffer LC (800) 374-6858 ext. 1038 [email protected]
Sample (Independent Pharmacies)
Exhibit 6b Second Survey
Reminder / Extension Letter (Chain Pharmacies)
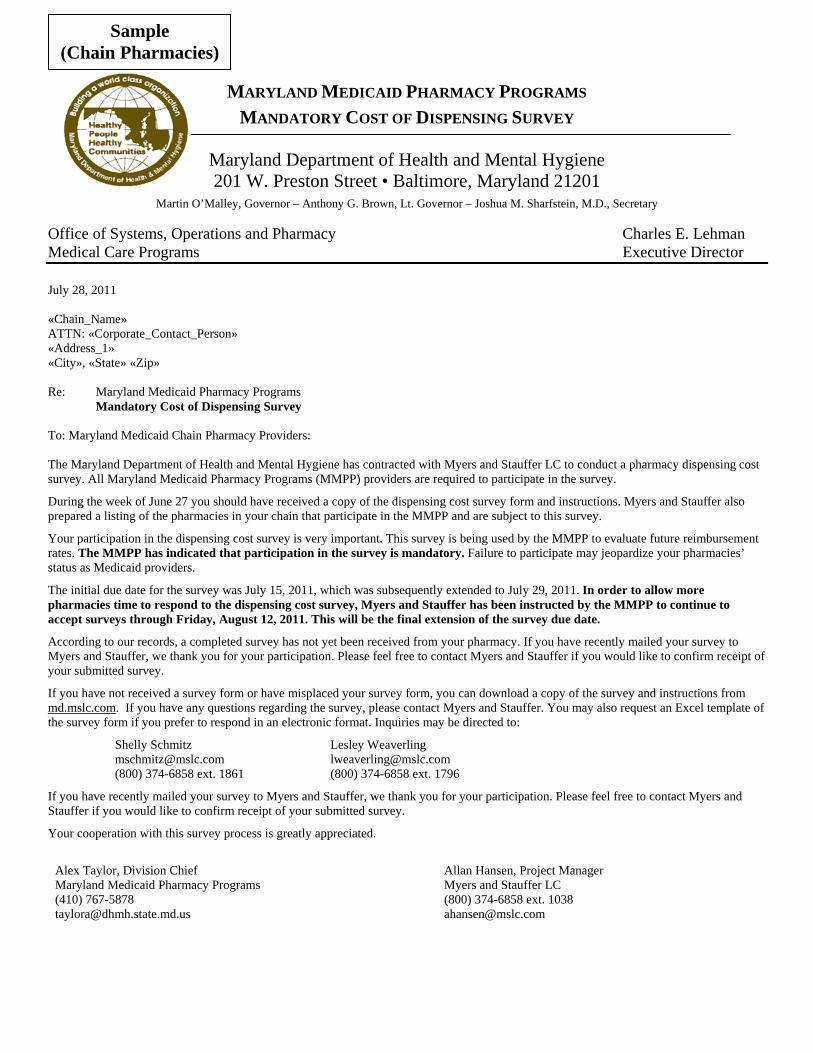
MARYLAND MEDICAID PHARMACY PROGRAMS MANDATORY COST OF DISPENSING SURVEY
Maryland Department of Health and Mental Hygiene 201 W. Preston Street • Baltimore, Maryland 21201
Martin O’Malley, Governor – Anthony G. Brown, Lt. Governor – Joshua M. Sharfstein, M.D., Secretary Office of Systems, Operations and Pharmacy Charles E. Lehman Medical Care Programs Executive Director July 28, 2011 «Chain_Name» ATTN: «Corporate_Contact_Person» «Address_1» «City», «State» «Zip» Re: Maryland Medicaid Pharmacy Programs
Mandatory Cost of Dispensing Survey To: Maryland Medicaid Chain Pharmacy Providers: The Maryland Department of Health and Mental Hygiene has contracted with Myers and Stauffer LC to conduct a pharmacy dispensing cost survey. All Maryland Medicaid Pharmacy Programs (MMPP) providers are required to participate in the survey.
During the week of June 27 you should have received a copy of the dispensing cost survey form and instructions. Myers and Stauffer also prepared a listing of the pharmacies in your chain that participate in the MMPP and are subject to this survey.
Your participation in the dispensing cost survey is very important. This survey is being used by the MMPP to evaluate future reimbursement rates. The MMPP has indicated that participation in the survey is mandatory. Failure to participate may jeopardize your pharmacies’ status as Medicaid providers.
The initial due date for the survey was July 15, 2011, which was subsequently extended to July 29, 2011. In order to allow more pharmacies time to respond to the dispensing cost survey, Myers and Stauffer has been instructed by the MMPP to continue to accept surveys through Friday, August 12, 2011. This will be the final extension of the survey due date.
According to our records, a completed survey has not yet been received from your pharmacy. If you have recently mailed your survey to Myers and Stauffer, we thank you for your participation. Please feel free to contact Myers and Stauffer if you would like to confirm receipt of your submitted survey.
If you have not received a survey form or have misplaced your survey form, you can download a copy of the survey and instructions from md.mslc.com. If you have any questions regarding the survey, please contact Myers and Stauffer. You may also request an Excel template of the survey form if you prefer to respond in an electronic format. Inquiries may be directed to:
Shelly Schmitz [email protected] (800) 374-6858 ext. 1861
Lesley Weaverling [email protected] (800) 374-6858 ext. 1796
If you have recently mailed your survey to Myers and Stauffer, we thank you for your participation. Please feel free to contact Myers and Stauffer if you would like to confirm receipt of your submitted survey.
Your cooperation with this survey process is greatly appreciated.
Alex Taylor, Division Chief Maryland Medicaid Pharmacy Programs (410) 767-5878 [email protected]
Allan Hansen, Project Manager Myers and Stauffer LC (800) 374-6858 ext. 1038 [email protected]
Sample (Chain Pharmacies)
Exhibit 7a Desk Review Notification Letter
(Independent Pharmacies)
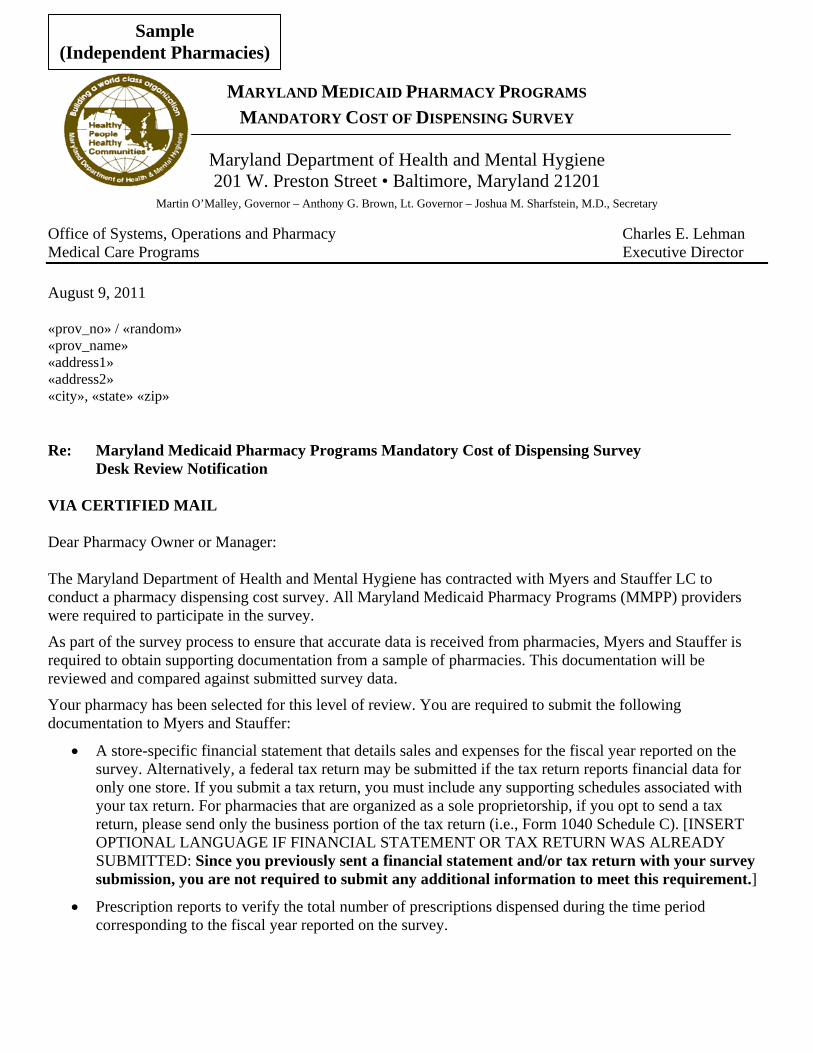
MARYLAND MEDICAID PHARMACY PROGRAMS MANDATORY COST OF DISPENSING SURVEY
Maryland Department of Health and Mental Hygiene 201 W. Preston Street • Baltimore, Maryland 21201
Martin O’Malley, Governor – Anthony G. Brown, Lt. Governor – Joshua M. Sharfstein, M.D., Secretary Office of Systems, Operations and Pharmacy Charles E. Lehman Medical Care Programs Executive Director August 9, 2011 «prov_no» / «random» «prov_name» «address1» «address2» «city», «state» «zip» Re: Maryland Medicaid Pharmacy Programs Mandatory Cost of Dispensing Survey
Desk Review Notification VIA CERTIFIED MAIL Dear Pharmacy Owner or Manager: The Maryland Department of Health and Mental Hygiene has contracted with Myers and Stauffer LC to conduct a pharmacy dispensing cost survey. All Maryland Medicaid Pharmacy Programs (MMPP) providers were required to participate in the survey.
As part of the survey process to ensure that accurate data is received from pharmacies, Myers and Stauffer is required to obtain supporting documentation from a sample of pharmacies. This documentation will be reviewed and compared against submitted survey data.
Your pharmacy has been selected for this level of review. You are required to submit the following documentation to Myers and Stauffer:
• A store-specific financial statement that details sales and expenses for the fiscal year reported on the survey. Alternatively, a federal tax return may be submitted if the tax return reports financial data for only one store. If you submit a tax return, you must include any supporting schedules associated with your tax return. For pharmacies that are organized as a sole proprietorship, if you opt to send a tax return, please send only the business portion of the tax return (i.e., Form 1040 Schedule C). [INSERT OPTIONAL LANGUAGE IF FINANCIAL STATEMENT OR TAX RETURN WAS ALREADY SUBMITTED: Since you previously sent a financial statement and/or tax return with your survey submission, you are not required to submit any additional information to meet this requirement.]
• Prescription reports to verify the total number of prescriptions dispensed during the time period corresponding to the fiscal year reported on the survey.
Sample (Independent Pharmacies)

Maryland Medicaid Pharmacy Programs Mandatory Cost of Dispensing Survey Desk Review Notification Page 2 of 2
• A copy of a store diagram or blueprint or other documentation to support calculations that were made to determine the total store and pharmacy only square footage reported on the cost of dispensing survey.
• Any other work papers relied upon to complete the cost of dispensing survey which are necessary to reconcile the above records to the information submitted on the cost of dispensing survey.
Documentation should be submitted within ten days of the date of this letter. Documentation may be submitted by mail to:
Myers and Stauffer LC 11440 Tomahawk Creek Parkway Leawood, Kansas 66211
Alternatively, documentation may sent via fax to (913) 234-1104 or via e-mail to the contacts listed below:
Lesley Weaverling [email protected] (913) 234-1796
or Shelly Schmitz [email protected] (913) 234-1861
If you have any questions concerning the desk review process, please contact Myers and Stauffer. Your cooperation with this survey process is greatly appreciated.
Alex Taylor, Division Chief Maryland Medicaid Pharmacy Programs (410) 767-5878 [email protected]
Allan Hansen, Project Manager Myers and Stauffer LC (800) 374-6858 ext. 1038 [email protected]
Exhibit 7b Desk Review Notification Letter
(Chain Pharmacies)
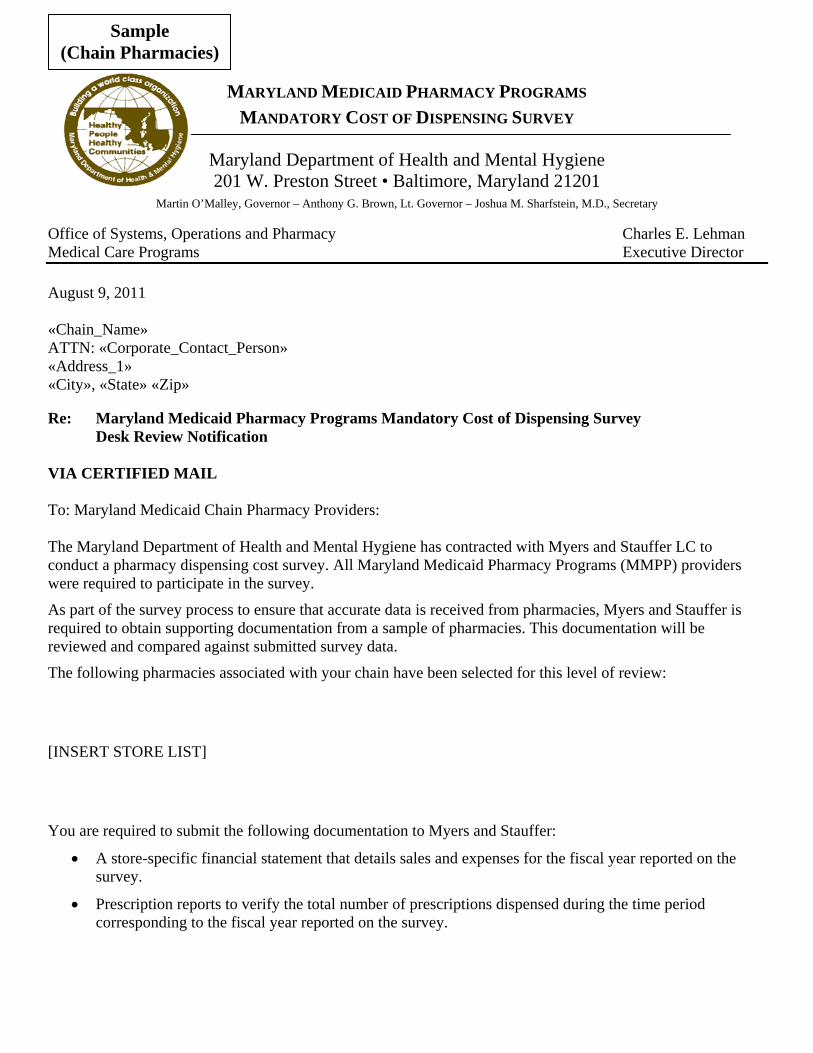
MARYLAND MEDICAID PHARMACY PROGRAMS MANDATORY COST OF DISPENSING SURVEY
Maryland Department of Health and Mental Hygiene 201 W. Preston Street • Baltimore, Maryland 21201
Martin O’Malley, Governor – Anthony G. Brown, Lt. Governor – Joshua M. Sharfstein, M.D., Secretary Office of Systems, Operations and Pharmacy Charles E. Lehman Medical Care Programs Executive Director August 9, 2011 «Chain_Name» ATTN: «Corporate_Contact_Person» «Address_1» «City», «State» «Zip» Re: Maryland Medicaid Pharmacy Programs Mandatory Cost of Dispensing Survey
Desk Review Notification VIA CERTIFIED MAIL To: Maryland Medicaid Chain Pharmacy Providers: The Maryland Department of Health and Mental Hygiene has contracted with Myers and Stauffer LC to conduct a pharmacy dispensing cost survey. All Maryland Medicaid Pharmacy Programs (MMPP) providers were required to participate in the survey.
As part of the survey process to ensure that accurate data is received from pharmacies, Myers and Stauffer is required to obtain supporting documentation from a sample of pharmacies. This documentation will be reviewed and compared against submitted survey data.
The following pharmacies associated with your chain have been selected for this level of review:
[INSERT STORE LIST]
You are required to submit the following documentation to Myers and Stauffer:
• A store-specific financial statement that details sales and expenses for the fiscal year reported on the survey.
• Prescription reports to verify the total number of prescriptions dispensed during the time period corresponding to the fiscal year reported on the survey.
Sample (Chain Pharmacies)
Maryland Medicaid Pharmacy Programs Mandatory Cost of Dispensing Survey Desk Review Notification Page 2 of 2
• A copy of a store diagram or blueprint or other documentation to support calculations that were made to determine the total store and pharmacy only square footage reported on the cost of dispensing survey.
• Any other work papers relied upon to complete the cost of dispensing survey which are necessary to reconcile the above records to the information submitted on the cost of dispensing survey.
Documentation should be submitted within ten days of the date of this letter. Documentation may be submitted by mail to:
Myers and Stauffer LC 11440 Tomahawk Creek Parkway Leawood, Kansas 66211
Alternatively, documentation may sent via fax to (913) 234-1104 or via e-mail to the contacts listed below:
Lesley Weaverling [email protected] (913) 234-1796
or Shelly Schmitz [email protected] (913) 234-1861
If you have any questions concerning the desk review process, please contact Myers and Stauffer. Your cooperation with this survey process is greatly appreciated.
Alex Taylor, Division Chief Maryland Medicaid Pharmacy Programs (410) 767-5878 [email protected]
Allan Hansen, Project Manager Myers and Stauffer LC (800) 374-6858 ext. 1038 [email protected]
Exhibit 8 Summary of Enhanced Desk
Review Findings
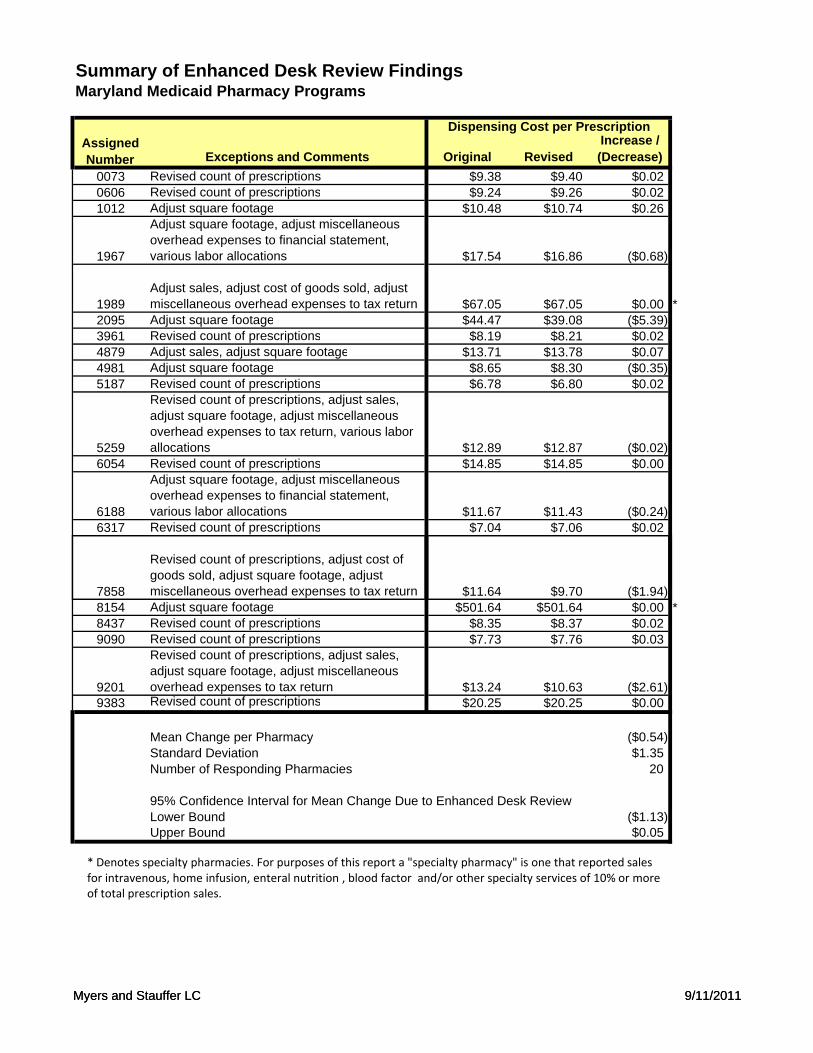
Summary of Enhanced Desk Review FindingsMaryland Medicaid Pharmacy Programs
Dispensing Cost per Prescription
Exceptions and Comments Original RevisedIncrease / (Decrease)
0073 Revised count of prescriptions $9.38 $9.40 $0.020606 Revised count of prescriptions $9.24 $9.26 $0.021012 Adjust square footage $10.48 $10.74 $0.26
1967
Adjust square footage, adjust miscellaneous overhead expenses to financial statement, various labor allocations $17.54 $16.86 ($0.68)
1989Adjust sales, adjust cost of goods sold, adjust miscellaneous overhead expenses to tax return $67.05 $67.05 $0.00 *
2095 Adjust square footage $44.47 $39.08 ($5.39)3961 Revised count of prescriptions $8.19 $8.21 $0.024879 Adjust sales, adjust square footage $13.71 $13.78 $0.074981 Adjust square footage $8.65 $8.30 ($0.35)5187 Revised count of prescriptions $6.78 $6.80 $0.02
5259
Revised count of prescriptions, adjust sales, adjust square footage, adjust miscellaneous overhead expenses to tax return, various labor allocations $12.89 $12.87 ($0.02)
6054 Revised count of prescriptions $14.85 $14.85 $0.00
6188
Adjust square footage, adjust miscellaneous overhead expenses to financial statement, various labor allocations $11.67 $11.43 ($0.24)
6317 Revised count of prescriptions $7.04 $7.06 $0.02
Assigned Number
Myers and Stauffer LC 9/11/2011
7858
Revised count of prescriptions, adjust cost of goods sold, adjust square footage, adjust miscellaneous overhead expenses to tax return $11.64 $9.70 ($1.94)
8154 Adjust square footage $501.64 $501.64 $0.00 *8437 Revised count of prescriptions $8.35 $8.37 $0.029090 Revised count of prescriptions $7.73 $7.76 $0.03
9201
Revised count of prescriptions, adjust sales, adjust square footage, adjust miscellaneous overhead expenses to tax return $13.24 $10.63 ($2.61)
9383 Revised count of prescriptions $20.25 $20.25 $0.00
Mean Change per Pharmacy ($0.54)Standard Deviation $1.35Number of Responding Pharmacies 20
95% Confidence Interval for Mean Change Due to Enhanced Desk ReviewLower Bound ($1.13)Upper Bound $0.05
* Denotes specialty pharmacies. For purposes of this report a "specialty pharmacy" is one that reported sales for intravenous, home infusion, enteral nutrition , blood factor and/or other specialty services of 10% or more of total prescription sales.
Myers and Stauffer LC 9/11/2011
Exhibit 9 Construction and Application
of Owner Pharmacist Salary Limits
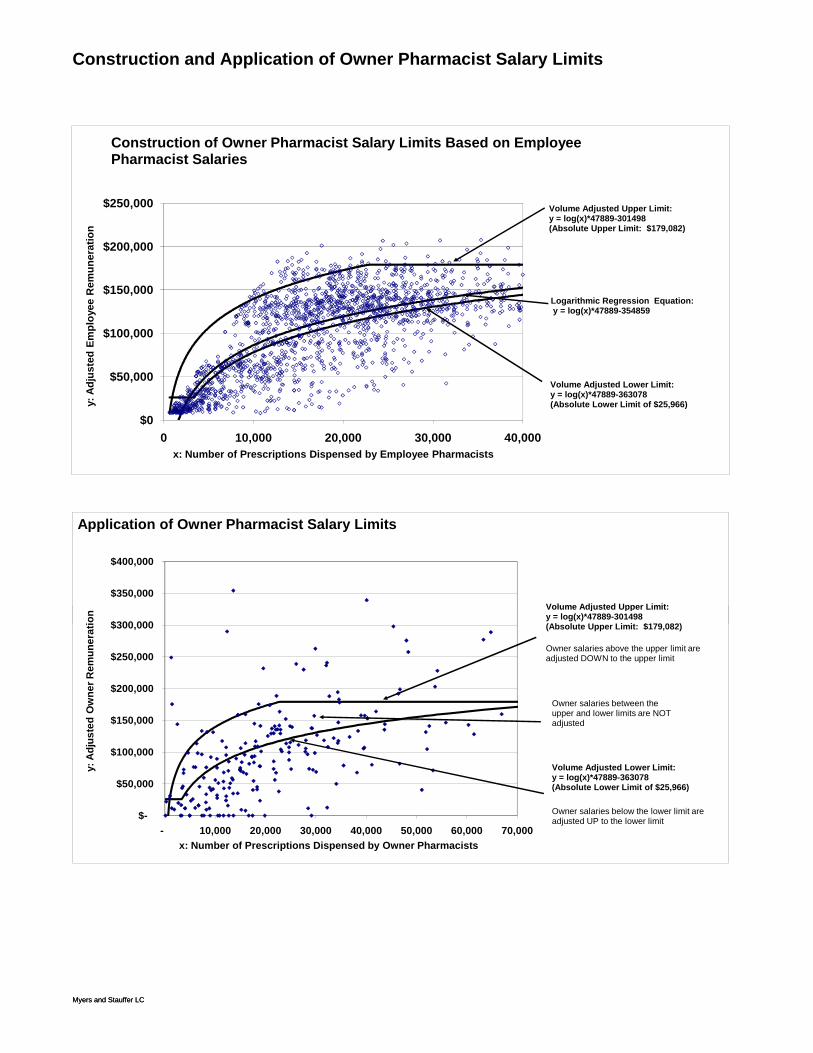
Construction and Application of Owner Pharmacist Salary Limits
$0
$50,000
$100,000
$150,000
$200,000
$250,000
0 10,000 20,000 30,000 40,000
y: A
djus
ted
Empl
oyee
Rem
uner
atio
n
x: Number of Prescriptions Dispensed by Employee Pharmacists
Construction of Owner Pharmacist Salary Limits Based on Employee Pharmacist Salaries
Logarithmic Regression Equation:y = log(x)*47889-354859
Volume Adjusted Upper Limit: y = log(x)*47889-301498(Absolute Upper Limit: $179,082)
Volume Adjusted Lower Limit: y = log(x)*47889-363078(Absolute Lower Limit of $25,966)
$300 000
$350,000
$400,000
ion
Application of Owner Pharmacist Salary Limits
Volume Adjusted Upper Limit: y = log(x)*47889-301498(Ab l t U Li it $179 082)
Myers and Stauffer LC
$-
$50,000
$100,000
$150,000
$200,000
$250,000
$300,000
- 10,000 20,000 30,000 40,000 50,000 60,000 70,000
y: A
djus
ted
Ow
ner R
emun
erat
ion
x: Number of Prescriptions Dispensed by Owner Pharmacists
Volume Adjusted Lower Limit: y = log(x)*47889-363078(Absolute Lower Limit of $25,966)
Owner salaries below the lower limit are adjusted UP to the lower limit
Owner salaries between the upper and lower limits are NOT adjusted
Volume Adjusted Upper Limit: y = log(x)*47889-301498(Absolute Upper Limit: $179,082)
Owner salaries above the upper limit are adjusted DOWN to the upper limit
Myers and Stauffer LC
Exhibit 10 Table of Inflation Factors
for Dispensing Cost Survey
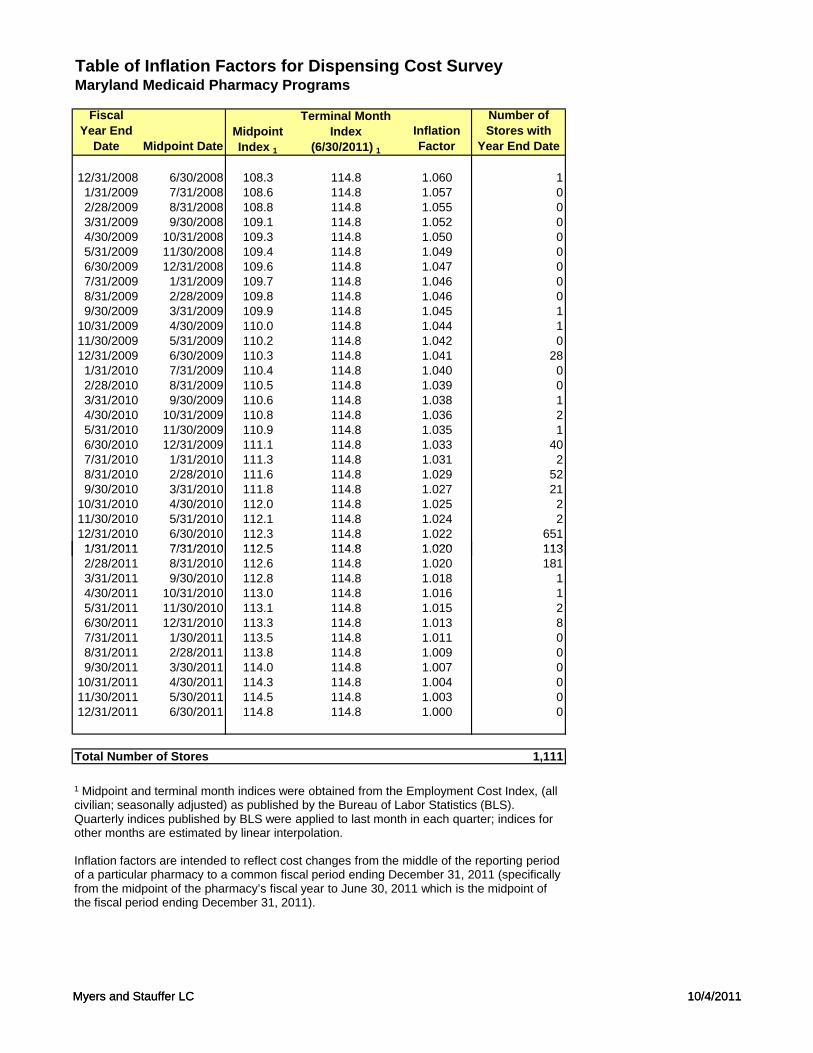
Table of Inflation Factors for Dispensing Cost SurveyMaryland Medicaid Pharmacy Programs
Fiscal Year End
Date Midpoint DateMidpoint Index 1
Terminal Month Index
(6/30/2011) 1Inflation Factor
Number of Stores with
Year End Date
12/31/2008 6/30/2008 108.3 114.8 1.060 11/31/2009 7/31/2008 108.6 114.8 1.057 02/28/2009 8/31/2008 108.8 114.8 1.055 03/31/2009 9/30/2008 109.1 114.8 1.052 04/30/2009 10/31/2008 109.3 114.8 1.050 05/31/2009 11/30/2008 109.4 114.8 1.049 06/30/2009 12/31/2008 109.6 114.8 1.047 07/31/2009 1/31/2009 109.7 114.8 1.046 08/31/2009 2/28/2009 109.8 114.8 1.046 09/30/2009 3/31/2009 109.9 114.8 1.045 1
10/31/2009 4/30/2009 110.0 114.8 1.044 111/30/2009 5/31/2009 110.2 114.8 1.042 012/31/2009 6/30/2009 110.3 114.8 1.041 281/31/2010 7/31/2009 110.4 114.8 1.040 02/28/2010 8/31/2009 110.5 114.8 1.039 03/31/2010 9/30/2009 110.6 114.8 1.038 14/30/2010 10/31/2009 110.8 114.8 1.036 25/31/2010 11/30/2009 110.9 114.8 1.035 16/30/2010 12/31/2009 111.1 114.8 1.033 407/31/2010 1/31/2010 111.3 114.8 1.031 28/31/2010 2/28/2010 111.6 114.8 1.029 529/30/2010 3/31/2010 111.8 114.8 1.027 21
10/31/2010 4/30/2010 112.0 114.8 1.025 211/30/2010 5/31/2010 112.1 114.8 1.024 212/31/2010 6/30/2010 112.3 114.8 1.022 6511/31/2011 7/31/2010 112 5 114 8 1 020 113
Myers and Stauffer LC 10/4/2011
1/31/2011 7/31/2010 112.5 114.8 1.020 1132/28/2011 8/31/2010 112.6 114.8 1.020 1813/31/2011 9/30/2010 112.8 114.8 1.018 14/30/2011 10/31/2010 113.0 114.8 1.016 15/31/2011 11/30/2010 113.1 114.8 1.015 26/30/2011 12/31/2010 113.3 114.8 1.013 87/31/2011 1/30/2011 113.5 114.8 1.011 08/31/2011 2/28/2011 113.8 114.8 1.009 09/30/2011 3/30/2011 114.0 114.8 1.007 0
10/31/2011 4/30/2011 114.3 114.8 1.004 011/30/2011 5/30/2011 114.5 114.8 1.003 012/31/2011 6/30/2011 114.8 114.8 1.000 0
Total Number of Stores 1,111
1 Midpoint and terminal month indices were obtained from the Employment Cost Index, (all civilian; seasonally adjusted) as published by the Bureau of Labor Statistics (BLS). Quarterly indices published by BLS were applied to last month in each quarter; indices for other months are estimated by linear interpolation.
Inflation factors are intended to reflect cost changes from the middle of the reporting period of a particular pharmacy to a common fiscal period ending December 31, 2011 (specifically from the midpoint of the pharmacy’s fiscal year to June 30, 2011 which is the midpoint of the fiscal period ending December 31, 2011).
Myers and Stauffer LC 10/4/2011
Exhibit 11 Histogram of
Pharmacy Dispensing Cost
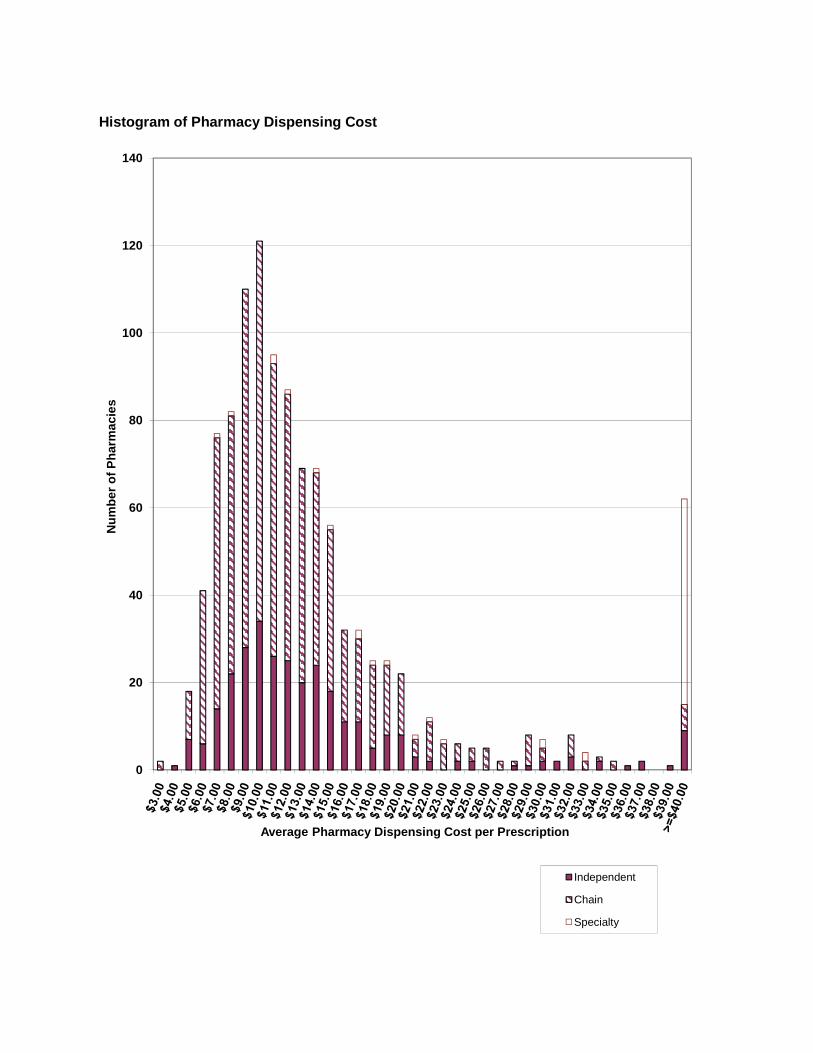
60
80
100
120
140
Num
ber o
f Pha
rmac
ies
Histogram of Pharmacy Dispensing Cost
0
20
40
Average Pharmacy Dispensing Cost per Prescription
Independent
Chain
Specialty
Exhibit 12 Pharmacy Cost of Dispensing
Survey Data Statistical Summary
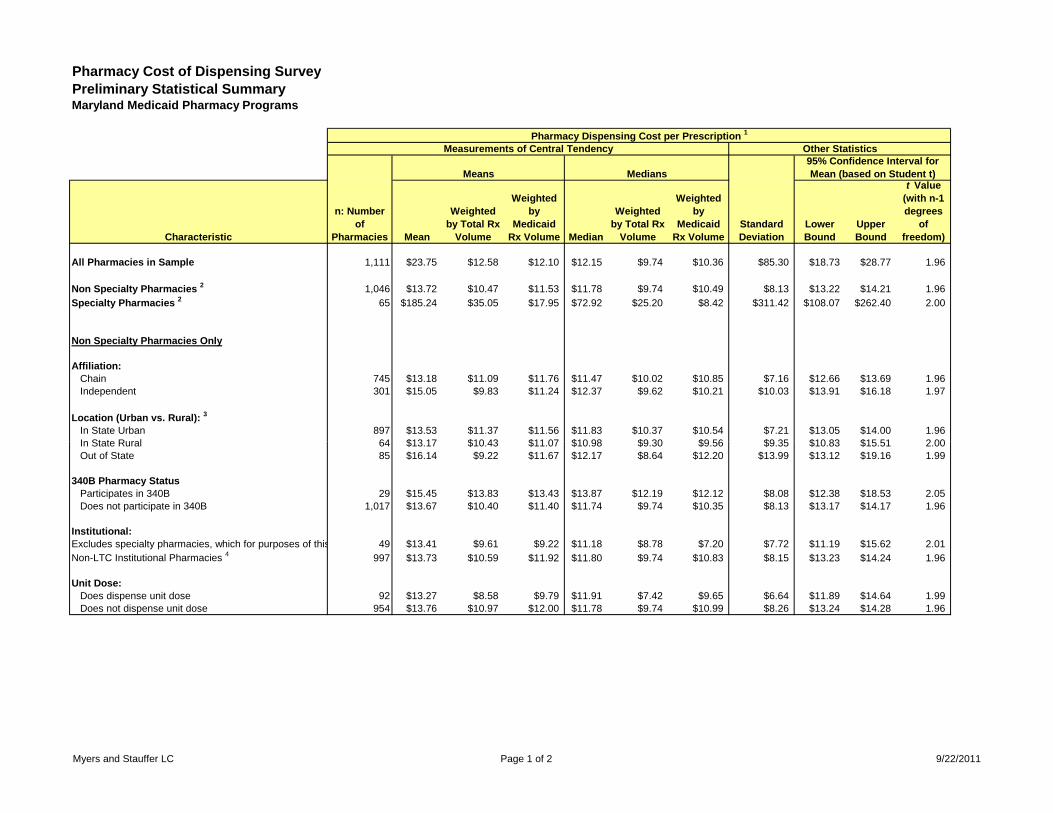
Pharmacy Cost of Dispensing SurveyPreliminary Statistical SummaryMaryland Medicaid Pharmacy Programs
Pharmacy Dispensing Cost per Prescription 1
Measurements of Central Tendency Other Statistics
Means Medians95% Confidence Interval for Mean (based on Student t)
Characteristic
n: Number of
Pharmacies Mean
Weighted by Total Rx
Volume
Weighted by
Medicaid Rx Volume Median
Weighted by Total Rx
Volume
Weighted by
Medicaid Rx Volume
Lower Bound
Upper Bound
t Value (with n-1 degrees
of freedom)
All Pharmacies in Sample 1,111 $23.75 $12.58 $12.10 $12.15 $9.74 $10.36 $85.30 $18.73 $28.77 1.96
Non Specialty Pharmacies 2 1,046 $13.72 $10.47 $11.53 $11.78 $9.74 $10.49 $8.13 $13.22 $14.21 1.96Specialty Pharmacies 2 65 $185.24 $35.05 $17.95 $72.92 $25.20 $8.42 $311.42 $108.07 $262.40 2.00
Non Specialty Pharmacies Only
Affiliation:Chain 745 $13.18 $11.09 $11.76 $11.47 $10.02 $10.85 $7.16 $12.66 $13.69 1.96Independent 301 $15.05 $9.83 $11.24 $12.37 $9.62 $10.21 $10.03 $13.91 $16.18 1.97
Location (Urban vs. Rural): 3
In State Urban 897 $13.53 $11.37 $11.56 $11.83 $10.37 $10.54 $7.21 $13.05 $14.00 1.96In State Rural 64 $13 17 $10 43 $11 07 $10 98 $9 30 $9 56 $9 35 $10 83 $15 51 2 00
Standard Deviation
In State Rural 64 $13.17 $10.43 $11.07 $10.98 $9.30 $9.56 $9.35 $10.83 $15.51 2.00Out of State 85 $16.14 $9.22 $11.67 $12.17 $8.64 $12.20 $13.99 $13.12 $19.16 1.99
340B Pharmacy StatusParticipates in 340B 29 $15.45 $13.83 $13.43 $13.87 $12.19 $12.12 $8.08 $12.38 $18.53 2.05Does not participate in 340B 1,017 $13.67 $10.40 $11.40 $11.74 $9.74 $10.35 $8.13 $13.17 $14.17 1.96
Institutional:Excludes specialty pharmacies, which for purposes of this 49 $13.41 $9.61 $9.22 $11.18 $8.78 $7.20 $7.72 $11.19 $15.62 2.01Non-LTC Institutional Pharmacies 4 997 $13.73 $10.59 $11.92 $11.80 $9.74 $10.83 $8.15 $13.23 $14.24 1.96
Unit Dose:Does dispense unit dose 92 $13.27 $8.58 $9.79 $11.91 $7.42 $9.65 $6.64 $11.89 $14.64 1.99Does not dispense unit dose 954 $13.76 $10.97 $12.00 $11.78 $9.74 $10.99 $8.26 $13.24 $14.28 1.96
Myers and Stauffer LC Page 1 of 2 9/22/2011
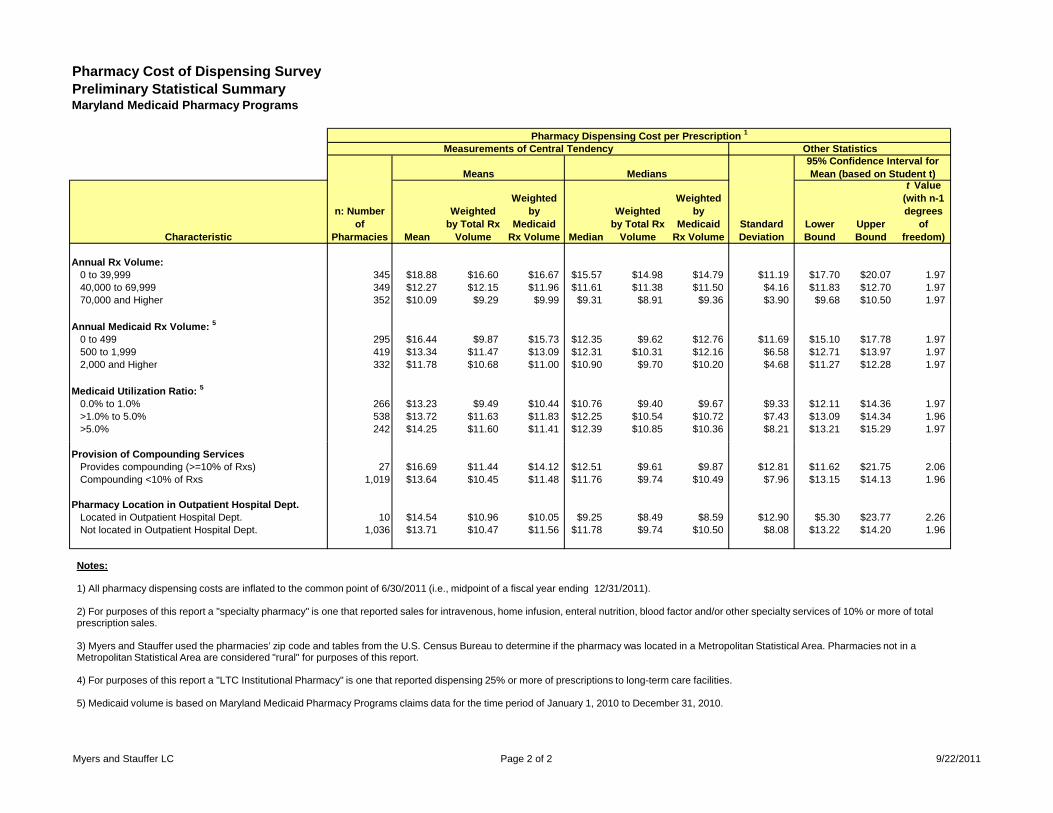
Pharmacy Cost of Dispensing SurveyPreliminary Statistical SummaryMaryland Medicaid Pharmacy Programs
Pharmacy Dispensing Cost per Prescription 1
Measurements of Central Tendency Other Statistics
Means Medians95% Confidence Interval for Mean (based on Student t)
Characteristic
n: Number of
Pharmacies Mean
Weighted by Total Rx
Volume
Weighted by
Medicaid Rx Volume Median
Weighted by Total Rx
Volume
Weighted by
Medicaid Rx Volume
Lower Bound
Upper Bound
t Value (with n-1 degrees
of freedom)
Standard Deviation
Annual Rx Volume:0 to 39,999 345 $18.88 $16.60 $16.67 $15.57 $14.98 $14.79 $11.19 $17.70 $20.07 1.9740,000 to 69,999 349 $12.27 $12.15 $11.96 $11.61 $11.38 $11.50 $4.16 $11.83 $12.70 1.9770,000 and Higher 352 $10.09 $9.29 $9.99 $9.31 $8.91 $9.36 $3.90 $9.68 $10.50 1.97
Annual Medicaid Rx Volume: 5
0 to 499 295 $16.44 $9.87 $15.73 $12.35 $9.62 $12.76 $11.69 $15.10 $17.78 1.97500 to 1,999 419 $13.34 $11.47 $13.09 $12.31 $10.31 $12.16 $6.58 $12.71 $13.97 1.972,000 and Higher 332 $11.78 $10.68 $11.00 $10.90 $9.70 $10.20 $4.68 $11.27 $12.28 1.97
Medicaid Utilization Ratio: 5
0.0% to 1.0% 266 $13.23 $9.49 $10.44 $10.76 $9.40 $9.67 $9.33 $12.11 $14.36 1.97>1.0% to 5.0% 538 $13.72 $11.63 $11.83 $12.25 $10.54 $10.72 $7.43 $13.09 $14.34 1.96>5.0% 242 $14.25 $11.60 $11.41 $12.39 $10.85 $10.36 $8.21 $13.21 $15.29 1.97
Provision of Compounding ServicesProvides compounding (>=10% of Rxs) 27 $16.69 $11.44 $14.12 $12.51 $9.61 $9.87 $12.81 $11.62 $21.75 2.06Compounding <10% of Rxs 1,019 $13.64 $10.45 $11.48 $11.76 $9.74 $10.49 $7.96 $13.15 $14.13 1.96
Pharmacy Location in Outpatient Hospital Dept.Located in Outpatient Hospital Dept. 10 $14.54 $10.96 $10.05 $9.25 $8.49 $8.59 $12.90 $5.30 $23.77 2.26Not located in Outpatient Hospital Dept. 1,036 $13.71 $10.47 $11.56 $11.78 $9.74 $10.50 $8.08 $13.22 $14.20 1.96
Notes:
1) All pharmacy dispensing costs are inflated to the common point of 6/30/2011 (i.e., midpoint of a fiscal year ending 12/31/2011).
2) For purposes of this report a "specialty pharmacy" is one that reported sales for intravenous, home infusion, enteral nutrition, blood factor and/or other specialty services of 10% or more of total prescription sales.
3) Myers and Stauffer used the pharmacies’ zip code and tables from the U.S. Census Bureau to determine if the pharmacy was located in a Metropolitan Statistical Area. Pharmacies not in a Metropolitan Statistical Area are considered "rural" for purposes of this report.
4) For purposes of this report a "LTC Institutional Pharmacy" is one that reported dispensing 25% or more of prescriptions to long-term care facilities.
5) Medicaid volume is based on Maryland Medicaid Pharmacy Programs claims data for the time period of January 1, 2010 to December 31, 2010.
Myers and Stauffer LC Page 2 of 2 9/22/2011
Exhibit 13 Table of Zip Codes, Counties
and Urban Versus Rural Designations
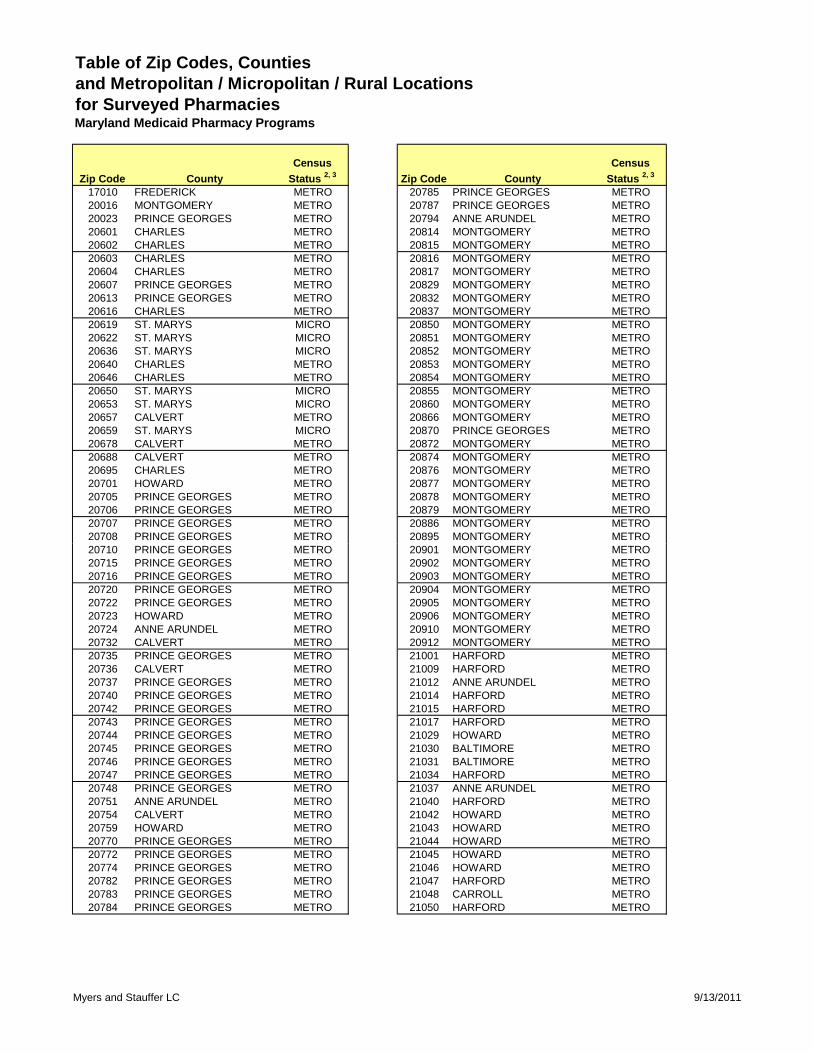
Table of Zip Codes, Counties and Metropolitan / Micropolitan / Rural Locationsfor Surveyed PharmaciesMaryland Medicaid Pharmacy Programs
Zip Code CountyCensus
Status 2, 3 Zip Code CountyCensus
Status 2, 3
17010 FREDERICK METRO 20785 PRINCE GEORGES METRO20016 MONTGOMERY METRO 20787 PRINCE GEORGES METRO20023 PRINCE GEORGES METRO 20794 ANNE ARUNDEL METRO20601 CHARLES METRO 20814 MONTGOMERY METRO20602 CHARLES METRO 20815 MONTGOMERY METRO20603 CHARLES METRO 20816 MONTGOMERY METRO20604 CHARLES METRO 20817 MONTGOMERY METRO20607 PRINCE GEORGES METRO 20829 MONTGOMERY METRO20613 PRINCE GEORGES METRO 20832 MONTGOMERY METRO20616 CHARLES METRO 20837 MONTGOMERY METRO20619 ST. MARYS MICRO 20850 MONTGOMERY METRO20622 ST. MARYS MICRO 20851 MONTGOMERY METRO20636 ST. MARYS MICRO 20852 MONTGOMERY METRO20640 CHARLES METRO 20853 MONTGOMERY METRO20646 CHARLES METRO 20854 MONTGOMERY METRO20650 ST. MARYS MICRO 20855 MONTGOMERY METRO20653 ST. MARYS MICRO 20860 MONTGOMERY METRO20657 CALVERT METRO 20866 MONTGOMERY METRO20659 ST. MARYS MICRO 20870 PRINCE GEORGES METRO20678 CALVERT METRO 20872 MONTGOMERY METRO20688 CALVERT METRO 20874 MONTGOMERY METRO20695 CHARLES METRO 20876 MONTGOMERY METRO20701 HOWARD METRO 20877 MONTGOMERY METRO20705 PRINCE GEORGES METRO 20878 MONTGOMERY METRO20706 PRINCE GEORGES METRO 20879 MONTGOMERY METRO20707 PRINCE GEORGES METRO 20886 MONTGOMERY METRO20708 PRINCE GEORGES METRO 20895 MONTGOMERY METRO20710 PRINCE GEORGES METRO 20901 MONTGOMERY METRO20715 PRINCE GEORGES METRO 20902 MONTGOMERY METRO20716 PRINCE GEORGES METRO 20903 MONTGOMERY METRO20720 PRINCE GEORGES METRO 20904 MONTGOMERY METRO20722 PRINCE GEORGES METRO 20905 MONTGOMERY METRO20723 HOWARD METRO 20906 MONTGOMERY METRO20724 ANNE ARUNDEL METRO 20910 MONTGOMERY METRO20732 CALVERT METRO 20912 MONTGOMERY METRO20735 PRINCE GEORGES METRO 21001 HARFORD METRO20736 CALVERT METRO 21009 HARFORD METRO20737 PRINCE GEORGES METRO 21012 ANNE ARUNDEL METRO20740 PRINCE GEORGES METRO 21014 HARFORD METRO20742 PRINCE GEORGES METRO 21015 HARFORD METRO20743 PRINCE GEORGES METRO 21017 HARFORD METRO20744 PRINCE GEORGES METRO 21029 HOWARD METRO20745 PRINCE GEORGES METRO 21030 BALTIMORE METRO20746 PRINCE GEORGES METRO 21031 BALTIMORE METRO20747 PRINCE GEORGES METRO 21034 HARFORD METRO20748 PRINCE GEORGES METRO 21037 ANNE ARUNDEL METRO20751 ANNE ARUNDEL METRO 21040 HARFORD METRO20754 CALVERT METRO 21042 HOWARD METRO20759 HOWARD METRO 21043 HOWARD METRO20770 PRINCE GEORGES METRO 21044 HOWARD METRO20772 PRINCE GEORGES METRO 21045 HOWARD METRO20774 PRINCE GEORGES METRO 21046 HOWARD METRO20782 PRINCE GEORGES METRO 21047 HARFORD METRO20783 PRINCE GEORGES METRO 21048 CARROLL METRO20784 PRINCE GEORGES METRO 21050 HARFORD METRO
Myers and Stauffer LC 9/13/2011
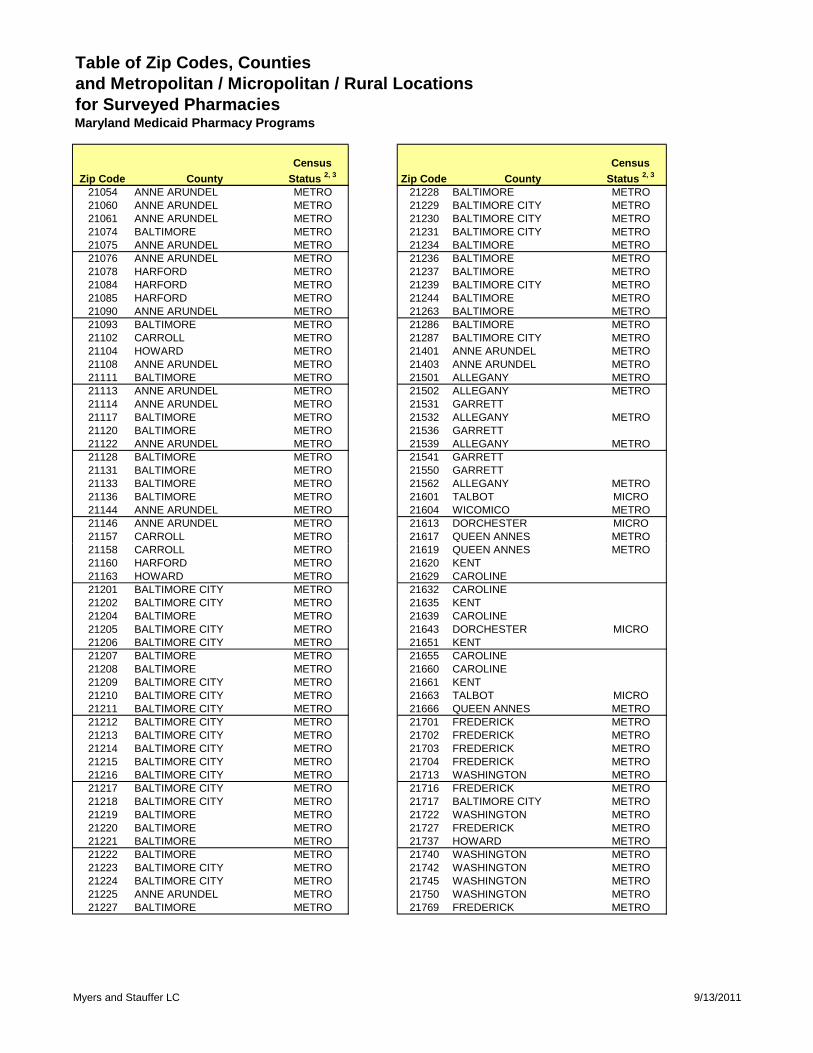
Table of Zip Codes, Counties and Metropolitan / Micropolitan / Rural Locationsfor Surveyed PharmaciesMaryland Medicaid Pharmacy Programs
Zip Code CountyCensus
Status 2, 3 Zip Code CountyCensus
Status 2, 3
21054 ANNE ARUNDEL METRO 21228 BALTIMORE METRO21060 ANNE ARUNDEL METRO 21229 BALTIMORE CITY METRO21061 ANNE ARUNDEL METRO 21230 BALTIMORE CITY METRO21074 BALTIMORE METRO 21231 BALTIMORE CITY METRO21075 ANNE ARUNDEL METRO 21234 BALTIMORE METRO21076 ANNE ARUNDEL METRO 21236 BALTIMORE METRO21078 HARFORD METRO 21237 BALTIMORE METRO21084 HARFORD METRO 21239 BALTIMORE CITY METRO21085 HARFORD METRO 21244 BALTIMORE METRO21090 ANNE ARUNDEL METRO 21263 BALTIMORE METRO21093 BALTIMORE METRO 21286 BALTIMORE METRO21102 CARROLL METRO 21287 BALTIMORE CITY METRO21104 HOWARD METRO 21401 ANNE ARUNDEL METRO21108 ANNE ARUNDEL METRO 21403 ANNE ARUNDEL METRO21111 BALTIMORE METRO 21501 ALLEGANY METRO21113 ANNE ARUNDEL METRO 21502 ALLEGANY METRO21114 ANNE ARUNDEL METRO 21531 GARRETT21117 BALTIMORE METRO 21532 ALLEGANY METRO21120 BALTIMORE METRO 21536 GARRETT21122 ANNE ARUNDEL METRO 21539 ALLEGANY METRO21128 BALTIMORE METRO 21541 GARRETT21131 BALTIMORE METRO 21550 GARRETT21133 BALTIMORE METRO 21562 ALLEGANY METRO21136 BALTIMORE METRO 21601 TALBOT MICRO21144 ANNE ARUNDEL METRO 21604 WICOMICO METRO21146 ANNE ARUNDEL METRO 21613 DORCHESTER MICRO21157 CARROLL METRO 21617 QUEEN ANNES METRO21158 CARROLL METRO 21619 QUEEN ANNES METRO21160 HARFORD METRO 21620 KENT21163 HOWARD METRO 21629 CAROLINE21201 BALTIMORE CITY METRO 21632 CAROLINE21202 BALTIMORE CITY METRO 21635 KENT21204 BALTIMORE METRO 21639 CAROLINE21205 BALTIMORE CITY METRO 21643 DORCHESTER MICRO21206 BALTIMORE CITY METRO 21651 KENT21207 BALTIMORE METRO 21655 CAROLINE21208 BALTIMORE METRO 21660 CAROLINE21209 BALTIMORE CITY METRO 21661 KENT21210 BALTIMORE CITY METRO 21663 TALBOT MICRO21211 BALTIMORE CITY METRO 21666 QUEEN ANNES METRO21212 BALTIMORE CITY METRO 21701 FREDERICK METRO21213 BALTIMORE CITY METRO 21702 FREDERICK METRO21214 BALTIMORE CITY METRO 21703 FREDERICK METRO21215 BALTIMORE CITY METRO 21704 FREDERICK METRO21216 BALTIMORE CITY METRO 21713 WASHINGTON METRO21217 BALTIMORE CITY METRO 21716 FREDERICK METRO21218 BALTIMORE CITY METRO 21717 BALTIMORE CITY METRO21219 BALTIMORE METRO 21722 WASHINGTON METRO21220 BALTIMORE METRO 21727 FREDERICK METRO21221 BALTIMORE METRO 21737 HOWARD METRO21222 BALTIMORE METRO 21740 WASHINGTON METRO21223 BALTIMORE CITY METRO 21742 WASHINGTON METRO21224 BALTIMORE CITY METRO 21745 WASHINGTON METRO21225 ANNE ARUNDEL METRO 21750 WASHINGTON METRO21227 BALTIMORE METRO 21769 FREDERICK METRO
Myers and Stauffer LC 9/13/2011
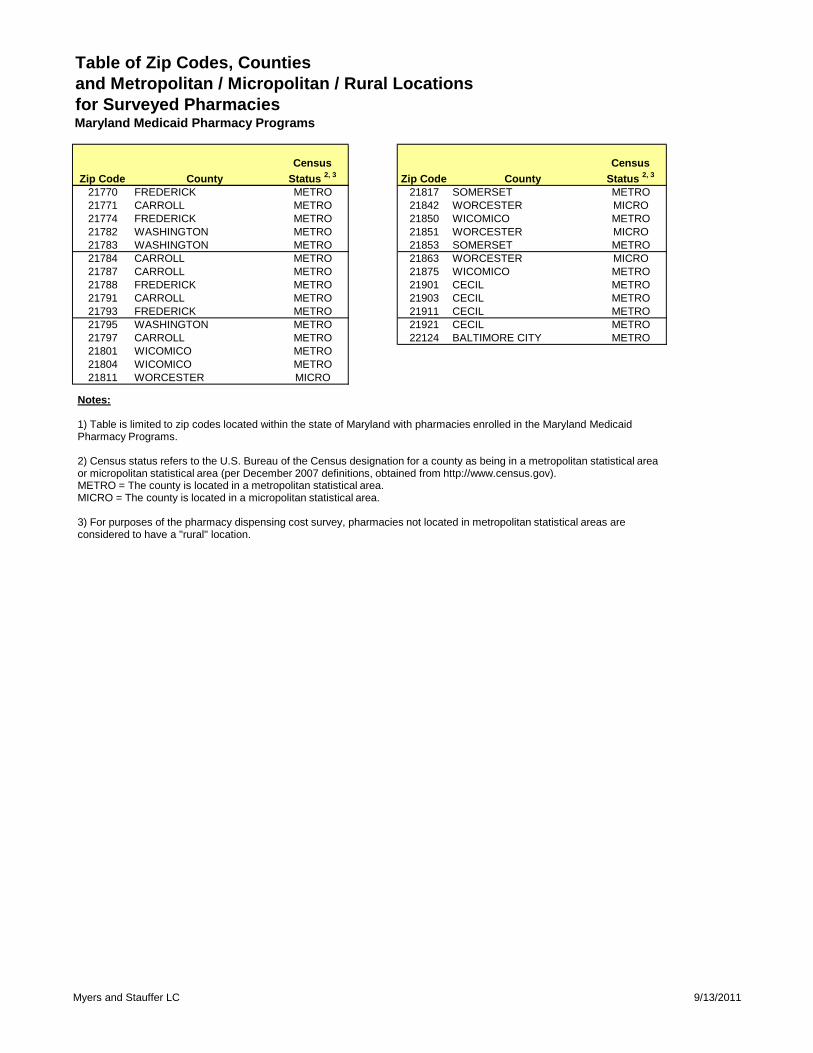
Table of Zip Codes, Counties and Metropolitan / Micropolitan / Rural Locationsfor Surveyed PharmaciesMaryland Medicaid Pharmacy Programs
Zip Code CountyCensus
Status 2, 3 Zip Code CountyCensus
Status 2, 3
21770 FREDERICK METRO 21817 SOMERSET METRO21771 CARROLL METRO 21842 WORCESTER MICRO21774 FREDERICK METRO 21850 WICOMICO METRO21782 WASHINGTON METRO 21851 WORCESTER MICRO21783 WASHINGTON METRO 21853 SOMERSET METRO21784 CARROLL METRO 21863 WORCESTER MICRO21787 CARROLL METRO 21875 WICOMICO METRO21788 FREDERICK METRO 21901 CECIL METRO21791 CARROLL METRO 21903 CECIL METRO21793 FREDERICK METRO 21911 CECIL METRO21795 WASHINGTON METRO 21921 CECIL METRO21797 CARROLL METRO 22124 BALTIMORE CITY METRO21801 WICOMICO METRO21804 WICOMICO METRO21811 WORCESTER MICRO
Notes:
1) Table is limited to zip codes located within the state of Maryland with pharmacies enrolled in the Maryland Medicaid Pharmacy Programs.
2) Census status refers to the U.S. Bureau of the Census designation for a county as being in a metropolitan statistical areaor micropolitan statistical area (per December 2007 definitions, obtained from http://www.census.gov).METRO = The county is located in a metropolitan statistical area.MICRO = The county is located in a micropolitan statistical area.
3) For purposes of the pharmacy dispensing cost survey, pharmacies not located in metropolitan statistical areas are considered to have a "rural" location.
Myers and Stauffer LC 9/13/2011
Exhibit 14 Charts Relating to Pharmacy
Prescription Volume:
A: Histogram of Pharmacy Total Prescription Volume B: Scatter-Plot of Relationship Between Dispensing
Cost per Prescription and Total Prescription Volume
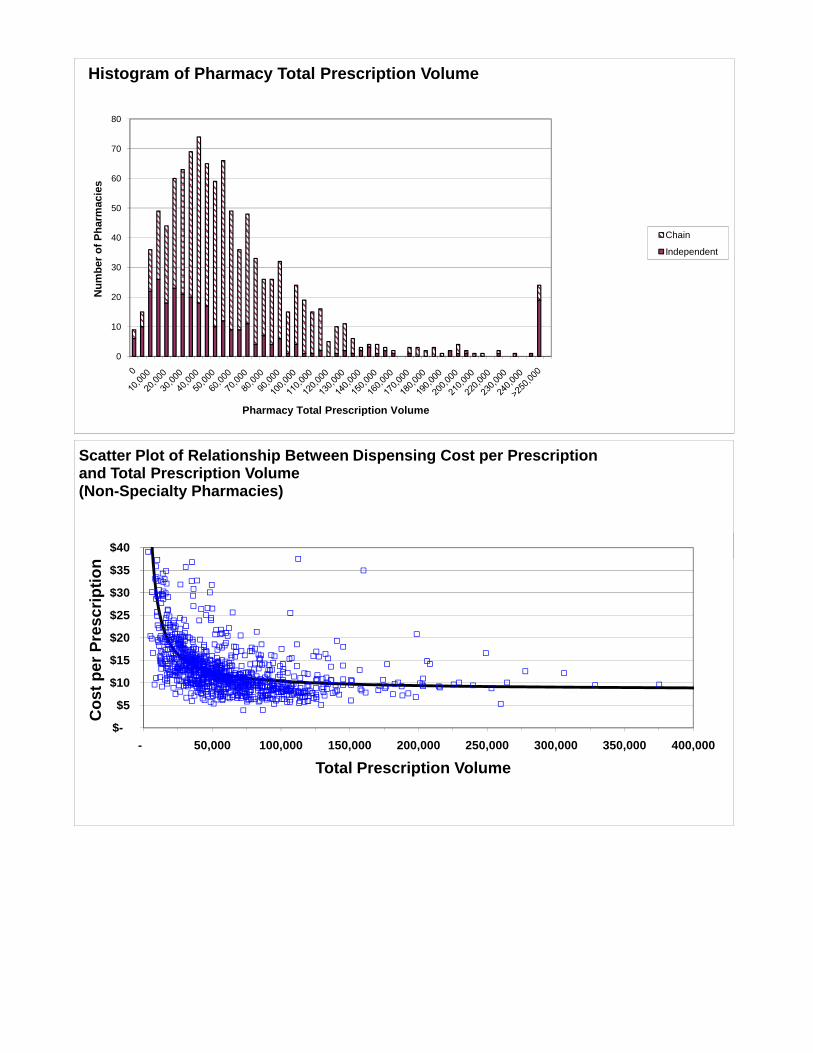
0
10
20
30
40
50
60
70
80
Num
ber o
f Pha
rmac
ies
Pharmacy Total Prescription Volume
Histogram of Pharmacy Total Prescription Volume
Chain
Independent
$40
Scatter Plot of Relationship Between Dispensing Cost per Prescription and Total Prescription Volume(Non-Specialty Pharmacies)
$-
$5
$10
$15
$20
$25
$30
$35
$40
- 50,000 100,000 150,000 200,000 250,000 300,000 350,000 400,000
Cos
t per
Pre
scrip
tion
Total Prescription Volume
Exhibit 15 Summary of Pharmacy Attributes
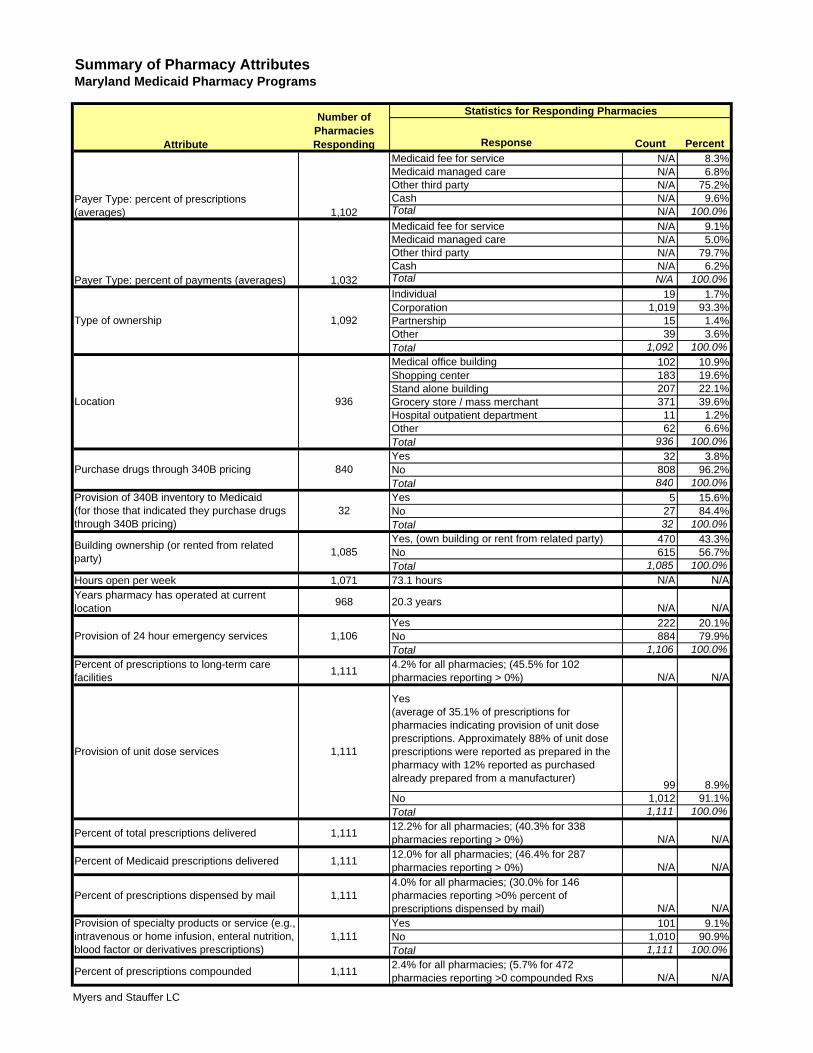
Summary of Pharmacy AttributesMaryland Medicaid Pharmacy Programs
Statistics for Responding Pharmacies
Response Count PercentMedicaid fee for service N/A 8.3%Medicaid managed care N/A 6.8%Other third party N/A 75.2%Cash N/A 9.6%Total N/A 100.0%Medicaid fee for service N/A 9.1%Medicaid managed care N/A 5.0%Other third party N/A 79.7%Cash N/A 6.2%Total N/A 100.0%Individual 19 1.7%Corporation 1,019 93.3%Partnership 15 1.4%Other 39 3.6%Total 1,092 100.0%Medical office building 102 10.9%Shopping center 183 19.6%Stand alone building 207 22.1%Grocery store / mass merchant 371 39.6%Hospital outpatient department 11 1.2%Other 62 6.6%Total 936 100.0%Yes 32 3.8%No 808 96.2%Total 840 100.0%Yes 5 15.6%No 27 84.4%Total 32 100.0%Yes, (own building or rent from related party) 470 43.3%No 615 56.7%Total 1,085 100.0%
Hours open per week 1,071 73.1 hours N/A N/AYears pharmacy has operated at current location 968 20.3 years N/A N/A
Yes 222 20.1%No 884 79.9%Total 1,106 100.0%
Percent of prescriptions to long-term care facilities 1,111 4.2% for all pharmacies; (45.5% for 102
pharmacies reporting > 0%) N/A N/A
Yes (average of 35.1% of prescriptions for pharmacies indicating provision of unit dose prescriptions. Approximately 88% of unit dose prescriptions were reported as prepared in the pharmacy with 12% reported as purchased already prepared from a manufacturer) 99 8.9%No 1,012 91.1%Total 1,111 100.0%
Percent of total prescriptions delivered 1,111 12.2% for all pharmacies; (40.3% for 338 pharmacies reporting > 0%) N/A N/A
Percent of Medicaid prescriptions delivered 1,111 12.0% for all pharmacies; (46.4% for 287 pharmacies reporting > 0%) N/A N/A
Percent of prescriptions dispensed by mail 1,1114.0% for all pharmacies; (30.0% for 146 pharmacies reporting >0% percent of prescriptions dispensed by mail) N/A N/AYes 101 9.1%No 1,010 90.9%Total 1,111 100.0%
Percent of prescriptions compounded 1,111 2.4% for all pharmacies; (5.7% for 472 pharmacies reporting >0 compounded Rxs N/A N/A
Number of Pharmacies RespondingAttribute
Type of ownership 1,092
Payer Type: percent of prescriptions (averages) 1,102
1,032Payer Type: percent of payments (averages)
1,111Provision of specialty products or service (e.g., intravenous or home infusion, enteral nutrition, blood factor or derivatives prescriptions)
Provision of unit dose services 1,111
Location 936
1,106Provision of 24 hour emergency services
Building ownership (or rented from related party) 1,085
Purchase drugs through 340B pricing
Provision of 340B inventory to Medicaid (for those that indicated they purchase drugs through 340B pricing)
840
32
Myers and Stauffer LC

Exhibit 16 Chart of Components of
Cost of Dispensing per Prescription
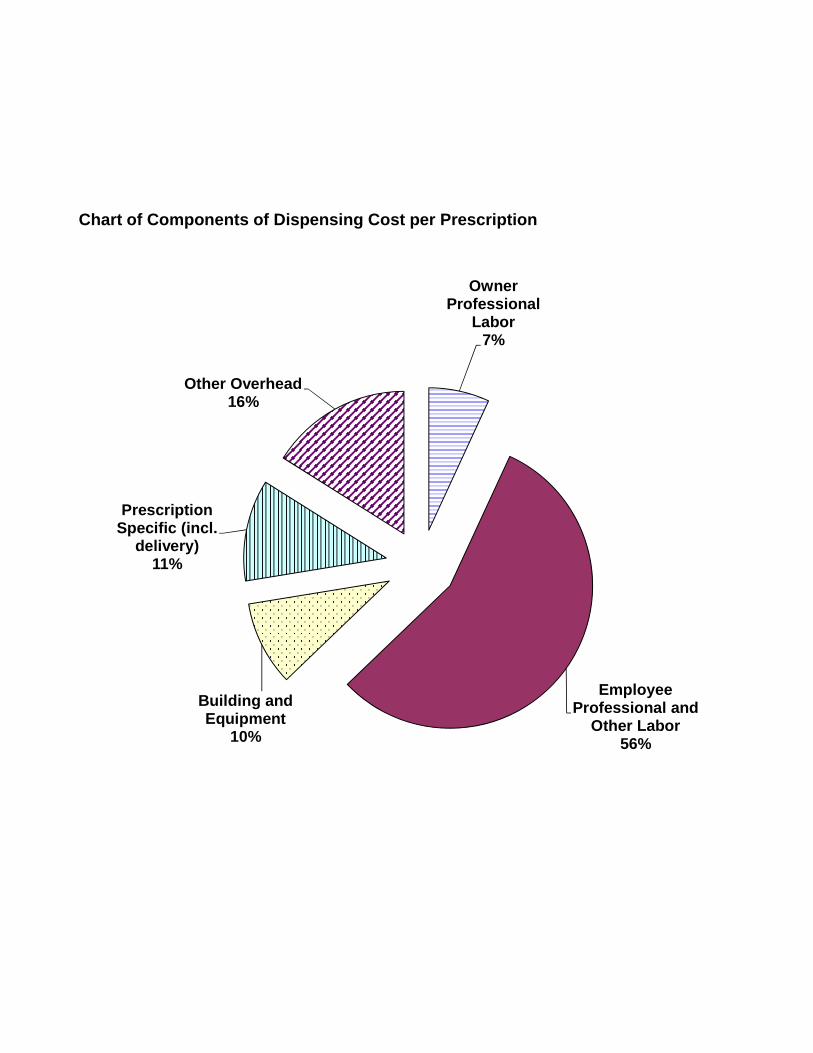
Owner Professional
Labor7%
Prescription Specific (incl.
delivery)11%
Other Overhead16%
Chart of Components of Dispensing Cost per Prescription
Employee Professional and
Other Labor56%
Building and Equipment
10%