Embed Size (px)
Citation preview
ORIGINAL RESEARCH ARTICLE
Pharmacokinetics of Morphine, Morphine-3-Glucuronideand Morphine-6-Glucuronide in Terminally Ill Adult Patients
Linda G. Franken1 • Anniek D. Masman2,3 • Brenda C. M. de Winter1 •
Birgit C. P. Koch1 • Frans P. M. Baar2 • Dick Tibboel3,4 •
Teun van Gelder1 • Ron A. A. Mathot5
Published online: 29 December 2015
� The Author(s) 2015. This article is published with open access at Springerlink.com
Abstract
Background and Objective Morphine dosing can be chal-
lenging in terminally ill adult patients due to the heterogeneous
nature of the population and the difficulty of accurately
assessing pain during sedation. To determine the pharmacoki-
netics of morphine, morphine-3-glucuronide (M3G) and mor-
phine-6-glucuronide (M6G) in this population, and to find
clinically relevant parameters for dose individualisation, we
performed a population pharmacokinetic analysis.
Methods Blood samples were randomly collected from
47 terminally ill patients in both the pre-terminal and ter-
minal phases. Nonlinear mixed-effects modelling (NON-
MEM) was used to develop a population pharmacokinetic
model and perform covariate analysis.
Results The data were accurately described by a two-
compartment model for morphine with two one-compart-
ment models for both its metabolites. Typical morphine
clearance was 48 L/h and fell exponentially by more than
10 L/h in the last week before death. Decreased albumin
levels and a decreased estimated glomerular filtration rate
(eGFR) resulted in lower metabolite clearance. Between-
subject variability in clearance was 52 % (morphine), 75 %
(M3G) and 79 % (M6G), and changed to 53, 29 and 34 %,
respectively, after inclusion of the covariates.
Conclusions Our results show that morphine clearance
decreased up to the time of death, falling by more than 10 L/h
(26 %) in the last week before death, and that M3G and M6G
accumulated due to decreased renal function. Further studies
are warranted to determine whether dose adjustment of
morphine is required in terminally ill patients.
Key Points
This is the first study to accurately describe the
pharmacokinetics of morphine and its two major
metabolites in terminally ill patients.
Morphine clearance decreased exponentially as a
patient was closer to the time of death, falling by
more than 26 % in the last week before death.
In terminally ill patients, estimated glomerular
filtration rate (eGFR) combined with albumin levels
was a better predictor for metabolite clearance than
eGFR alone.
1 Introduction
Morphine is widely used to treat pain and dyspnoea in
terminally ill patients [1]. A recent study showed that at the
time of death, 87 % of the patients in palliative care were
L. G. Franken and A. D. Masman contributed equally to this work.
& Linda G. Franken
1 Department of Hospital Pharmacy, Erasmus Medical Centre,
wytemaweg 80-na 219, 3015 Rotterdam, The Netherlands
2 Palliative Care Centre, Laurens Cadenza, Rotterdam,
The Netherlands
3 Intensive Care, Department of Paediatric Surgery, Erasmus
MC–Sophia Children’s Hospital, Rotterdam,
The Netherlands
4 Pain Expertise Centre, Erasmus MC–Sophia Children’s
Hospital, Rotterdam, The Netherlands
5 Hospital Pharmacy-Clinical Pharmacology, Academic
Medical Centre, Amsterdam, The Netherlands
Clin Pharmacokinet (2016) 55:697–709
DOI 10.1007/s40262-015-0345-4
treated with morphine [2]. Morphine is metabolised mainly
into morphine-3-glucuronide (M3G) and morphine-6-glu-
curonide (M6G). M6G is pharmacologically active and
contributes to the analgesic effect [3–5]. M3G does not
have any analgesic properties yet it has been suggested that
it may be responsible for the side effects of morphine [6,
7]. As the morphine dose is determined clinically according
to the patients’ need, accurate pain assessment is crucial.
However, in terminally ill patients this can be difficult as
pain assessment can be complicated by delirium or pal-
liative sedation [8–11]. Another difficulty with morphine
dosing in this population is that its pharmacokinetics are
likely to be highly variable. To date, no studies have been
conducted on the pharmacokinetics of morphine in this
specific population, although variability between patients is
to be expected due to the heterogeneous nature of this
population, e.g. differences in age, diagnosis and comor-
bidities. This variability is further increased by changes
within patients over time, which can be caused by the
physiological changes that occur as death approaches, such
as cachexia and a decrease in renal function [12–15].
Together with the difficulty of assessing pain in these
patients, this significant interpatient and intrapatient vari-
ability indicates the need for a dosing algorithm. The first
step in developing an individualised dosing regimen is to
gain more insight into the pharmacokinetics of this specific
patient population. Very few studies have been performed
in hospice patients, and to our knowledge no population
pharmacokinetics of morphine have been performed in
terminally ill patients. To determine the pharmacokinetics
in this population and to find clinically relevant parameters
for individualised dosing, we therefore performed a popu-
lation pharmacokinetic analysis of morphine, M3G and
M6G in terminally ill patients.
2 Materials and Methods
2.1 Study Design
This prospective, observational study in terminally ill
patients was approved by the Medical Ethics Committee of
the Erasmus University Medical Centre, Rotterdam, and
was performed in accordance with the principles of the
Declaration of Helsinki and its later amendments. The
study was conducted in the palliative care centre, Laurens
Cadenza, Rotterdam, The Netherlands, over a 2-year per-
iod. Patients were included in the study upon admittance to
the palliative care centre and were followed until the time
of death. Inclusion criteria were terminal illness, prognosis
survival of more than 2 days and less than 3 months,
administration of morphine, and patients had given
informed consent. Morphine was administered for pain and
dyspnoea and was administered according to national pal-
liative guidelines, with daily doses ranging from 15 to
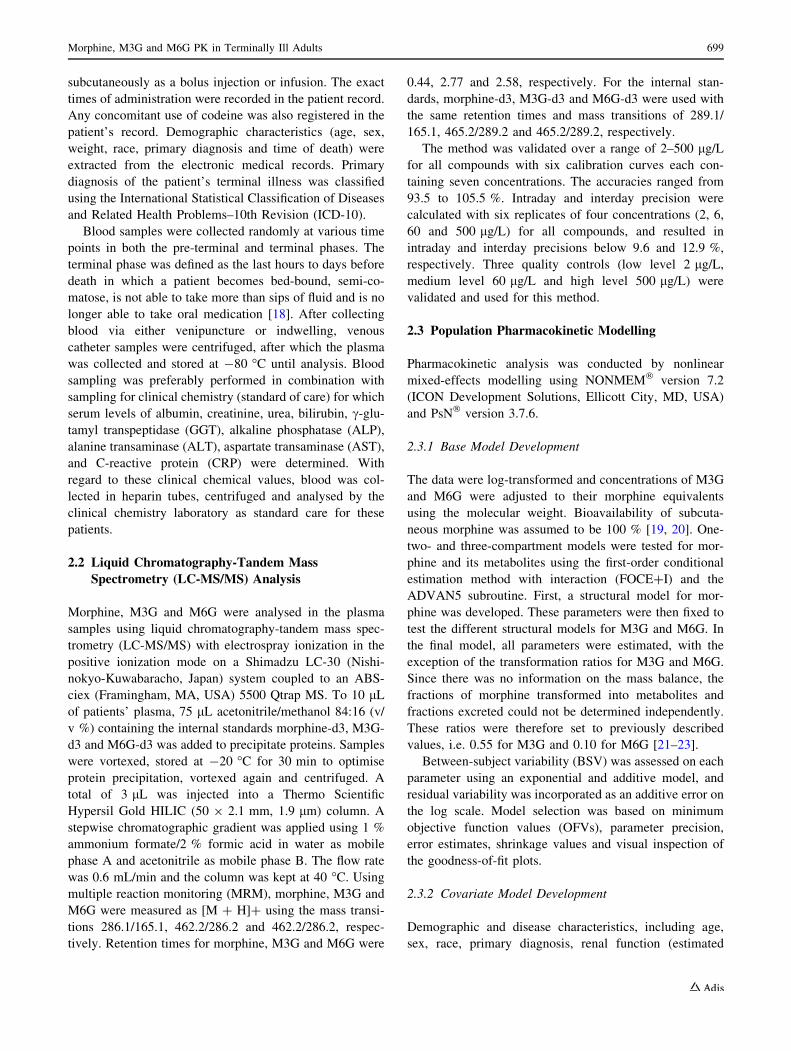
540 mg [16, 17]. Figure 1a shows a representative patient
receiving increasing daily morphine doses over time.
Morphine was administered orally as controlled release
tablets or immediate-release liquid, or administered
(a)
(b)
(c)
Fig. 1 Dose and concentration data of a patient representative for the
study population over time. This individual had a decrease in renal
function with a drop in eGFR from 41.4 to 16.3 at T = 283 h. a Dailydoses of subcutaneous morphine over time until the time of death.
bMorphine concentrations over time. Post hoc predictions (solid line)
and measured morphine concentrations (open circles). c Metabolite
concentrations over time. Post hoc predictions of M3G (solid line)
and M6G (dashed line), as well as measured M3G (triangles) and
M6G (crosses) concentrations. eGFR estimated glomerular filtration
rate, M3G morphine-3-glucuronide, M6G morphine-6-glucuronide
698 L. G. Franken et al.
subcutaneously as a bolus injection or infusion. The exact
times of administration were recorded in the patient record.
Any concomitant use of codeine was also registered in the
patient’s record. Demographic characteristics (age, sex,
weight, race, primary diagnosis and time of death) were
extracted from the electronic medical records. Primary
diagnosis of the patient’s terminal illness was classified
using the International Statistical Classification of Diseases
and Related Health Problems–10th Revision (ICD-10).
Blood samples were collected randomly at various time
points in both the pre-terminal and terminal phases. The
terminal phase was defined as the last hours to days before
death in which a patient becomes bed-bound, semi-co-
matose, is not able to take more than sips of fluid and is no
longer able to take oral medication [18]. After collecting
blood via either venipuncture or indwelling, venous
catheter samples were centrifuged, after which the plasma
was collected and stored at -80 �C until analysis. Blood
sampling was preferably performed in combination with
sampling for clinical chemistry (standard of care) for which
serum levels of albumin, creatinine, urea, bilirubin, c-glu-tamyl transpeptidase (GGT), alkaline phosphatase (ALP),
alanine transaminase (ALT), aspartate transaminase (AST),
and C-reactive protein (CRP) were determined. With
regard to these clinical chemical values, blood was col-
lected in heparin tubes, centrifuged and analysed by the
clinical chemistry laboratory as standard care for these
patients.
2.2 Liquid Chromatography-Tandem Mass
Spectrometry (LC-MS/MS) Analysis
Morphine, M3G and M6G were analysed in the plasma
samples using liquid chromatography-tandem mass spec-
trometry (LC-MS/MS) with electrospray ionization in the
positive ionization mode on a Shimadzu LC-30 (Nishi-
nokyo-Kuwabaracho, Japan) system coupled to an ABS-
ciex (Framingham, MA, USA) 5500 Qtrap MS. To 10 lLof patients’ plasma, 75 lL acetonitrile/methanol 84:16 (v/
v %) containing the internal standards morphine-d3, M3G-
d3 and M6G-d3 was added to precipitate proteins. Samples
were vortexed, stored at -20 �C for 30 min to optimise
protein precipitation, vortexed again and centrifuged. A
total of 3 lL was injected into a Thermo Scientific
Hypersil Gold HILIC (50 9 2.1 mm, 1.9 lm) column. A
stepwise chromatographic gradient was applied using 1 %
ammonium formate/2 % formic acid in water as mobile
phase A and acetonitrile as mobile phase B. The flow rate
was 0.6 mL/min and the column was kept at 40 �C. Usingmultiple reaction monitoring (MRM), morphine, M3G and
M6G were measured as [M ? H]? using the mass transi-
tions 286.1/165.1, 462.2/286.2 and 462.2/286.2, respec-
tively. Retention times for morphine, M3G and M6G were
0.44, 2.77 and 2.58, respectively. For the internal stan-
dards, morphine-d3, M3G-d3 and M6G-d3 were used with
the same retention times and mass transitions of 289.1/
165.1, 465.2/289.2 and 465.2/289.2, respectively.
The method was validated over a range of 2–500 lg/Lfor all compounds with six calibration curves each con-
taining seven concentrations. The accuracies ranged from
93.5 to 105.5 %. Intraday and interday precision were
calculated with six replicates of four concentrations (2, 6,
60 and 500 lg/L) for all compounds, and resulted in
intraday and interday precisions below 9.6 and 12.9 %,
respectively. Three quality controls (low level 2 lg/L,medium level 60 lg/L and high level 500 lg/L) were
validated and used for this method.
2.3 Population Pharmacokinetic Modelling
Pharmacokinetic analysis was conducted by nonlinear
mixed-effects modelling using NONMEM� version 7.2
(ICON Development Solutions, Ellicott City, MD, USA)
and PsN� version 3.7.6.
2.3.1 Base Model Development
The data were log-transformed and concentrations of M3G
and M6G were adjusted to their morphine equivalents
using the molecular weight. Bioavailability of subcuta-
neous morphine was assumed to be 100 % [19, 20]. One-
two- and three-compartment models were tested for mor-
phine and its metabolites using the first-order conditional
estimation method with interaction (FOCE?I) and the
ADVAN5 subroutine. First, a structural model for mor-
phine was developed. These parameters were then fixed to
test the different structural models for M3G and M6G. In
the final model, all parameters were estimated, with the
exception of the transformation ratios for M3G and M6G.
Since there was no information on the mass balance, the
fractions of morphine transformed into metabolites and
fractions excreted could not be determined independently.
These ratios were therefore set to previously described
values, i.e. 0.55 for M3G and 0.10 for M6G [21–23].
Between-subject variability (BSV) was assessed on each
parameter using an exponential and additive model, and
residual variability was incorporated as an additive error on
the log scale. Model selection was based on minimum
objective function values (OFVs), parameter precision,
error estimates, shrinkage values and visual inspection of
the goodness-of-fit plots.
2.3.2 Covariate Model Development
Demographic and disease characteristics, including age,
sex, race, primary diagnosis, renal function (estimated
Morphine, M3G and M6G PK in Terminally Ill Adults 699
glomerular filtration rate [eGFR], plasma creatinine and
plasma urea), hepatic function (plasma levels of bilirubin,
GGT, ALP, ALT, and AST), CRP, albumin, and the con-
comitant use of codeine, were evaluated as potential model
covariates. Time to death (TTD) was also evaluated as a
covariate. This parameter cannot be used as a covariate
parameter for a priori prediction of individual pharma-
cokinetic changes but it may give insight into quantitative
changes at the end of life that are not predicted by standard
blood chemistry tests. As heart and respiratory rates are not
measured in a palliative care centre, standard disease
severity scoring systems used in internal medicine (e.g. the
simple clinical score or rapid emergency medicine score)
cannot be used in this situation. The relationship between
covariates and individual estimates was first investigated
graphically and was further tested in a univariate analysis.
Covariates that significantly improved the model
(p B 0.05) were added to the full model. A backward
elimination process was then performed with statistical
significance indicated by p B 0.001.
Continuous covariates were normalised to the popula-
tion median values and incorporated as power model
functions (Eq. 1). Categorical covariates were transformed
to binary covariates and incorporated as shown in Eq. 2.
hi ¼ hpop �covi
covm
� �hcov
ð1Þ
hi ¼ hpop � hcovicov ð2Þ
with hi being the individual model-predicted pharmacoki-
netic parameter (e.g. clearance) for an individual with
covariate value covi, hpop being the population estimate
for that parameter, covm representing the median covariate
value and hcov representing the covariate effect. In the
equation for categorical covariates, covi is either 1 or 0.
To evaluate the TTD as a covariate, time dependency of
the parameters was modelled as a first-order process given
to following equation (Eq. 3),
hi ¼ hpop � hD � expð�hrate � TTDÞ ð3Þ
in which hD is the change in parameter value from its initial
value and hrate is a first-order rate constant determining the
rate with which the parameter value changes over time.
2.3.3 Model Evaluation
A bootstrap with 500 runs was performed on the final
model to evaluate the validity of the parameter estimates
and their corresponding 95 % confidence intervals (CIs).
Due to the study design, i.e. sparse sampling, different
dosing regimens and both oral and subcutaneous adminis-
trations, a visual predictive check could not be performed
to evaluate the model. We therefore evaluated the
predictive performance of the final model using a nor-
malised prediction distribution errors (NPDE) analysis.
NPDE is a simulation-based diagnostics which can be used
to evaluate models developed on datasets with variable
dosing regimens. The analytical value of this method has
been previously described by Comets et al. [24].
3 Results
A total of 47 terminally ill patients were included in the
study. Their median age was 71 years (range 43–93),
55.3 % were female and the median duration of admittance
(from moment of admittance until the time of death) was
33 days (range 7–457). Almost all patients (95.7 %) had
advanced malignancy as the primary diagnosis. Patient
characteristics are given in Table 1. From these patients, a
total of 152 blood samples were collected and analysed for
morphine, M3G and M6G concentrations. Figure 1b and c
show the concentrations of morphine, M3G and M6G over
time for a representative patient. As shown in these graphs,
the morphine concentration increases as the dose increases,
and near the end of life M3G and M6G concentrations
increase significantly. Circa 12 % of the plasma concen-
trations were below the quantification limit (BLQ), largely
due to two patients who had had blood samples taken more
than 10 days after the last morphine dose. BLQ data were
therefore discarded using the M1 method previously dis-
cussed by Ahn et al. [25].
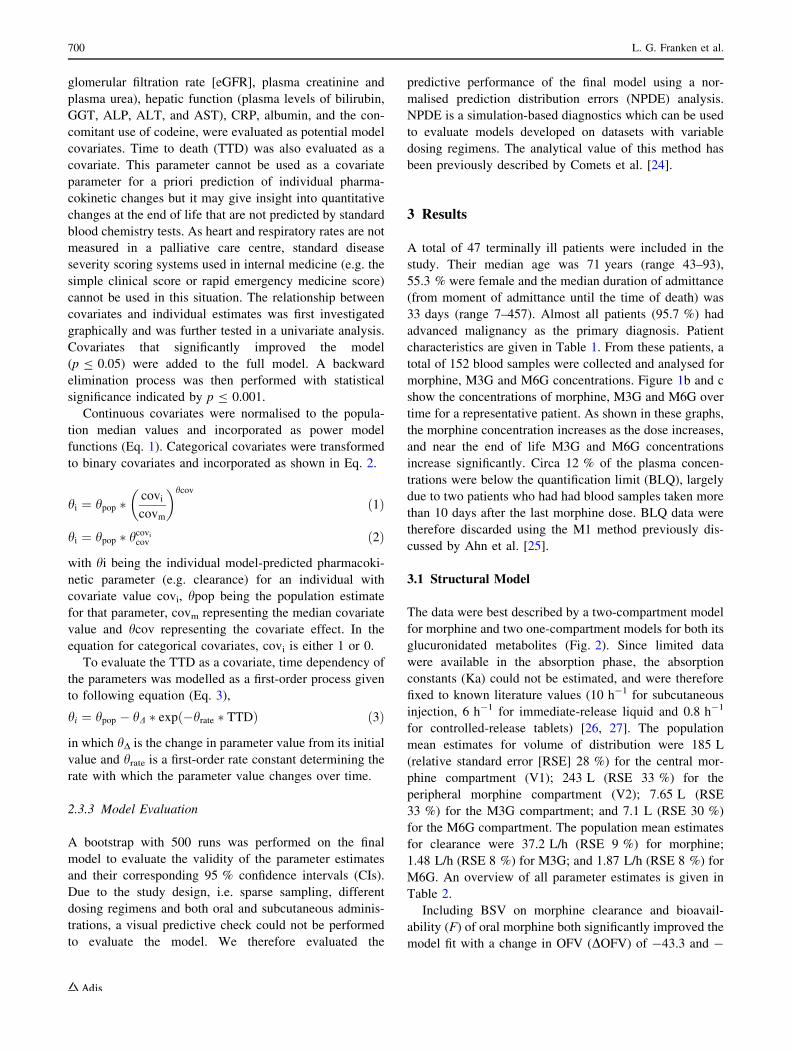
3.1 Structural Model
The data were best described by a two-compartment model
for morphine and two one-compartment models for both its
glucuronidated metabolites (Fig. 2). Since limited data
were available in the absorption phase, the absorption
constants (Ka) could not be estimated, and were therefore
fixed to known literature values (10 h-1 for subcutaneous
injection, 6 h-1 for immediate-release liquid and 0.8 h-1
for controlled-release tablets) [26, 27]. The population
mean estimates for volume of distribution were 185 L
(relative standard error [RSE] 28 %) for the central mor-
phine compartment (V1); 243 L (RSE 33 %) for the
peripheral morphine compartment (V2); 7.65 L (RSE
33 %) for the M3G compartment; and 7.1 L (RSE 30 %)
for the M6G compartment. The population mean estimates
for clearance were 37.2 L/h (RSE 9 %) for morphine;
1.48 L/h (RSE 8 %) for M3G; and 1.87 L/h (RSE 8 %) for
M6G. An overview of all parameter estimates is given in
Table 2.
Including BSV on morphine clearance and bioavail-
ability (F) of oral morphine both significantly improved the
model fit with a change in OFV (DOFV) of -43.3 and -
700 L. G. Franken et al.
7.05, respectively. The correlation between BSV of M3G
and M6G clearance was high and fixed to unity. A similar
approach was used for BSV on the volumes of distribution
of M3G and M6G. Adding BSV on metabolite clearance
and metabolite volume significantly improved the model fit
with a change in objective function of 157.0 and 47.1,
respectively. In all cases, an exponential model for BSV
proved superior to an additive model.
Since M3G and M6G are renally cleared, and because
there were patients who developed renal failure over time,
a measure for renal failure was added to the structural
model. This was done by evaluating the covariate effect of
creatinine levels, urea levels, and eGFR on metabolite
clearance. Glomerular filtration rate was estimated using
the generally accepted, four-variable, Modification of Diet
in Renal Disease (MDRD) equation consisting of age, sex,
ethnicity, and serum creatinine levels (Eq. 4) [28]. Esti-
mated GFR gave the best results (DOFV -75.97 vs -73.58
for creatinine levels and -66.77 for urea levels) and was
therefore included in the structural model.
eGFR ¼ 186� serum creatinine (mg/dl)�1:154 � age�0:203
� ð1:210 if blackÞ � ð0:742 if femaleÞð4Þ
3.2 Covariate Analysis
The structural model including eGFR on metabolite
clearance was used as a reference for the covariate analy-
sis. The univariate analysis resulted in a further eight sig-
nificant covariates, three of which were correlated with
morphine clearance (i.e. TTD, bilirubin, and urea), two
were correlated with metabolite clearance (i.e. albumin and
CRP), two were correlated with the volume of distribution
of the metabolites (i.e. creatinine and urea), and one was
correlated with bioavailability (i.e. race). The results of the
univariate analysis, in terms of decrease in OFV and
covariate effect, are shown in Table 3. After backwards
elimination of p\ 0.001, only albumin levels on metabo-
lite clearance and TTD on morphine clearance remained in
the final model.
Because the final model had both eGFR and albumin
levels as covariates on metabolite clearance, we also tested
Fig. 2 Schematic representation of the two-compartment model for
morphine and its two main metabolites. F bioavailability of oral
morphine, V1 central compartment for morphine, V2 peripheral
compartment for morphine, Q intercompartmental clearance of
morphine, Clt total morphine clearance, Fm1 fraction of morphine
clearance responsible for M3G formation, Fm2 fraction of morphine
clearance responsible for M6G formation, Clr remaining morphine
clearance (Clt*1-(Fm1 ? Fm2)), ClM3G clearance of M3G, ClM6G
clearance of M6G, M3G morphine-3-glucuronide, M6G morphine-6-
glucuronide
Table 1 Patient characteristics
Characteristics N = 47
Age [years; median (range)] 71 (43–93)
Male [n (%)] 21 (44.7)
Female [n (%)] 26 (55.3)
Ethnic origin [n (%)]
Caucasian 45 (95.7)
Afro-Caribbean 2 (4.3)
Primary diagnosis [n (%)]
Neoplasm 45 (95.7)
Disease of the circulatory system 1 (2.1)
Disease of the respiratory system 1 (2.1)
Blood chemistry, serum levels at admission [median (range)]
Albumin, g/L 26 (14–39)
Urea, mmol/L 7.2 (1.5–43.4)
Bilirubin, lmol/L 8 (3–256)
c-Glutamyl transpeptidase, U/L 64 (7–3859)
Alkaline phosphatase, U/L 112 (20–2117)
Alanine transaminase, U/L 12 (7–406)
Aspartate transaminase, U/L 32 (14–255)
C-reactive protein, U/L 67 (1–188)
Creatinine, lmol/L 72 (22–229)
eGFR by standard MDRDa, ml/min/1.73 m2 96 (27–239)
eGFR by original MDRDb, ml/min/1.73 m2 83 (22–202)
Patients using codeinec [n (%)] 2 (4.2)
Duration of stay [days; median (range)] 33 (7–457)
Blood samples collected [n; median (range)] 2 (1–10)
eGFR estimated glomerular filtration rate, MDRD Modification of
Diet in Renal Diseasea The abbreviated MDRD equation consisted of four variables (age,
sex, race and serum creatinine), as shown in Eq. 4b The original MDRD formula consisted of six variables (age, sex,
race, serum creatinine, serum albumin and serum urea), as shown in
Eq. 5c During any moment while receiving morphine treatment
Morphine, M3G and M6G PK in Terminally Ill Adults 701
if these two covariates could be replaced by the eGFR
estimated using the original six-variable MDRD formula
(Eq. 5) [28]. This formula calculates GFR using not only
sex, weight, race and creatinine levels but also takes into
account albumin and urea levels. However, this more
elaborate version of the MDRD equation did not improve
the model fit (OFV -342.9 vs. -351.6 for the standard
four-variable MDRD equation). Together, estimated GFR
and serum albumin decreased the unexplained variability
on M3G and M6G clearance from 75.4 and 79.1 to 29.3
Table 2 Parameter estimates of the base model, final model and bootstrap analysis
Parameter Structural model Final model RSE (%) Shrinkage (%) Bootstrap of the final model
Estimate 95 % CI (lower) 95 % CI (upper)
OFV -323.7 -351.6
Morphine
F 0.28 0.30 13.6 – 0.31 0.18 0.53
CL (L/h) 37.2 47.5 11 – 49.9 39.1 75.6
V1 (L) 185 190 28 – 190 116 369
Q (L/h) 75 76.1 35.7 – 65.1 9.95 146
V2 (L) 246 243 19 – 248 121 377
M3G
Fm1 0.55a 0.55a NA – 0.55a 0.55a 0.55a
CL (L/h) 1.48 1.44 4.8 – 1.44 1.30 1.59
V1 (L) 7.65 8.02 33.2 – 7.75 3.62 14.9
M6G
Fm2 0.1a 0.1a NA – 0.1a 0.1a 0.1a
CL (L/h) 1.87 1.78 6.8 – 1.79 1.56 2.05
V1 (L) 7.1 8.24 30.7 – 7.97 3.77 14.0
Covariate effect on M3G and M6G clearance
eGFRb 0.83 0.673 16.8 – 0.67 0.50 1.03
Albumin – 1.1 23.3 – 1.06 0.332 1.56
Covariate effect on M3G and M6G clearance
TTDc (D), days – 17.6 24.7 – 19.2 9.48 46.6
TTDc (rate), days – 0.13 32 – 0.12 0.05 0.31
Between-subject variability (%)
F 48.2 37.8 38.3 9.5 38.7 1.7 58.0
Morphine CL 54.0 53.4 30.1 13.3 50.0 31.7 71.8
M3G CL 39.7 29.3 29.2 5.5 29.3 20.4 41.7
M6G CL 43.5 34.3 29.2 5.5 34.1 23.8 48.4
M3G V1 135.5 151.7 31.4 6.1 147.9 80.3 203.1
M6G V1 130.4 143.0 31.4 6.1 141.5 76.8 194.4
Residual variability
Morphine 0.448 0.432 10.4 10 0.425 0.335 0.510
M3G 0.250 0.246 9.3 10 0.239 0.194 0.282
M6G 0.261 0.265 6.6 10 0.254 0.218 0.294
RSE relative standard error, CI confidence interval, OFV objective function value, F bioavailability of oral morphine, CL clearance, V1 central
compartment for morphine, V2 peripheral compartment for morphine, Q intercompartmental clearance of morphine, M3G morphine-3-glu-
curonide, M6G morphine-6-glucuronide, NA not applicable, Fm1 fraction of morphine clearance responsible for M3G formation, Fm2 fraction of
morphine clearance responsible for M6G formation, eGFR estimated glomerular filtration rate, TTD time to death,MDRDModification of Diet in
Renal Disease, GFR glomerular filtration ratea Transformation ratios for M3G and M6G were fixed to known literature valuesb GFR was estimated using the standard four-variable MDRD equationc TTD was incorporated as a first-order process, with TTDD (overall change in clearance) as the change in parameter value from its initial value
and TTDrate (change in clearance per day as described by the first order process) as the first-order rate constant
702 L. G. Franken et al.
and 34.3 %, respectively. They hereby explained 61.1 % of
the BSV in M3G clearance and 56.6 % of the BSV on
M6G clearance. The covariate TTD did not decrease the
unexplained variability on morphine clearance; however, it
did decrease the RSE on the volumes of both metabolites
(from 65.7 to 33.2 % for M3G, and from 63.8 to 30.7 % for
M6G).
eGFR ¼ 170 � serum creatininemg
dl
� ��0:999
� age�0:176 � 1:180if blackð Þ � 0:762if femaleð Þ� serum urea nitrogen (mg/dl)�0:170
� albumin (g/dl)0:318
ð5Þ
3.3 Simulations
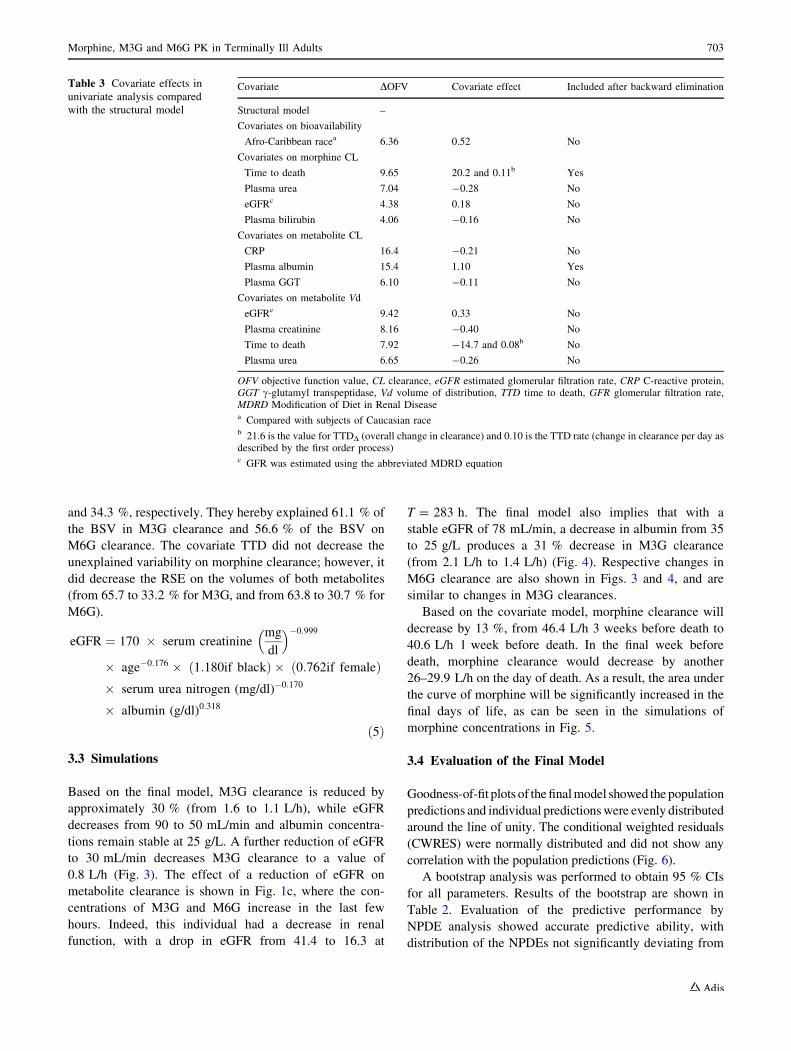
Based on the final model, M3G clearance is reduced by
approximately 30 % (from 1.6 to 1.1 L/h), while eGFR
decreases from 90 to 50 mL/min and albumin concentra-
tions remain stable at 25 g/L. A further reduction of eGFR
to 30 mL/min decreases M3G clearance to a value of
0.8 L/h (Fig. 3). The effect of a reduction of eGFR on
metabolite clearance is shown in Fig. 1c, where the con-
centrations of M3G and M6G increase in the last few
hours. Indeed, this individual had a decrease in renal
function, with a drop in eGFR from 41.4 to 16.3 at
T = 283 h. The final model also implies that with a
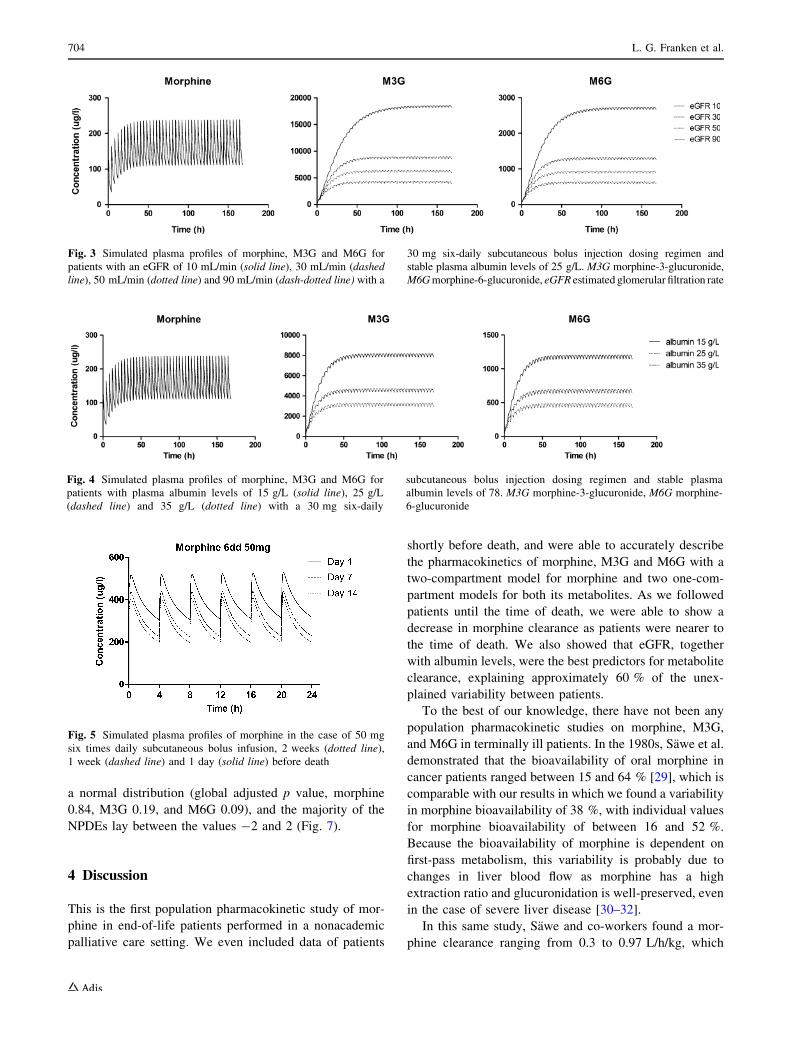
stable eGFR of 78 mL/min, a decrease in albumin from 35
to 25 g/L produces a 31 % decrease in M3G clearance
(from 2.1 L/h to 1.4 L/h) (Fig. 4). Respective changes in
M6G clearance are also shown in Figs. 3 and 4, and are
similar to changes in M3G clearances.
Based on the covariate model, morphine clearance will
decrease by 13 %, from 46.4 L/h 3 weeks before death to
40.6 L/h 1 week before death. In the final week before
death, morphine clearance would decrease by another
26–29.9 L/h on the day of death. As a result, the area under
the curve of morphine will be significantly increased in the
final days of life, as can be seen in the simulations of
morphine concentrations in Fig. 5.
3.4 Evaluation of the Final Model
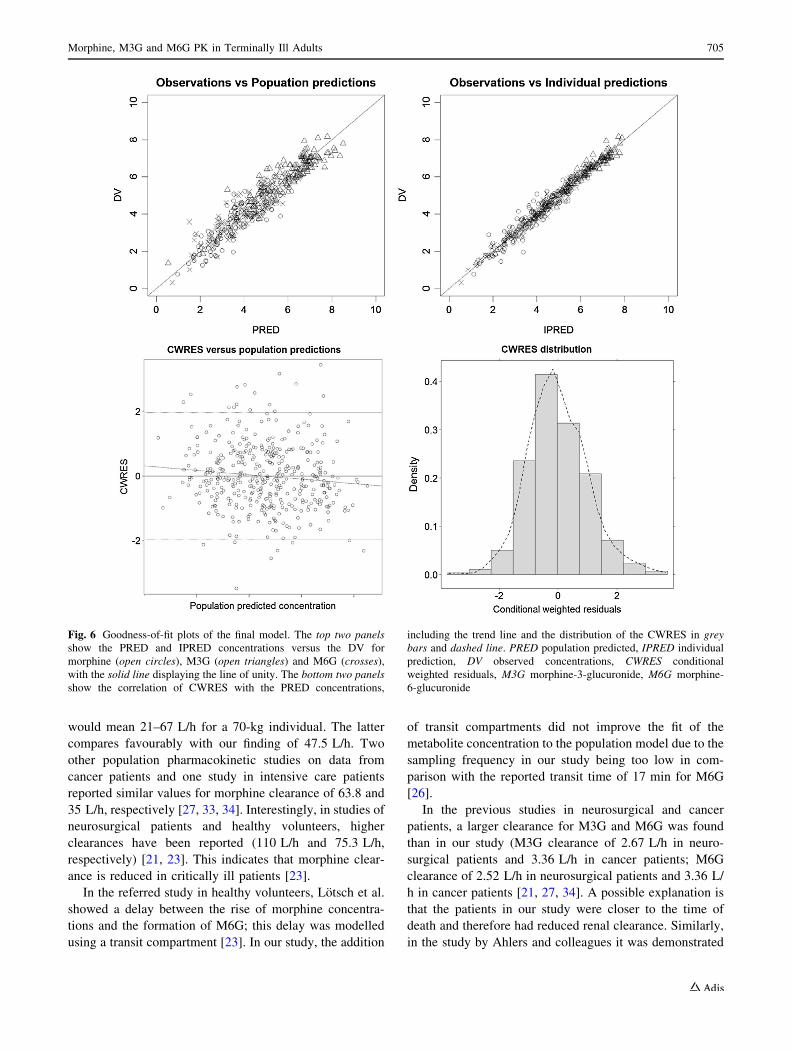
Goodness-of-fit plots of thefinalmodel showed the population
predictions and individual predictionswere evenly distributed
around the line of unity. The conditional weighted residuals
(CWRES) were normally distributed and did not show any
correlation with the population predictions (Fig. 6).
A bootstrap analysis was performed to obtain 95 % CIs
for all parameters. Results of the bootstrap are shown in
Table 2. Evaluation of the predictive performance by
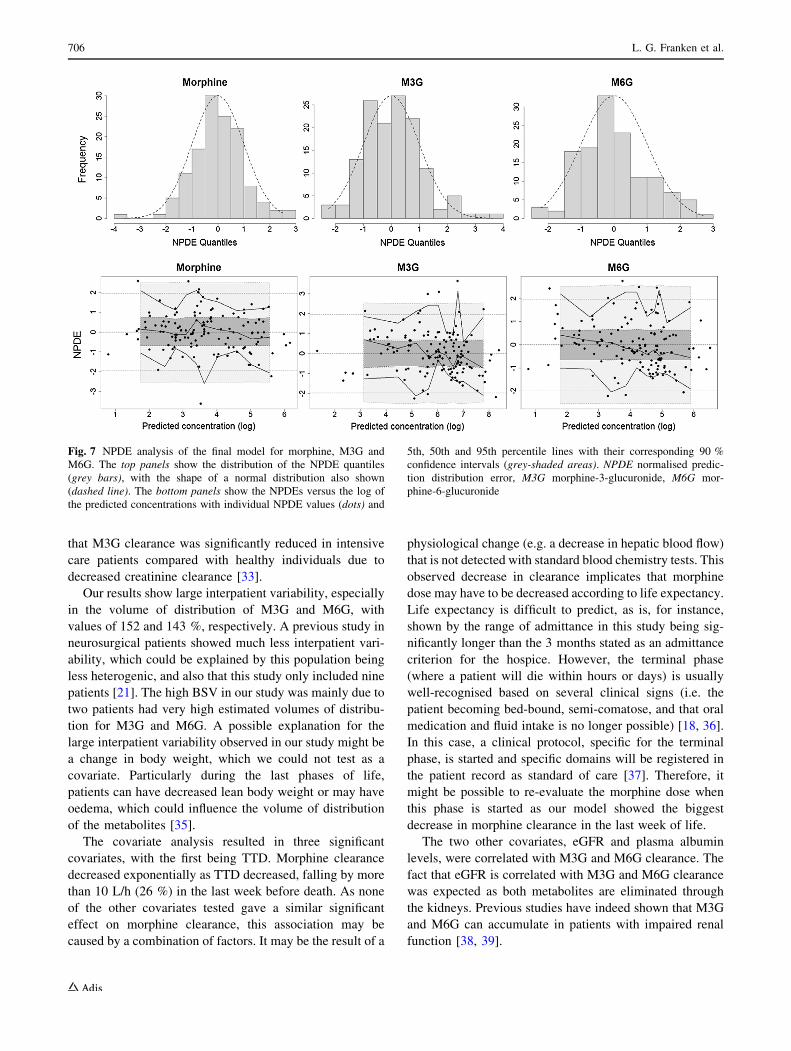
NPDE analysis showed accurate predictive ability, with
distribution of the NPDEs not significantly deviating from
Table 3 Covariate effects in
univariate analysis compared
with the structural model
Covariate DOFV Covariate effect Included after backward elimination
Structural model –
Covariates on bioavailability
Afro-Caribbean racea 6.36 0.52 No
Covariates on morphine CL
Time to death 9.65 20.2 and 0.11b Yes
Plasma urea 7.04 -0.28 No
eGFRc 4.38 0.18 No
Plasma bilirubin 4.06 -0.16 No
Covariates on metabolite CL
CRP 16.4 -0.21 No
Plasma albumin 15.4 1.10 Yes
Plasma GGT 6.10 -0.11 No
Covariates on metabolite Vd
eGFRc 9.42 0.33 No
Plasma creatinine 8.16 -0.40 No
Time to death 7.92 -14.7 and 0.08b No
Plasma urea 6.65 -0.26 No
OFV objective function value, CL clearance, eGFR estimated glomerular filtration rate, CRP C-reactive protein,GGT c-glutamyl transpeptidase, Vd volume of distribution, TTD time to death, GFR glomerular filtration rate,MDRD Modification of Diet in Renal Diseasea Compared with subjects of Caucasian raceb 21.6 is the value for TTDD (overall change in clearance) and 0.10 is the TTD rate (change in clearance per day asdescribed by the first order process)c GFR was estimated using the abbreviated MDRD equation
Morphine, M3G and M6G PK in Terminally Ill Adults 703
a normal distribution (global adjusted p value, morphine
0.84, M3G 0.19, and M6G 0.09), and the majority of the
NPDEs lay between the values -2 and 2 (Fig. 7).
4 Discussion
This is the first population pharmacokinetic study of mor-
phine in end-of-life patients performed in a nonacademic
palliative care setting. We even included data of patients
shortly before death, and were able to accurately describe
the pharmacokinetics of morphine, M3G and M6G with a
two-compartment model for morphine and two one-com-
partment models for both its metabolites. As we followed
patients until the time of death, we were able to show a
decrease in morphine clearance as patients were nearer to
the time of death. We also showed that eGFR, together
with albumin levels, were the best predictors for metabolite
clearance, explaining approximately 60 % of the unex-
plained variability between patients.
To the best of our knowledge, there have not been any
population pharmacokinetic studies on morphine, M3G,
and M6G in terminally ill patients. In the 1980s, Sawe et al.
demonstrated that the bioavailability of oral morphine in
cancer patients ranged between 15 and 64 % [29], which is
comparable with our results in which we found a variability
in morphine bioavailability of 38 %, with individual values
for morphine bioavailability of between 16 and 52 %.
Because the bioavailability of morphine is dependent on
first-pass metabolism, this variability is probably due to
changes in liver blood flow as morphine has a high
extraction ratio and glucuronidation is well-preserved, even
in the case of severe liver disease [30–32].
In this same study, Sawe and co-workers found a mor-
phine clearance ranging from 0.3 to 0.97 L/h/kg, which
Fig. 3 Simulated plasma profiles of morphine, M3G and M6G for
patients with an eGFR of 10 mL/min (solid line), 30 mL/min (dashed
line), 50 mL/min (dotted line) and 90 mL/min (dash-dotted line) with a
30 mg six-daily subcutaneous bolus injection dosing regimen and
stable plasma albumin levels of 25 g/L. M3G morphine-3-glucuronide,
M6Gmorphine-6-glucuronide, eGFR estimated glomerular filtration rate
Fig. 4 Simulated plasma profiles of morphine, M3G and M6G for
patients with plasma albumin levels of 15 g/L (solid line), 25 g/L
(dashed line) and 35 g/L (dotted line) with a 30 mg six-daily
subcutaneous bolus injection dosing regimen and stable plasma
albumin levels of 78. M3G morphine-3-glucuronide, M6G morphine-
6-glucuronide
Fig. 5 Simulated plasma profiles of morphine in the case of 50 mg
six times daily subcutaneous bolus infusion, 2 weeks (dotted line),
1 week (dashed line) and 1 day (solid line) before death
704 L. G. Franken et al.
would mean 21–67 L/h for a 70-kg individual. The latter
compares favourably with our finding of 47.5 L/h. Two
other population pharmacokinetic studies on data from
cancer patients and one study in intensive care patients
reported similar values for morphine clearance of 63.8 and
35 L/h, respectively [27, 33, 34]. Interestingly, in studies of
neurosurgical patients and healthy volunteers, higher
clearances have been reported (110 L/h and 75.3 L/h,
respectively) [21, 23]. This indicates that morphine clear-
ance is reduced in critically ill patients [23].
In the referred study in healthy volunteers, Lotsch et al.
showed a delay between the rise of morphine concentra-
tions and the formation of M6G; this delay was modelled
using a transit compartment [23]. In our study, the addition
of transit compartments did not improve the fit of the
metabolite concentration to the population model due to the
sampling frequency in our study being too low in com-
parison with the reported transit time of 17 min for M6G
[26].
In the previous studies in neurosurgical and cancer
patients, a larger clearance for M3G and M6G was found
than in our study (M3G clearance of 2.67 L/h in neuro-
surgical patients and 3.36 L/h in cancer patients; M6G
clearance of 2.52 L/h in neurosurgical patients and 3.36 L/
h in cancer patients [21, 27, 34]. A possible explanation is
that the patients in our study were closer to the time of
death and therefore had reduced renal clearance. Similarly,
in the study by Ahlers and colleagues it was demonstrated
Fig. 6 Goodness-of-fit plots of the final model. The top two panels
show the PRED and IPRED concentrations versus the DV for
morphine (open circles), M3G (open triangles) and M6G (crosses),
with the solid line displaying the line of unity. The bottom two panels
show the correlation of CWRES with the PRED concentrations,
including the trend line and the distribution of the CWRES in grey
bars and dashed line. PRED population predicted, IPRED individual
prediction, DV observed concentrations, CWRES conditional
weighted residuals, M3G morphine-3-glucuronide, M6G morphine-
6-glucuronide
Morphine, M3G and M6G PK in Terminally Ill Adults 705
that M3G clearance was significantly reduced in intensive
care patients compared with healthy individuals due to
decreased creatinine clearance [33].
Our results show large interpatient variability, especially
in the volume of distribution of M3G and M6G, with
values of 152 and 143 %, respectively. A previous study in
neurosurgical patients showed much less interpatient vari-
ability, which could be explained by this population being
less heterogenic, and also that this study only included nine
patients [21]. The high BSV in our study was mainly due to
two patients had very high estimated volumes of distribu-
tion for M3G and M6G. A possible explanation for the
large interpatient variability observed in our study might be
a change in body weight, which we could not test as a
covariate. Particularly during the last phases of life,
patients can have decreased lean body weight or may have
oedema, which could influence the volume of distribution
of the metabolites [35].
The covariate analysis resulted in three significant
covariates, with the first being TTD. Morphine clearance
decreased exponentially as TTD decreased, falling by more
than 10 L/h (26 %) in the last week before death. As none
of the other covariates tested gave a similar significant
effect on morphine clearance, this association may be
caused by a combination of factors. It may be the result of a
physiological change (e.g. a decrease in hepatic blood flow)
that is not detected with standard blood chemistry tests. This
observed decrease in clearance implicates that morphine
dose may have to be decreased according to life expectancy.
Life expectancy is difficult to predict, as is, for instance,
shown by the range of admittance in this study being sig-
nificantly longer than the 3 months stated as an admittance
criterion for the hospice. However, the terminal phase
(where a patient will die within hours or days) is usually
well-recognised based on several clinical signs (i.e. the
patient becoming bed-bound, semi-comatose, and that oral
medication and fluid intake is no longer possible) [18, 36].
In this case, a clinical protocol, specific for the terminal
phase, is started and specific domains will be registered in
the patient record as standard of care [37]. Therefore, it
might be possible to re-evaluate the morphine dose when
this phase is started as our model showed the biggest
decrease in morphine clearance in the last week of life.
The two other covariates, eGFR and plasma albumin
levels, were correlated with M3G and M6G clearance. The
fact that eGFR is correlated with M3G and M6G clearance
was expected as both metabolites are eliminated through
the kidneys. Previous studies have indeed shown that M3G
and M6G can accumulate in patients with impaired renal
function [38, 39].
Fig. 7 NPDE analysis of the final model for morphine, M3G and
M6G. The top panels show the distribution of the NPDE quantiles
(grey bars), with the shape of a normal distribution also shown
(dashed line). The bottom panels show the NPDEs versus the log of
the predicted concentrations with individual NPDE values (dots) and
5th, 50th and 95th percentile lines with their corresponding 90 %
confidence intervals (grey-shaded areas). NPDE normalised predic-
tion distribution error, M3G morphine-3-glucuronide, M6G mor-
phine-6-glucuronide
706 L. G. Franken et al.
The effect of albumin on metabolite clearance has not
been previously shown in other studies. As M3G and M6G
are not highly bound to plasma albumin, it is unlikely that
this effect will be due to changes in unbound fractions of
the metabolites. A possible explanation for this effect of
albumin may lie in the fact that some terminally ill patients
will become cachectic, which also leads to hypoalbu-
minemia [14]. The MDRD equation is not appropriate for
calculating GFR in cachectic patients due to severe muscle
loss and thereby overestimation of GFR based on crea-
tinine levels. Therefore, low albumin levels may be an
indicator for patients in which GFR is overestimated.
Another explanation why the combination of albumin and
eGFR are a better predictor than eGFR alone may be that
albumin can be an indication that a patient is closer to the
time of death. Several studies have shown that low albumin
levels can predict prognosis in palliative cancer patients
[40–42]. If a patient is closer to the time of death, eGFR
might be significantly decreased (for instance due to
dehydration). As the MDRD formula also overestimates
GFR when GFR is very low, in this case the addition of
albumin levels in the model might partly compensate for
this overestimation. Combining both eGFR and albumin
levels will therefore result in better prediction of M3G and
M6G clearance.
The main limitation of our study was that we lacked data
to evaluate associations between weight and the pharma-
cokinetic parameters. As mentioned above, this might
affect the estimates of volume of distribution, and there is
also a possible correlation with metabolite clearance since,
as described before, renal function can be overestimated in
patients with low body weight. Precise monitoring of
weight is not common practice in palliative care because it
does not contribute to the treatment and because patients
might find it difficult to be confronted with their weight
loss. However, as weight is possibly an important covari-
ate, we recommend that it is monitored in future pharma-
cokinetic studies in terminally ill patients.
Another possible limitation of the study was that the
absorption constant of all three dosing forms was fixed to
known literature values. This was necessary as there were
insufficient data points in the first 30 min after a dose
administration due to the sparse sampling design. This
could have biased the estimation of volume of distribution
for the central compartment as absorption rate and volume
of distribution both affect the initial concentration. In the
terminally ill population, patients receive morphine for
extended periods of time; therefore, clearance (and BSV on
clearance) instead of volume of distribution is the pre-
dominant parameter effecting total morphine exposure.
In addition, it was not possible to determine the trans-
formation ratios of M3G and M6G. These ratios were set to
previously described values, i.e. 0.55 for M3G and 0.10 for
M6G [21–23]. This could have biased the results for the
parameters of metabolite clearance and volume of distri-
bution as these are both proportional to the transformation
ratio (CL/F and Vd/F). However, we consider the values of
0.55 and 0.10 to be valid as the liver’s capacity for glu-
curonidation of drugs is reasonably stable, even in critically
ill patients and patients with mild to moderate cirrhosis [30,
31, 33]. The fact that there is BSV on morphine bioavail-
ability (which is a result of first-pass metabolism) is most
likely to be caused by a variation in liver blood flow instead
of metabolic capacity as morphine is a drug with a high
extraction ratio [32]. In this case, the clearance of morphine
will differ; however, the formation ratios should remain
unchanged. Furthermore, setting the transformation ratios
to 0.55 and 0.10 resulted in comparable estimates for
clearance and volume of distribution for both metabolites
(Table 2). This seems to be appropriate as both metabolites
have an almost identical molecular structure and are
therefore expected to have similar molecular properties. To
establish whether the transformation ratios are not altered
in these patients, information about the mass balance is
required. This can be obtained by measuring the fractions
of morphine, M3G, and M6G in urine samples.
5 Conclusions
Our study again confirms that a reduction in eGFR resulted
in a decreased clearance of M3G and M6G, which can have
clinical consequences as M6G is a metabolite with anal-
gesic activity, while M3G has been suggested to contribute
to side effects. As a result, the morphine dose may be
reduced in patients with renal failure, or analgesic therapy
may be switched to an opioid with less or no active
metabolites (e.g. oxycodone or fentanyl). We also found
that eGFR combined with albumin levels was a better
predictor for M3G and M6G clearance than eGFR alone.
Therefore, dose adjustments should also take into account
albumin levels besides eGFR. In addition, a positive cor-
relation was found between TTD and morphine clearance.
This important insight into the pharmacokinetics of mor-
phine in terminally ill patients is a first step in developing
an individualised dosing regimen for terminally ill patients.
It suggests that morphine doses might be adjusted to a
patient’s creatinine and albumin levels and life expectancy.
However, accurate prediction of the time of death can be
difficult and the need for morphine does not solely depend
on pharmacokinetics. Therefore, further studies on the
pharmacodynamics in this patient population are needed
before any firm conclusions can be drawn on dose
adjustments.
Morphine, M3G and M6G PK in Terminally Ill Adults 707
Compliance with Ethical Standards
This study was approved by the Medical Ethics Committee of the
Erasmus University Medical Centre, Rotterdam, and was performed
in accordance with the principles of the Declaration of Helsinki and
its later amendments.
Funding No sources of funding were used in the preparation of this
manuscript.
Conflict of interest Linda G. Franken, Anniek D. Masman, Brenda
C.M. de Winter, Birgit C.P. Koch, Frans P.M. Baar, Dick Tibboel,
Teun van Gelder, and Ron A.A. Mathot have no conflicts of interest
that are directly relevant to the content of this manuscript.
Open Access This article is distributed under the terms of the
Creative Commons Attribution-NonCommercial 4.0 International
License (http://creativecommons.org/licenses/by-nc/4.0/), which per-
mits any noncommercial use, distribution, and reproduction in any
medium, provided you give appropriate credit to the original
author(s) and the source, provide a link to the Creative Commons
license, and indicate if changes were made.
References
1. World Health Organization. Essential medicines in palliative
care: executive summary. Geneva: World Health Organization;
2013.
2. Masman AD, van Dijk M, Tibboel D, Baar FP, Mathot RA.
Medication use during end-of-life care in a palliative care centre.
Int J Clin Pharm. 2015;37(5):767–75.
3. Portenoy RK, Thaler HT, Inturrisi CE, Friedlander-Klar H, Foley
KM. The metabolite morphine-6-glucuronide contributes to the
analgesia produced by morphine infusion in patients with pain
and normal renal function. Clin Pharmacol Ther.
1992;51(4):422–31.
4. Milne RW, Nation RL, Somogyi AA. The disposition of mor-
phine and its 3- and 6-glucuronide metabolites in humans and
animals, and the importance of the metabolites to the pharma-
cological effects of morphine. Drug Metab Rev.
1996;28(3):345–472.
5. Klimas R, Mikus G. Morphine-6-glucuronide is responsible for
the analgesic effect after morphine administration: a quantitative
review of morphine, morphine-6-glucuronide, and morphine-3-
glucuronide. Br J Anaesth. 2014;113(6):935–44.
6. Lewis SS, Hutchinson MR, Rezvani N, Loram LC, Zhang Y,
Maier SF, et al. Evidence that intrathecal morphine-3-glu-
curonide may cause pain enhancement via toll-like receptor
4/MD-2 and interleukin-1beta. Neuroscience.
2010;165(2):569–83.
7. Christrup LL. Morphine metabolites. Acta Anaesthesiol Scand.
1997;41(1 Pt 2):116–22.
8. Morita T, Tei Y, Inoue S. Impaired communication capacity and
agitated delirium in the final week of terminally ill cancer
patients: prevalence and identification of research focus. J Pain
Symptom Manage. 2003;26(3):827–34.
9. van Herk R, van Dijk M, Baar FP, Tibboel D, de Wit R.
Observation scales for pain assessment in older adults with
cognitive impairments or communication difficulties. Nurs Res.
2007;56(1):34–43.
10. Breitbart W, Strout D. Delirium in the terminally ill. Clin Geriatr
Med. 2000;16(2):357–72.
11. Rietjens J, van Delden J, Onwuteaka-Philipsen B, Buiting H, van
der Maas P, van der Heide A. Continuous deep sedation for
patients nearing death in the Netherlands: descriptive study. BMJ.
2008;336(7648):810–3.
12. Stevenson J, Abernethy AP, Miller C, Currow DC. Managing
comorbidities in patients at the end of life. BMJ.
2004;329(7471):909–12.
13. Trobec K, Kerec Kos M, von Haehling S, Springer J, Anker SD,
Lainscak M. Pharmacokinetics of drugs in cachectic patients: a
systematic review. PLoS One. 2013;8(11):e79603.
14. Kemik O, Sumer A, Kemik AS, Hasirci I, Purisa S, Dulger AC,
et al. The relationship among acute-phase response proteins,
cytokines and hormones in cachectic patients with colon cancer.
World J Surg Oncol. 2010;8:85.
15. Launay-Vacher V, Oudard S, Janus N, Gligorov J, Pourrat X,
Rixe O, et al. Prevalence of renal insufficiency in cancer patients
and implications for anticancer drug management: the renal
insufficiency and anticancer medications (IRMA) study. Cancer.
2007;110(6):1376–84.
16. Integraal Kankercentrum Nederland. Dyspnoea: nationwide
guideline. Version 2.0. http://www.pallialine.nl. Accessed Apr
2015.
17. Integraal Kankercentrum Nederland. Pain: nationwide guideline.
Version 2.0. http://www.pallialine.nl. Accessed Apr 2015.
18. Ellershaw J, Ward C. Care of the dying patient: the last hours or
days of life. BMJ. 2003;326(7379):30–4.
19. Campbell CF, Mason JB, Weiler JM. Continuous subcutaneous
infusion of morphine for the pain of terminal malignancy. Ann
Intern Med. 1983;98(1):51–2.
20. Starlander J, Melin-Johansson C, Jonsson H, Axelsson B. Oral-
parenteral conversion factor for morphine in palliative cancer
care: a prospective randomized crossover pilot study. Pain Res
Treat. 2011;2011:504034.
21. Meineke I, Freudenthaler S, Hofmann U, Schaeffeler E, Mikus G,
Schwab M, et al. Pharmacokinetic modelling of morphine, mor-
phine-3-glucuronide and morphine-6-glucuronide in plasma and
cerebrospinal fluid of neurosurgical patients after short-term
infusion of morphine. Br J Clin Pharmacol. 2002;54(6):592–603.
22. Hasselstrom J, Sawe J. Morphine pharmacokinetics and meta-
bolism in humans. Enterohepatic cycling and relative contribu-
tion of metabolites to active opioid concentrations. Clin
Pharmacokinet. 1993;24(4):344–54.
23. Lotsch J, Skarke C, Schmidt H, Liefhold J, Geisslinger G.
Pharmacokinetic modeling to predict morphine and morphine-6-
glucuronide plasma concentrations in healthy young volunteers.
Clin Pharmacol Ther. 2002;72(2):151–62.
24. Comets E, Brendel K, Mentre F. Computing normalised predic-
tion distribution errors to evaluate nonlinear mixed-effect mod-
els: the npde add-on package for R. Comput Methods Programs
Biomed. 2008;90(2):154–66.
25. Ahn JE, Karlsson MO, Dunne A, Ludden TM. Likelihood based
approaches to handling data below the quantification limit using
NONMEM VI. J Pharmacokinet Pharmacodyn. 2008;35(4):401–21.
26. Glare PA, Walsh TD. Clinical pharmacokinetics of morphine.
Ther Drug Monit. 1991;13(1):1–23.
27. Hunt A, Joel S, Dick G, Goldman A. Population pharmacoki-
netics of oral morphine and its glucuronides in children receiving
morphine as immediate-release liquid or sustained-release tablets
for cancer pain. J Pediatr. 1999;135(1):47–55.
28. Levey AS, Coresh J, Greene T, Stevens LA, Zhang YL, Hen-
driksen S, et al. Using standardized serum creatinine values in the
modification of diet in renal disease study equation for estimating
glomerular filtration rate. Ann Intern Med. 2006;145(4):247–54.
29. Sawe J, Dahlstrom B, Paalzow L, Rane A. Morphine kinetics in
cancer patients. Clin Pharmacol Ther. 1981;30(5):629–35.
30. Verbeeck RK. Pharmacokinetics and dosage adjustment in
patients with hepatic dysfunction. Eur J Clin Pharmacol.
2008;64(12):1147–61.
708 L. G. Franken et al.
31. Patwardhan RV, Johnson RF, Hoyumpa A Jr, Sheehan JJ, Des-
mond PV, Wilkinson GR, et al. Normal metabolism of morphine
in cirrhosis. Gastroenterology. 1981;81(6):1006–11.
32. Le Couteur DG, McLean AJ. The aging liver. Drug clearance and
an oxygen diffusion barrier hypothesis. Clin Pharmacokinet.
1998;34(5):359–73.
33. Ahlers SJGM, Peeters MYM, van Gulik L, van Dongen EPA,
Dahan A, Tibboel D, et al. Glucuronidatie en eliminatie van
morfine bij intensivecarepatienten: een vergelijking met gezonde
vrijwilligers. Pharm Weekbl. 2014;8–9:166–71.
34. Poulain P, Hoskin PJ, Hanks GW, A-Omar O, Walker VA,
Johnston A, et al. Relative bioavailability of controlled release
morphine tablets (MST continus) in cancer patients. Br J Anaesth.
1988;61(5):569–74.
35. Ohde S, Hayashi A, Takahasi O, Yamakawa S, Nakamura M,
Osawa A, et al. A 2-week prognostic prediction model for ter-
minal cancer patients in a palliative care unit at a Japanese
general hospital. Palliat Med. 2011;25(2):170–6.
36. Maltoni M, Caraceni A, Brunelli C, Broeckaert B, Christakis N,
Eychmueller S, et al. Prognostic factors in advanced cancer
patients: evidence-based clinical recommendations. A study by
the Steering Committee of the European Association for Pallia-
tive Care. J Clin Oncol. 2005;23(25):6240–8.
37. Ellershaw J. Care of the dying: what a difference an LCP makes!
Palliat Med. 2007;21(5):365–8.
38. Osborne R, Joel S, Grebenik K, Trew D, Slevin M. The phar-
macokinetics of morphine and morphine glucuronides in kidney
failure. Clin Pharmacol Ther. 1993;54(2):158–67.
39. Faura CC, Collins SL, Moore RA, McQuay HJ. Systematic
review of factors affecting the ratios of morphine and its major
metabolites. Pain. 1998;74(1):43–53.
40. McMillan DC. The systemic inflammation-based Glasgow
Prognostic Score: a decade of experience in patients with cancer.
Cancer Treat Rev. 2013;39(5):534–40.
41. Woo J, Chan HS, Or KH, Arumanayagam M. Effect of age and
disease on two drug binding proteins: albumin and alpha-1-acid
glycoprotein. Clin Biochem. 1994;27(4):289–92.
42. Bergman P, Sperneder S, Hoijer J, Bergqvist J, Bjorkhem-Berg-
man L. Low vitamin D levels are associated with higher opioid
dose in palliative cancer patients: results from an observational
study in Sweden. PLoS One. 2015;10(5):e0128223.
Morphine, M3G and M6G PK in Terminally Ill Adults 709