Embed Size (px)
Citation preview
Pharmacoeconomic Analyses and Oncology Pharmacy: Optimizing MultipleOncology Pharmacy: Optimizing Multiple
Myeloma Value for Patients and Plans
C. Daniel Mullins, PhDProfessorProfessor
Pharmaceutical Health Services Research DepartmentUniversity of Maryland School of Pharmacy
Outline
• The Value Proposition in Oncology• The Value Proposition in Oncology• The Evidence Gap and Uncertainty
Ph i E id d St di i• Pharmacoeconomic Evidence and Studies in Multiple Myeloma
• Future Considerations for Pharmacoeconomic• Future Considerations for PharmacoeconomicEvaluations of Multiple Myeloma Therapies
Oncology Value Proposition
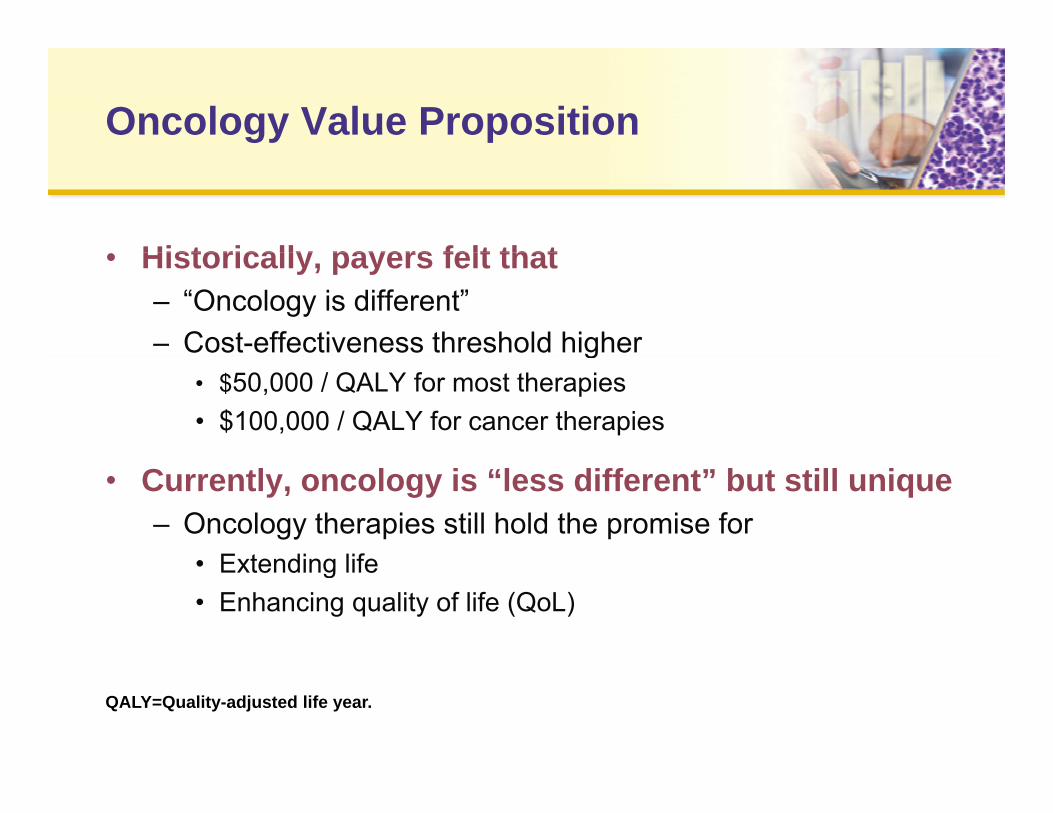
Historically payers felt that• Historically, payers felt that– “Oncology is different”– Cost-effectiveness threshold higherg
• $50,000 / QALY for most therapies• $100,000 / QALY for cancer therapies
• Currently, oncology is “less different” but still unique– Oncology therapies still hold the promise for
• Extending life• Extending life• Enhancing quality of life (QoL)
QALY=Quality-adjusted life year.
Oncology Value Proposition
• Evidence requirements• Evidence requirements– Outcomes, NOT surrogates
Clinically meaningful– Clinically meaningful
– Patient-centered outcomes
Clinical outcomes aligned with cost analysis to provide– Clinical outcomes aligned with cost analysis to provide context for payers
• Cost is always an issueCost is always an issue
Outline
• The Value Proposition in Oncology• The Value Proposition in Oncology• The Evidence Gap and Uncertainty
Ph i E id d St di i• Pharmacoeconomic Evidence and Studies in Multiple Myeloma
• Future Considerations for Pharmacoeconomic• Future Considerations for PharmacoeconomicEvaluations of Multiple Myeloma Therapies
Evidence Gap: Pervasiveness of Off-Label UsePervasiveness of Off-Label Use
• National Comprehensive Cancer Network (NCCN)• National Comprehensive Cancer Network (NCCN) estimates ½ to ¾ of all cancer drugs used off-label1
• Survey of oncologists identified at least 87 distinctSurvey of oncologists identified at least 87 distinct anticancer therapies used outside labeled indications2
1. Soares M. “Off-Label” indications for oncology drug use and drug compendia: history and current status. J Oncol Practice. 2005;1:102-105.
2. Goss T. Off-Label Use of Anticancer Therapies: Physician Prescribing Trends and the Impact of Payer Coverage Policy. 2007. Gaithersburg, MD: Covance Market Access Services.
Evidence Gap: Limitations of Current EvidenceLimitations of Current Evidence
• Four compendia are approved to provide Medicare• Four compendia are approved to provide Medicare and other payers with guidance
• A 2009 systematic review of major compendia:A 2009 systematic review of major compendia:– “Lack transparency, cite little current evidence, and lack
systematic methods...”1
• Some argue that useful evidence is simply not being generated– Compendia have to aggregate poor information
1. Abernethy AP, Raman G, Balk EM et al. Systematic review: Reliability of compendia methods for off-label oncology indications. Ann Intern Med. 2009;150:336-343.
Evidence Gap: Limitations of Current Evidence (cont’d)of Current Evidence (cont d)
• Evidence is not always “patient centered”• Evidence is not always “patient-centered” – Nor is it “payer-applicable”
• Patients increasingly have proportional co-pays that at e ts c eas g y a e p opo t o a co pays t atmake them a “payer”
• Traditional clinical trials may not provide the evidence th t i t i f l t ti tthat is most meaningful to patient– Impact of treatment on daily activities, etc.
• There is a need for patient-reported outcomes (PROs)There is a need for patient reported outcomes (PROs)– Quality of life, etc.
• There is a need for more payer involvement in study design
Evidence Gap: Methodological ConcernsMethodological Concerns
• Limitations of observational and retrospective• Limitations of observational and retrospective analyses– Studies often lack randomization
– Selection bias is frequently present
– PROs are not always availabley
• Limitations with randomized clinical trials– Patients often not typical of enrollee populationyp p p
– Treatment typically reflects academic medical centers, NOT community oncology practice
PRO=Patient-reported outcomes.
Evidence Gap: Decision-MakingDecision-Making
• Patients have a vital need to access the most• Patients have a vital need to access the most effective and safe cancer care, but often unclear which therapies meet this criteria
• Oncologists have few treatment options supported by strong evidencePa ers m st make co erage and reimb rsement• Payers must make coverage and reimbursement decisions with little reliable evidence – Conflicting pressure from multiple sides
• Use of safe and effective therapies may be limited by lack of data

Filling the Evidence Gap
• It’s important to fill the right gap/answer the right• It’s important to fill the right gap/answer the right question
• Simultaneously “too little”yand “too much” info
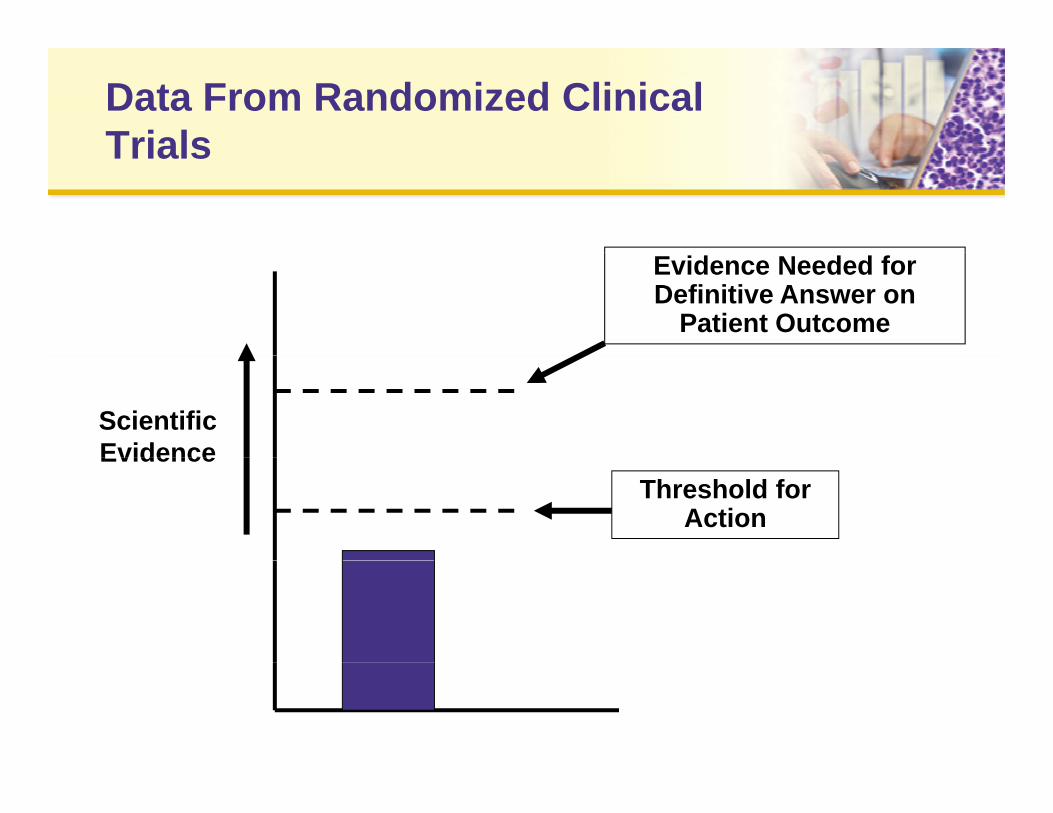
Data From Randomized Clinical TrialsTrials
Evidence Needed for Definitive Answer on
Patient Outcome
Scientific EvidenceEvidence
Threshold for Action
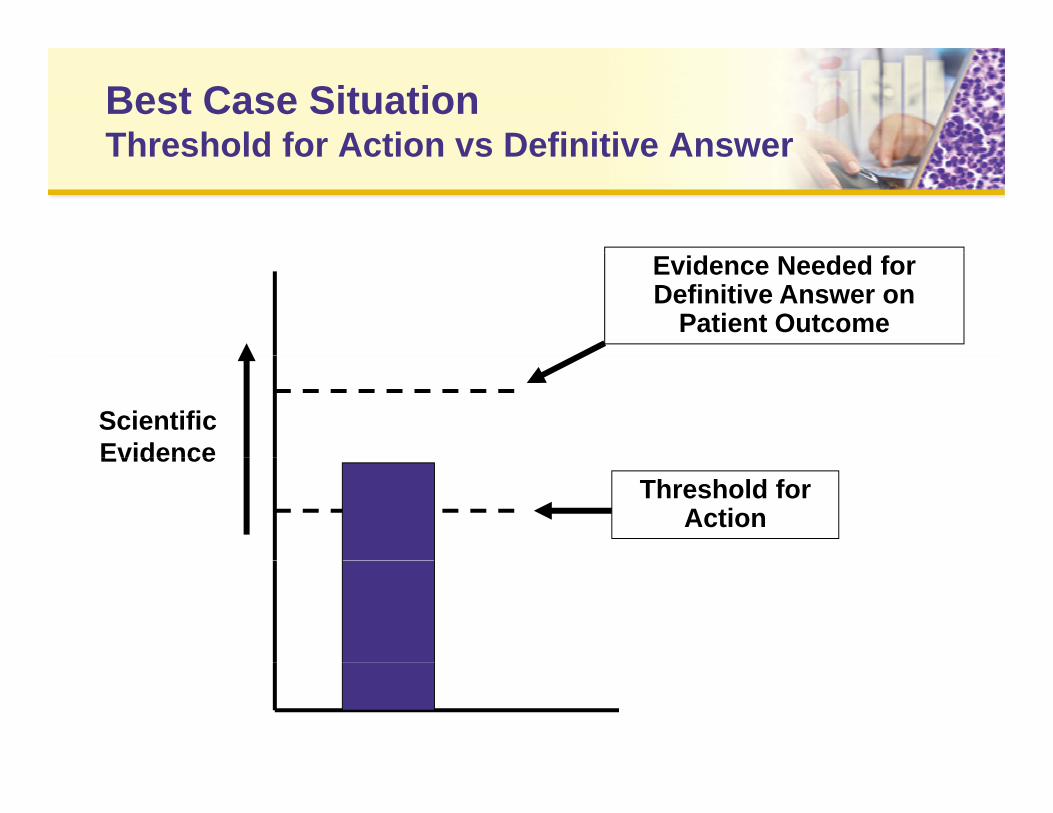
Best Case SituationThreshold for Action vs Definitive AnswerThreshold for Action vs Definitive Answer
Evidence Needed for Definitive Answer on
Patient Outcome
Scientific EvidenceEvidence
Threshold for Action
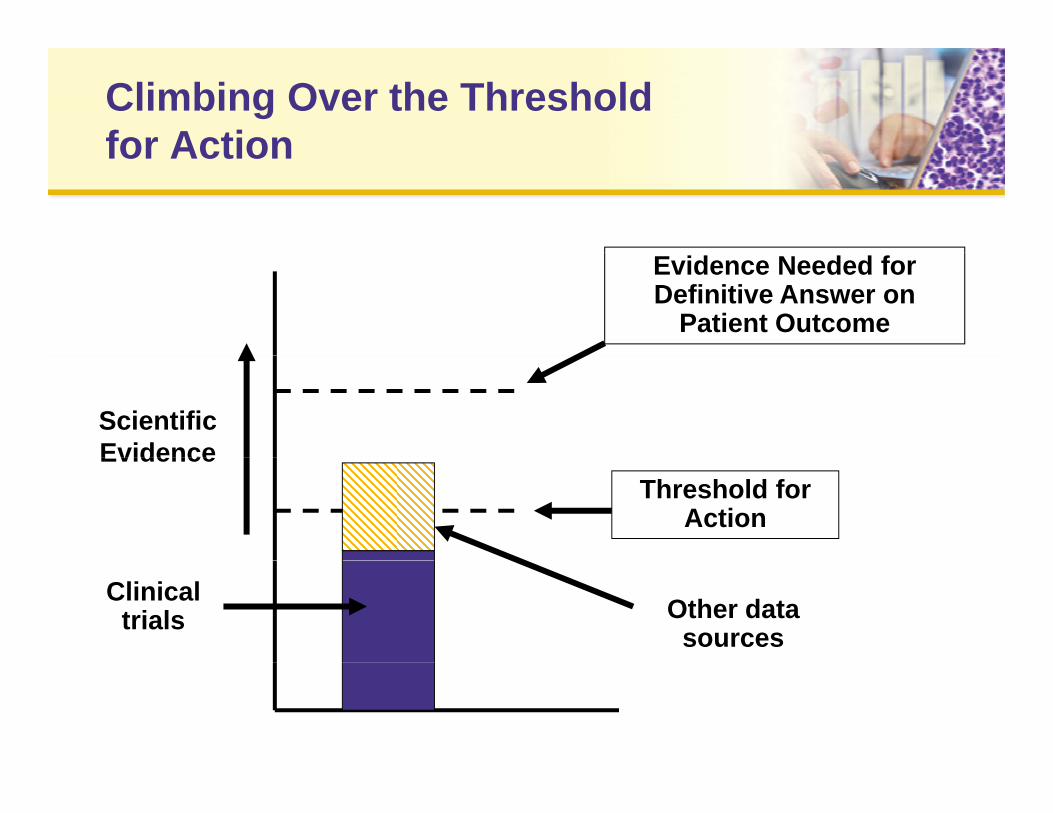
Climbing Over the Threshold for Actionfor Action
Evidence Needed for Definitive Answer on
Patient Outcome
Scientific EvidenceEvidence
Threshold for Action
Other data sources
Clinical trials
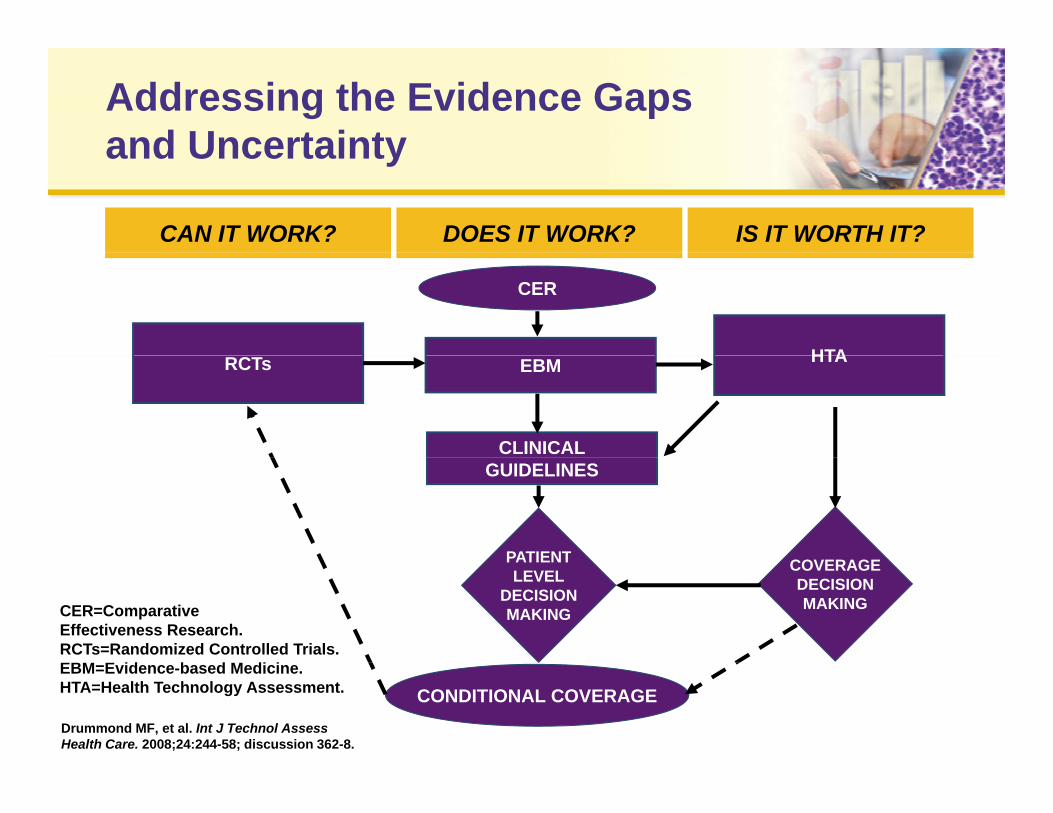
Addressing the Evidence Gapsand Uncertainty
CAN IT WORK? DOES IT WORK? IS IT WORTH IT?
and Uncertainty
HTA
CER
RCTs EBM HTA
CLINICALGUIDELINES
COVERAGEPATIENT COVERAGEDECISIONMAKING
PATIENTLEVEL
DECISIONMAKINGCER=Comparative
Effectiveness Research.RCTs=Randomized Controlled Trials.EBM E id b d M di i
CONDITIONAL COVERAGEDrummond MF, et al. Int J Technol Assess Health Care. 2008;24:244-58; discussion 362-8.
EBM=Evidence-based Medicine.HTA=Health Technology Assessment.
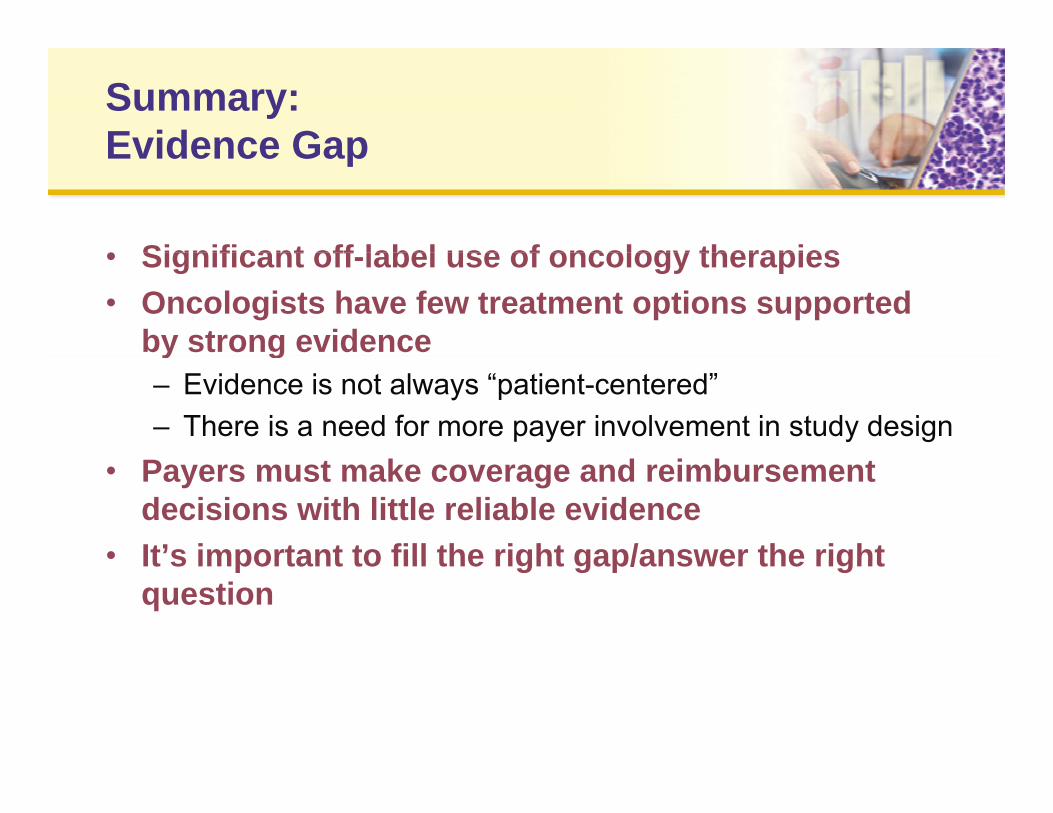
Summary:Evidence GapEvidence Gap
• Significant off label use of oncology therapies• Significant off-label use of oncology therapies• Oncologists have few treatment options supported
by strong evidencey g– Evidence is not always “patient-centered”– There is a need for more payer involvement in study design
• Payers must make coverage and reimbursement decisions with little reliable evidence
• It’s important to fill the right gap/answer the rightIt s important to fill the right gap/answer the right question
Outline
• The Value Proposition in Oncology• The Value Proposition in Oncology• The Evidence Gap and Uncertainty
Ph i E id d St di i• Pharmacoeconomic Evidence and Studies in Multiple Myeloma
• Future Considerations for Pharmacoeconomic• Future Considerations for PharmacoeconomicEvaluations of Multiple Myeloma Therapies
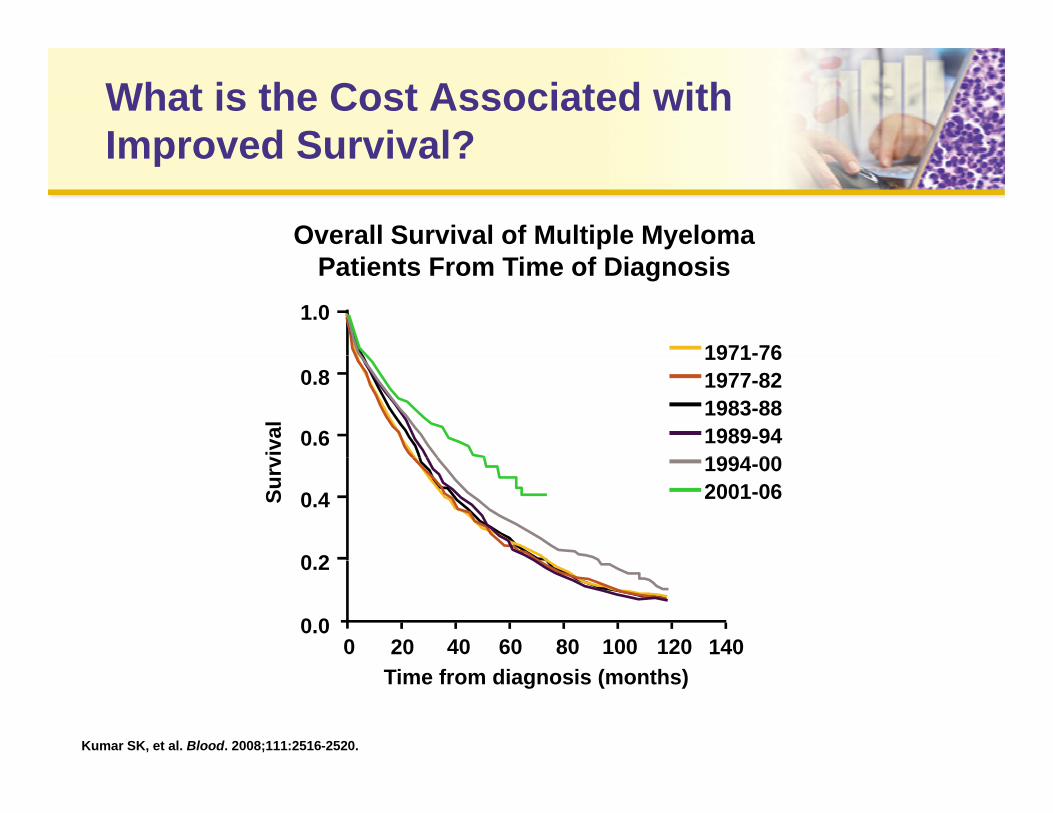
What is the Cost Associated with Improved Survival?Improved Survival?
Overall Survival of Multiple Myeloma
1.0
1971-76
Patients From Time of Diagnosis
0.6
0.8
viva
l
1971-761977-821983-881989-941994 00
0 2
0.4Surv 1994-00
2001-06
0 20 40 60 80 100 120 1400.0
0.2
Time from diagnosis (months)
Kumar SK, et al. Blood. 2008;111:2516-2520.
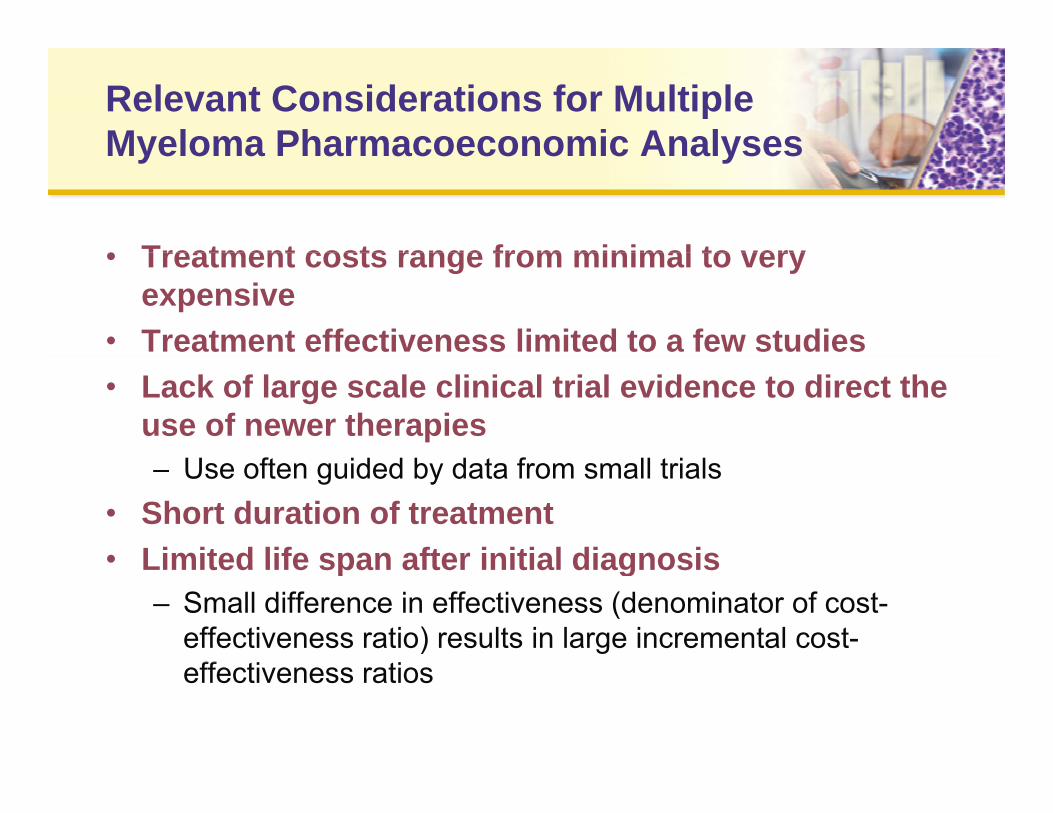
Relevant Considerations for Multiple Myeloma Pharmacoeconomic AnalysesMyeloma Pharmacoeconomic Analyses
• Treatment costs range from minimal to very• Treatment costs range from minimal to very expensive
• Treatment effectiveness limited to a few studies• Lack of large scale clinical trial evidence to direct the
use of newer therapiesU f id d b d f ll i l– Use often guided by data from small trials
• Short duration of treatment• Limited life span after initial diagnosis• Limited life span after initial diagnosis
– Small difference in effectiveness (denominator of cost-effectiveness ratio) results in large incremental cost-ff ti tieffectiveness ratios
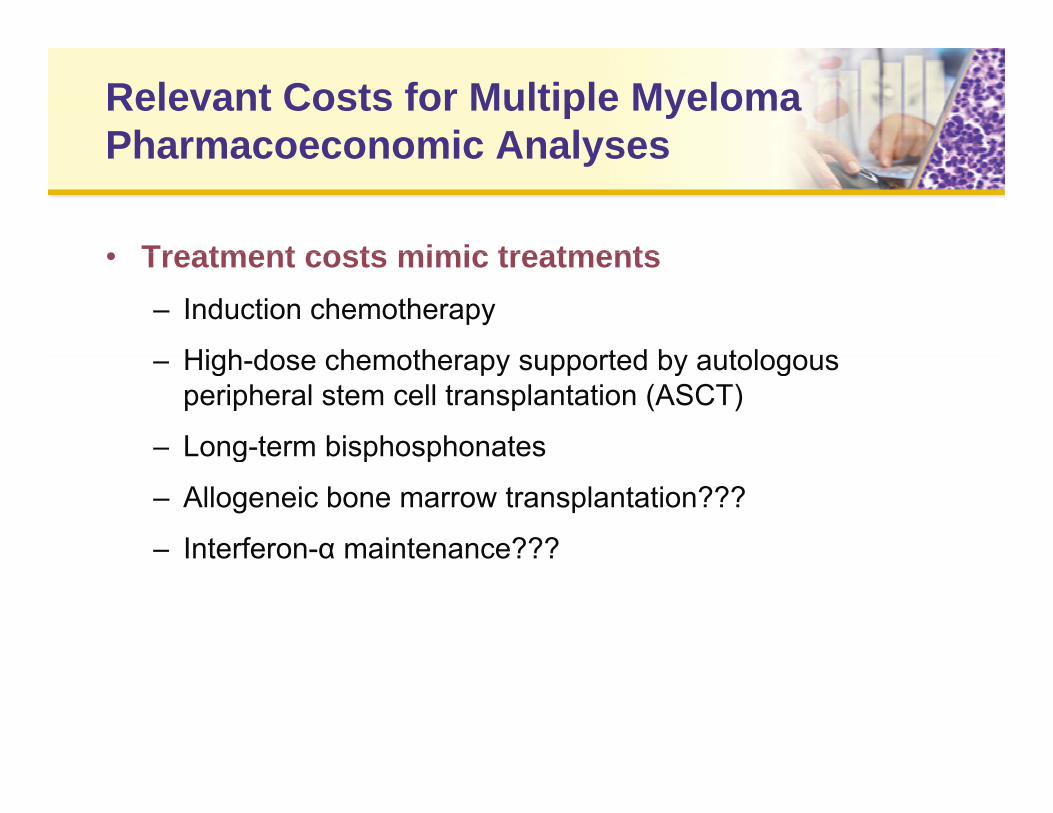
Relevant Costs for Multiple Myeloma Pharmacoeconomic AnalysesPharmacoeconomic Analyses
• Treatment costs mimic treatments• Treatment costs mimic treatments– Induction chemotherapy
High dose chemotherapy supported by autologous– High-dose chemotherapy supported by autologousperipheral stem cell transplantation (ASCT)
– Long-term bisphosphonatesg p p
– Allogeneic bone marrow transplantation???
– Interferon-α maintenance???
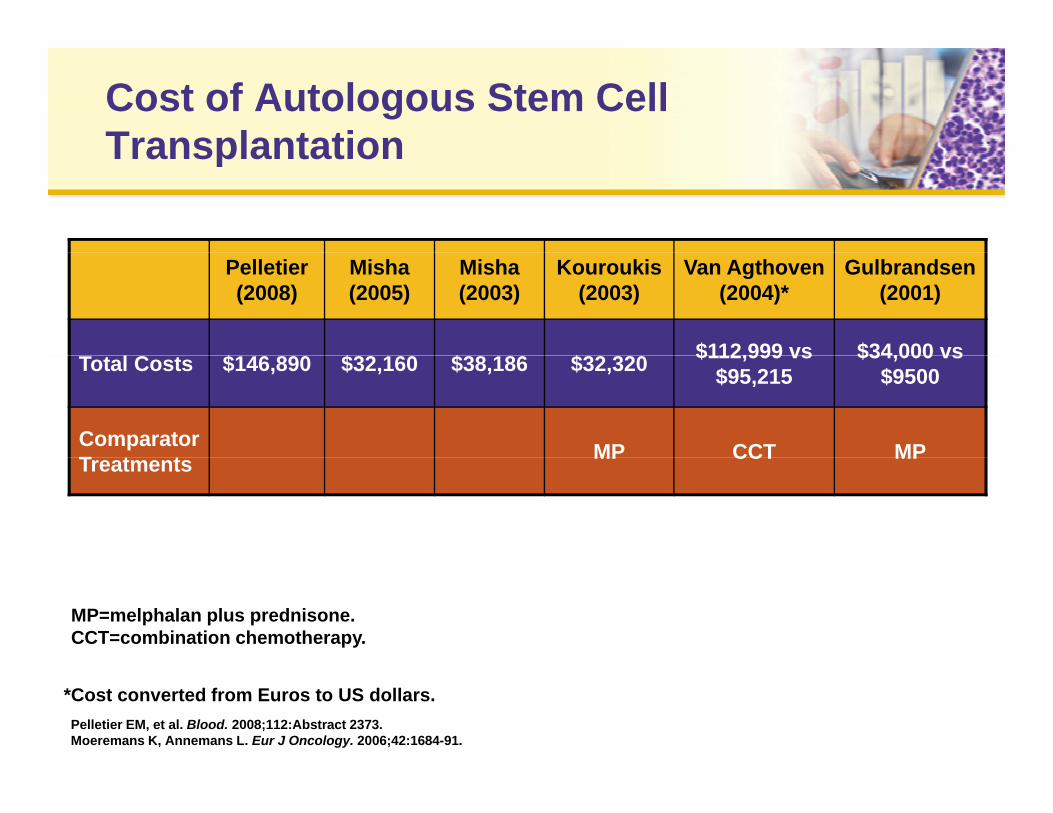
Cost of Autologous Stem Cell TransplantationTransplantation
Pelletier(2008)
Misha(2005)
Misha(2003)
Kouroukis(2003)
Van Agthoven(2004)*
Gulbrandsen(2001)
$ $ $ $ $112,999 vs $34,000 vsTotal Costs $146,890 $32,160 $38,186 $32,320 $112,999 vs$95,215
$34,000 vs$9500
Comparator T t t MP CCT MPTreatments MP CCT MP
MP=melphalan plus prednisone.CCT=combination chemotherapy.
Pelletier EM, et al. Blood. 2008;112:Abstract 2373. Moeremans K, Annemans L. Eur J Oncology. 2006;42:1684-91.
*Cost converted from Euros to US dollars.
Issues With Estimating Costs for Multiple MyelomaMultiple Myeloma
• Treatment regimens constantly changing• Treatment regimens constantly changing• Combination therapies are common
T t t l ith ff t d ti f• Treatment algorithms affect duration of use, indirectly affecting costs
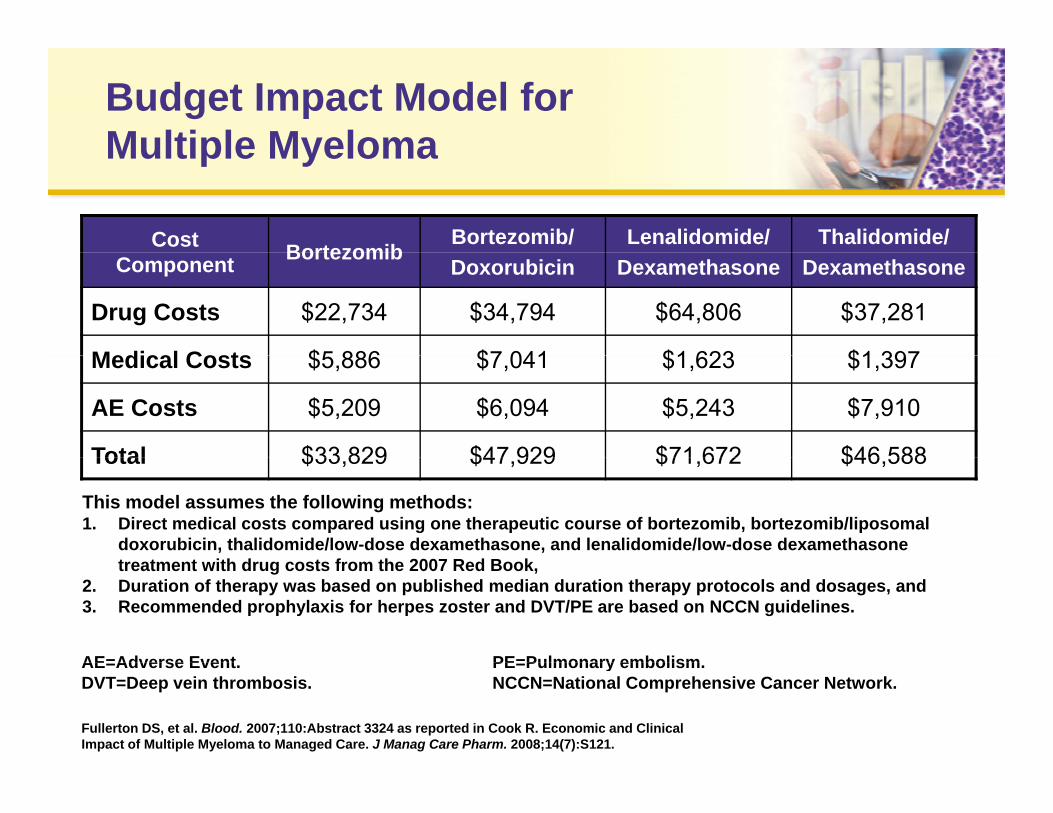
Budget Impact Model for Multiple MyelomaMultiple Myeloma
Cost BortezomibBortezomib/ Lenalidomide/ Thalidomide/
Component BortezomibDoxorubicin Dexamethasone Dexamethasone
Drug Costs $22,734 $34,794 $64,806 $37,281
Medical Costs $5 886 $7 041 $1 623 $1 397Medical Costs $5,886 $7,041 $1,623 $1,397
AE Costs $5,209 $6,094 $5,243 $7,910
Total $33 829 $47 929 $71 672 $46 588Total $33,829 $47,929 $71,672 $46,588
This model assumes the following methods:1. Direct medical costs compared using one therapeutic course of bortezomib, bortezomib/liposomal
doxorubicin, thalidomide/low-dose dexamethasone, and lenalidomide/low-dose dexamethasonet t t ith d t f th 2007 R d B k
AE=Adverse Event PE=Pulmonary embolism
treatment with drug costs from the 2007 Red Book, 2. Duration of therapy was based on published median duration therapy protocols and dosages, and3. Recommended prophylaxis for herpes zoster and DVT/PE are based on NCCN guidelines.
AE=Adverse Event.DVT=Deep vein thrombosis.
PE=Pulmonary embolism.NCCN=National Comprehensive Cancer Network.
Fullerton DS, et al. Blood. 2007;110:Abstract 3324 as reported in Cook R. Economic and Clinical Impact of Multiple Myeloma to Managed Care. J Manag Care Pharm. 2008;14(7):S121.
Formal Value Assessments in Multiple MyelomaMultiple Myeloma
• Few systematic studies• Few systematic studies• Several studies on individual products
F ti t t di– Few active comparator studies
– Inconsistent methods so indirect comparisons are a challengechallenge
NICE Technology Appraisals
National Institute for Health and ClinicalNational Institute for Health and Clinical Excellence (NICE)
Bortezomib for the Treatment of Multiple Myeloma Patients at First Relapse Issue date: October 2007
Review date: October 2010Review date: October 2010
Bortezomibmonotherapy for relapsed multiple myeloma
This guidance was developed using the single technology appraisal process
NICE technology appraisal guidance 129
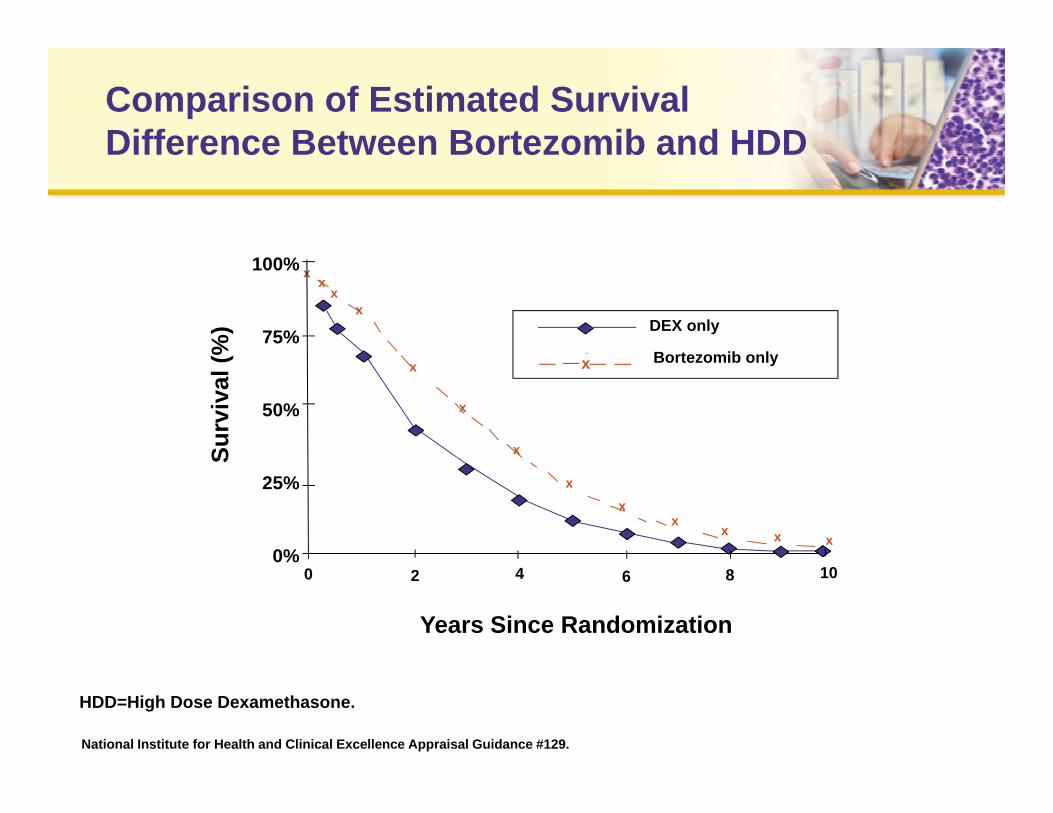
Comparison of Estimated Survival Difference Between Bortezomib and HDDDifference Between Bortezomib and HDD
xx
xx
100%
75% DEX only
Bortezomib only%)
x
x
x
50%
x Bortezomib only
Surv
ival
(
xx
xx x x
25%
0%
S
0%0 2 4 6 8 10
Years Since Randomization
National Institute for Health and Clinical Excellence Appraisal Guidance #129.
HDD=High Dose Dexamethasone.
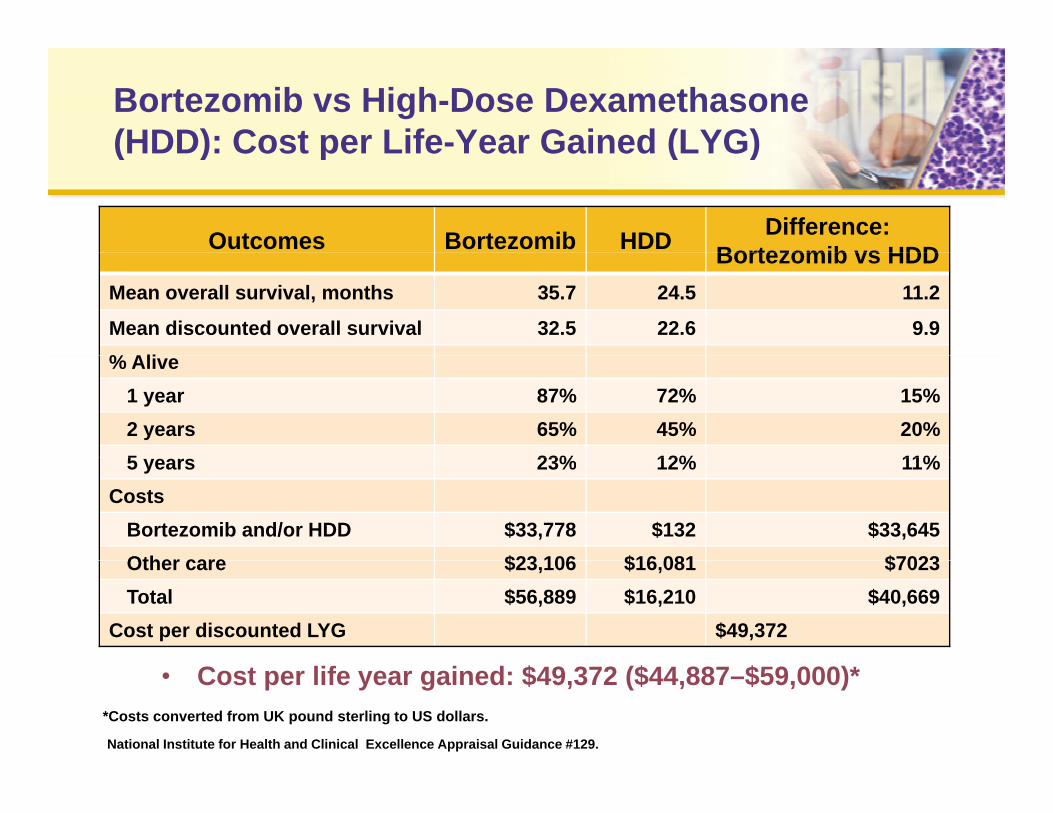
Bortezomib vs High-Dose Dexamethasone(HDD): Cost per Life-Year Gained (LYG)
Outcomes Bortezomib HDD Difference: Bortezomib vs HDD
(HDD): Cost per Life Year Gained (LYG)
Bortezomib vs HDDMean overall survival, months 35.7 24.5 11.2
Mean discounted overall survival 32.5 22.6 9.9% Ali% Alive
1 year 87% 72% 15%2 years 65% 45% 20%5 23% 12% 11%5 years 23% 12% 11%
CostsBortezomib and/or HDD $33,778 $132 $33,645Other care $23 106 $16 081 $7023Other care $23,106 $16,081 $7023Total $56,889 $16,210 $40,669
Cost per discounted LYG $49,372
• Cost per life year gained: $49,372 ($44,887–$59,000)*
National Institute for Health and Clinical Excellence Appraisal Guidance #129.
*Costs converted from UK pound sterling to US dollars.
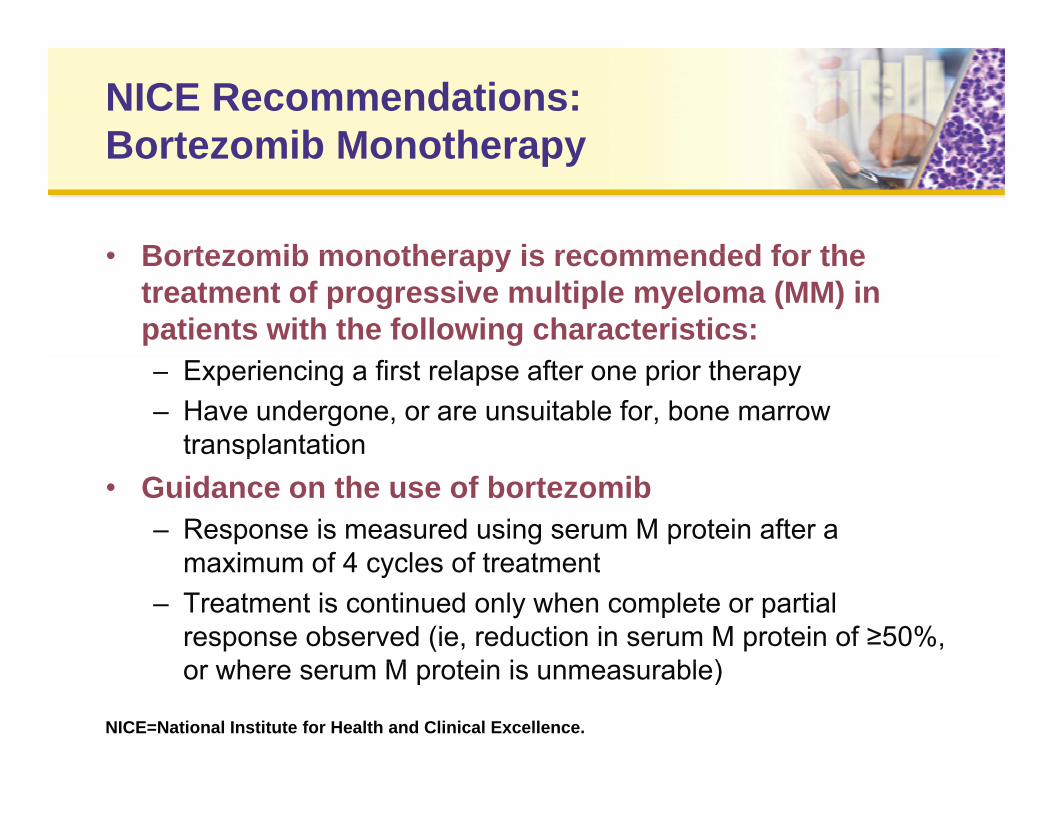
NICE Recommendations: Bortezomib MonotherapyBortezomib Monotherapy
• Bortezomib monotherapy is recommended for the• Bortezomib monotherapy is recommended for the treatment of progressive multiple myeloma (MM) in patients with the following characteristics:– Experiencing a first relapse after one prior therapy– Have undergone, or are unsuitable for, bone marrow
transplantationp• Guidance on the use of bortezomib
– Response is measured using serum M protein after a maximum of 4 cycles of treatmentmaximum of 4 cycles of treatment
– Treatment is continued only when complete or partial response observed (ie, reduction in serum M protein of ≥50%,
h M t i i bl )or where serum M protein is unmeasurable)
NICE=National Institute for Health and Clinical Excellence.
NICE Recommendations: Bortezomib Monotherapy (con’t)Bortezomib Monotherapy (con t)
• In the UK the full cost of bortezomib is returned (by• In the UK, the full cost of bortezomib is returned (by the manufacturer) to patients who have less than a partial response
• Patients receiving bortezomib monotherapy who fail to meet these criteria should have the option to continue therapy until they and their clinicianscontinue therapy until they and their clinicians consider it appropriate to stop
NICE Technology Appraisals
National Institute for Health and ClinicalNational Institute for Health and Clinical Excellence (NICE)
Lenalidomide for the treatment of multiple myeloma in people who have received at least one prior therapy
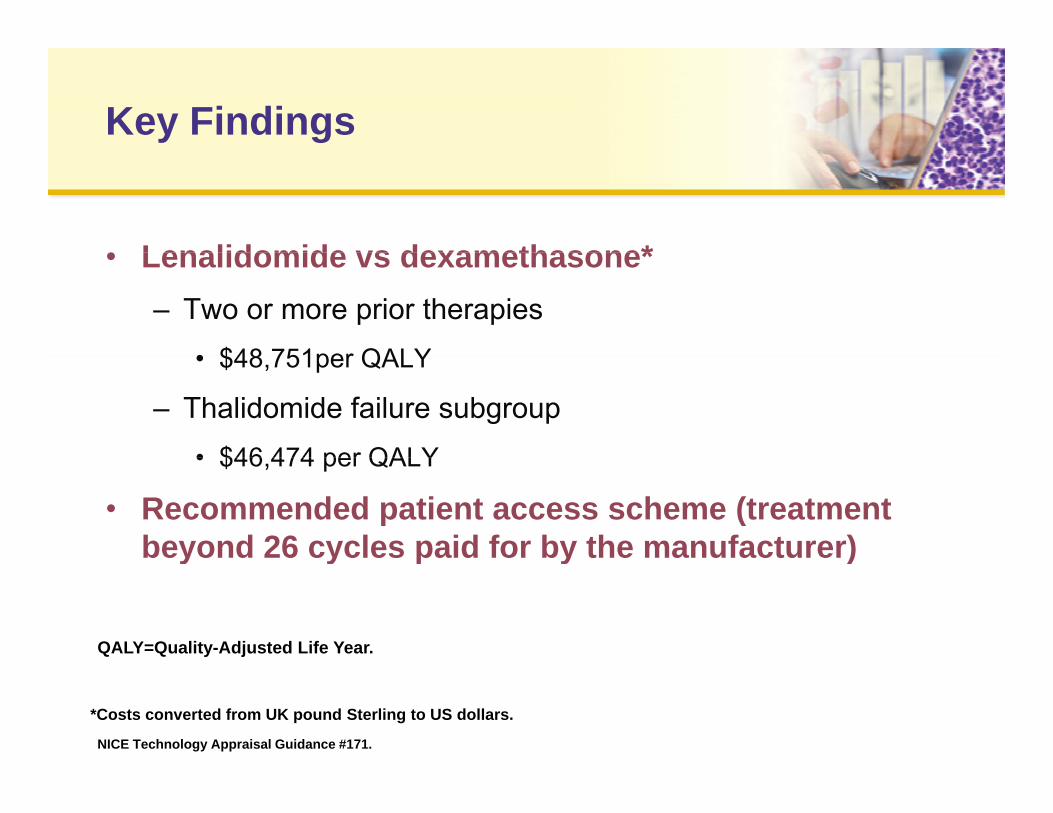
Key Findings
• Lenalidomide vs dexamethasone*• Lenalidomide vs dexamethasone*– Two or more prior therapies
• $48 751per QALY• $48,751per QALY
– Thalidomide failure subgroup• $46 474 per QALY• $46,474 per QALY
• Recommended patient access scheme (treatment beyond 26 cycles paid for by the manufacturer)y y p y )
QALY=Quality-Adjusted Life Year.
NICE Technology Appraisal Guidance #171.
*Costs converted from UK pound Sterling to US dollars.
Summary:Pharmacoeconomic EvidencePharmacoeconomic Evidence
• Treatment regimens constantly changing– Algorithms used to guide treatment and payment can
become outdated quicklybecome outdated quickly• Robust clinical trial evidence of treatment
effectiveness is limited– Few active comparator studies– Inconsistent methods; indirect comparisons are a
challengechallenge• Pharmacoeconomic analysis of cost/benefit often
hindered by limited clinical data
Outline
• The Value Proposition in Oncology• The Value Proposition in Oncology• The Evidence Gap and Uncertainty
Ph i E id d St di i• Pharmacoeconomic Evidence and Studies in Multiple Myeloma
• Future Considerations for Pharmacoeconomic• Future Considerations for PharmacoeconomicEvaluations of Multiple Myeloma Therapies
Study Design and Reporting of Results Affect PE Studies and Decision-MakingAffect PE Studies and Decision Making
• Current treatment strategies• Current treatment strategies• Direct or indirect evidence
– No direct trials comparing treatmentsNo direct trials comparing treatments– Comparison groups different
• Means or medians?– Survival curves typically presented as medians– Cost-effectiveness results based on means or medians
• Patient cost sharing influences• Patient cost-sharing influences– Utilization– Cost-effectiveness
PE=Pharmacoeconomic.
Future Evidence Needs for Economic Evaluations of Multiple Myeloma TreatmentsEvaluations of Multiple Myeloma Treatments
• Subgroup of responders• Subgroup of responders– Prospective identification of subgroups
• Cost-effectiveness varies by treatment populationCost e ect e ess a es by t eat e t popu at o– Technologies perhaps not cost-effective for everyone– Very cost-effective for the responsive patient
Summary: Future Pharmacoeconomic EvaluationPharmacoeconomic Evaluation
• To enhance the quality of pharmacoeconomic data in multiple myeloma, future clinical trials – Must be designed in a way that supports both clinical and– Must be designed in a way that supports both clinical and
pharmacoeconomic endpoints– Should examine the impact of patient cost-sharing on
li i l tclinical outcomes– Identify subgroups of responders