Embed Size (px)
Citation preview

Research in Social and
Administrative Pharmacy j (2013) j–j
Original Research
Pharmacist, general practitioner and consumeruse of written medicine information in Australia:
Are they on the same page?Kim K. Hamrosi, B.Pharm. (Hons.)a,*,
David K. Raynor, Ph.D., B.Pharm., M.R.Pharm.S.b,Parisa Aslani, B.Pharm., M.Sc., Ph.D., G. Cert. Ed. Stud. (Higher Ed.)a
aFaculty of Pharmacy, Pharmacy & Bank Building A15, University of Sydney, Sydney, NSW 2006, AustraliabSchool of Healthcare, University of Leeds, Leeds, UK
Abstract
Background: Providing written medicine information to consumers enables them to make informeddecisions about their medicines, playing an important role in educating and improving health literacy. InAustralia, standardized written medicine information called Consumer Medicine Information (CMI) is
available for medicines as package inserts, computer prints, or leaflets. Consumers want and read CMI, butmay not always ask for it. General practitioners (GPs) and pharmacists are an important source of writtenmedicine information, yet may not always provide CMI in their practice.Objective: To examine and compare the awareness, use and provision of CMI by consumers, pharmacists
and general practitioners (GPs).Methods: Based on previous studies, structured questionnaires were developed and administered to anational sample of consumers (phone survey); community pharmacists and GPs (postal surveys) about
utilization of CMI. Descriptive, comparative and logistic regression analyses were conducted.Results: The respondents comprised of 349 pharmacists, 181 GPs and 1000 consumers. Two-thirds ofconsumers, nearly all (99%) pharmacists and 90% of GPs were aware of CMI. About 88% of consumers
reported receiving CMI as a package insert, however most pharmacists (99%) and GPs (56%) reportedproviding computer-generated CMI. GPs’ and pharmacists’ main reason for providing CMI was on patientrequest. Reasons for not providing were predominantly because consumers were already taking the
medicine, concerns regarding difficulty understanding the information, or potential non-adherence. Of the691 consumers reportedly reading CMI, 35% indicated concerns after reading. Factors associated withreading included gender, type of CMI received and frequency of provision.Conclusion: Consumers want and read information about their medicines, especially when received from
their GP or pharmacist. Healthcare professionals report usually discussing CMI when providing it topatients, although continued improvements in dissemination rates are desirable. Regular use of CMIremains a challenge, and ongoing strategies to promote CMI use are necessary to improve uptake of CMI
in Australia.� 2013 Elsevier Inc. All rights reserved.
* Corresponding author. Tel.: þ61 2 9114 0916; fax: þ61 2 9351 4391.
E-mail address: [email protected] (K.K. Hamrosi).
1551-7411/$ - see front matter � 2013 Elsevier Inc. All rights reserved.
http://dx.doi.org/10.1016/j.sapharm.2013.10.002
2 Hamrosi et al. / Research in Social and Administrative Pharmacy j (2013) 1–14
Keywords: Written medicine information; Patient education; Information-sharing; Health literacy; Community phar-
macists; General practitioners
Introduction
Written medicine information is an important
source of information for consumers and an inte-gral component of their education about medi-cines.1 The literature contains evidence of its role
and value,2 andpositive impact onmedicine knowl-edge, satisfaction and health literacy.3 Studies havefocused on improving usability4 and design5 ofwritten medicine information, advocating con-
sumer input into the evaluation process to enhanceits usefulness to end-users. Several factors havebeen shown to influence consumer evaluation and
intended use of written medicine information,notably health literacy, comprehension and per-ceived usefulness, which can impact its benefits in
practice.6
Consumers want written medicine informationin conjunction with spoken information; however,
many do not actively seek it.7,8 Self-report studieshave indicated that healthcare professionals regu-larly provide both oral and written information,9
but this is generally not reflected in consumer
studies that report lower provision rates.9,10 Gen-eral practitioners (GPs) and pharmacists areconsidered the most important, trusted and reli-
able sources of written medicine information.11
However, despite growing evidence surroundingconsumer desire and interest in receiving written
medicine information, healthcare professionals inAustralia often fail to provide it, and if provided,do so with limited interaction.12
In Australia, Consumer Medicine Information(CMI) is a standardized form of brand-specificwritten medicine information produced by manu-facturers according to strict legislation,13 essen-
tially with limited consumer input (unlike theEuropean Union). This has led to questions of suf-ficient independence of information, concerns
regarding reliability and credibility, and percep-tions of a dominant medico-legal theme withinCMI.14 CMI for prescriptionmedicines is available
electronically through dispensing or prescribingprograms; from the Internet via government,manufacturer or third party websites; inside themedicine box (package insert); or as loose leaflets
through pharmacies (less commonly). The formatcan vary from a single-page package insert throughto several computer-generated pages. In contrast
to the European Union, Australian CMI is not le-gally required to be inside the medicine’s box.
Moreover, provision of CMI by healthcare profes-sionals in Australia is not mandatory. Professionalpractice standards and guidelines to assist health-
care professionals in their legal and professionalobligations have been developed but provisionrates remain low.15�17
The literature contains numerous studies eval-
uating the use and impact of written medicineinformation. However, few studies have beenconducted with CMI, which differs in presentation,
content, design and readability to other writtenmedicine information. In comparison to manyother countries, Australian CMI are standardized
and regulated documents produced using the Us-ability Guidelines,18 and from templates or ‘coreCMI’ (derived from guidelines first published in
1993) commonly used by manufacturers whenwriting CMI to meet their legislative obligationsand to incorporate essential design and layoutprinciples. This has resulted in Australia having
the highest compliance on readability and visualpresentation when compared with other English-speaking countries.19 Furthermore, most studies
have focused on consumers, and as such, health-care professional interaction with written medicineinformation and more specifically CMI, is essen-
tially an unexplored area that needs further inves-tigation to furnish a more holistic picture. Todate, no studies have compared the awareness,
use and readership of CMI by consumers to com-munity pharmacists and general GPs, whose re-sponsibility it is to provide this information.
Therefore, informed by the findings of two
previous exploratory qualitative studies withconsumers14 and healthcare professionals,20 thisquantitative study was conducted which aimed to:
(1) determine current awareness and use of writtenmedicine information, specifically CMI, for pre-scription medicines, (2) examine the reasons
surrounding readership and provision and (3)compare both consumer and healthcare profes-sional (communitypharmacist andGP)useofCMI.
Methods
The studywas conducted betweenFebruary andApril 2009 after approval from the Institution’s

3Hamrosi et al. / Research in Social and Administrative Pharmacy j (2013) 1–14
Human Research Ethics Committee. The studyconsisted of postal surveys to GPs and communitypharmacists, and telephone surveys with con-sumers. Postal surveys for GPs and pharmacists
allowed completion at a suitable time withoutintrusion on consultation or business activities.Conversely, telephone surveys were utilized to
sample consumers to facilitate a higher responserate, and offered the advantage of capturingparticipants who were unlikely to complete a writ-
ten survey.
Sampling
A sample size of 226 consumers was calcu-
lated,21 based on CMI receipt rates of 18%15 and a5% degree of precision. However, for the purposesof comparison to previous data15 1000 consumers
were surveyed. Consumer telephone interviewswere stratified by state and territory using Austra-lian Bureau of Statistics (ABS)22 population data
to recruit a representative sample based on gender,age and including both metropolitan and ruralpopulations.
Using the same method as above, the sample
size for pharmacists was calculated as 108, basedon CMI provision rates (7.6%) reported in anearlier study in New South Wales (NSW).23
Assuming a 30% response rate, a sample size of360 pharmacists was required within NSW. Thesurvey was conducted Australia-wide, and sample
sizes were calculated for the other states and terri-tories using the number of pharmacies per state/territory as the denominator, giving a total sample
distribution of 1046, rounded to 1100 subjects.There were no published studies on the pro-
portion of GPs or other prescribers providingCMI. Using estimates regarding response rate
informed by other studies with medical practi-tioners (range: 47–68%24,25), a conservative 30%response was assumed as per pharmacist data
and calculated the sample size for GPs to be thesame as pharmacists, 1100 subjects.
Data collection
Consumers were randomly telephoned fromthe Australian telephone directory by trainedresearchers and recruited using a pre-written
script that included study information and eligi-bility (at least 18 years of age, able to participatewithout the need for a translator and taking at
least one prescription medicine for the monthprior to the telephone interview). The question-naire was administered using a computer-assisted
telephone interviewing system with responsesentered directly into a database during the inter-view.
A random sample (stratified and distributed
according to ABS22 population data) of 1100 GPsand 1100 community pharmacists was collatedfrom a database held by a healthcare data infor-
mation company. Potential participants weresent a postcard inviting them to take part. A sur-vey pack containing study information and ques-
tionnaire followed one week later. To increaseresponse rates and encourage non-respondents, afurther reminder and/or thank you postcard was
sent two weeks later, and a final survey packwas sent after approximately four weeks.26
Questionnaires
The study questionnaires27 were developedfrom earlier research,14 and previous findings.15,28
A central structured questionnaire was developed
and subsequently adapted for each of the threegroups: consumer, GP and pharmacist. The ques-tionnaires consisted of 7 sections: knowledge ofCMI (Section A); current use of CMI in practice
(B); experience after provision of CMI (C); opin-ions on the future provision of CMI (D); opinionson content and format of CMI (E); improving
provision and use of CMI (F); and demographiccharacteristics. The survey contained primarilyclosed-ended questions with single or multiple
response options, with an ‘other’ category includedwhere suitable. This paper reports results relatingto sections A, B and C. Two panels consisting of
pharmacists (n ¼ 8), consumer representatives(n ¼ 2) and other experts in the field (n ¼ 9) re-viewed all questionnaires for content and face val-idity. Questionnaires were then piloted with four
pharmacists (postal) and twenty-five consumers(telephone). Any changes derived from feedbackwere reflected across all three questionnaires.
Data analysis
All data were coded and entered into the Sta-tistical Package for Social Sciences (Version 19.0
IBM). Not all questions were answered and/orsome allowed multiple responses hence the numberof respondents varied for each question. Descrip-
tive and frequency distributions were compiled forall categorical values for each group. To determinethe relationship between variables, univariate an-
alyses were conducted using non-parametric Chi-squared or Mann–Whitney U tests for each groupand to compare differences between pharmacists
4 Hamrosi et al. / Research in Social and Administrative Pharmacy j (2013) 1–14
and GPs. Variables that were significant atP ! 0.2529 were included as predictors for logisticregression to predict readership and provision. As
exploratory analysis was conducted with no priorassumptions, logistic regression was performed us-ing the forced entry method (all predictors enteredinto the equation simultaneously).29 Models were
checked for multicollinearity (variables with to-lerance values !0.1 were removed) and outliers.Significance values were set at P ! 0.05 for inter-
pretation of the final multivariate logistic regres-sion models.
Results
Demographics
To obtain 1000 eligible and consenting re-spondents, researchers conducting the phone sur-veys called 11,653 telephone numbers nationally
in both metropolitan and rural areas stratifiedaccording to ABS22 demographic data. A total of5386 persons answered the phone, of which 2107
people refused to participate and a further 1644did not meet the eligibility criteria, resulting inan overall response rate of 32%. The postal sur-
vey response rate was 34% (n ¼ 349) for pharma-cists and 17% (n ¼ 181) for GPs. Sample sizeswere sufficient to run valid bivariate and logisticregression analyses.
The median age of consumer participants was60 (range 18–98) years, whilst pharmacists’ andGPs’ median ages were 47 (range 22–87) years and
52 (range 31–83) years, respectively. Concerninggender, 516 (52%) consumers, 189 (54%) phar-macists and 93 (52%) GPs were female. Most
consumers (n ¼ 750, 75%) and pharmacists(n ¼ 246, 71%) were born in Australia with only53% (n ¼ 96) of GPs born in Australia.
Consumer occupations consisted mainly ofwhite-collar workers and retirees, and education
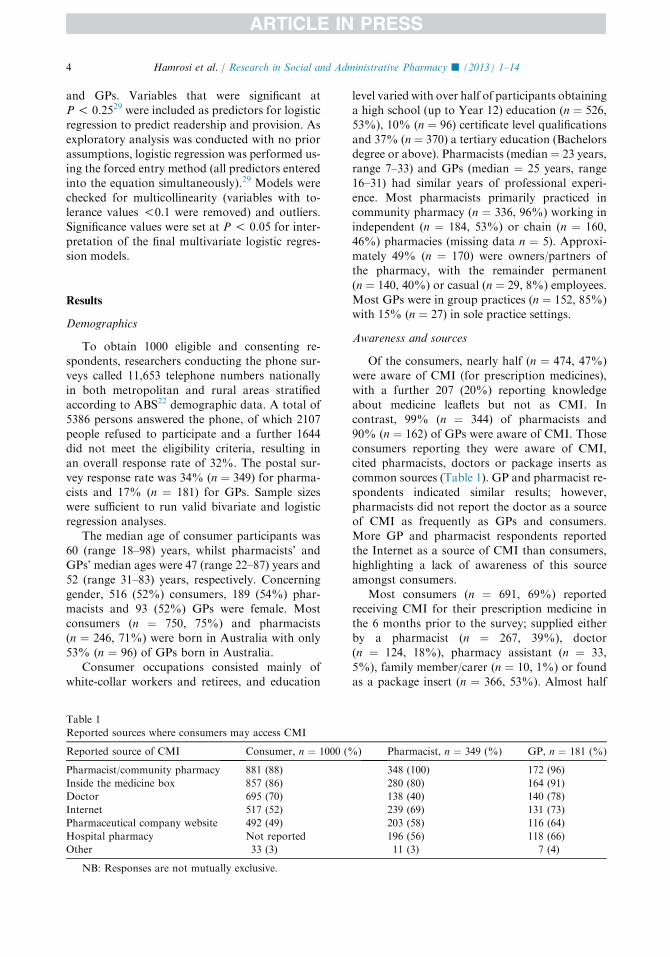
Table 1
Reported sources where consumers may access CMI
Reported source of CMI Consumer, n ¼ 1000 (%
Pharmacist/community pharmacy 881 (88)
Inside the medicine box 857 (86)
Doctor 695 (70)
Internet 517 (52)
Pharmaceutical company website 492 (49)
Hospital pharmacy Not reported
Other 33 (3)
NB: Responses are not mutually exclusive.
level varied with over half of participants obtaininga high school (up to Year 12) education (n ¼ 526,53%), 10% (n ¼ 96) certificate level qualifications
and 37% (n ¼ 370) a tertiary education (Bachelorsdegree or above). Pharmacists (median ¼ 23 years,range 7–33) and GPs (median ¼ 25 years, range16–31) had similar years of professional experi-
ence. Most pharmacists primarily practiced incommunity pharmacy (n ¼ 336, 96%) working inindependent (n ¼ 184, 53%) or chain (n ¼ 160,
46%) pharmacies (missing data n ¼ 5). Approxi-mately 49% (n ¼ 170) were owners/partners ofthe pharmacy, with the remainder permanent
(n ¼ 140, 40%) or casual (n ¼ 29, 8%) employees.Most GPs were in group practices (n ¼ 152, 85%)with 15% (n ¼ 27) in sole practice settings.
Awareness and sources
Of the consumers, nearly half (n ¼ 474, 47%)were aware of CMI (for prescription medicines),
with a further 207 (20%) reporting knowledgeabout medicine leaflets but not as CMI. Incontrast, 99% (n ¼ 344) of pharmacists and
90% (n ¼ 162) of GPs were aware of CMI. Thoseconsumers reporting they were aware of CMI,cited pharmacists, doctors or package inserts as
common sources (Table 1). GP and pharmacist re-spondents indicated similar results; however,pharmacists did not report the doctor as a sourceof CMI as frequently as GPs and consumers.
More GP and pharmacist respondents reportedthe Internet as a source of CMI than consumers,highlighting a lack of awareness of this source
amongst consumers.Most consumers (n ¼ 691, 69%) reported
receiving CMI for their prescription medicine in
the 6 months prior to the survey; supplied eitherby a pharmacist (n ¼ 267, 39%), doctor(n ¼ 124, 18%), pharmacy assistant (n ¼ 33,
5%), family member/carer (n ¼ 10, 1%) or foundas a package insert (n ¼ 366, 53%). Almost half
) Pharmacist, n ¼ 349 (%) GP, n ¼ 181 (%)
348 (100) 172 (96)
280 (80) 164 (91)
138 (40) 140 (78)
239 (69) 131 (73)
203 (58) 116 (64)
196 (56) 118 (66)
11 (3) 7 (4)

5Hamrosi et al. / Research in Social and Administrative Pharmacy j (2013) 1–14
(n ¼ 327, 47%) reported receiving CMI every timethey received a new medicine, while 272 (40%)received it when collecting a repeat prescriptionfor a regular medicine. Ten percent (n ¼ 69)
received it only when they requested such.There was disparity amongst the types of
written medicine received or provided. Over
three-quarters of pharmacists (n ¼ 272, 78%)and less than half of GPs (n ¼ 87, 48%) reportedproviding package inserts, yet most consumers
(n ¼ 606, 88%) reported receiving them whenprovided with written medicine information.Computer-generated CMI was commonly pro-
vided by pharmacists (n ¼ 347, 99%) and GPs(n ¼ 101, 56%); however, this was not reflectedin consumer responses that reported only 37%(n ¼ 257) receiving computer-generated CMI.
Forty percent (n ¼ 141) of pharmacists and 25%of GPs (n ¼ 45) also reported providing loose leaf-lets/brochures yet only 7% (n ¼ 47) of consumers
reported receipt.
Readership by consumers
Approximately two-thirds (n ¼ 457, 66%) ofconsumers reported usually reading the CMI,
with ‘side effects’ and ‘what the medicine is for’being most read (Table 2). Reasons provided fornot reading the CMI were, they had taken themedicine previously (n ¼ 356/462, 77%) or
received enough information verbally from theirpharmacist or GP (n ¼ 53, 12%). Only a smallpercentage did not read the CMI because they
found it too long (n ¼ 16, 4%) or contained toomuch information (n ¼ 8, 2%).
Logistic regression assessed the impact of
various factors on the likelihood of consumersreading CMI. The variables demonstrated sam-
Table 2
Sections of the CMI read by consumers (column 2); or discus
consumers
Section of the CMI Consumer, n ¼ 457
Side effects 442 (97)
What the medicine is for 442 (97)
Before starting the medicine 426 (93)
How to take the medicine 426 (93)
How to store the medicine 399 (87)
Drug–drug interactions 391 (86)
List of contents of the leaflet 362 (79)
What the ingredients are 281 (62)
How to dispose of leftover medicine 274 (60)
Manufacturer contact details 215 (47)
NB: Responses are not mutually exclusive.
pling adequacy. The model contained 11 indepen-dent variables relating to type of CMI, provider ofCMI, frequency of distribution, gender and occu-pation. The final model produced was statistically
significant (c2 (11, n ¼ 648) ¼ 125.61, P ! 0.001),indicating that the model was able to distinguishbetween respondents who reported reading CMI
and those who did not. Overall, the model success-fully predicted 73.3% of cases. From the Wald sta-tistics (Table 3a), type of CMI received, provider
of CMI, frequency of provision and gender reliablypredicted consumers who were likely to read CMI.Consumers who received computer-generated
written medicine information other than CMIfrom their GP or pharmacist were almost fourtimes more likely to read this information. Femaleswere twice as likely to read CMI than males. Con-
sumers who received package inserts were approx-imately two times less likely to read CMI thanthose who received information from their health-
care professional.
Provision of CMI by pharmacists and GPs
All pharmacists (n ¼ 1 missing data) and 69%(n ¼ 125) of GPs reported providing CMI. Phar-
macists reported providing CMI when dispensinga new medicine most (n ¼ 150, 43%) or all(n ¼ 168, 48%) of the time, and provided CMIwith repeat medicines some (n ¼ 244, 70%) or
none (n ¼ 101, 29%) of the time. Similarly, GPsprovided CMI most (n ¼ 56, 31%) or all(n ¼ 18, 10%) of the time with new medicines,
and some (n ¼ 53, 29%) or none (n ¼ 123,68%) of the time with repeat prescribing. On theavailability of new information about a medicine,
GPs provided CMI most (n ¼ 53, 17%) or all(n ¼ 94, 52%) of the time in comparison to
sed by pharmacists (column 3) or GPs (column 4) with
(%) Pharmacist, n ¼ 349 (%) GP, n ¼ 181 (%)
325 (93) 137 (76)
290 (83) 108 (60)
171 (49) 77 (43)
291 (83) 107 (59)
131 (38) 35 (19)
178 (51) 81 (45)
132 (38) 25 (14)
43 (12) 19 (11)
33 (10) 4 (2)
3 (1) 3 (2)

Table 3
Logistic regression predicting likelihood of (a) consumers reading CMI or (b) GPs providing CMI
Independent variables Regression coefficient (B) Wald (z-test) P Odds ratio 95% CI
Lower Upper
(a) Consumers reading CMI
Type of CMI received Package insert – not received, received (ind) 0.55 0.03 0.876 1.06 0.53 2.11
Computer generated CMI – not received,
received (ind)
0.23 0.38 0.537 1.26 0.61 2.62
Computer generated medicine information (not
CMI) – not received, received (ind)
1.37 4.56 0.033 3.94 1.12 13.84
Loose leaflets – not received, received (ind) 0.50 1.91 0.167 1.64 0.81 3.32
Provider Not provided, package insert provided (ind) �0.95 5.69 0.017 0.9 0.18 0.85
Frequency New medicine – not provided, provided (ind) 0.37 3.58 0.058 1.45 0.99 2.14
Repeat medicine – not provided, provided (ind) �0.57 8.38 0.004 0.57 0.39 0.83
Gender Male/Female (ind) 0.76 14.72 0.000 2.14 1.45 3.15
Occupation Retired/white-collar (ind) �0.42 4.01 0.045 0.66 0.44 0.99
Retired/blue-collar (ind) �0.59 3.95 0.047 0.55 0.31 0.99
Retired/homemaker (ind) 0.35 0.72 0.396 1.41 0.64 3.14
N 648
Model c2 test c2 ¼ 125.61, df ¼ 11, P ! 0.001
Hosmer & Lemeshow test c2 ¼ 6.97, df ¼ 8, P ¼ 0.540
Nagelkerke R2 0.25
(b) General practitioners providing CMI
Type of CMI provided Package insert in sample box – not provided,
provided (ind)
1.45 5.79 0.016 4.24 1.31 13.79
Computer generated CMI – not provided,
provided (ind)
3.43 24.05 0.000 31.00 7.86 122.32
Loose leaflets – not provided, provided (ind) 1.32 3.32 0.068 3.74 0.91 15.42
Source where patients access CMI Other, hospital pharmacist (ind) �0.56 0.93 0.335 0.57 0.18 1.78
Other, doctor (ind) 2.07 9.81 0.002 7.93 2.17 28.96
GP access to CMI Prescribing software – not used, used (ind) 1.98 11.07 0.001 7.27 2.26 23.41
MIMS – not used, used (ind) 0.80 1.70 0.192 2.23 0.67 7.40
Pharmaceutical website – not used, used (ind) 2.22 5.09 0.024 9.18 1.34 63.16
Gender Male/Female (ind) 0.84 2.07 0.150 2.32 0.74 7.31
N 179
Model c2 test c2 ¼ 127.83, df ¼ 9, P ! 0.001
Hosmer & Lemeshow test c2 ¼ 4.830, df ¼ 8, P ¼ 0.776
Nagelkerke R2 0.72
ind ¼ indicator category.
6Hamrosiet
al./Resea
rchin
Socia
landAdministra
tivePharm
acy
j(2013)1–14

7Hamrosi et al. / Research in Social and Administrative Pharmacy j (2013) 1–14
pharmacists (n ¼ 112, 32% and n ¼ 73, 21%,respectively).
Logistic regression was performed to determinehealthcare professional variables that impact pro-
vision of CMI (Table 3b). Pharmacist data couldnot be included in the analysis as these respondentsall reported providing CMI, therefore regression
was conducted using GP respondent variables.The model contained nine independent variablesrelating to gender, type of CMI provided, source
of CMI and access to CMI. The final model wasstatistically significant c2 (9, n ¼ 179) ¼ 127.83,P ! 0.001, and performed well in distinguishing
GPs who reported providing CMI or not. Overall,the model successfully predicted 89.4% of thecases. Wald statistics (Table 3b) showed type,source and access to CMI reliably predicted GPs
who provided CMI. GPs who used computer-generated CMI and relied on package inserts insample boxes were more likely to provide CMI.
Similarly, those GPs with access to prescribingsoftware and pharmaceutical company websiteswere also far more likely to provide CMI. Finally,
GPs that reported themselves as the patient accesspoint for CMI were almost eight times more likelyto provide CMI.
The reported reasons for providing or NOTproviding CMI (Table 4) by pharmacists and GPsvaried. Pharmacists’ were more likely to provideCMI, apart from on patient request, predomi-
nantly because of patients’ right to information,informed choice, reinforcing medicine-takingbehavior and verifying their own knowledge,
than GPs. This differed significantly from GPswhose reasons were mostly associated with re-quests by patients for CMI.
Pharmacists’ were more likely NOT to provideCMI (Table 4) due to the reasons of knowing thatpatients had taken the medicine previously; con-cerns with patients’ difficulty in understanding/
reading CMI; patient non-adherence; and use ofthe medicine off-label, when compared to GPs.However, GPs reported NOT providing CMI
(Table 4) predominantly because patients receivedsufficient spoken information from them and theyexperienced a lack of time with patients. Interest-
ingly, GPs also did not provide CMI because theybelieved the patient would receive this informa-tion from their pharmacist.
CMI in practice
Mann–Whitney U tests revealed few differ-ences in the use of CMI in patient interactions/consultations between GPs and pharmacists
(Table 5). The majority of pharmacists and GPsreported verbally discussing sections of the CMIwith patients or drew their attention to sectionsof the CMI, although pharmacists were more
likely to do so most to all of the time in compar-ison to GPs, who reported doing so some to mostof the time. Most pharmacists or GPs were un-
likely to provide CMI without verbal counseling,but few discussed the entire CMI with their pa-tients. Various sections of the CMI were discussed
with patients (Table 2). Side effects were the mostdiscussed section, followed by what the medicineis for.
Three-hundred and eighteen consumers re-ported directly receiving CMI from their pharma-cist or GP; 108 (34%) reported CMI being givento them with no further discussion, and a similar
proportion (n ¼ 93; 29%) had a CMI discussed indetail with them. Others (n ¼ 57, 18%) had sec-tions pointed out to them and 45 (14%) were pro-
vided CMI, asked to read and return if they hadquestions.
Concerns and queries
Of the 457 consumers who reported reading
CMI, 164 (35%) reported a concern or query afterreading; the predominant being experiencing a sideeffect (n ¼ 101, 62%), drug–drug interactions
(n ¼ 43, 26%) and needing more informationand/or instructions about the medicine (n ¼ 24,15%). Most pharmacists (n ¼ 320, 92%) andGPs (n ¼ 161, 89%) reported that their patients
had concerns or queries after reading CMI. Con-sumers’ initial action was to contact the doctor(n ¼ 98, 60%), followed by the pharmacist
(n ¼ 51, 31%) with 5% (n ¼ 8) refusing to takethe medicine. Pharmacists and GPs reported thereverse, indicating pharmacists being the first con-
tact (reported by 315 or 90% of pharmacists; and145 or 81% of GPs), followed by the GP(n ¼ 135, 39% pharmacists; n ¼ 97, 54% GPs).
Over two-thirds of GPs (n ¼ 112, 62%) and abouta quarter of pharmacists (n ¼ 95, 27%) reportedpatients refusing/ceasing to take their medicine.Following on from the initial action and after
consulting with the doctor or pharmacist, overhalf of consumers (n ¼ 73, 55%), pharmacists(n ¼ 156, 58%) and GPs (n ¼ 81, 57%) reported
no change in the patients’ medicine. The otherhalf reported changing the medicine (n ¼ 21,16% consumers; n ¼ 39, 14% pharmacists;
n ¼ 14, 10% GPs), ceasing the medicine (n ¼ 19,14% consumers; n ¼ 19, 7% pharmacists; n ¼ 19,13% GPs), changing dosages (n ¼ 17, 13%

Table 4
Comparison of pharmacist and GP reasons for providing and NOT providing CMI
What are your reasons for
providing a CMI?
Pharm,
n ¼ 349 (%)aGP,
n ¼ 181 (%)aStatistics What are your
reasons for NOT
providing a CMI?
Pharm,
n ¼ 349 (%)aGP,
n ¼ 181 (%)aStatistics
Patient requests a CMI 320 (92) 111 (61) c2 ¼ 72.34
P ! 0.001
Patient has taken the
medicine previously
281 (81) 126 (70) c2 ¼ 7.95
P ¼ 0.005
Duty of care to inform the
patient about their
medicine
313 (90) 79 (44) c2 ¼ 131.18
P ! 0.001
Patient has difficulty
understanding or reading
the content of CMI
169 (48) 65 (36) c2 ¼ 7.57
P ¼ 0.006
Patient has a right to
information about the
medicine
278 (80) 74 (41) c2 ¼ 80.33
P ! 0.001
Concern the patient will not
take the medicine
127 (36) 40 (22) c2 ¼ 11.28
P ¼ 0.001
Provide information for the
carer/parent
262 (75) 75 (41) c2 ¼ 58.23
P ! 0.001
Medicine used for a purpose
other than indicated
109 (31) 7 (4) c2 ¼ 52.20
P ! 0.001
Assist patient to make an
informed choice to aid
adherence
260 (75) 84 (46) c2 ¼ 41.29
P ! 0.001
Medicine for short term
treatment (!2 weeks)
81 (23) 41 (23) c2 ¼ 0.02
P ¼ 0.885
Reinforce the benefits and
how to take the medicine
257 (74) 72 (40) c2 ¼ 58.04
P ! 0.001
Patient receives sufficient
spoken information from
me
59 (17) 61 (34) c2 ¼ 19.20
P ! 0.001
Check that I did not forget
to verbally provide any
information
204 (59) 62 (34) c2 ¼ 27.92
P ! 0.001
The CMI is not useful to the
patient
33 (10) 19 (11) c2 ¼ 0.15
P ¼ 0.702
Patient had a previous bad
experience
93 (27) 41 (23) c2 ¼ 1.01
P ¼ 0.316
Otherc 32 (9) 19 (11) c2 ¼ 0.24
P ¼ 0.623
Otherb 12 (3) 8 (4) c2 ¼ 0.32
P ! 0.574
Insufficient time to spend
with the patient
29 (8) 71 (39) c2 ¼ 74.42
P ! 0.001
The patient receives CMI
from the pharmacistc or
the doctor will provide
CMId
15 (4) 100 (55) c2 ¼ 182.11
P ! 0.001
a Responses are not mutually exclusive.b Other: reinforce instructions*,#, encourage patient responsibility*,#, highlight side effects*,# medicine has narrow therapeutic indices# or serious side effect#, check con-
traindications# (* ¼ GP, # ¼ pharmacist responses).c Other: patient anxiety*, CMI in medicine box*, CMI usability*, patient CMI access via internet*, patient refusal#, non-provision requests by carer/doctor#, inducing fear
of side effects#, CMI confusing# (* ¼ GP, # ¼ pharmacist responses).c GP survey statement.d Pharmacist survey statement.
8Hamrosiet
al./Resea
rchin
Socia
landAdministra
tivePharm
acy
j(2013)1–14

Table 5
Median scores of pharmacist and GP use of CMI with verbal counseling
How do you currently use
a CMI with your patients?
None/some of
the time, n (%)
Most/all of
the time, n (%)
Median
scoreaIQR
Provide CMI only, with no verbal counseling
Pharmacist 303 (97) 8 (3) 1 1–2
GP 111 (98) 2 (2) 1 1–1
Discuss the entire CMI
Pharmacist 303 (96) 11 (4) 1 1–2
GP 111 (96) 4 (4) 1 1–1
Provide CMI, ask the patient to read and return if have any questions
Pharmacist 204 (64) 114 (36) 2 2–3
GP 87 (65) 46 (35) 2 1.5–3
Verbally discuss sections of CMI I feel are important
Pharmacist 63 (19) 269 (81) 3 3–4
GP 58 (42) 79 (58) 3 2–3
Draw attention to specific sections of CMI with some verbal counseling
Pharmacist 56 (17) 281 (83) 3 3–4
GP 66 (49) 70 (52) 3 2–3
IQR ¼ interquartile range.a Score: 1 ¼ none of the time, 2 ¼ some of the time, 3 ¼ most of the time, 4 ¼ all of the time.
9Hamrosi et al. / Research in Social and Administrative Pharmacy j (2013) 1–14
consumers; n¼ 5, 2%pharmacists; n¼ 1, 1%GPs)or providing reassurance, further clarification/explanation (n ¼ 18, 14% consumers; n ¼ 26,
10% pharmacists; n ¼ 23, 16% GPs).
Discussion
This study compared consumers’, pharmacists’and GPs’ awareness, use and provision of CMI,and identified some factors associated with its
readership and provision. A representative con-sumer sample was achieved for demographicdistribution through recruiting according to
geographic stratification quotas, with propor-tional representation per State and Territory,and metropolitan and rural populations. In terms
of gender the study contained 52% females,similar to the desired sampling frame of 52.5%females. The median age for consumer partici-
pants was 60 years in comparison to 37 years forthe Australian population.30 As the study specif-ically targeted medicine users the higher medianage of participants is not unexpected as medica-
tion use and proportion of medicines used in-creases with age. Of note, consumer respondents’education levels varied significantly, particularly
the percentage of participants who held tertiaryqualifications was much higher than ABS31 re-ported data (37% vs 23%) which may have influ-
enced consumers use of CMI.The results showed that over two-thirds of
consumers were aware of written medicine infor-
mation, predominantly as CMI, an encouragingimprovement from previous studies.10,15 In themain, community pharmacists andGPswere aware
of CMI, which is encouraging as consumers regardthem as the two important sources of CMI.Approximately 69% of consumers reported
receivingCMI in the sixmonths prior to the survey.Earlier Australian studies reported CMI receiptrates as 36% in 1996, 57% in 1999,32 and 82% in200510 for prescription medicines. In contrast, a
2009 study16 reported receipt rates of 22%, butdid not differentiate CMI for prescription andover-the-counter medicines. The common trend in
these studies has been an increase in CMI provisionover the last two decades, although the results indi-cate a small decline from 2005, indicating the need
for vigilance and periodic awareness campaignsand education strategies among consumers andhealthcare professionals.
Written medicine information in conjunction
with spoken information is considered moreeffective than either alone.33,34 The prevalence ofpackage inserts in Australia has been steadily
declining, with electronic distribution of CMIthrough dispensing and prescribing softwareconsidered preferable in order to provide up-to-
date information. Interestingly, most consumerrespondents reported receiving a package insertin contrast to half reportedly receiving CMI
from their pharmacist or doctor. The awarenessof CMI as a package insert was notable, and asteady decline in availability of package insert

10 Hamrosi et al. / Research in Social and Administrative Pharmacy j (2013) 1–14
CMI may have implications for consumer aware-ness and use. Comparatively, pharmacists andGPs reported greater distribution of computer-
generated CMI compared to package inserts,however whether they actively distribute the pack-age insert or assume its presence is unclear.
Patients often prefer to receive medicine infor-
mation from their doctor, however time restric-tions may limit a doctor’s ability to provide this,35
which was reflected in over a third of GP respon-
dents reporting insufficient time to spend with thepatient on providing CMI (compared to less thanone-tenth of pharmacists). This may explain the
study results showing pharmacists as the predom-inant source of CMI for consumers (88% vs 70%for GPs); perhaps seen as ‘medicine experts’,readily accessible, able to fill information gaps
post-consultation (with potential to alleviatetime burdens on GPs); and they are often the finalhealthcare professional patients consult before
taking their medicine.36,37 GPs too, predomi-nantly rely on pharmacists to provide CMI andcounseling,20 see pharmacists as the primary
source of CMI and as such this belief may explainthe lack of CMI provision in consultation, ashighlighted in the results (96% of GPs indicated
pharmacists as a source of CMI).Similar to previous studies, 66% of consumers
in this study reported reading CMI, with femalestwice as likely to read CMI as males.10,38 Reader-
ship may be influenced by the nature and quality(design, flimsy nature and small font) of writtenmedicine information (i.e. package inserts) which
in turn affects readability and usability by con-sumers.39 Despite observations to the contrary,14
this study found negligible impact of quantity
and length on consumer readership of CMI. Con-sumer respondents were more likely to read medi-cine information provided by their healthcareprofessional, compared to package inserts, sub-
stantiating the influence of personally provided in-formation on readership, and perception of itsusefulness.40 Previous findings indicate a positive
association with physician counseling and readingwritten medicine information.37 Interestingly,computer-generated written medicine information
other than CMI strongly predicted consumer read-ership in this study, with consumers almost fourtimes more likely to read this information. It can
only be speculated, since it was not elucidated,that GPs’ and pharmacists’ personal preferenceand perceptions of other writtenmedicine informa-tion as more patient-focused, relevant, and read-
able to consumers than CMI may influence the
interaction and time afforded to consumers indisseminating this information, providing a senseof tailoring or personalization that impacts con-
sumer readership. Findings from previous studiesindicate patient preference is for written medicineinformation tailored to the individual41 and whichhighlights the medicine’s benefits.42
Evidence shows consumers value face-to-facecontact.43 Two thirds of consumers reported arange of interactions with the pharmacist or GP
when being provided with CMI. In this study,GPs and pharmacists were unlikely to provideCMI without verbal counseling, the downside of
which may mean consumers are missing out onreceiving CMI if time is limited, which is oftenthe case in consultations.14 However, if CMI isprovided, an interaction or discussion transpiring
between healthcare professional and consumer islikely. The active engagement of healthcare pro-fessionals in providing written and spoken infor-
mation is a vital component in maximizing theimpact and importance of CMI, as well as assist-ing consumers to understand the risks and benefits
of their medicines.37,44
Time limitations and imparting sufficientspoken information were significantly more likely
to be reasons for not providing CMI for GPs thanpharmacist respondents. Short consultation times,high workloads and limited resources contributeto the down-prioritization of CMI in consulta-
tions.20 This, along with perceptions around roleresponsibility (as inferred in the results as the pref-erence for the pharmacist as a source of CMI)
may further explain why often only spoken infor-mation is provided by GPs. This study also foundfactors such as ready access to CMI from pre-
scribing software, pharmaceutical websites andsample packs significantly influenced the provi-sion of CMI, as did self-identification by GPs asa source of CMI for patients thus predicting
that GPs who self-identify as a source of CMIare almost eight times more likely to provide it.Pharmacists were more likely to support
providing CMI due to beliefs surrounding con-sumers’ rights to information, duty of care, andpromoting informed choice than GPs, although
this was still notable among them. In Australia,the provision of medicines information as a keyrole is reinforced by professional practice guide-
lines,45 education programs23 and at practice levelthrough remuneration linked to CMI provision.
Despite the welcome increases to provisionrates and ongoing improvements to CMI over the
last decade, negative perceptions from healthcare

11Hamrosi et al. / Research in Social and Administrative Pharmacy j (2013) 1–14
professionals still persist.20 The idea of writtenmedicine information must be compatible withGP and pharmacist needs, values and experiencesas well as that of consumers. Past negative experi-
ences such as consumers declining CMI whenoffered, concerns or failure to take medicines afterreading CMI (which may be valid and appropriate
actions) may pose barriers and interfere with thesuccessful adoption by GPs and pharmacists ofCMI in everyday practice. Many GPs (89%) and
pharmacists (92%) reported situations where con-sumers had concerns or queries after reading CMI,resulting in consumers refusing to take or ceasing
their medicine, reflecting an earlier study with phy-sicians.46 Notwithstanding these results and ac-counts in the literature of a relationship betweenside effect fear and ceasing medication,47 very few
consumer respondents in this study reportedrefusing to take or ceasing their prescribed medi-cine, possibly inferring a confidence in their practi-
tioners treatment decisions. Thus, this relativelylow incidence does not support GP and pharmacistperceptions, nor justify their reluctance to provide
CMI to patients on this basis. Concerns about un-derstandability, usability and readability expressedby a significant proportion ofGPs and pharmacists
may also contribute to the undervaluing of CMIas a tool for information-sharing and furthercontribute to non-provision of CMI to consumers.Despite these concerns and some negative percep-
tions of the value of CMI held by healthcareprofessionals, consumers find CMI useful, infor-mative and educational and as such should at
each opportunity at the very least be offered the op-tion of receiving a CMI.38,48
Limitations to this research must be considered
when interpreting the results. The response ratesmay indicate a bias toward participants with aspecific interest in CMI. The results have beenderived from self-report data, and subject to per-
sonal, social desirability and/or recall bias. How-ever, a representative consumer sample wasachieved with regard to gender and location in
accordance with ABS data. Data was not collectedon the medicines consumers were currently takingand the influence this may have had on their
responses. Consumers may receive written medi-cine information for various medicines and ill-nesses, and it is possible that their perception and
readership of the leaflets may have been influencedby the seriousness or chronic nature of theirtreatment. Consideration should also be given tothe limitations of telephone surveys despite the
advantages of rapid data collection and
accessibility to respondents. Inattentiveness, timeconstraints or open-ended questions may nega-tively affect participant responses. Consumers withmobile telephones only or silent numbers may not
have been represented, as calls were limited tounrestricted landlines. Due to increases in telemar-keting, many households employ call screening
and thus may have opted not to answer thetelephone. GP response rates were lower thanexpected, despite follow-up, which may reflect the
low priority that CMI has for invitees. The GPs’and pharmacists’ respondent sample whilst notgeneralizable, may provide constructive insight
into the use and provision practices of GPs andpharmacists in relation to CMI, providing a basisfrom which to direct further research.
Conclusion
The awareness of CMI among consumers,community pharmacists, and GPs has increasedin Australia over the past decade, along with the
proportion of consumers receiving CMI. Howev-er, provision rates remain lower than desirable,implying that the value of CMI has not been fully
realized or accepted by healthcare professionals,despite improvements in access, development andquality of CMI, associated education programs
and professional guidelines. Although CMI maynot be the best source of medicine information forall consumers, it is currently the most compre-hensive written information available for all pre-
scription medicines in Australia. At a minimumall consumers should at least be offered CMI inconsultation, providing healthcare professionals
with the opportunity to engage consumers anddetermine their beliefs, expectations and needssurrounding the amount and type of information
desired.The introduction of strategies and education
programs for consumers and healthcare profes-
sionals to support understanding of the purposeand function of CMI, alongside its role as a toolto improve health literacy and education aboutmedicines may be beneficial in promoting it’s
explicit effects, such as improved adherence,knowledge or satisfaction with medicines. Indeed,considering the role of CMI in dissemination of
medicine information and patient empowerment,the involvement of healthcare professionals alongwith consumer, professional and government
bodies to develop minimum practice standards,education and change management strategies toroutinely incorporate CMI in consultation is

12 Hamrosi et al. / Research in Social and Administrative Pharmacy j (2013) 1–14
warranted. Further research is needed to fullyunderstand consumers’, pharmacists’ and GPs’underlying attitudes, motivations and rationale
surrounding utilization of CMI and determineways in which to support facilitation and utiliza-tion of CMI in practice.
Acknowledgments
Funding:This study was part of a larger project called
‘The Consumer Medicine Information Effective-
ness Project.’ We gratefully acknowledge thefunding by the Australian Government Depart-ment of Health and Ageing as part of the FourthCommunity Pharmacy Agreement Research and
Development program managed by the PharmacyGuild of Australia.
Declaration of interest:
D.K. Raynor is co-founder and academicadvisor of Luto Research Ltd, which develops,refines and tests health information.
References
1. KooMM,Krass I, Aslani P. Factors influencing con-
sumer use of written drug information. Ann Phar-
macother Feb 2003;37:259–267.
2. Grime J, Blenkinsopp A, Raynor DK, Pollock K,
Knapp P. The role and value of written information
for patients about individual medicines: a systematic
review. Health Expect Sep 2007;10:286–298.
3. Nutbeam D. The evolving concept of health literacy.
Soc Sci Med Dec 2008;67:2072–2078.
4. Raynor DK, Knapp P, Silcock J, Parkinson B,
Feeney K. “User-testing” as a method for testing
the fitness-for-purpose of written medicine informa-
tion. Patient Educ Couns 2011;83:404–410.
5. Raynor DK, Dickinson D. Key principles to guide
development of consumer medicine information–
content analysis of information design texts. Ann
Pharmacother Apr 2009;43:700–706.
6. Koo MM, Krass I, Aslani P. Patient characteristics
influencing evaluation of written medicine informa-
tion: lessons for patient education. Ann Pharmac-
other Sep 2005;39:1434–1440.
7. Koo M, Krass I, Aslani P. Enhancing patient educa-
tion about medicines: factors influencing reading and
seeking of written medicine information. Health
Expect Jun 2006;9:174–187.
8. Sleath B,Wurst K. Patient receipt of, and preferences
for receiving, antidepressant information. Int J
Pharm Pract 2002;10:235–241.
9. Puspitasari HP, Aslani P, Krass I. A review of coun-
seling practices on prescription medicines in commu-
nity pharmacies. Res Social Adm Pharm Sep 2009;5:
197–210.
10. Koo M, Krass I, Aslani P. Consumer use of con-
sumer medicine information. J Pharm Pract Res
2005;35:94–98.
11. Narhi U. Sources of medicine information and their
reliability evaluated by medicine users. PharmWorld
Sci Dec 2007;29:688–694.
12. Koo M, Krass I, Aslani P. Consumer opinions on
medicines information and factors affecting its use-
an Australian experience. Int J Pharm Pract 2002;
10:107–114.
13. Australian Government. Therapeutic goods regula-
tions. In: Department of Health and Ageing, ed.
Vol Part 2A – Patient Information Statutory Rules
1990 No. 394 as Amended. Canberra: Federal Regis-
ter of Legislative Instruments; 1990.
14. Hamrosi KK, Aslani P, Raynor DK. Beyond needs
and expectations: identifying the barriers and facili-
tators to written medicine information provision
and use in Australia. Health Expect, Mar 6, 2012.
http://dx.doi.org/10.1111/j.1369-7625.2011.00753.x.
15. Benton M, Snow K, Parr V. Evaluation of the Medi-
cines Information for Consumer (MIC) Program:
Pharmacy Guild of Australia; 2004.
16. Vitry A, Gilbert A, Mott K, Rao D, March G. Pro-
vision of medicines information in Australian com-
munity pharmacies. Pharm World Sci Apr 2009;31:
154–157.
17. Puspitasari HP, Aslani P, Krass I. Pharmacists’ and
consumers’ viewpoints on counselling on prescrip-
tion medicines in Australian community pharmacies.
Int J Pharm Pract Aug 2010;18:202–208.
18. Sless D, Shrensky R. Writing About Medicines for
People In: Usability Guidelines for Consumer Medi-
cine Information. 3rd ed. Australian Self-Medication
Industry; 2006.
19. Luk A, Tasker N, Raynor DK, Aslani P. Written
medicine information from english-speaking coun-
trieshow does it compare? Ann Pharmacother Feb
2010;44:285–294.
20. Hamrosi KK, Raynor DK, Aslani P. Pharmacist
and general practitioner ambivalence about providing
writtenmedicine information topatients – a qualitative
study.ResSocialAdmPharmSep–Oct 2013;9:517–530.
21. Kalton G. Introduction to Survey Sampling. Beverly
Hills: Sage Publications; 1983.
22. Australian Bureau of Statistics. Australian Demo-
graphic Statistics June 2008, 2008. Accessed from:
http://www.abs.gov.au/AUSSTATS/[email protected]/Details
Page/3101.0Jun%202008?OpenDocument#Publications.
23. Aslani P, Benrimoj SI, Krass I. Development and
evaluation of a training program to foster the use
of written drug information in community pharma-
cies. Part 2: Evaluation Pharm Educ 2007;7:141–149.
24. Newnham GM, Burns WI, Snyder RD, et al. Atti-
tudes of oncology health professionals to informa-
tion from the Internet and other media. Med J Aust
Aug 15, 2005;183:197–200.
25. Parker MH, Cartwright CM, Williams GM. Impact
of specialty on attitudes of Australian medical

13Hamrosi et al. / Research in Social and Administrative Pharmacy j (2013) 1–14
practitioners to end-of-life decisions.Med J AustApr
21 2008;188:450–456.
26. Dillman DA, Smyth JD, Christian LM. Internet,
Mail andMixed-mode Surveys: The Tailored Design
Method. In: Hoboken NJ, ed. 3rd ed. Wiley & Sons;
2009.
27. Aslani P, Hamrosi K, Feletto E, et al. Investigating
Consumer Medicine Information (CMI) Report.
CMI Effectiveness Tender, http://www.guild.org.au/
sites/The_Guild/tab-Pharmacy_Services_and_Programs/
Research_and_Development/Fourth%20Agreement/
Investigating%20Consumer%20Medicine%20Infor
mation%20(I-CMI)%20Project.page.
28. Koo MM, Krass I, Aslani P. Evaluation of written
medicine information: validation of the consumer in-
formation rating form. Ann Pharmacother Jun 2007;
41(6):951–956.
29. Hosmer DK, Lemeshow S. Applied Logisitic Regres-
sion. 2nd ed. New York: Wiley-Interscience; 2000.
30. Australian Bureau of Statistics. Population by Age
and Sex, Australian States and Territories, June
2008, 2008. Accessed from: http://www.abs.gov.au/
AUSSTATS/[email protected]/allprimarymainfeatures/2DB
211BA9B6E1A25CA2576860017C2F8?opendocument.
31. Australian Bureau of Statistics. Education andWork,
Australia May 2008, 2008. Accessed from: http://
www.ausstats.abs.gov.au/ausstats/subscriber.nsf/0/656
CB57FE56C0491CA25750C000EF65B/$File/62270_
may%202008.pdf.
32. Pharmaceutical Health and Rational Use of Medi-
cines Committee (PHARM)Australian Pharmaceu-
tical Advisory Council (APAC). In: Department of
Health and Aged Care, ed.Quality Use of Medicines:
A Decade of Research, Development and Service Ac-
tivity 1991-2001; 2001. Canberra.
33. Myers ED, Calvert EJ. Information, compliance and
side-effects: a study of patients on antidepressant
medication. Br J Clin Pharmacol Jan 1984;17:21–25.
34. Raynor DK, Blenkinsopp A, Knapp P, et al. A sys-
tematic review of quantitative and qualitative
research on the role and effectiveness of written infor-
mation available to patients about individual medi-
cines. Health Technol Assess Feb 2007;11:1–160. iii.
35. LivingstoneCR, PughALG,WinnS,WilliamsonVK.
Developing community pharmacy services wanted by
local people: information and advice about prescrip-
tion medicines. Int J Pharm Pract 1996;4:94–102.
36. Machuca M, Espejo J, Gutierrez L, Machuca MP,
Herrera J. The effect of written information provided
by pharmacists on compliance with antibiotic ther-
apy. Ars Pharmaceutica 2003;44:141–157.
37. Schmitt MR, Miller MJ, Harrison DL, et al.
Communicating non-steroidal anti-inflammatory
drug risks: verbal counseling, written medicine infor-
mation, and patients’ risk awareness. Patient Educ
Couns Jun 2011;83:391–397.
38. Nathan JP, Zerilli T, Cicero LA, Rosenberg JM. Pa-
tients’ use and perception of medication information
leaflets. Ann Pharmacother May 2007;41:777–782.
39. Moorthi C, Saravanakumar RT, Senthil Kumar C,
Manavalan R, Kathiresan K. Systematic assessment
of the quality of patient information leaflets supplied
by the pharmaceutical manufacturers. Pharmacie
Globale 2012;3:1–3.
40. Raynor DK, Knapp P. Do patients see, read and
retain the new mandatory medicines information
leaflets? Pharm J 2000;264:268–270.
41. Dickinson R, Hamrosi K, Knapp P, et al. Suits you?
A qualitative study exploring preferences regarding
the tailoring of consumer medicines information.
Int J Pharm Pract 2013;21:207–215.
42. Hamrosi K, Dickinson R, Knapp P, et al. It’s for
your benefit: exploring patients’ opinions about the
inclusion of textual and numerical benefit informa-
tion in medicine leaflets. Int J Pharm Pract 2013;21:
216–225.
43. RaynorDK, Savage I, Knapp P,Henley J.We are the
experts: people with asthma talk about their medicine
information needs. Patient Educ CounsMay 2004;53:
167–174.
44. Morris LA, Halperin JA. Effects of written drug in-
formation on patient knowledge and compliance: a
literature review. Am J Public Health Jan 1979;69:
47–52.
45. Pharmaceutical Society of Australia. Guidelines
for Pharmacists on Providing Medicines Information
to Patients. Pharmacy PracticeHandbook. PSA; 2000.
46. Vander Stichele RH, De Potter B, Vyncke P,
Bogaert MG. Attitude of physicians toward patient
package insers for medication information in
Belgium. Patient Educ Couns 1996;28:5–13.
47. Bandesha G, Raynor DK, Teale C. Preliminary
investigation of patient information leaflets as pack-
age inserts. Int J Pharm Pract 1996;4:246–248.
48. Rollins BL, Sullivan DL. Evaluating consumer
understanding of two patient instructions for use in-
serts provided by manufacturers.Drug Inf J 2005;39:
43–51.

14 Hamrosi et al. / Research in Social and Administrative Pharmacy j (2013) 1–14
ARTICLE SYNOPSIS
Written medicine information is an importantaspect of patient education. This quantitative studyusing structured questionnaires examined and
comparedawareness, use andprovisionofConsumerMedicine Information (CMI) by consumers, phar-macists and general practitioners. Many consumers
and the majority of healthcare professionals wereaware of CMI. Reasons for providing or notproviding CMI varied and readership of CMI were
associatedwith a number of factors including gender,CMI type and delivery frequency. Strategies to sup-port consumers and address professionals concernsmay facilitateCMIprovision in practice and improve
its utilization as an information-sharing tool.


![Welcome! [kansaspharmacistsassociation.wildapricot.org] · Program Summary 4 •Whether you are a student pharmacist or seasoned practitioner, preparing for a job or residency interview](https://img.pdfslide.us/doc/110x75/5dd090f5d6be591ccb619c89/welcome-kansasph-program-summary-4-awhether-you-are-a-student-pharmacist-or.jpg)