Embed Size (px)
DESCRIPTION
Hello
Citation preview

5 5 For updated information, please visit www.ibef.org MARKET OVERVIEW AND TRENDS
Evolution of the Indian pharmaceutical sector
Pharmaceuticals
• Indian companies increasingly launch operations in foreign countries
• India a major destination for generic drug manufacture
• Higher spending on R&D due to the introduction of product patents
• Liberalised market • Domestic players
expand aggressively
• Increased propensity for R&D
• Indian Patent Act passed in 1970
• Several domestic companies start operations
• Development of production infrastructure
• Export initiatives taken
• Market dominated by foreign companies, with little domestic participation
2005 onwards
1990-2005
1970-1990
Before 1970
MARCH
2013
11 11 For updated information, please visit www.ibef.org MARKET OVERVIEW AND TRENDS
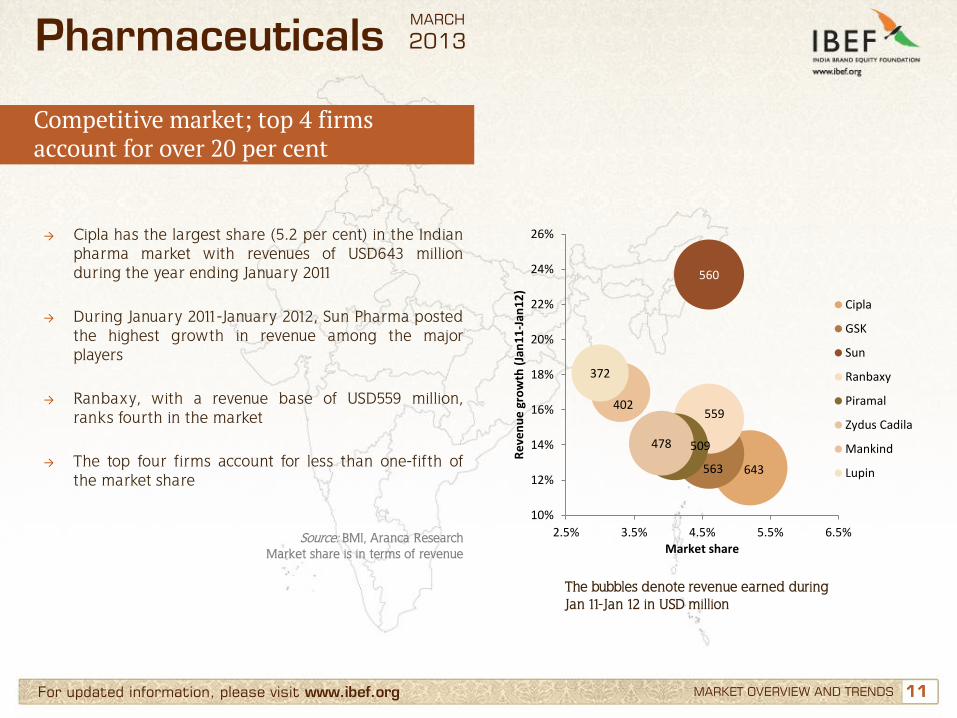
→ Cipla has the largest share (5.2 per cent) in the Indian pharma market with revenues of USD643 million during the year ending January 2011
→ During January 2011-January 2012, Sun Pharma posted the highest growth in revenue among the major players
→ Ranbaxy, with a revenue base of USD559 million, ranks fourth in the market
→ The top four firms account for less than one-fifth of the market share
Source: BMI, Aranca Research Market share is in terms of revenue
Pharmaceuticals
643 563
560
559
509 478
402
372
10%
12%
14%
16%
18%
20%
22%
24%
26%
2.5% 3.5% 4.5% 5.5% 6.5%R
eve
nu
e g
row
th (
Jan
11
-Jan
12
)
Market share
Cipla
GSK
Sun
Ranbaxy
Piramal
Zydus Cadila
Mankind
Lupin
The bubbles denote revenue earned during Jan 11-Jan 12 in USD million
MARCH
2013
Competitive market; top 4 firms account for over 20 per cent

13 13 For updated information, please visit www.ibef.org MARKET OVERVIEW AND TRENDS
Source: Company websites
Dholka in Gujarat is home to the major manufacturing facility of Cadila. The facility is spread over an area of hundred acres
Wockhardt's facility covers an area of 40,468 sq meters in Baddi, Himachal Pradesh.
Baddi is also home to the formulations manufacturing facility of Cipla
Ranbaxy’s API manufacturing facility at Toansa, Punjab
Piramal’s USFDA approved manufacturing plant in Hyderabad
Glaxo SmithKline has a major facility at Rajahmundry, Andhra Pradesh
Mandideep in Madhya Pradesh is the hub of Lupin’s cephalosporin and ACE -Inhibitors manufacturing.
Cipla has a formulations manufacturing plant at Indore
Lupin has an USFDA approved plant at Tarapur in Maharashtra. The facility forms the core of Lupin's fermentation capabilities
Pharmaceuticals MARCH
2013
States hosting key pharmaceutical ventures

15 15 For updated information, please visit www.ibef.org GROWTH DRIVERS
Pharmaceuticals
Growth drivers
Demand-side drivers
Policy support
Supply-side drivers • Cost advantage
• India a major hub for the manufacture of generics
• Over 120 USFDA-approved facilities
• Accessibility of drugs to greatly improve
• Increasing penetration of health insurance
• Growing number of stress-related diseases due to change in lifestyle
• Reduction in approval time for new facilities
• Focus on specialised pharma education
• Improved accessibility for BPL people
Notes: BPL means Below Poverty Line
MARCH
2013
Sector driven by confluence of demand, capabilities and policy

16 16 For updated information, please visit www.ibef.org GROWTH DRIVERS
Launch of patented drugs
• Following the introduction of product patents, several multinational companies are expected to launch patented drugs in India
• Growth in the number of lifestyle related diseases in India could boost the sale of drugs in this segment
Scope in generics market
• Due to its cost advantage, India has emerged as a major producer of generic drugs with several companies focussing on this sector
• With an expected market size of USD26.1 billion in 2016 vis-à-vis USD11.3 billion in 2011, there is immense potential for growth in India’s generic market
Medical infrastructure
• Pharma companies have increased spending to tap rural markets and develop better medical infrastructure
• Hospitals’ market share is expected to increase from 13.1 per cent in 2009 to 26 per cent in 2020
OTC drugs • Increased penetration of chemists, especially in the rural parts of India would
make OTC drugs easily available
Pharmaceuticals MARCH
2013
Supply-side drivers of Indian pharma industry

17 17 For updated information, please visit www.ibef.org GROWTH DRIVERS
Pharmaceuticals
→ India has over 120 USFDA-approved and 84 UK MHRA - approved manufacturing facilities
→ These facilities significantly support the companies involved in CRAMS
Number of USFDA-approved facilities in different countries
Notes: USFDA is United States Food and Drug Administration CRAMS is Contract Research and Medical Services
120
55
27
25
10
8
5
India
Italy
China
Spain
Taiwan
Israel
Hungary
Source: BMI, Aranca Research
MARCH
2013
Competency and cost efficiency continue to be India’s forte … (1/2)
18 18 For updated information, please visit www.ibef.org GROWTH DRIVERS
Pharmaceuticals
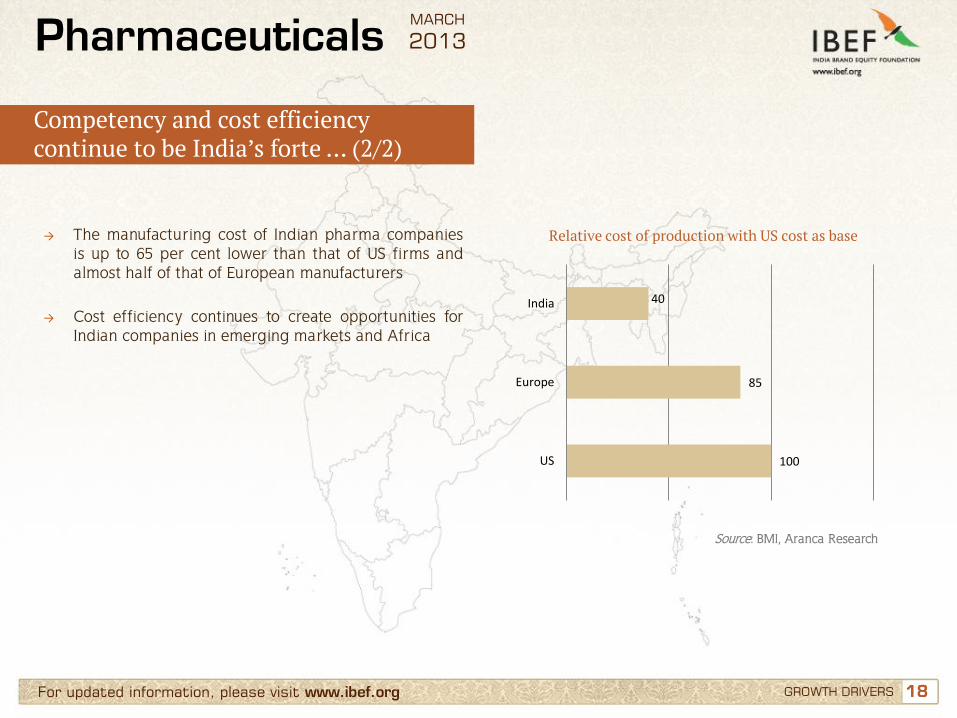
→ The manufacturing cost of Indian pharma companies is up to 65 per cent lower than that of US firms and almost half of that of European manufacturers
→ Cost efficiency continues to create opportunities for Indian companies in emerging markets and Africa
Relative cost of production with US cost as base
Source: BMI, Aranca Research
100
85
40
US
Europe
India
MARCH
2013
Competency and cost efficiency continue to be India’s forte … (2/2)

19 19 For updated information, please visit www.ibef.org GROWTH DRIVERS
Pharmaceuticals
Demand drivers
Accessibility
• Over USD200 billion to be spent on medical infrastructure in the next decade
• New business models expected to penetrate tier-2 and 3 cities
• Over 160,000 hospital beds expected to be added each year in the next decade
Acceptability
• Rising levels of education to increase the acceptability of pharmaceuticals
• Patients to show greater propensity to self medicate, boosting the OTC market
• Acceptance of biologics and preventive medicines to rise
• Vaccine market could grow 20 per cent per year in the next decade
Affordability • Rising income could drive 73 million households to the
middle class over the next ten years
• Over 650 million people expected to be covered by health insurance by 2020
• Government-sponsored programmes set to provide health benefits to over 380 million BPL people by 2017
• By 2017, the government also plans to provide free generic medicines to half the population at an estimated cost of USD 5.4 billion
Epidemiological factors
• Patient pool expected to increase over 20 per cent in the next ten years mainly due to a rise in population
• Newer diseases and changes in lifestyle to boost demand
Source: Mckinsey pharma report 2020, Aranca Research
MARCH
2013
Demand drivers of Indian pharma industry

20 20 For updated information, please visit www.ibef.org GROWTH DRIVERS
Pharmaceuticals
→ From 18.9 per cent of healthcare expenditure in 2008, pharmaceuticals sales is likely to increase to 27 per cent of total spending on healthcare by 2016
Pharmaceutical sales as a per cent of healthcare expenditure
Source: BMI, Aranca Research Notes: F - Forecast
18.9 20.9 21.2 21.8 22.6
23.6 24.7
25.8 27.0
2008 2009 2010 2011 2012F 2013F 2014F 2015F 2016F
MARCH
2013
Anticipated steep growth in expenditure on pharmaceuticals

21 21 For updated information, please visit www.ibef.org GROWTH DRIVERS
Pharmaceuticals
→ Growing per capita sales of pharmaceuticals in India offers ample opportunities for players in this market
Per capita sales of pharmaceuticals (USD billion)
Source: BMI, Aranca Research
8.1 9.3
11.3 12.6 13.9
16.3
19.3
22.9
27.1
2008 2009 2010 2011 2012F 2013F 2014F 2015F 2016F
MARCH
2013
Growing per capita sales of pharmaceuticals

22 22 For updated information, please visit www.ibef.org GROWTH DRIVERS
Pharmaceuticals
Reduction in approval time for new facilities
• Steps taken to reduce approval time for new facilities
• NOC for export license issued in two weeks compared to 12 weeks earlier
Collaborations • MOUs with USFDA, WHO, Health Canada, etc. to boost growth of the Indian
Pharma sector by benefiting from their expertise
Support for technology upgrades
and FDIs
• Zero duty for technology upgrades in the pharmaceutical sector through the Export Promotion Capital Goods (EPCG) Scheme
• Government is planning to relax FDI norms in the pharmaceuticals sector
Industry infrastructure
• Government of India plans to set up a USD640 million VC fund to boost drug discovery and strengthen the pharma infrastructure
Pharma vision 2020 • Pharma Vision 2020 by the government’s Department of Pharmaceuticals aims to make India a major hub for end-to-end drug discovery
Notes: NOC - No objection certificate; VC - Venture Capital MOU - Memorandum of Understanding
MARCH
2013
Favourable policy measures support growth

23 23 For updated information, please visit www.ibef.org GROWTH DRIVERS
Pharmaceuticals
→ Government spending on healthcare expanded at a CAGR of 18 per cent during 2005-09
→ Increased government expenditure on healthcare could create an over USD4.5 billion market for pharmaceuticals in the next few years
Government spending on healthcare (USD billion)
Source: Mckinsey estimates, Aranca Research
4.9 5.6 6.4 8.4
1.8 2.1
2.8
3.3
FY06 FY07 FY08 FY09
State Central
Share of GDP 0.84% 0.84% 0.88% 0.93%
CAGR: 18.0%
MARCH
2013
Government-led initiatives aim at better availability of drugs … (1/2)

24 24 For updated information, please visit www.ibef.org GROWTH DRIVERS
Pharmaceuticals
→ Penetration of health insurance is expected to more than double by 2020
→ Increasing penetration of health insurance is likely to be driven by government-sponsored initiatives such as RSBY and ESIC
Population covered by health insurance (in million)
Source: Mckinsey estimates, Aranca Research
265
525
35
130
2010 2020F
Government-sponsored Insurance Private Insurance
Note: RSBY stands for Rashtriya Swastha Bima Yojna, ESIC stands for Employees State Insurance Corporation
MARCH
2013
Government-led initiatives aim at better availability of drugs … (2/2)