Embed Size (px)
Citation preview

1
Vodafone Group PlcInterim Results & Strategy Update
For the 6 months ended 30 September 2010
1
9 November 2010
Disclaimer
Information in the following presentation relating to the price at which relevant investments have been bought or sold in the past or the yield on such investments cannot be relied upon as a guide to the future performance of such investments. These presentations do not constitute an offering of securities or otherwise constitute an invitation or inducement to any person to underwrite, subscribe for or otherwise acquire or dispose of securities in any company within the Group.
This presentation contains forward-looking statements within the meaning of the US Private Securities Litigation Reform Act of 1995 which are subject to risks and uncertainties because they relate to future events. These forward-looking statements include, without limitation, statements in relation to the Group’s projected financial results for the 2011 financial year. Some of the factors which may cause actual results to differ from these forward-looking statements are discussed in the last slide of this presentation.
The presentation also contains certain non-GAAP financial information. The Group’s management believes these measures provide valuable additional information in understanding the performance of the Group or the Group’s businesses because they provide measures used by the Group to assess performance. However, this additional information presented is not uniformly defined by all companies, including those in the Group’s industry. Accordingly, it may not be comparable with similarly titled measures and disclosures by other companies. Additionally, although these measures are important in the management of the business, they should not be viewed in isolation or as replacements for or alternatives to, but rather as complementary to, the comparable GAAP measures.
Vodafone, the Vodafone logo, Vodacom, Vodafone One Net and M-PESA are trade marks of the Vodafone Group. Other product and company names mentioned herein may be the trade marks of their respective owners.
2

2
3
Highlights
Q2 Group organic service revenue +2.3% - improved trends in each region
Strategy for sustainable growth and returns
Accelerated realisation of SoftBank interests for £3.1billion
FY 10/11 adjusted operating profit guidance increased to £11.8 - £12.2 billion
Interim dividend per share +7.1% to 2.85p
China Mobile stake sold for £4.3bn; share buy back underway
Financial Performance
H1 10/11
4

3
Financial highlights: H1 10/11
£m
H1 YoY
organic
growth
(%)
Q2 vs. Q1
YoY organic
growth
ppts
Group service revenue 21,229 +1.7 +1.2
Europe 13,545 (1.3) +0.9
Africa & Central Europe 4,165 +4.8 +2.1
Asia Pacific & Middle East 3,572 +11.4 +1.7
Group EBITDA 7,363 (2.8)
Adjusted operating profit 6,069 +0.7
Capex 2,435 (6.4)
Free cash flow 3,489 (12.8)
EPS 14.31p 56.1
Adjusted EPS 8.76p 0.5
Interim dividend per share 2.85p 7.1
All growths shown are organic except capex. free cash flow, EPS, adjusted EPS and interim dividend per share5
-2.9
(1.3)
(0.6)
1.1
2.3
Revenue trend continues to improve
All growths shown are organic
1. Adjusted for IFRIC 13 ‘Customer Loyalty Programmes’. Reported growth was -3.0% in Q2 09/10, -1.2% in Q3 09/10 and -0.2% in Q4 09/10
Q2 09/10 Q4 09/10Q3 09/10 Q1 10/11 Q2 10/11
Vodafone Group service revenue growth1 (%)
(2.9)
6

4
…across all regions
All growths shown are organic
1. Adjusted for IFRIC 13 ‘Customer Loyalty Programmes’. Reported growth was -4.6% in Q2 09/10 and -1.7% in Q4 09/10
Africa & Central Europe - Service revenue growth (%)
Q2
09/10
Q4
09/10
Q3
09/10
Q1
10/11
Q2
10/11
(3.9)
(0.5)
2.43.7
5.8
Q2 09/10 Q3 09/10 Q4 09/10 Q1 10/11 Q2 10/11
10.3 10.4
5.0
10.512.2
Asia Pacific & Middle East - Service revenue growth (%)
Q2
09/10
Q4
09/10
Q3
09/10
Q1
10/11
Q2
10/11
Europe1- Service revenue growth (%)
Q2
09/10
Q4
09/10
Q3
09/10
Q1
10/11
Q2
10/11
(4.4)
(3.2)
(2.4)(1.7)
(0.8)
7
Data & emerging economies: central to our success
Group data revenue growth (%)
1. Service revenue: Europe, Eastern Europe (excluding Turkey) Australia & New Zealand
2. Service revenue: Turkey, Vodacom, India, Egypt, Ghana & Qatar
• Data growth accelerated in H1 10/11
• Rebalancing the Group revenue mix
• Good progress towards FY 12/13 targets
Q2
09/10
Q4
09/10
Q3
09/10
Q1
10/11
Q2
10/11
20.117.7
20.3
25.4 25.9
51
27
22
44
29
27
49 56
H1 09/10 H1 10/11
Mature economies1 voice
Mature economies1 data, fixed & other
Emerging economies2
Increasing contribution beyond mature voice1, 2 (%)
3237
50
1016
35
Data users and smartphone penetration2 (%)
Q2
09/10
Q2
10/11
Target
FY 12/13
Europe smartphone penetration
Europe data users penetration
8

5
Emerging economies increasing contribution to EBITDA
• Emerging economies EBITDA improvements mitigate margin pressure in Europe
• H1 Europe & Common Functions operating costs1 reduced by 3.4% compared to a service revenue decline of 1.3%
H1 09/10 Europe & Common
Functions
Africa &
Central Europe
Asia Pacific &
Middle East
H1 10/11
7.5 (0.4)
0.10.1
0.1
FX & M&A
7.4
Group - EBITDA (£bn)
All growths shown are organic
1. Operating costs = operating expenses + commercial costs excluding acquisition & retention costs9
Strengthening trends in Germany
All growths shown are organic
1. EBITDA margin is H1 EBITDA margin, all other financials presented are Q2 10/11
(4.9)
(2.8)
(1.6)
0.2
2.1
Q2
09/10
Q4
09/10
Q3
09/10
Q1
10/11
Q2
10/11
Germany - Service revenue growth (%)
Fixed broadband
+2%
EBITDA margin1
38.1%
Data
+27%
• Commercial investment driving service revenue:
– Increased penetration of high value customers
– Mobile ARPU +1.3%
• Strong data growth: 13% smartphone penetration,
62% data attach rate
• Enterprise +4.6% with higher smartphone penetration
and increased usage
• 570 FTE reduction and 650 FTE to be outsourced
• LTE rollout: 1,500 base stations by March 2011
10

6
Strong recovery in the UK
• Service revenue growth from customer adds and ARPU
improvement
• Data growth driven by mobile internet: 19% smartphone
penetration, 59% data attach rate
• 1 million contract net adds in 12 months
• New prepaid pricing plan launched “Top up and get…”
• Stable margin: higher revenue and operating cost
efficiencies funded commercial investment
EBITDA margin1
23.1%
Contract net adds
+281k
Data
+27%
(6.6)
(4.9)
(2.6)
0.7
5.2
UK - Service revenue growth (%)
Q2
09/10
Q4
09/10
Q3
09/10
Q1
10/11
Q2
10/11
11
All growths shown are organic
1. EBITDA margin is H1 EBITDA margin, all other financials presented are Q2 10/11
Improvement in revenue trend in Italy
• Service revenue improvement due to messaging,
mobile internet and Enterprise
• Successful summer campaigns: >9 million customers
• Data growth driven by mobile internet:
17% smartphone penetration, 23% data attach rate
• Fixed broadband growth driven by strong acquisitions:
Q2 76k net adds, Q1 leading net adds market share
• Cost efficiencies protecting EBITDA margin despite
competitive pressure
• New 1 euro cent pricing plan (Sept)
1.4
0.7
0.1
(2.5)
(1.3)
Italy - Service revenue growth (%)
Q2
09/10
Q4
09/10
Q3
09/10
Q1
10/11
Q2
10/11
Fixed broadband
+35%
Data
+22%
EBITDA margin1
47.5%
12
All growths shown are organic
1. EBITDA margin is H1 EBITDA margin, all other financials presented are Q2 10/11

7
Challenging market conditions in Spain
• Significant voice and roaming revenue pressure
• Prepaid net adds +279k
• New prepaid price plans (June); iPhone (July);
new contract price plans (Oct)
• Fixed broadband: strong customer growth (+34%),
competitive pricing pressure
• EBITDA margin impacted by reduced revenue
All growths shown are organic
1. EBITDA margin is H1 EBITDA margin, all other financials presented are Q2 10/11
2. Reported service revenue decline of 6.2% adjusted for contract settlement in Q1 09/10
(6.9) (6.8)(6.2)
(5.4)2
(7.9)
Spain - Service revenue growth (%)
Q2
09/10
Q4
09/10
Q3
09/10
Q1
10/11
Q2
10/11
Data
+17%
Fixed broadband
+3%
EBITDA margin1
33.2%
13
• Continued service revenue momentum: +43%
excluding MTRs
• Improving customer mix: contract base 3.6m
• Improved ARPU: +21%
• Enterprise revenue +47%; new enterprise portfolio and
Borusan synergies
• EBITDA positive from revenue growth and cost control
• Network enhancement with money back guarantee
campaign and “mobile internet for everyone” strategy
• 5,100 3G sites now operational
Building a solid foundation for the future in Turkey
All growths shown are organic
1. EBITDA margin is H1 EBITDA margin, all other financials presented are Q2 10/11
(4.8)
12.9
31.3
23.7
29.5
Turkey - Service revenue growth (%)
Q2
09/10
Q4
09/10
Q3
09/10
Q1
10/11
Q2
10/11
Data
+99%
Revenue market
share 25.1%
EBITDA margin1
12.2%
14

8
South Africa:
• Service revenue growth +4.4%
• Outgoing revenues +5% supported by commercial
investment and new value offerings
• 712k net adds; contract customers now 20% of base
• High demand for broadband: 38% market share3
International:
• Customer growth sustained and revenue recovering
Vodacom makes excellent progress in data
All growths shown are organic
1. Represents Vodacom Group, EBITDA margin is H1 EBITDA margin, all other financials presented are Q2 10/11
2. Organic data revenue growth of 39% adjusted to exclude the impact of changes in the data carry-over rule
3. Broadband device market share, source: Screen Digest 2010 and Vodacom
3.2
5.5
4.64.0
5.0
Vodacom Group - Service revenue growth1 (%)
Q2
09/10
Q4
09/10
Q3
09/10
Q1
10/11
Q2
10/11
Data1, 2
+41%
Mobile connect cards
916k (+46%)
EBITDA margin1
33.2%
15
India shows strong performance
Q2
09/10
Q3
09/10
Q4
09/10
Q1
10/11
Q2
10/11
18.0
13.8
6.5
13.715.7
India - Service revenue growth (%) • 19% revenue market share up 1.6pps year on year
• Market prices stabilising
• Data revenue +26%
• EBITDA margin1 26.0% due to cost efficiencies
• Operating free cash flow positive
• Indus Towers: strong operational and financial results
• 3G service commencing Q4 10/11, currently exploring
3G roaming agreements
3G auction - Targeted investment
9 circles cover 66% of revenue and >50% of India GDP
All growths shown are organic
1. EBITDA margin is H1 EBITDA margin
India - Pricing trends stabilising
Outgoing price per minute (Rs)
Q3
08/09
Q4
08/09
Q1
09/10
Q2
09/10
Q3
09/10
Q4
09/10
Q1
10/11
Q2
10/11
0.95 0.95 0.910.85
0.770.69 0.67 0.65
16

9
3.6
2.4
3.9
3.2 3.0
EBITDA
5.8
4.7
5.6 5.7
6.6
Verizon Wireless continues to deliver strong results
VZW - Service revenue growth2 (%)
VZW - Free cash flow4 (US$bn)
All growths shown are organic unless otherwise stated
1. Financial highlights reported on a 100% IFRS basis, except data growth
2. Organic revenue growth excludes divested properties
3. EBITDA margin is H1 EDITDA margin
4. Reported in the Cellco Partnership, being the net cash provided by operating activities, less capital expenditures and distributions to partners
Q2
09/10
Q4
09/10
Q3
09/10
Q1
10/11
Q2
10/11
Q2
09/10
Q4
09/10
Q3
09/10
Q1
10/11
Q2
10/11
36.5 36.5 36.6 36.6 36.3
Q2
09/10
Q4
09/10
Q3
09/10
Q1
10/11
Q2
10/11
• Data +26%1: smartphone penetration 23%
• EBITDA margin 40.0%3: strong execution, growing
data revenues, Alltel synergies
• LTE rollout: 110m pops covered by end 2010
• Net debt US$14.3bn at 30 September
VZW - Revenue market share (%) (4 largest operators)
17
Low finance costs
H1 10/11
£m
H1 09/10
£m
Underlying net financing costs (582) (512)
Mark to market losses (5) (47)
Dividends from investments 201 237
Potential interest on tax (54) (108)
Adjusted net financing costs (440) (430)
Average cost of debt (%) 4.0 4.0
18 1. Nomura research14 October 2010
• Lowest financing rate amongst European peers1
• Reported net financing costs include CFC settlement provision releases of £0.9bn

10
Adjusted effective tax rate
• Adjusted effective tax rate expected to remain in the mid 20s for the medium term
• Reported income tax expense includes CFC settlement provision release of £0.6bn
H1 10/11
%
H1 09/10
%
Underlying adjusted effective tax rate 22.9 24.5
Reversal of potential interest on tax and tax provisions - (3.0)
Adjusted effective tax rate 22.9 21.5
19
Strong free cash flow supports dividend and low
single A credit rating
• H1 capex lower due to Indian import controls
• H1 free cash flow per share: 6.62p
• FY 10/11 guidance reiterated: free cash flow >£6.5bn
3.5
FCF
H1 09/10
Deferred
dividends
Restated FCF
H1 09/10
EBITDA Working
capital
Capex Verizon
dividend
Other
dividends
FCF
H1 10/11
20
(£bn)
Tax
paid
4.0 (0.3)
3.7 (0.1)(0.2)
0.1 (0.2)0.3 (0.2)
0.1
Interest

11
Net debt
• Licences and spectrum reflect German and Indian auctions
• £2.8bn China Mobile proceeds committed to share buy back, £0.1bn bought back at 30 Sept
• Closing net debt of £30.5bn includes £3.2bn Essar put options
• Accelerated realisation of SoftBank interests for £3.1bn announced today
Net Debt at
31 Mar 10
Licences &
Spectrum
M&A Share
Buy Back
China
Mobile
Proceeds
Free Cash
Flow
FX &
Other
Net Debt at
30 Sep 10
33.3
2.9 0.2
0.1 (4.3)
(3.5)
(1.2)30.5
Dividends
Paid
3.0
21
(£bn)
Results lead to profit guidance upgrade
£11.2bn - £12.0bnAdjusted operating profit
£11.8bn - £12.2bn
Revenue EBITDA margin Capex
FY 10/11 May Guidance
22
H1 10/11 Performance
Return to low-level
revenue growth
Decline significantly
lower rate than
prior year
Similar to
prior year
+1.7% service
revenue growth
Decline reduced by
0.5pps vs. FY 09/10£2.4bn capex

12
23
Creating value: driving performance and returns
Q2 service revenue: +2.3%, data revenue +26%
Controlling costs: 3.4% reduction in Europe and Common Functions
Strong free cash flow: £3.5bn
Disposal of China Mobile, SoftBank
Increased profit guidance: £11.8bn - £12.2bn
£2.8bn share buy back and 7.1% growth in interim dividend per share
Strategy Update
24

13
25
1. Revenue market share gain since Nov 2008
2. Annualised Q2 10/11 revenue. CAGR from Q2 08/09 to Q2 10/11
3. Fixed line revenue
Execution of 2008 strategy has made Vodafone
stronger
Drive operational
performance• Revenue market share gains: in a majority of our markets1; trends improving
• Cost reduction programme: on track
Pursue growth
in total
communications
• Mobile data: £5.0bn revenue +23% CAGR; 60m customers2
• Enterprise: Return to revenue growth; VGE performing well
• Fixed broadband3: £3.3bn revenue +7% CAGR2; 5.8m broadband customers
Focus on FCF
generation • Original £5 - 6bn free cash flow target: exceeded and upgraded
Execute in
emerging markets
• India: gained #2 revenue market share
• South Africa: maintained #1 revenue market share
• Turkey: turnaround executed, now building profitability
Strengthen
capital discipline
• Dividend per share: +12% since Nov 2008
• China Mobile: disposal raised £4.3bn
• Buy backs: £2.8bn buy back programme
• Australia JV: on track and creating value
26
1. Adjusted for IFRIC 13 ‘Customer Loyalty Programmes’. Reported growth was -3.0% in Q2 09/10, -1.2% in Q3 09/10 and -0.2% in Q4 09/10
2. Based on financial guidance, assumes 7% growth in dividends per share and completion of £2.8bn buy back programme
We returned to growth while delivering robust FCF
and higher shareholder returns
Organic service revenue1 growth (%)
1.6
0.2
(0.3)
(2.7)
(2.1)
(2.9)
(1.3)
(0.6)
1.1
2.3
Q1 Q2 Q3 Q4 Q1 Q2 Q3 Q4 Q1 Q2
FY 08/09 FY 09/10 FY 10/11
Free cash flow and shareholder returns (£bn)
4.0 4.14.5
1.0
2.85.7
5.0
7.2
4.1
>6.5
7.32
DividendsFCF Buy back
26
FY 08/09 FY 09/10 FY 10/11(e)

14
£7.2bn
What is Vodafone today?
Controlled
Value FCF2
c. £11bn
55-60% EVc.£6bn
VZW
OtherVZW/SFR c.£1bn
Proportionate
VZW/SFR
Non-
Controlled
1. Based on Median of Analysts’ Sum of the Parts analysis as at Sep-2010
2. Free cash flow figures for FY 09/10
3. Includes fully and joint controlled operations and excludes Vodafone Investments (Verizon Wireless, SFR, Poland)
4. Europe service revenue
5. Group service revenue
• 27 controlled operations3
– c.70% consumer / 30% enterprise4
– c.70% mature / 30% emerging5
– #1 or #2 positions in 22 markets
• Emerging markets’ OpFCF turning positive
• Achieved turnarounds: Turkey, UK, Aus, Ghana
• Strong proportionate cash generationfrom SFR and VZW
• But current low cash returns to Vodafone c. £1.0bn
27
SFR
Proportionate FCF2
2010 Strategy update: a more valuable Vodafone
A growth strategy
from data
Value & efficiency from
scale
Asset / portfolio
strategy
Capital discipline
and
financial objectives
• Mobile data: accelerate across footprint
• Enterprise: exploit opportunity across footprint
• New services: deliver growth opportunities
• Total Communications: continue to develop services in Europe
• Emerging markets: drive penetration and data adoption
• Continue to enhance efficiency and realise scale benefits
• Generate liquidity or free cash flow from all non-controlled assets
• Profitable investment and shareholder returns
• Continue to apply rigorous investment criteria to deployment
of surplus capital and regular assessment of all assets
Leadership focus • Europe, Africa, India
28

15
29
New organisation aligned to strategy…
29
Achieve regional leadership & growth
Note: Vodafone will report on the basis of the new organisation structure for the second half of FY 10/11
1. Africa, Middle East and Asia Pacific
CEO
Vittorio Colao
Europe
Michel Combes
AMAP1
Nick Read
Technology
Steve Pusey
Commercial
Morten LundalInvestments
Enable growth and maximise scale benefits / innovation
Maximise value /liquidity or cash flow
Flatter organisation structure, simpler Group architecture,
increased ownership, aligned incentives
CFO
Andy Halford
30
Group Growth
Strategy
30
Mobile data
Enterprise
New services
Emerging markets
Total
communications

16
Mobile data will drive global telecoms growth
2010e -14e global telecoms revenue / change
2014 Revenue $295bn $626bn $281bn $337bn
Selective
expansion
Existing
presence
Strategic
focus
Fixed data
$(70)bn
$24bn$49bn
$138bn
Fixed voice
Mobile voice Mobile data
3131 Source: IDC Worldwide Black Book 2010
1. Peak downlink speeds
Mobile data demand is being accelerated by devices,
network and service improvements
32
8% 20%Increased smartphone share of industry
handset shipments
Wider range of smart devices
1.8 Mbps1 43.2 Mbps1Greater peak speeds
Increased app range and functionality
32
20102006

17
33
Europe1
United States
Africa
India
• $57bn mobile data market
• Vodafone: 35m data users
– 37% data penetration
• $3bn mobile data market
• Vodafone: 5m data users
– 6% data penetration
• $8bn mobile data market
• Vodafone: 12m data users3
– 26% data penetration
• $59bn mobile data market
• Verizon Wireless: 25m data users
– 30% data penetration2
Mobile data is a global opportunity
Source: IDC (Sep 2010)
1. Europe data market includes Turkey
2. Verizon Wireless data penetration refers to data users / retail postpaid customers
3. Vodafone data refers to Egypt and South Africa
Vodafone data penetration refers to active data users /active customers
Technology
Pricing
Customer experience
Devices
“Supermobile”: acceleration of mobile data growth
opportunity
34
Delivering data growth earlier and more profitably
Best experience
Ability to optimise spending and usage
Redesigned for data
All leading products

18
Customer
expectationsHigh speed
capability
Broad data
coverage
“Supermobile”: strong network position in Europe
thanks to significant 3G investment
35
Average utilisation 34%2
Peak usage locations 7%3
65% at ≥ 14.4 Mbps1
>80% at ≥ 7.2 Mbps1
50,000 3G sites
80-90% 3G coverage
Vodafone
network
Excellent network quality with good capacity management
Note: All figures relate to Europe, unless otherwise stated.
1. Share of 3G footprint at stated peak downlink speeds
2. Average peak hour utilisation
3. Base station sites with over 90% peak hour utilisation
Reliability &
quality
“Supermobile”: our European data network leads in
performance
36
Source: Vodafone commissioned independent drive-by tests on data user speeds (June/July 2010) in Europe; excludes, Ireland, Malta and Albania
Note: All figures relate to Europe, unless otherwise stated.
3.2 Mbps
UplinkDownlink
2.8 Mbps
Vodafone’s major European markets average
Best competitor European market average
1.3 Mbps
1.2 Mbps
Average user speeds in Vodafone European network Leading European data performance
• Germany
• Italy
• UK
• Spain
• Portugal
• Greece
• Netherlands (on par)

19
“Supermobile”: we will invest in quality and speed to
maintain our advantage
37 Note: All figures relate to Europe, unless otherwise stated
Improve customer experience
Increase coverage• Continued site deployment
• Femto/WiFi offload• Secure preferred spectrum
Improve customer experience• HSPA upgrades
• LTE rollout started in Germany• High capacity backhaul upgrades
Improve cost efficiency• Yield management capability
• Network sharing• Energy efficiency, e.g. single RAN
• Regional consolidation
Extend our
#1 position
# 3G base
station sites
% of 3G
network
at ≥ 14.4 Mbps
Unit cost to
carry data
65% 100%
50,000 >70,000
Targets
FY 12/13H1 10/11
30%
reduction-
<200 MB 200 MB - 1 GB >1 GB
17%
29%
54%
75%
19%
6%
% of traffic % of customers
Tiered data plans: benefitsFixed price plans: limitations
“Supermobile”: tiered data pricing in Europe
38 1. Average monthly data usage in a selected European operating country
• ‘Fair’ usage limits create uncertainty
• Benefits the few high users that
account for the majority of traffic
• Encourages data adoption by low / occasional users
• Optimises the use of data capacity and favours upgrades
• Launched in Germany, UK, Netherlands, Portugal and Ireland
• Remaining European markets by end FY 10/11
Tiered data plans: examples Handset data usage: example1
Smartphones (UK)
£15
£25
£40
£60
250 MB 750 MB500 MB 1 GB
Mobile Broadband (NL)
€20€30
€50
500 MB 5 GB3 GB
1 mbps 28.8 mbps7.2 mbpsSpeed

20
“Supermobile”: a better mobile data experience with
Vodafone
39
• 5,000 stores in Europe
• Service and assistance
centre
• New store formats
Customer experience and support systems re-designed for data
Retail
locations
Specialised
supportBilling Value-added
• 25,000 support staff
• 5,000 data-only customer
care representatives
• Specialised 2nd level support
• Enhanced online experience
• Flexible multi-SIM billing
• CRM infrastructure
enhanced to handle
multi-SIMs and multiple
account members
• 3rd party billing rolled out
in 10 European markets
• Vodafone-specific apps
• Vodafone VIP, reward
programmes
#1 or #2 consumer net promoter score in 19 of 20 markets
* johnmeadephotography c.2010
*
Smartphones and tablets
All leading products
“Supermobile”: multiplicity of connected devices
40
Europe:Q2
09/10
Q2
10/11
FY
12/13
target
Smartphone
penetration10% 16% ≥35%
Smartphone sales
mix20% 32% ≥70%
Prices shown are example retail selling prices
Mobile connectivity
Device innovation43.2Mbps
dongles
Vodafone
Mobile WiFi
Vodafone 3G
StationMobile Broadband
Sharing dock
Entry price handsets
Lower cost smartphones
Accelerates data penetration~€70
Vodafone 553
(social messaging)
~€120
Vodafone 845
(smartphone)
~€40
Vodafone 543
(fashion led)
~€45
Vodafone 546
(low cost smartphone)
21
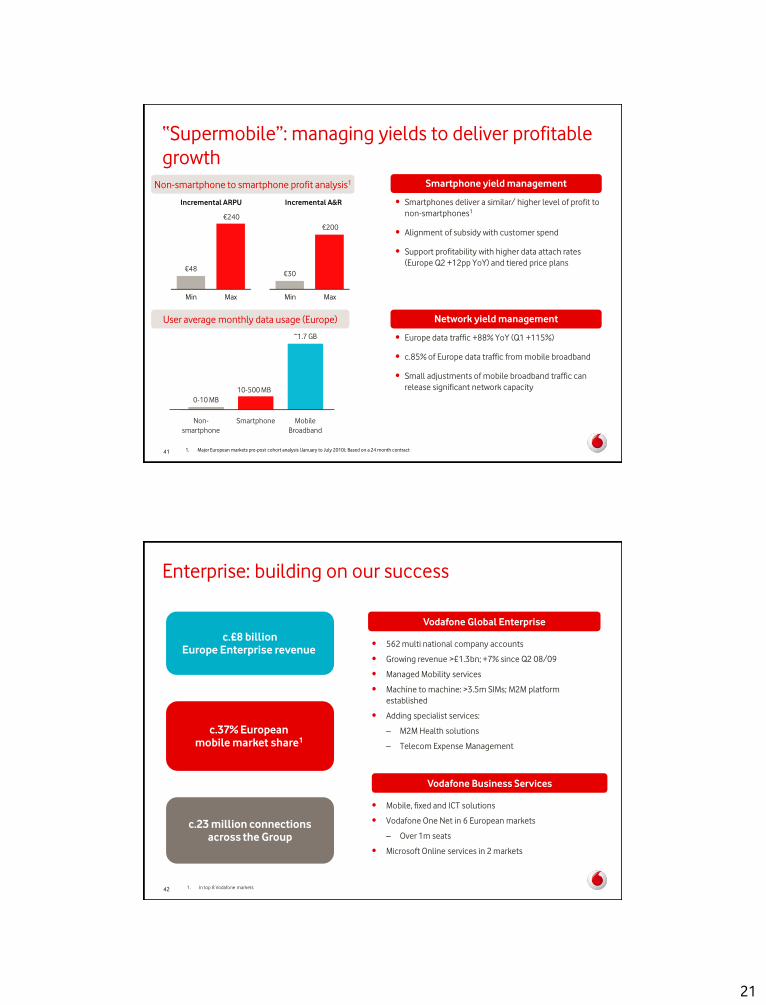
0-10 MB
~1.7 GB
Non-
smartphone
Mobile
Broadband
Smartphone
10-500 MB
Smartphone yield management
• Smartphones deliver a similar/ higher level of profit to
non-smartphones1
• Alignment of subsidy with customer spend
• Support profitability with higher data attach rates
(Europe Q2 +12pp YoY) and tiered price plans
Network yield management
• Europe data traffic +88% YoY (Q1 +115%)
• c.85% of Europe data traffic from mobile broadband
• Small adjustments of mobile broadband traffic can
release significant network capacity
Non-smartphone to smartphone profit analysis1
User average monthly data usage (Europe)
1. Major European markets pre-post cohort analysis (January to July 2010); Based on a 24 month contract41
“Supermobile”: managing yields to deliver profitable
growth
€48
Min
€240
Incremental ARPU
€30
€200
Max Min Max
Incremental A&R
Enterprise: building on our success
• Mobile, fixed and ICT solutions
• Vodafone One Net in 6 European markets
– Over 1m seats
• Microsoft Online services in 2 markets
• 562 multi national company accounts
• Growing revenue >£1.3bn; +7% since Q2 08/09
• Managed Mobility services
• Machine to machine: >3.5m SIMs; M2M platform
established
• Adding specialist services:
– M2M Health solutions
– Telecom Expense Management
42
c.£8 billion
Europe Enterprise revenue
c.37% European
mobile market share1
c.23 million connections
across the Group
Vodafone Business Services
Vodafone Global Enterprise
1. In top 8 Vodafone markets

22
Enterprise: selective expansion in growth segments
43
• Push ‘Managed Mobility’ Service
• Extend to smaller MNCs (VGE ‘light’)
• Extend unified communication
solutions in partnership over time
Multi National Companies
• Unified communications
solutions in partnership with
Cisco
• Grow domestic IP-virtual private
networks
• Network integration skills
Domestic Corporate
• Exploit migration to IP based comms
with ‘Vodafone One Net’
• Third party cloud solutions (IBM
Lotus, Microsoft)
SoHo and SME
Emerging markets: penetration will continue to drive
growth
44
Market customers growth (2010e -14e CAGR)2 (%)
6%7%
18%
South Africa Egypt India
GDP growth (2010e -14e CAGR)1 (%)
5%
10%11%
South Africa Egypt India
Mobile SIM penetration will rise further2
104%
74%60%
130%
93%109%
South Africa Egypt India
Dec 2010e Dec 2014e
1. Source: IMF (Oct 2010) Gross domestic product, current prices (U.S. dollars)
2. Informa WCIS (Nov 2010)

23
Improving revenue market share (%) Driving data from a strong market position
India: applying our growing scale advantage to data
14
16
18
19• #2 revenue market share1
• 82% nationwide coverage
• 1.3m retail points of presence
• Indus Towers world’s largest towerco
• 3G services in Q4 10/11; US$500m capex in next 2 yrs
• Enhance mobile internet experience
– Opera Mini browser, low cost micro unit pricing
– Low end data handsets from €25; mid/high end
€80-120 and falling
• Cost efficient in-country data roaming agreements &
network site sharing
• Expand enterprise services and shape mobile banking
All data / comments refers to Q2 10/11 unless stated
1. Q1 10/1145
Q4 07/08 Q1 08/09 Q1 09/10 Q1 10/11
A very significant mobile opportunity
Population Mobile
market
penetration
Vodafone
smartphone
penetration
Fixed line
market
penetration
Vodafone
data
penetration1.2bn
58%
4% 6% 2%
Vodacom: set to deliver strong data growth
Driving growth from data in South Africa
• #1 operator
• 53% revenue market share
• Data leadership: 38% broadband device share1
• Leading data network: 3,700 3G base station sites
• Wide reach: 28,000 distribution points
• Extend leadership in broadband with value offerings
• Develop converged ICT solutions for Enterprise
• Leverage Group services: M-PESA launched
All data / comments refers to South Africa unless otherwise stated
1. Source: Screen digest 2010 and Vodacom at March 2010
2. Source: BMI technology 201046
Still very low broadband penetration
Fixed and mobile broadband penetration (%)2
2008 2009 2010e 2011e 2012e 2013e 2014e
1.5
4.3
6.48.1
9.510.7
11.7
0.91.1
1.21.2
1.31.4
Q1
09/10
Q3
09/10
Q2
09/10
Q4
09/10
Strong data revenue growth (Rand billion)
Q1
10/11
Q2
10/11
35% average YoY growth

24
Spain
• €3.0bn Fixed broadband market
• 52% Household penetration
• 0.7m Vodafone customers1
Europe: Vodafone’s Total Communications presence
47
Source: IDC (Sep-2010), ScreenDigest (2010)
Note: FX rate $/€ 1.38
1. Broadband subscribers at end Q2 10/11
2. Italy presented on a 100% basis
• €5.2bn Fixed broadband market
• 49% Household penetration
• 1.5m Vodafone customers1
Italy
• €6.1bn Fixed broadband market
• 57% Household penetration
• 3.5m Vodafone customers1
Germany
• Ireland
• Portugal
• Greece
Smaller Markets
Europe: we will address convergence on a market by
market basis
48
Wholesale
Partnership
Acquire
• Needs multiple providers/strong
regulation to drive acceptable
long-term pricing
• Multiple operators share investment
• Competition at service level
• Highly efficient if no alternative providers
• No “region-wide” solutions
• Cost synergies support in-market deals
• Business and financial case must be
compelling
Inc
rea
sin
g A
ss
et
Inte
ns
ity
Capital efficient in-market approach maximises value
• Convergence is happening, but
slowly in consumer segments
• Increasing demand in business
market
• European strategy remains to
obtain long-term access to fast
broadband to service high value
customers…..
• …..in a capital efficient manner

25
New services: executing on growth opportunities
49
Machine to machineSmart metering, car telematics, tracking
Already
underway
3rd party billingPlatform developed for content providers
and software developers
Financial servicesM-PESA - Kenya, Tanzania, Afghanistan, Fiji,
South Africa
Business unit established
c.100 employees
‘Mondrian’ payment system
rolled out in
10 European markets
19 million customers
Further roll-out to begin
Near field communicationsTrials underway in Spain and Germany
Push mobile advertisingEstablish end-to-end advertising platform
New
Areas
High margin revenue
opportunity in established
markets
Access to attractive captive
audiences across all
demographics
Mainly #1/#2 market positions, early-mover in data, positioned to exploit
low data penetration level
Excellent network and technology platforms
Data focused pricing strategies, IT and customer care
Leading position in mobile Enterprise: MNC, SoHo-SME
Attractive emerging markets assets now performing
Market specific approach to Total Communications in Europe
Early investor in M2M and Payments, with an active presence in several markets
A winning growth strategy
50

26
51
Group Scale
Advantage
and Cost Focus
Direct Costs
Technology
Marketing
Procurement
Tax & Treasury
52
1. Europe plus Common Functions
2. Source: Independent Survey 2010 comparison vs. 2009
Savings
delivered by
FY 10/11
Volume/InflationAvailable for
for investment/
margin protection
£0.5bn £(0.2)bn
£0.3bn
Second £1bn programme Key actions for FY 10/11
• Europe operating costs reduced 3.4% YoY in H1 10/111
• Continued network sharing initiatives
• Renegotiation of site rental and maintenance contracts
• Customer management process / volume efficiencies
• India shared service centre
Efficiency improvements relative to benchmark2
Selective investment
4.6%
3.3%
4.7%
3.5%
5.6%
3.3%
Network Sales Marketing
Customer Care
IT Total Europe
Cost efficiency is enabling us to protect margins and
invest in growth

27
Scale: Vodafone continues to generate significant
benefits
53
Network
Terminals
Supply
Chain
Offshore &
Outsource
Tax &
Treasury
• Top quartile cost to carry
– Germany, Italy, Spain, UK
• Top quartile purchaser
• Consistently better prices
– 4% lower than peer group
• World class data centre cost efficiency
• Group effective tax rate of c. 25%
• Average cost of debt 4.0%
Position vs. Competitors
• Passive and active sharing
• Technology standardisation
• Data management techniques / video optimisation
• Central handset purchasing
• Logistics regionally managed across Europe
• Lower cost data devices
• Vodafone Procurement Company
• LTE equipment and server auctions with VZW
• Application development and maintenance
outsourced on multi-year competitive tenders
• Offshore service centres (Budapest, Cairo, Pune,
Ahmedabad)
• Sustain low cost of finance and liquidity
Actions
Group scale advantage and cost focus
54
Delivering cost efficiency programmes: £1bn completed; second £1bn on track
Reduction of European cost structure; good performance vs. peers
Significant benefits generated by Vodafone Group
– Technology standardisation & optimisation
– Supply chain savings
– Terminals: purchasing efficiencies and lower cost data devices
– Tax & Treasury benefits
7th most valuable brand across the globe
1. Source: BrandFinance global ranking

28
Asset / Portfolio
Strategy
55
56
Releasing liquidity or free cash flow from minorities
Non-controlled assets
• #1 market position in USA
• Market growth
• Most valuable data market
• Commercial co-operation
• Strong #2 converged operator in France
• Cash generative and dividend paying
• #1 operator in Poland
• Cash generative and dividend paying
• Dividends from future cash generation
• Assessment of options on a post-tax basis
• A valuable asset
• Open to all value maximisation plans
• Commercial agreement for France
• All shareholders have recently agreed to
explore options for a sale
Status Outlook

29
57
Releasing liquidity or free cash flow from investments
Investments
• Orderly and successful process
• Market placing of 3.2% stake for £4.3bn
• Accelerated realisation
• £3.1bn proceeds; premium to book value
• 26% illiquid minority stake in Bharti
Infotel Private Limited
• Represents 4.4% effective interest in
Bharti Airtel
Status Outlook
• Related £2.8bn share buy back programme
underway
• Maintaining commercial co-operation
• Proceeds to be received in two broadly equal
tranches in Dec 2010 and in April 2012
• Monetise when value objectives can be
achieved
• No near term solution
58
Capital Discipline and
Financial Objectives

30
59
Capital discipline
• Drive growth
• Meet spectrum needs
• Dividend per share growth of at
least 7% p.a.
• £2.8bn buy back programme
Organic investment Return to shareholders
Capital allocation to maximise shareholder value
Investment / corporate activity decisions: rigorous commercial analysis and tough hurdle rates, including M&A criteria, to ensure we enhance shareholder returns
Regular portfolio review: consider all options to optimise value for shareholders
• Build scale
• Cost synergies
• Free cash flow accretion
Selective consolidation
60
Medium term scenario
Group outlook to FY 13/141
Service revenue
1-4% p.a. organic growth
Main variables
Data migration economics
Verizon Wireless dividends
European economy
Public policy decisions
EBITDA margins
Stabilising
Free cash flow
£6-7 billion p.a.
1. Medium term guidance is based on FX £1: €1.15 and £1: US$1.50 and excludes the impact of licence and spectrum purchases, material one-off tax related payments and
restructuring costs, if any, and assumes no material change to the current structure of the Group

31
61
We are creating a more valuable Vodafone
Leadership focused on Europe, Africa and India
A growing company
A superior data experience for our customers
Realising liquidity or free cash flow from non-controlled assets
Enhanced capital discipline
Sustainable revenue growth, stabilising margins, strong free cash flow
Increasing shareholder returns
6262
Thank you – Q&A

32
Definition of terms
ARPU: Service revenue excluding fixed line revenue, fixed advertising revenue, revenue related to business managed services and revenue from certain tower sharing arrangements divided
by average customers
Churn: Total gross customer disconnections in the period divided by the average total customers in the period
Data attach rate: The number of complimentary data plans sold as a percentage of data capable handsets
Emerging economies: Africa and Central Europe, and Asia Pacific and Middle East
FCF: Operating free cash flow after cash flows in relation to taxation, interest, dividends received from associates and investments, and dividends paid to non-controlling shareholders in
subsidiaries
HSPA: High speed packet access is a wireless technology enabling data transmission between mobile devices and the network
M2M: Machine to machine
Mark to market: Mark to market on fair value accounting refers to accounting for the value of an asset or liability based on the current market price of the asset or liability
Mobile internet: Browser based access to the internet or web applications using a mobile device, such as a smartphone, connected to a wireless network
MTR: Mobile termination rate. A per minute charge paid by a telecommunications network operator when a customer makes a call to another network operator
Net debt: Long-term borrowings, short-term borrowings and mark-to-market adjustments on financing instruments less cash and cash equivalents
Operating free cash flow: Cash generated from operations after cash payments for capital expenditure (excludes capital licence and spectrum payments) and cash receipts from the
disposal of intangible assets and property, plant and equipment
Organic growth: The percentage movements in organic growth are presented operating performance on a comparable basis, both in terms of merger and acquisition activity and foreign
exchange rates
Smartphone: A smartphone is a phone offering advanced capabilities including access to email and the internet
Smartphone penetration: The number of smartphone devices divided by the number of registered sims, excluding data only sims
Total communications: Comprises all fixed location services, data services, fixed line services, visitor revenue and other services
Forward looking statements
This presentation contains forward-looking statements within the meaning of the US Private Securities Litigation Reform Act of 1995 with respect to the Group’s financial condition, results of operations and businesses and certain of the Group’s plans and objectives. In particular, such forward-looking statements include: the financial guidance for the 2011 financial year contained in slide 22, the medium-term guidance for the three financial years ending 31 March 2014 contained in slide 60 and the statements relating to the Group’s future performance generally, including the Group’s 7% per annum dividend per share growth rate policy; statements relating to the development and launch of certain products, services and technologies, including the increased penetration of smartphones; expectations regarding growth in customers and usage and mobile data growth and technological advancements, including the expected number of LTE base stations anticipated to be operational in Germany in 2011; statements relating to movements in foreign exchange rates; expectations regarding revenue, adjusted operating profit, EBITDA, free cash flows, adjusted effective tax rates, costs, tax settlements and capital expenditures; expectations regarding the Group’s second £1billion cost programme and other cost efficiency programmes; and expectations regarding the integration or performance of current and future investments, associates, joint ventures and newly acquired businesses.Forward-looking statements are sometimes, but not always, identified by their use of a date in the future or such words as “anticipates”, “aims”, “could”, “may”, “should”, “expects”, “believes”, “intends”, “plans”, “will” or “targets”. By their nature, forward-looking statements are inherently predictive, speculative and involve risk and uncertainty because they relate to events and depend on circumstances that will occur in the future. There are a number of factors that could cause actual results and developments to differ materially from those expressed or implied by these forward-looking statements. These factors include, but are not limited to, the following: changes in economic or political conditions in markets served by operations of the Group that would adversely affect the level of demand for mobile services; greater than anticipated competitive activity, from both existing competitors and new market entrants, which could require changes to the Group’s pricing models, lead to customer churn or make it more difficult to acquire new customers; the impact of investment in network capacity and the deployment of new technologies, or the rapid obsolescence of existing technology; higher than expected costs or capital expenditures; slower than expected customer growth and reduced customer retention; changes in the spending patterns of new and existing customers and the possibility that new products and services will not be commercially accepted or perform according to expectations; the Group’s ability to renew or obtain necessary licences; the Group’s ability to achieve cost savings; the Group’s ability to execute its strategy in mobile data, enterprise and broadband and in emerging markets; changes in foreign exchange rates or interest rates; the ability to realise benefits from entering into partnerships for developing data and internet services and entering into service franchising and brand licensing; unfavourable consequences of acquisitions or disposals; changes in the regulatory framework in which the Group operates, including possible action by regulators in markets in which the Group operates or by the EU to regulate rates the Group is permitted to charge; the impact of legal or other proceedings against the Group or other companies in the mobile telecommunications industry; loss of suppliers or disruption of supply chains; the Group’s ability to satisfy working capital and other requirements through access to bank facilities, funding in the capital markets and operations; changes in statutory tax rates or profit mix which might impact the weighted average tax rate; changes in tax legislation or final resolution of open tax issues which might impact the Group’s tax payments or effective tax rate; and changes in exchange rates, including, particularly, the exchange rate of pounds sterling to the euro and the US dollar.Furthermore, a review of the reasons why actual results and developments may differ materially from the expectations disclosed or implied within forward-looking statements can be found by referring to the information contained under the heading "Other Information – Forward-Looking Statements" in “Forward-looking statements” and "Principal risk factors and uncertainties" in Vodafone Group Plc's Annual Report for the year ended 31 March 2010. The Annual Report can be found on the Group’s website (www.vodafone.com/investor). All subsequent written or oral forward-looking statements attributable to the Company or any member of the Group or any persons acting on their behalf are expressly qualified in their entirety by the factors referred to above. No assurances can be given that the forward-looking statements in this presentation will be realised. Except as otherwise stated herein and as may be required to comply with applicable law and regulations, Vodafone does not intend to update these forward-looking statements and does not undertake any obligation to do so.
64


