Embed Size (px)
Citation preview

Faculteit Bio-ingenieurswetenschappen
Academiejaar 2014 – 2015
pH Hysteresis & electrolysis for zero-chemical input control of fermentation processes
Pieter Candry Promotor: Prof. dr. ir. Korneel Rabaey Co-promotor: Dr. Marta Coma Bech Tutor: ir. Stephen Andersen
Masterproef voorgedragen tot het behalen van de graad van Master in de bio-ingenieurswetenschappen: Milieutechnologie


II

III
Acknowledgements
Over the course of 10 months of lab work many people got involved in this project and helped
bring it to this point. Without these people I would never have been able to bring this thesis to its
conclusion.
First and foremost I would like to thank my promotors and tutor. The day-to-day help of ir.
Stephen Andersen with lab work, experimental set-ups and experimental design as well as his
knowledge and insight into the most interesting research questions helped me tremendously. The
guidance of Dr. Marta Coma Bech in the lab as well as her guidance through the entire project
further provided me with the tools necessary for this research. Prof. Dr. ir. Korneel Rabaey
provided scientific support and, from his wealth of research experience, provided me with the most
interesting questions and research paths to go down, making this research interesting for a broader,
industrial public.
I would also like to thank the entire LabMET team for providing the environment to perform this
research. More specifically I would like to thank Tim Lacoere for guiding me through the process
of DNA-extraction for community analysis as well as performing the quality control of the
extracted DNA before sequencing. Dr. Hugo Roume is warmly thanked for his bio-informatics
work with the sequenced DNA and analysing this data to understand the fermenting community
in thin stillage. Way Cern Khor is thanked for analysing the sugars present in thin stillage for the
stream characterisation.
Lastly I want to sincerely thank my family and close friends for bearing with me through these last
10 months. Without their support through some trying times I would never have created this
project as it lies here now. I would specifically like to thank Sarah Candry, Yarim Vanherpe and
Annabel Dewilde for reading the entire text and providing corrections where necessary.

IV

V
Abstract The biorefinery concept attempts to alleviate fossil fuel dependency by sustainable bio-production
of fuels and chemicals. The bio-ethanol process is well established but a large portion of incoming
organics remains unconverted. Part of this rest fraction can be fermented to volatile fatty acids,
valuable as industrial precursor chemicals. However, large amounts of chemicals are needed for
fermentation management and the obtained volatile fatty acids are difficult to extract and recover.
This study demonstrates the conversion of biorefinery thin stillage – the bottoms or waste fraction
of a bio-ethanol distillation column – into short chain carboxylates using zero chemical input
techniques. A stream characterisation of thin stillage was performed to gather knowledge on this
stream. Membrane Electrolysis (ME) – an electrochemical membrane-based extraction technique
– was applied to investigate the possibility of extraction of the target products. ME produces H2
and OH- in the fermentation broth. The first of these was shown to influence the obtained volatile
fatty acids, resulting in a higher-value product output, while the second could be used for pH-
management with zero-chemical input. Methanogenic activity, converting volatile fatty acids to
methane, is unwanted in this application considering the goal of chemicals production. The
influence of pH changes on methanogenesis was examined using a zero-chemical input system by
decreasing pH with acidogenesis and increasing pH with electrolytic extraction. Further
experiments studied the long-term influence of pH changes on the fermenting community. This
study demonstrates the potential of biorefinery thin stillage as a substrate for production of volatile
fatty acids as well as the potential of ME for product recovery and pH-control in a fermenter.

VI
Nederlandse samenvatting De bio-raffinaderij poogt door duurzame, biologische productie van brandstoffen en chemicaliën
de afhankelijkheid van fossiele bronnen te verlichten. Het bio-ethanol proces is al vaak toegepast,
maar zet een groot deel van het organisch materiaal niet om naar het eindproduct ethanol. Een deel
van de resterende organische fractie kan gefermenteerd worden tot vluchtige vetzuren, waardevol
als bouwstenen voor de chemische industrie. Deze fermentatie vereist echter grote hoeveelheden
chemicaliën voor controle van het proces en extractie en herwinning van vluchtige vetzuren is duur.
Deze studie demonstreert de omzetting van ‘thin stillage’ – de restfractie uit een bio-ethanol
distillatiekolom – naar vluchtige vetzuren met technieken die geen chemicaliëngebruik vereisen.
Om kennis te vergaren over thin stillage werd de stroom gekarakteriseerd. Een elektrochemische
membraangebaseerde extractietechnologie, membraanelektrolyse (ME), werd onderzocht op de
mogelijkheid voor extractie van de bekomen producten. ME produceert H2 en OH- in het
fermentorcompartiment. Er werd aangetoond dat H2 een invloed heeft op de bekomen vluchtige
vetzuren, wat een meer waardevolle mix van vluchtige vetzuren opleverde. De geproduceerde OH-
kon gebruikt worden om pH te controleren zonder chemicaliëninput. De conversie van vluchtige
vetzuren naar methaan door methanogene activiteit is ongewenst als chemische bouwstenen
beoogd worden. De invloed van pH-veranderingen op deze methanogene activiteit werd
bestudeerd gebruikmakend van een systeem zonder input van chemicaliën door de pH te laten
zakken m.b.v. acidogenese terwijl stijgingen bekomen werden door elektrolytische extractie. De
langetermijninvloed van dergelijke pH-veranderingen op fermenterende gemeenschap werd ook
bestudeerd. Deze studie demonstreert het potentieel van thin stillage uit een bioraffinaderij als
substraat voor de productie van vluchtige vetzuren evenals het potentieel van ME voor herwinning
van de doelproducten en pH-controle in de fermentor.

VII
Table of Contents
List of acronyms ........................................................................................................................................... 1
Introduction .......................................................................................................................................... 3
Biorefineries .................................................................................................................................. 3
Bio-ethanol production from corn ............................................................................................ 4
Anaerobic Digestion & Fermentation ...................................................................................... 6
Biochemical processes ........................................................................................................ 6
Important parameters ......................................................................................................... 7
1.3.2.1. Temperature ................................................................................................................. 7
1.3.2.2. pH .................................................................................................................................. 8
1.3.2.3. Organic Loading Rate ................................................................................................. 8
1.3.2.4. Retention Times .......................................................................................................... 8
Carboxylate Platform .................................................................................................................. 8
Goal ....................................................................................................................................... 8
Inhibition of methanogenesis ............................................................................................ 9
1.4.2.1. Chemical inhibition ..................................................................................................... 9
1.4.2.2. pH .................................................................................................................................. 9
1.4.2.3. Retention Times ........................................................................................................ 10
1.4.2.4. Organic Loading Rate ............................................................................................... 10
Examples and practical challenges .................................................................................. 10
VFA Toxicity and product inhibition ..................................................................................... 11
Influence of pH ................................................................................................................. 11
Mechanisms of toxicity and inhibition ........................................................................... 12
Strategies for reduction of VFA toxicity ........................................................................ 13
Electrochemical Systems & Membrane Extraction .............................................................. 15
Materials and methods ...................................................................................................................... 17
Alco BioFuel thin stillage.......................................................................................................... 17
Semi-continuous batch reactor experiments ......................................................................... 17
Fermentation at fixed pH ................................................................................................. 17
Fermentation with pH Hysteresis ................................................................................... 18
Fermentation at fixed pH with electrochemical extraction ......................................... 18
Methanogen control by pH-shocking ............................................................................ 20
Chemical analyses ...................................................................................................................... 20

VIII
VFA Analysis ..................................................................................................................... 20
Solids Analysis.................................................................................................................... 20
Headspace Gas Analysis ................................................................................................... 21
Stream Characterisation .................................................................................................... 21
Community Analysis ................................................................................................................. 21
Batch Tests ................................................................................................................................. 22
VFA-inhibition .................................................................................................................. 22
Methanogen control by application of pH-shock ........................................................ 22
Shocking community with pH and VFA to influence production ............................ 23
Results .................................................................................................................................................. 25
Stream characterisation ............................................................................................................. 25
Electro-Fermentation ................................................................................................................ 26
Influence of EF on VFA-production ............................................................................. 26
Solids decrease and ME .................................................................................................... 29
Substitution of NaOH by Membrane Electrolysis ....................................................... 30
Influence of HRT reduction ............................................................................................ 31
Product inhibition of the fermenting community ........................................................ 33
Biochemical pathway analysis .......................................................................................... 35
3.2.6.1. Speculation on biochemical pathways present...................................................... 35
3.2.6.2. Linking potential pathways to fermenter output .................................................. 37
Community Analysis ......................................................................................................... 40
Methanogen control in a fermenting reactor ......................................................................... 42
Fermenting reactor at pH 7 ............................................................................................. 42
pH shocking as a strategy to remedy methanogen incursions .................................... 43
3.3.2.1. pH-shock batch test .................................................................................................. 43
3.3.2.2. Semi-continuous batch reactor experiments with pH shocks ............................ 46
Influence of pH shocks on a fermenting community .......................................................... 49
Batch test combining pH shock with high VFA-concentrations ............................... 50
pH Hysteresis Semi-continuous batch reactor .............................................................. 53
Discussion ........................................................................................................................................... 57
Thin Stillage as a biorefinery substrate ................................................................................... 57
Thin Stillage at lab scale .................................................................................................... 57
Economics of the corn bio-ethanol process ................................................................. 57
4.1.2.1. Carboxylates production from thin stillage ........................................................... 57

IX
4.1.2.2. DDGS as coproduct from the corn bio-ethanol process ................................... 59
4.1.2.3. Diversification of coproducts for economic buffering ....................................... 60
Zero-chemical input control .................................................................................................... 61
Potential and future development of electrochemical systems for extraction .................. 62
ME and Carboxylate Platform Barriers .................................................................................. 63
Separation Barrier .............................................................................................................. 63
Ecology Barrier .................................................................................................................. 64
Methanogen Barrier .......................................................................................................... 65
Conclusion .......................................................................................................................................... 67
Sustainability ....................................................................................................................................... 69
Future research possibilities ............................................................................................................. 71
References ........................................................................................................................................... 73


1
List of acronyms Ac Acetic Acid/Acetate
AD Anaerobic Digestion
AEM Anion Exchange Membrane
But Butyric Acid/Butyrate
Cap Caproic Acid/Caproate
CE Coulombic Efficiency
COD Chemical Oxygen Demand
CSTR Continuously Stirred Tank Reactor
DDG Distillers’ Dried Grains
DDGS Distillers’ Dried Grains with Solubles
dsDNA Double-stranded DNA
EC Electrical Conductivity
EF Electro-Fermentation
EtOH Ethanol
Hep Heptanoic Acid/Heptanoate
HRT Hydraulic Retention Time
iBut Isobutyric Acid/Isobutyrate
iCap Isocaproic Acid/Isocaproate
iVal Isovaleric Acid/Isovalerate
LCA Life Cycle Analysis
LCFA Long Chain Fatty Acids
MBR Membrane Bioreactor
ME Membrane Electrolysis
NREL National Renewable Energy Laboratory
Oct Octanoic Acid/Octanoate
OLR Organic Loading Rate
PPP Pentose Phosphate Pathway
PKP Phosphoketolase Pathway
Pr Propionic Acid/Propionate
PV Photovoltaic
sCOD Soluble COD
SRT Sludge Retention Time
tCOD Total COD
TKN Total Kjeldahl Nitrogen
TS Total Solids
TSS Total Suspended Solids
Val Valeric Acid
VFA Volatile Fatty Acids
VS Volatile Solids
VSS Volatile Suspended Solids

2
3
Introduction Biorefineries
The biorefinery concept tries to implement a shift from fossil sources towards sustainable sources
(i.e. biomass) for production of chemicals to substitute conventional petrochemical refineries
(Ghatak, 2011). Not only chemicals, but also biofuels and bioenergy can be produced in a
biorefinery. As the American National Renewable Energy Laboratory (NREL) defines the concept:
“A biorefinery is a facility that integrates biomass conversion processes and equipment to produce
fuels, power, and chemicals from biomass. The biorefinery concept is analogous to today's
petroleum refineries, which produce multiple fuels and products from petroleum” (NREL, 2009).
There are multiple reasons for implementing this concept. A first motivation is the reduction of
the environmental impact of human activity by moving toward a carbon neutral society (Ghatak,
2011). At the same time, renewable sources of fuels and materials will aid in reducing the
dependency on finite fossil fuel reserves (Fernando et al., 2006; Kamm & Kamm, 2004; Sanders et
al., 2007; Ghatak, 2011).
The type of feedstock used in a biorefinery is a key factor in how the refinery will be designed and
operated. In this way, two generations of feedstocks can be defined. The first generation consists
of dedicated crops, such as corn, sorghum, soy, etc. From these crops, a wide array of products
can be obtained. Vegetable oils (e.g. rapeseed oil, soybean oil, etc.) can be converted to biodiesel
through transesterification (Naik et al., 2010). Carbohydrate sources (e.g. sugar cane, corn) can be
converted to ethanol (EtOH) through fermentation, conventionally using yeast cultures such as
Saccharomyces cerevisiae (Wilkie et al., 2000). Through Anaerobic Digestion (AD), first generation
feedstocks can also be converted to biogas or biomethane (Naik et al., 2010). Both the EtOH-
production process and AD will be discussed in greater detail, in Section 1.2 and 1.3 respectively.
Waste streams from these processes can also be used to produce biomaterials. For instance, EtOH
production from corn allows recovery of corn fiber oil, corn fiber gum and zein, all of which have
commercial value and specific applications. A key advantage of using first generation feedstocks is
its ease of use for fermentation, as pretreatment steps are limited. The downside of these
convenient feedstocks is the competition with food production. Production of biofuels requires
either food being directly used as a feedstock or valuable land area, water and energy being used to
produce non-food crops for the same purpose, implying an indirect loss of food (Ghatak, 2011).
Second generation - or lignocellulosic - feedstocks consist mostly of agricultural residues and
woody biomass. The simplest path of valorising this type of raw material is heat energy generation
through combustion of wood or residues, however this releases carbon back into the atmosphere.
Large amounts of carbon, in the form of lignin and polysaccharides (i.e. hemicellulose and
cellulose), are stored in these feedstocks. The carbon complexes embedded in these feedstocks
could be better utilized when converted into complex organic molecules, as opposed to CO2 (via
oxidation). Production of materials and biofuels from these sources could then be very promising.
Woody biomass has already been used for centuries to produce paper, but other materials and fuels
could be produced from the lignin, hemicellulose and cellulose in the wood. Lignin is the crucial

4
component in unlocking the potential of lignocellulosic raw materials. Since lignin blocks the access
to the cellulose for chemicals and micro-organisms, there are several technical barriers that need to
be overcome before agricultural residues and wood can be used to produce fuels and materials. For
instance, the production of EtOH from lignocellulosic biomass requires a physical pretreatment
(e.g. steam or ammonia treatment) to remove the lignin from the cellulose. Next, enzymatic
hydrolysis of the (hemi)cellulose is necessary to obtain the sugar building blocks of these
polysaccharides, i.e. the sugar monomers. These monosaccharides can then be fermented to EtOH
by organisms such as S. cerevisiae (Naik et al., 2010).
‘Platforms’ can also be used to make a classification of biorefineries, distinguishing between
platforms on the basis of their target products. Two well-established platforms are the sugar and
the syngas platform. In the sugar platform, biomass is broken down into five- and six-carbon sugars
which are then converted into fuels and chemicals, such as EtOH, by fermentation. The syngas
platform consists of a thermochemical process in which biomass is converted to syngas; this is a
mix of CO, CO2 and H2. This syngas can then be converted into energy or fuels by means of
catalysers. A third platform, the carboxylate platform, has been emerging in recent years. This
platform uses anaerobic fermentation to produce carboxylic acids, which can be used as building
blocks for other chemicals and organics. This will be discussed at length in Section 1.4 (Agler et
al., 2011).
Some examples of biorefineries can already be found worldwide. ALCO BioFuel in Ghent, Belgium
produces EtOH and other byproducts from corn, a process which will be discussed in detail in
Section 1.2. The MixAlco-process, developed by Terrabon in Texas, USA, produces alcohols from
biomass such as wood, municipal solid waste or sorghum (Holtzapple & Granda, 2009; Granda et
al., 2009). The Inbicon demonstration plant in Kalundborg, Denmark shows the potential of
producing EtOH from lignocellulosic feedstocks with the Integrated Biomass Utilization System-
process. In this case wheat straw is the main feedstock, but sugar bagasse, corn stover, empty fruit
bunches, etc. have also been used as feedstocks (Larsen et al., 2012; Larsen et al., 2008; Inbicon,
2014).
Bio-ethanol production from corn As mentioned in the previous section, corn grains can be used as substrate for the production of
bio-EtOH. While the key step in this process is the fermentation of sugars to EtOH, multiple pre-
treatment steps are required to convert starch in the corn grains into sugars. After fermentation,
EtOH is distilled from the broth which results in a high EtOH concentration distillate and a low
EtOH-concentration bottoms stream or ‘whole stillage’. A schematic overview of the different
steps in this process and any co-products can be seen in Figure 1.
The first step in the process is to mill the corn grains to reduce the particle size, obtaining a meal.
This meal is then mashed, cooked and liquefied. The mashing entails mixing of the meal with water,
containing α-amylase enzymes, to obtain the thick mash. This mash is then cooked and the high
temperatures liquefy the starch in the mash. The starch is broken down into dextran, a branched
polysaccharide, by the α-amylase enzymes. After cooking, the mash is cooled down and gluco-

5
amylase is added, which can break down the dextran into fermentable sugars (Alco BioFuel, 2014;
Wilkie et al., 2000).
Figure 1. Schematic overview of Alco BioFuel production process (adapted from Alco BioFuel, 2014)
After the degradation of the starch to sugars, fermentation can proceed. In the Alco BioFuel
process this is done in a batch process at 30-32 °C for 20 to 30 hours. This results in a ‘beer’ with
an EtOH-content of approximately 12% (Alco BioFuel, 2014). Literature describes a very similar
process, allowing batch fermentation to take place for generally less than 2 days, resulting in a beer
containing 2 to 12% EtOH. For batch processes a yeast culture inoculum needs to be added to the
mash in order to induce fermentation. The volume of this inoculum is often close to 10% of the
total batch reactor volume. Fermentation can also be performed in continuous reactors where yeast
is either immobilized or recycled. This increases fermenter productivity and EtOH yield (Wilkie et
al., 2000).
After fermentation the beer is distilled. This results in a distillate containing most of the EtOH, at
96% purity due to azeotropic effects. For automotive applications the EtOH should have a water
content lower than 1%, which cannot be achieved through distillation. For this purpose the EtOH
is dehydrated after distillation. Several technologies are available for dehydration, with molecular
sieves being the most frequently applied in fuel production. This molecular sieve consists of
synthetic zeolites that preferentially absorb water, dehydrating the EtOH passing through the sieve
(Wilkie et al., 2000).
The distillation process also produces a ‘bottoms’ or ‘whole stillage’ stripped of most of the EtOH.
This whole stillage can still contain 0,1-0,2% EtOH when distillation runs efficiently, and can
increase to 1% when distillation is suboptimal. This stillage still contains high amounts of organics,
with literature reporting organics concentrations of 55 g Chemical Oxygen Demand (COD) per L

6
of stillage. This COD is the amount of O2 needed to oxidize all organics to CO2, quantifying the
organics in a sample. This stream is also valorised by centrifuging the stillage to obtain separation
of the solid fraction from the liquid fraction. The solid fraction is called the ‘wet cake’ while the
liquid fraction is ‘thin stillage’. The wet cake can be dried and pelletized resulting in Dried Distiller’s
Grains (DDG). Thin stillage can be concentrated to a syrup by evaporation. Addition of this thin
stillage to DDG results in Dried Distiller’s Grains and Solubles (DDGS) (Wilkie et al., 2000).
Anaerobic Digestion & Fermentation
Biochemical processes AD is one of the most basic and mature biorefinery technologies. In this process, biomass is broken
down to methane (CH4). This CH4 can then be valorised either by burning it to generate heat
and/or electricity or it can be used as natural gas after purification. The breakdown of biomass
occurs over several steps, as shown in Figure 2.
Figure 2. Overview of biomass degradation for production of CH4 (adapted from Angenent et al., 2004)
In a first step, the biomass is hydrolysed. This means the complex organic matter is broken down
to the organic building blocks, i.e. sugars (from carbohydrates), amino acids (from proteins) and
Long Chain Fatty Acids (LCFA) from fats. This breakdown occurs extracellularly by a combination
of processes, such as non-enzymatic and physical breakdown, physical separation and lysis
(Batstone & Keller, 2002). With second generation lignocellulosic feedstocks this step is a major
barrier. Due to the complex structure of this feedstock, the polysaccharides in the lignocellulose
are not available for the extracellular enzymes. For this reason pretreatment of lignocellulosic
feedstocks is necessary to increase the efficiency of the process. However, it is this pretreatment
that is one of the major technological barriers for the use of lignocellulosic feedstocks in AD and
biorefineries in general. A wide range of techniques has been studied, but these techniques are
often found to be either very expensive or very slow, limiting the commercialisation of second
generation feedstocks in AD (Taherzadeh & Karimi, 2008).

7
The second step of the AD-process is acidogenesis. In this step sugars and amino acids are
converted into a mix of Volatile Fatty Acids (VFA), Carbon Dioxide (CO2) and hydrogen. These
VFA include propionate, valerate and butyrate. The VFA from the acidogenesis are then broken
down into acetate, hydrogen and CO2 by the acetogenesis-step. The acetogens can be divided into
three groups. One group breaks down LCFA, a second group is responsible for the degradation of
butyrate and valerate and the last group breaks down propionate.
Table 1. Overview of main pathways for methanogenesis and the associated standard changes in energy (Source: Liu
& Whitman, 2008)
Pathway Reaction ΔG0 (kJ.mol CH4-1)
Hydrogenotrophic CO2+4 H2 CH4 + 2H2O -135
Acetoclastic CH3COOH CH4 + CO2 -33
Methylotrophic 4 CH3OH 3 CH4 + CO2 + 2 H2O -105
From this mix of acetate, CO2 and hydrogen, methanogens can produce CH4. This occurs through
three main pathways: hydrogenotrophic, acetoclastic and methylotrophic methanogenesis. All of
these pathways are exclusively executed by organisms belonging to the Archaea-domain. The
hydrogenotrophic pathway uses hydrogen and CO2 as substrates for the CH4-production, as can
be seen in Table 1. This pathway can be performed by most methanogens. Some hydrogenotrophic
methanogens can also use formate or some alcohols (e.g. 4-isopropanol) as substrates. The
acetoclastic pathway produces CH4 from the reduction of acetate, as can be seen in Table 1. Even
though this pathway is the energetically least attractive of the three and can only be performed by
two genera (Methanosaeta and Methanosarcina), it provides up to two thirds of all the biologically
produced CH4. The last pathway is the methylotrophic pathway, which can only be performed by
species belonging to the order of Methanosarcinales, with the exception of Methanosphaera. In this
pathway a wide range of methylated compounds, such as methanol (see Table 1) and methylated
amines and sulphides, can be used to produce CH4 (Liu & Whitman, 2008).
Important parameters In this section, several important parameters for anaerobic digestion will be discussed in detail,
focussing on why these parameters are relevant to the AD process.
1.3.2.1. Temperature
AD processes can be divided into two categories based on temperature. Mesophilic digestion
occurs at temperatures of approximately 35°C while thermophilic digestion occurs at 55°C. The
higher temperature can increase COD removal, biogas yield and net energy output and allows for
a higher Organic Loading Rate (OLR) (Ward et al., 2008). There are several effects at play with
increasing temperature in AD. The increase of biological and chemical reaction rates has a positive
effect on AD, as does the increased solubility of organic compounds. On the other hand the
increasing temperature increases the fraction of free ammonia and raises the pKa of VFA. Both of
these effects increase the risk of methanogen inhibition and subsequent process failure (Appels et
al., 2008).

8
1.3.2.2. pH
The different groups of micro-organisms involved in AD each have their own optimal operating
pH. The fermentative organisms (i.e. those performing the first three steps of AD) are tolerant to
a wider range of pH than the methanogens. While the fermenters can function between pH 4 and
8.5, methanogens in digesters are limited to a pH-range between 6.5 and 7.2. pH not only directly
influences the methanogens, but can also influence the toxicity of some substances (e.g. VFA,
ammonia) as will be explained in detail in Sections 1.4.2.2 and 1.5. pH can also influence the VFA
produced by the acidogenic fermenters; lower pH results in acetate and butyrate while higher pH
results in acetate and propionate. These VFA decrease the pH, which is usually countered by
methanogenesis, since the CO2, HCO3- and NH4
+ produced by methanogenesis can act as alkalinity
buffer (Appels et al., 2008).
1.3.2.3. Organic Loading Rate
The OLR is the rate of organics loading per volume of reactor, usually expressed in organics per L
reactor per day, organics being expressed as gCOD, g Volatile Solids (VS), g Volatile Suspended
Solids (VSS),… This parameter determines the rate of organics conversion to CH4 and is
preferentially set as high as possible to increase potential CH4 production. Increase of the OLR has
limitations as well. Sánchez et al. (2005) showed that at increasing OLR, organics removal
efficiencies decrease sharply at a certain threshold OLR. This decrease was due to the simultaneous
accumulation of VFA and decrease in alkalinity, resulting in a pH decrease. These effects are
detrimental to methanogens, as will be discussed at length in Sections 1.4.2.2 and 1.5.
1.3.2.4. Retention Times
The average time solids spend in the digester is called the Sludge Retention Time (SRT) or sludge
age. This parameter affects the required growth rate of methanogens in the community. Lowering
of the SRT implies a larger fraction of the sludge being removed per unit of time, which in turn
means cell growth should be faster to compensate for the lost sludge. Therefore it is a key
parameter for AD. For instance, when a Continuously Stirred Tank Reactor (CSTR) is operated
with a SRT lower than five days the methanogenic community will be lost due to wash-out, which
results in increasing VFA concentrations. It is only when the SRT becomes larger than eight days
that digestion can be run stably (Appels et al., 2008). The average retention time of water in a
reactor is called the Hydraulic Retention Time (HRT) and determines to what extent the
community can convert substrate in the influent to CH4. The main importance of this parameter
is sizing of the reactor, as a smaller HRT requires smaller reactor volume for the same flow (Larsson
et al., 2015).
Carboxylate Platform
Goal AD as a biorefinery technology has been well established and even though it produces heat and
energy, it may not be the most profitable way of valorising a waste stream. Using waste-streams to
make valuable products, i.e. chemicals, could create economic opportunities. This is what the

9
carboxylate platform attempts. This can then be seen as a separate biorefinery platform, next to
the sugar, syngas and other platforms (Agler et al., 2011).
In the carboxylate platform anaerobic fermentation is used to produce VFA, otherwise known as
carboxylates when present as dissociated acids. This anaerobic fermentation is generally performed
with an undefined mixed culture to allow the treatment of variable streams such as waste or
biomass and reduce operation costs by removing the need for axenic conditions (Agler et al., 2011).
Since the anaerobic fermentation to VFA, also called acidogenic fermentation (Lee et al., 2014), is
similar to AD, the last step of AD, methanogenesis, has to be inhibited to avoid conversion of
VFA to CH4. Various methods of inhibiting methanogenesis will be discussed in the next section.
Inhibition of methanogenesis
1.4.2.1. Chemical inhibition
Several chemicals can be applied to inhibit methanogens. These chemicals can be divided into two
groups: specific and nonspecific inhibitors. Specific inhibitors act on enzymes only found in
methanogens, thus leaving other micro-organisms unaffected. Examples of specific inhibitors are
2-bromoethanesulfonate, and mevastatin. Nonspecific inhibitors affect methanogens as well as
other fermenting micro-organisms so care should be taken to preserve the acidogenic community.
Examples include ethane, acetylene, chloroform (Lee et al., 2014).
Other compounds can also disrupt methanogenesis and AD as a whole. For instance, NH3 is very
toxic for micro-organisms due to its free migration through membranes after which it can disrupt
proton balances. NH3 originates from biological degradation of nitrogen-containing matter.
Sulphides (HS- and H2S) can also be toxic, although there is no clear mechanism of this toxicity.
These sulphides originate from the reduction of sulphates (SO42-) by sulphate reducing bacteria
(Chen et al., 2008).
1.4.2.2. pH
Due to the small pH-range in which methanogens can survive - between 6.5 and 7.2 (Appels et al.,
2008) or even 6.8 to 7.2 (Chen et al., 2008) - as opposed to the wide pH range for acidogens - pH
4 to 8.5 (Appels et al., 2008) - it is clear that a suitable choice of pH can inhibit methanogens. This
results in pH optima for VFA producers of pH 8 to 11 in case of sludge fermentation and pH 5.25
to 6 when wastewater is used (Lee et al., 2014). There are several effects at play with changing pH.
At high pH, i.e. larger than 8, NH3 becomes a serious problem for toxicity. This is because the
fraction NH3 of the total ammonia nitrogen, i.e. the sum of NH3 and NH4+, increases with
increasing pH. In this way, an increasing pH increases the concentration of NH3 and causes toxicity
for micro-organisms (Chen et al., 2008).
H2S can also affect methanogenic activity, although there is still no consensus on the mechanism
behind H2S-toxicity. The protonated form, representing a higher fraction of total sulfide at low pH,
can diffuse into the cell and potentially denature proteins. This mechanism is still unproven as
studies have found no clear link between H2S-toxicity and pH (Chen et al., 2008).

10
At low pH, toxicity due to VFA comes into play. A decrease of pH causes a larger fraction of VFA
to become protonated. This protonated, electrically neutral form can migrate through the cell
membrane. After migration, the acids can dissociate, lowering the pH inside the cell. This can cause
homeostatic pH controlling mechanisms to fail, resulting in the death of the micro-organism
(Harris et al., 2001). This effect will be discussed in detail later in Section 1.5.
1.4.2.3. Retention Times
As discussed earlier (see Section 1.3.2.4), retention times of both sludge and water influence AD.
Due to slow growth, methanogenesis is especially sensitive to low SRT. As mentioned before, at
SRT lower than 8 days, acidogenesis prevails due to washout of methanogens. Only at SRT higher
than 10 days stable methanogenesis could be obtained. For the case of acidogenic wastewater
fermentation, no clear link between SRT and VFA production has been found, due to the limited
amount of study (Lee et al., 2014).
1.4.2.4. Organic Loading Rate
As discussed before (see Section 1.3.2.3), OLR is an important parameter for AD. For VFA
production OLR, can be chosen with the goal of inhibiting methanogens. The mechanism behind
this inhibition is as follows: due to the high OLR, VFA production rate increases. When the VFA
production rate is higher than the consumption by methanogens, VFA start to accumulate, causing
acidification of the reactor. This combination of high VFA concentrations and low pH inhibits the
methanogens (Yan et al., 1993). Despite this, OLR should not be excessively high because
acidogens are affected by this parameter as well. According to Lee et al. (2014) VFA production
has an optimum OLR. At lower OLR, VFA production increases linearly with OLR while at higher
OLR, production deteriorates. While mechanisms behind this process failure are not well
understood, mass transfer limitations could be at play.
Examples and practical challenges Practical applications of the carboxylate platform are still rare. One example in development is
MixAlco, currently operating a demonstration plant. The MixAlco uses the carboxylate platform
to produce alcohols, ketones and other chemicals. Carboxylates are produced by fermenting
lignocellulosic biomass (e.g. crops, municipal solid waste,…) to VFA in piles. Methanogenesis is
inhibited by using chemical inhibitors, in this case iodoform, even though high NH3 concentrations
should be sufficient to inhibit methanogens. Residues after fermentation can be gasified to produce
H2. The fermentation broth is dewatered by vapour compression and subsequently esterified with
high molecular-weight alcohols. The esters formed in this esterification are subsequently
hydrogenolysed with H2 from fermentor gas, gasification of residues or new biomass, through
natural gas reforming or through electrolysis. This hydrogenolysis results in high molecular-weight
alcohols, reusable for the carboxylate esterification, and saleable low-molecular-weight
alcohols(Granda et al., 2009).
The carboxylate platform faces some challenges which Agler et al. (2011) reduced to three major
challenges: the separation barrier, the methanogen barrier and the ecology barrier. The methanogen
barrier was discussed earlier with Methods for inhibition of methanogenesis can help overcome
11
the methanogen barrier, as discussed in Section 1.4.2). Methanogenesis is undesirable for chemicals
production because of the loss of multi-carbon compounds to CH4. The separation barrier alludes
to the fact that even though VFA may be produced, they still have to be separated from the reaction
broth. Several methods have been attempted for separation, one of them being the extraction
through ion-exchange membranes. VFA produced in the cathode compartment can then be
transferred to the anode compartment. This technique will be discussed in greater detail in Section
1.6. Another possibility for separation is production of longer VFA (also called medium-chain
carboxylates) such as caproate and caprylate, which are easier to separate than shorter carboxylates
(Agler et al., 2011). The economic importance of this barrier should be noted. Downstream
processing, including the crucial separation step, can often account for more than 60% of total
production costs in fermentation-based processes (Bechthold & Bretz, 2008). Lastly, the ecology
barrier is the challenge to direct the microbial process in order to generate the desired products at
sufficient rates and high concentrations. The thermodynamic feasibility of the processes generating
these products is crucial and is determined largely by the environmental conditions of the
fermentation process. As a consequence, controlling these environmental conditions is crucial for
directing the process towards the desired products (Agler et al., 2011).
VFA Toxicity and product inhibition VFA are toxic to micro-organisms, more specifically the undissociated form of the acids. The
neutral undissociated acid can migrate through the lipophilic membrane of the micro-organisms.
The cytoplasmic pH of micro-organisms is usually between 6.5 and 7.5 (Roos & Boron, 1981),
causing the VFA to dissociate. This dissociation releases protons, decreasing the intracellular pH.
If the concentration of undissociated VFA is high enough, this pH-decrease can continue out of
control of the micro-organisms’ homeostatic mechanisms, causing their deaths (Harris et al., 2001).
Influence of pH An important parameter for VFA toxicity is the pH. This is due to the protonation of VFA at
decreasing pH which, as stated before, increases the concentration of undissociated - toxic - VFA.
Crucial in this story is the pKa of different VFA, since this is the pH at which half of the VFA are
protonated. Table 2 shows the pKa of some VFA relevant for the carboxylate platform.
As can be seen in Figure 3, constructed based on the Henderson-Hasselbalch equation, the fraction
of protonated VFA starts to increase rapidly when pH drops below 5.5. For this reason, many
applications of the carboxylate platform operate at this pH to inhibit methanogens without
inhibiting acidogens (Andersen et al., 2014; Agler et al., 2011).

12
Table 2. pKa of VFA relevant for carboxylate platform (Source: Jencks and Regenstein (2010))
VFA pKa
Acetic acid (Ac) 4.76
Propionic acid (Pr) 4.88
Iso-butyric acid (iBut) 4.86
Butyric acid (But) 4.82
Iso-valeric acid (iVal) 4.78
Valeric acid (Val) 4.86
Iso-caproic acid (iCap) 4.85
Caproic acid (Cap) 4.88
Heptanoic acid (Hep) 4.89
Octanoic acid (Oct) 4.89
Figure 3. Fraction protonated VFA as a function of pH for Ac and Oct, which have respectively the lowest and
highest pKa of the relevant VFA listed in Table 2.
Mechanisms of toxicity and inhibition As discussed previously, toxicity is thought to be due to migration of undissociated VFA into the
cell, causing disruption of proton balances (Harris et al., 2001). However, not all VFA have the
same effect. Pratt et al. (2012) found that product inhibition due to Ac has less impact than other
VFA, in this case Pr, iBut, But, iVal, Val and Cap. It was also found that inhibition only starts from
a certain threshold concentration, due to thermodynamical limitations. It is possible that high VFA
concentrations cause certain critical reactions to become thermodynamically limited, however this
would not explain the diminished effect of acetate. This could be explained by acetate not being
an end product but a by-product of fermentation.
The exact pathway of toxicity is still unclear. It is assumed that the undissociated forms of VFA
can penetrate the cell through the lipid membrane, subsequently dissociating and causing toxicity.

13
However, it appears that both the protons and the anions contribute to the toxicity. Palmqvist and
Hahn-Hägerdal (2000) elucidate two mechanisms of toxicity for weak organic acids, such as fatty
acids. The first mechanism, called the uncoupling theory, states that inhibition is caused by a drop
in internal pH due to the inward migration and subsequent dissociation of acids, which releases
protons. As a response to this pH-drop the plasma membrane ATPase pumps protons out of the
cell, neutralising intracellular pH. This neutralisation comes at a cost, in this case the hydrolysis of
ATP, which causes less energy to be available for growth. At high concentrations of undissociated
VFA the ATP is depleted, causing the dissipation of the proton motive force across the membrane.
Because the protons can no longer be pumped out of the cell, the cytoplasm starts to acidify. One
problem with this theory, however, is the limited capacity of fatty acids to acidify the cytoplasm,
since they can only carry one proton into the cell.
Another mechanism, the anion accumulation theory, states that the accumulation of anions after
dissociation causes toxicity. The anions accumulate because of their lipophobic behaviour after
dissociation. In this way diffusion of the undissociated form will continue until an equilibrium is
reached. This equilibrium is a function of the external pH because this is related to the amount of
undissociated VFA present externally (Palmqvist & Hahn-Hägerdal, 2000). Resistance to organic
acids could then be due to the capacity of these resistant micro-organisms to drop their internal
pH. Other effects can also contribute to inhibition such as membrane damage causing leakage and
changing membrane fluidity (Ricke, 2003). This could be caused by the ability of undissociated
VFA to dissolve at least partially into the membrane, resulting in higher fluidity and less
hydrophobic interactions (Royce et al., 2013).
These inhibitory effects, despite being troublesome to the carboxylate platform, have applications
as well. An application with large potential is the use of VFA as an antimicrobial to prevent the
spread of foodborne diseases in farms. VFA could substitute traditional antibiotics in these
applications since many foodborne diseases have developed resistance to these antibiotics. Some
form of resistance could also be developed against VFA by these pathogens, but only if they were
allowed to adjust to these VFA at sublethal levels (Ricke, 2003). Especially Oct has shown great
potential as antimicrobial; Cap has exhibited some potential as well, but to a lesser extent
(Skrivanova & Marounek, 2007).
Strategies for reduction of VFA toxicity To allow for increased VFA concentrations and accompanying increased production rates it can
be useful to reduce the toxicity of VFA to micro-organisms. Several strategies can be employed for
this purpose.
A first strategy is an increase of pH to reduce the fraction of protonated VFA. This should allow
for higher total VFA concentrations, since a higher total concentration of VFA is necessary to
achieve the same level of toxicity. However, as Appels et al. (2008) stated, methanogens can survive
at pH between 6.5 and 7.2. If the pH is set at 7, this would allow methanogens to grow and break
down the VFA to CH4.
14
A second strategy that can be implemented to reduce the VFA toxicity is to extract VFA from the
reactor broth. This reduces the total concentration of VFA present in the broth and lowers toxicity
for the micro-organisms. Besides lowering toxicity for micro-organisms, the separation of VFA is
also necessary in order to purify and valorise these VFA. Several techniques are available for
separation of VFA from reactor broth. A classical technique for separation of VFA is liquid-liquid
extraction by using an organic solvent (e.g. alcohols, hydrocarbons,…) to dissolve VFA. However,
micro-organisms can often be very sensitive to these solvents. The use of chemical solvents also
has a high environmental impact and should be avoided (Singhania et al., 2013).
One of the most promising methods for extraction is the use of membrane separation techniques
(Agler et al., 2011; Singhania et al., 2013), which can be applied as an electrochemical system. VFA
present as anions can migrate through a membrane as a response to a current applied over the
membrane. An example of this is the Membrane Electrolysis (ME) process, which consists of a
two-chamber electrochemical system. The fermentation broth is circulated through the cathode
compartment while a clean, saline and low pH-solution is circulated through the anode
compartment. Electrons flow from the anode to the cathode under the influence of an external
power source. This charge difference needs to be compensated by ion migration over the
membrane, which can be achieved either by migration of cations from anode to cathode
compartment or migration of anions from cathode to anode compartment. Since the goal is to
extract VFA, present as anions in the fermentation broth, it is desirable to avoid cation migration.
This can be achieved by using Anion Exchange Membranes (AEM) which prevents cation
migration due to its positively charged surface. With this ME-process, VFA produced during
fermentation can be extracted in a clean solution useable for production of other chemicals
(Andersen et al., 2014).
One possible disadvantage of this technique is the low Coulombic Efficiency (CE), especially at
low VFA concentrations in the catholyte. CE in this application is the ratio of target molecule
anions passed over the membranes to the electrons used during this extraction. Andersen et al.
(2014) showed that as the concentration of Ac increased, both the flux of Ac over the membrane
and CE increased significantly. In a catholyte solution with 10 g.L-1 Ac, a CE of 99.4±0.1% could
be achieved at a current density of 20 A.m-2. On the other hand, at lower Ac concentrations in the
catholyte, CE decreased. This can be explained by Le Châtelier’s principle: The compartments
separated by the membrane are in disequilibrium due to a combination of the Ac concentration
gradient and the charge gradient due to the applied current. This disequilibrium is larger when the
Ac concentration in the catholyte increases, resulting in more Ac anions to be transferred across
the AEM.

15
Electrochemical Systems & Membrane Extraction In an electrochemical system, a simultaneous reduction and oxidation is coupled through a power
source or electrical application. The reduction occurs at the cathode while the oxidation takes place
at the anode. In some cases a third electrode can be used as a reference electrode, which is used to
set the potentials of the working electrode and the counter electrode in the system. In applications
without this reference electrode, only the potential difference between the two electrodes can be
controlled, which is often the case in systems applying electrolysis (Thrash & Coates, 2008).
Electrolysis is the splitting of water in H2 and O2, as given by the reactions in Table 3. This takes
place at a minimum potential difference of 2.058 V, without taking overpotential and other
inefficiencies into account.
Table 3. Reactions occurring in electrolytical system (Source: Thrash and Coates, 2008)
Reaction ΔE0(V)
Oxidation 2 H2O ⇌ O2 + 4 H++ 4e- 1.230
Reduction 2 H2O + 2 e-⇌ H2 + 2 OH- -0.828
Assuming an anaerobic fermentation system with an electrolytical cell, the fermentation broth can
be put into contact with the cathode where the water in the broth is reduced. The anode can then
be placed in a separate solution, separated from the cathode compartment by a membrane. At the
cathode H2 and OH- are produced while O2 and H+ are produced at the anode. As discussed in
Section 1.5.3, the electrical circuit can then be closed by migration of anions from the fermentation
broth in the cathode compartment (catholyte) to the solution in the anode compartment (anolyte)
or by a reverse cation migration (Andersen et al., 2014). The electrolysis products have some
influence on the fermentation process (e.g. homoacetogenic reduction of CO2 with H2 - produced
by electrolytic H2O-reduction at the cathode – to Ac (Spirito et al., 2014)). This combination of
electrolysis with fermentation has been termed Electro-Fermentation (EF) and literature confirms
that reduction of H2O at the cathode influences products obtained during fermentation (Redwood
et al., 2012). Not only can target products be extracted using EF, acidification of the fermentation
broth by acidogenic fermentation can also be countered by production of OH- at the cathode (cf.
Table 3). This effectively creates a system capable of controlling pH without input of chemicals.
As mentioned before: to close the electrical circuit of the electrochemical cell, migration of ions
between anolyte and catholyte is necessary. Since the focus of this thesis is on the production of
VFA, mainly the migration of anions from catholyte to anolyte is relevant. As previously discussed
in Sections 1.5.1 and 1.5.3, VFA are chiefly present in anionic form in the fermentation broth,
which allows migration through the AEM. Andersen et al. (2014) used an anolyte solution at pH 2
in which extracted VFA are protonated and can no longer migrate through the AEM. The
protonation of these VFA consumes protons in the low-pH anolyte solution. This consumption is
then compensated by production of protons in the oxidation of water as shown in Table 3.

16

17
Materials and methods Alco BioFuel thin stillage
Thin stillage is, as mentioned in Section 1.2, a side-stream in the production of EtOH from
biomass. The bottom stream (stillage) resulting from distillation of the fermented biomass is
centrifuged, resulting in a supernatant - thin stillage - and solids - the wet cake. Thin stillage contains
large amounts of organics, nitrogen, etc. Some of the principal physicochemical properties of thin
stillage are listed in Table 4.
Table 4. Physicochemical properties of thin stillage in first 50 days of storage at 4°C (n=7)
pH (-) 4.86±0.15
Conductivity (mS.cm-1) 3.81±0.75
Total COD (tCOD) (g.L-1) 53.85±7.99
Soluble COD (sCOD) (g.L-1) 36.42±3.2
Alkalinity (meq.L-1) 7.78±3.36
Total Suspended Solids (TSS) (g.L-1) 19.45±1.38
VSS (g.L-1) 19.00±1.31
Total Solids (TS) (%) 4.37±0.26
VS (%) 90.50±0.47
Semi-continuous batch reactor experiments Several experiments were performed in a semi-continuous batch reactor system in a 34 °C
temperature-controlled room. These reactors, with a volume of 900 mL, were fed manually every
2 days. 300 mL of reactor broth was removed and 300 mL of fresh thin stillage was added at each
feeding. This resulted in an equal SRT and HRT of 6 days, chosen to allow build-up of VFA-
concentrations while at the same time previous research indicated this HRT was long enough for
adaptation of organisms to changing conditions (e.g. pH hysteresis – see Section 2.2.2). Another
reason for this short HRT was a reduced chance for methanogenic activity due to slow growth of
methanogens (Appels et al., 2008). For continuous tests with thin stillage (Sections 2.2.1, 2.2.2 and
2.2.3) no inoculum was added while for methanogen tests (Section 2.2.4) thin stillage was inoculated
(10%vol) with effluent from a mesophilic CH4-producing digester.
Fermentation at fixed pH pH was fixed at 5.5 using a Consort pH probe, Consort pH controller – maintaining pH above 5.4
- and a Prominent pump for dosing of 2M NaOH. The reactor was operated for 42 days (6 X
HRT), mixed by a magnetic stirrer. Gas produced during fermentation was collected in a gas tube,
as shown in Figure 4, with an acidic solution of HCl at pH 3 to prevent CO2-dissolution in the
solution. pH in this solution was monitored using methyl orange as an indicator. Another
experiment was run for 48 days at pH 7 in the same set-up. These fermentations will act as control
experiments for the experiments described in the following sections.

18
Fermentation with pH Hysteresis An identical experiment was performed with pH shifting every HRT, i.e. one HRT at pH 7, the
next HRT at pH 5.5, the next returned to pH 7, etc. The hypothesis behind this experiment is that
pH hysteresis can select for micro-organisms that are tolerant of high VFA-concentrations at a low
pH while simultaneously inhibiting methanogens in the fermenter. pH was controlled using a
Prominent pH controller, pH probe and pump. Gas produced during fermentation was trapped in
a gas tube with an acidic solution – using methyl orange as indicator - to prevent dissolution of
CO2. In a first phase of 72 days (6 oscillations – 12 x HRT), pH hysteresis between pH 7 and 5.5
was applied. In a second phase of 24 days (2 oscillations – 4 x HRT), the lower pH of the hysteresis
was decreased to 5. The bottom threshold of 2M NaOH dosing by the pH controller for pH
maintenance was 6.9, 5.4 and 4.95 for periods at pH 7, 5.5 and 5 respectively.
Figure 4. Experimental set-up of the semi-continuous batch reactor. Gas tubes with acidic solution can be seen in the
middle. Prominent pH controller visible in the back, Consort pH controller in front.
Fermentation at fixed pH with electrochemical extraction A semi-continuous batch reactor as shown in Figure 4 was expanded with an electrochemical cell
with internal dimensions of 200 mm × 50 mm × 20 mm per chamber, resulting in a total reactor
volume of 1200 mL. This set-up aims to bring into practice the first part of the process pipeline
described in Andersen et al. (2014) and in this way tests whether the ME-process influences the
fermentation process. This expanded set-up is shown in Figure 5. The electrochemical extraction
cell can be seen centrally while the fermenter itself is on the left. The recirculation pump, pumping
broth from fermenter to electrochemical cell as well as anolyte from the reservoir to the
electrochemical cell, is outside the picture frame to the left.

19
Figure 5. Set-up of fermenter with electrochemical extraction cell, pH controller with bottles and gas trap
The fermentation broth was recirculated from the reactor to the cathode compartment of the
electrochemical cell using a peristaltic pump at a rate of 6 L.h-1. The anode compartment was
separated from the cathode compartment by a 200 mm × 50 mm AEM (fumasep FAB, FumaTech
GmbH, Germany). The anolyte solution, a 0.05M Na2SO4/0.05M H2SO4-solution in deionized
water, was recirculated from a reservoir using the same peristaltic pump. The total volume of
anolyte solution was equal to that of the catholyte. An AISI Type 316L Stainless steel wire mesh
with 564 µm mesh size, 140 µm wire thickness (Solana nv, Belgium) was used as cathode. The
choice for stainless steel as a cathode material was made because of its cost effectiveness as well as
its capability for efficient H2-production through water electrolysis (Zhang et al., 2010). The anode
was an Ir MMO coated titanium electrode (IrO2/TaO2: 0.65/0.35), 200 mm x 50 mm, with a
centrally attached, perpendicular current collector (Magneto Special Anodes BV, The Netherlands).
The stability of Ir MMO as anode material for electrolytic oxidation of H2O is the main reason for
its choice in this application (Morimitsu et al., 2004). A potentiostat (VSP, Biologic, Fance) in
chrono-potentiometry mode was used to apply a fixed current in the electrochemical cell.
In the first operation phase of 24 days (4 x HRT) 400 mL of the broth was replaced with fresh thin
stillage every 2 days to maintain the 6 day HRT. Similarly, one third of the anolyte solution was
replaced every 2 days to prevent pH of the anolyte solution from falling and causing membrane
damage. As mentioned before in Section 1.6, the cathodic reduction of the fermentation broth
produces OH-, eliminating the need for NaOH-dosing to maintain a pH above 5.4. When pH
increased beyond 5.7, due to electrolytic reduction of the fermentation broth, acidic extractant
from the previous period was dosed by the pH controller. To minimize dosing of anolyte solution,
a current of 100 mA (approx. 10 A.m-2) was only applied either for the first 20 to 24 hours or until
a pH of 5.7 was reached, after which the current was lowered to 10 to 20 mA to allow for a
continuous supply of hydrogen to the broth.
The second phase of 18 days (3 x HRT) had similar operating conditions as phase 1, with no applied
current in the electrochemical cell to test whether the effect of the current was reversible. Because

20
no current was applied, the anolyte was refreshed with demineralised water instead of the acidic
solution.
A third phase of operation saw the HRT extended to 12 days by replacing one third of the broth
with fresh thin stillage every 4 days for a period of 1 HRT. This increase in HRT tested whether
the longer fermentation time would increase hydrolysis of the solids in the thin stillage.
A fourth and final phase of reactor operation saw a decreased HRT of 3 days by replacing one
third of the broth every day for a period of 9 days (3 HRT). In this phase, a constant current of
100 mA (10 A.m-2) was applied. 600 mL of anolyte was operated in batch mode (i.e. no replacement
of the solution when feeding the reactor) to allow accumulation of VFA in the anode compartment.
Methanogen control by pH-shocking To test the hypothesis that decreasing pH for a short period of time – a “pH-shock” - can control
methanogenic activity in a fermenter, an experiment was carried out using the experimental set-up
described in Section 2.2.3. The reactor was operated at pH 7 with an HRT of 6 days. Thin stillage
was inoculated with mesophilic digester effluent (10 vol%) at the start of the experiment and in
feed to ensure methanogenesis in the reactor. Initially an OLR of 7.9±2.9 g sCOD.L-1.d-1 and a
current of 100 mA (10 A.m-2) was applied. However, due to the continued absence of methanogens,
this loading rate was lowered after 10 days by diluting thin stillage with water, resulting in an OLR
of 3.3±0.6 g sCOD.L-1.d-1. On top of this, current density was lowered to 5 A.m-2 on day 16. After
these adaptations took place, methanogenesis was initiated and between day 19 and 21 a pH shock
of 2 days at pH 5.5 was applied by fermentative acidification combined with dosing of anolyte acid
and 2M HCl. After 2 days, pH was increased back to pH 7 by application of an increased current
of 10 A.m-2. Subsequent shocks were applied in much the same way: when CH4 was detected in
the headspace after at least 2 days at pH 7, reactor pH was lowered to 5.5 for the first two shocks,
followed by 2 shocks at pH 5.
Chemical analyses
VFA Analysis VFA were analysed in accordance with Andersen et al. (2014). C2-C8 fatty acids (including isoforms
C4-C6) were measured by gas chromatography (GC-2014, Shimadzu®, The Netherlands) with DB-
FFAP 123-3232 column (30m x 0.32 mm x 0.25 µm; Agilent, Belgium) and a flame ionization
detector (FID). Liquid samples were conditioned with sulfuric acid and sodium chloride and 2-
methyl hexanoic acid as internal standard for quantification of further extraction with diethyl ether.
Prepared sample (1 µL) was injected at 200ºC with a split ratio of 60 and a purge flow of 3 mL min-
1. The oven temperature increased by 6ºC.min-1 from 110ºC to 165ºC where it was kept for 2 min.
FID had a temperature of 220ºC. The carrier gas was nitrogen at a flow rate of 2.49 mL min-1.
Solids Analysis TSS and VSS-analyses were performed following Standard Methods 2540D and E (APHA, 2005).
TS and VS were analysed by weighing the difference between the initial sample weight and weight
after drying at 105°C (TS) and incinerating at 550°C (VS)

21
Headspace Gas Analysis The gas phase composition was analysed with a Compact GC (Global Analyser Solutions, Breda,
The Netherlands), equipped with a Molsieve 5A pre-column and Porabond column (CH4, O2, H2
and N2) and a Rt-Q-bond pre-column and column (CO2, N2O and H2S). Concentrations of gases
were determined by means of a thermal conductivity detector.
Stream Characterisation Four random samples from effluent and feed of both the control reactor at pH 5.5 (Section 2.2.1)
and reactor with electrolytic extraction (Section 2.2.3) were selected at random as well as four
samples of the anolyte solution from the reactor with electrolytic extraction for deeper stream
characterisation. Concentrations in the soluble phase were measured after filtering the sample with
0.45 µm non-sterile syringe filters. Total and soluble COD was analysed with Nanocolor® kits
(CODE; Macherey-Nagel). Total Kjeldahl Nitrogen (TKN) of these randomly selected samples
(filtered and unfiltered) was analysed according to Standard methods (4500-Norg B; APHA, 2005)
and used as an indication of total and soluble protein content of the samples. Quantification of
soluble carboyhydrates was performed according to the methods described in Sluiter et al. (2006)
and subsequent HPLC-analysis. Chloride, nitrite, nitrate, sulphate and phosphate were determined
by conductivity detection after inorganic anion chromatography on a 761 Compact Ion
Chromatograph (Metrohm, Switzerland). Organic ion chromatography (Dionex DX 500) was used
to quantify lactate, glycerol, 1,3-propanediol, EtOH, propanol and butanol concentrations in the
randomly selected samples.
Community Analysis Because of its origin in the biological EtOH-fermentation, thin stillage is a complex, non-sterile
broth containing organics such as proteins, cellulosic fragments and volatile fatty acids as well as
an inherent community. As no analysis of the community present in thin stillage, it is necessary to
perform a community analysis to obtain data and gather knowledge on this community. The
community analysis was performed on both the fresh thin stillage and the pH 5.5 controlled
reactors with and without ME, to evaluate the influence of ME on the microbial community
present in a fermenter.
Effluent and feed samples were centrifuged in sterile 2 mL Micrewtubes® (Simport, Canada) for
1 minute at 20238g and supernatant was removed before storage at -21°C. 10 feed samples and 11
effluent samples of the control reactor at pH 5.5 (Section 2.2.1) as well as 10 feed samples and 12
effluent samples of the experimental reactor with electrolytic extraction (Section 2.2.3) were
selected for DNA extraction. DNA extraction was performed using the unmodified PowerSoil®
DNA Isolation Kit protocol (MoBio, USA), resulting in 100 µL of isolated DNA in 10 mM Tris.
The choice for this DNA isolation kit was made because of its ability to isolate DNA when large
amounts of phenolic compounds (i.e. lignin) are present in the broth. Concentrations of double-
stranded DNA (dsDNA) in the extractant were quantified using the QuantiFluor® dsDNA system
and measured with a GloMax® 96 Microplate Luminometer (Promega GmbH, Germany).
22
A quality control of the extracted DNA was performed by PCR with primers used for Illumina
sequencing after which genomic 16s-DNA was sequenced using PCR with one-channel paired read
at 300 bp (LGC Genomics GmbH, Germany).
Batch Tests
VFA-inhibition The reactors described in Sections 2.2.1 and 2.2.2 reached steady-state conditions - defined as the
period during which concentrations vary less than 15% from the average concentration – after
resp. 1 and 2 HRT. To test the hypothesis that high VFA-concentrations inhibited production of
VFA, a batch test was conducted. Fresh thin stillage was inoculated (10 % of total volume) with
effluent from the reactor operated at pH 5.5, as described in Section 2.2.1. In a first experimental
test – named Medium hereafter – total VFA-concentration in the inoculated thin stillage was
increased with 12.5 g VFA.l-1, to reach approximately the steady-state concentration in the reactor
at pH 5.5. The second experimental test – named High hereafter – increased total VFA-
concentrations of the thin stillage with 20 g VFA.l-1, to reach a concentration well above the steady-
state concentration. This allows testing whether VFA-inhibition increased with concentration. In
a control test, no VFA were added. The experimental tests used a VFA-mixture consisting of 22%
Ac, 49% Pr, 9% But and 21% Val to increase concentrations artificially. The proportions of these
VFA were chosen to emulate the proportions found in the steady-state reactor without ME
(Section 2.2.1). All experiments were performed in triplicate, keeping 60 mL of broth in a 120 mL
penicillin bottle at 34°C on a shaker. Samples were taken on day 0, day 2 and day 4.
To test the influence of VFA inhibition on the community itself, the triplicates were put together
after 4 days and centrifuged at 8500g for 7 minutes. Supernatant was removed and supernatant of
thin stillage, also centrifuged at 8500g for 7 minutes, was added. Solids were resuspended and the
broth was distributed over triplicate experiments, consisting of 60 mL of broth in a 120 mL
penicillin bottle. A second control experiment, in duplicate, was added at this point, where
supernatant of fresh thin stillage was kept in identical conditions as the other experiments to
measure the baseline VFA-production. Samples were taken at the beginning of the second part of
the experiment and after 3 days at 34°C (day 7 of the batch experiment).
Methanogen control by application of pH-shock A hypothesis was put forward that a pH-shock could be applied to remove methanogens from
fermenting or digesting reactors. To test this hypothesis, effluent from a mesophilic digester
producing CH4 was used in a batch test in which a pH-shock was applied. 80 mL of digester
effluent, containing 16.7±2.6 g VS.L-1 was put in a penicillin bottle after which 0.25 mL of glycerol
was added as a carbon source to reach a dosing of approx. 0.25 g COD.g VS-1. A magnetic stirrer
was used to mix the broth in the penicillin bottle during the experiment. Gas production and
composition as well as VFA-production wer monitored over time. After 6 days the penicillin bottle
was opened and a solution of 2M HCl was added to decrease pH to approximately pH 5.5 as well
as another 0.25 mL of glycerol as carbon source. After 2 days, pH was increased to 7 by addition
of 2M NaOH. The penicillin bottles were stored at 34°C for another 8 days. An identical
23
experiment was set up as a control where the 2M NaCl was added to achieve the same increase in
Electrical Conductivity (EC). To test how short the pH shock could be, another identical
experiment was set up where the pH was increased back to 7 after 1 day at pH 5.5. All experiments
were performed in triplicate in a temperature-controlled room at 34°C.
Shocking community with pH and VFA to influence production A similar experiment as described in Section 2.5.1 was performed to test the hypothesis that
shocking a community with a specific VFA can influence the product outcome after restoring pH.
Fresh thin stillage at pH 7 was shaken for 1 day at 120 rpm at 34°C to allow growth of a fermenting
community. Fresh thin stillage was then inoculated with the acclimated thin stillage. In a first
experimental test 15 g.L-1 Ac was added to the inoculated thin stillage, while in a second experiment
15 g.L-1 of Pr was added. A control experiment consisted of adding an equal volume of
demineralised water to the inoculated broth. All experiments were corrected to pH 5.5. Penicillin
bottles of 120 mL were filled with 60 mL of broth and kept at 34°C for 2 days, sampling on day 0.
pH was corrected to 5.5 on day 1. On day 2, samples were taken, the broth was centrifuged for 7
min at 8500g and supernatant from the broth was removed and replaced with supernatant from
centrifuged fresh thin stillage. The centrifuged solids were then resuspended and pH was corrected
to 7. The resuspended broth (approx. 50 mL) was put in 120 mL penicillin bottles and kept at
34°C. An additional control experiment was added to provide information about baseline auto-
fermentation of the supernatant of centrifuged thin stillage by keeping 30 mL of thin stillage
supernatant (pH 7) at 34°C in duplicate. pH was corrected to pH 7 on day 3 and 6.

24

25
Results Stream characterisation
Figure 6. Stream characterisation of thin stillage. Figure A shows composition of the total organic fraction. Figure B
shows the composition of the reactive fraction in detail. Note the difference in range on the axis of both figures.
The results of the detailed stream characterisation of thin stillage can be seen in Figure 6. Figure
6A shows the composition of the total organic fraction in thin stillage. Solids comprise
approximately one third of the total COD in thin stillage (55.5 g total COD.L-1 with 19.5 g solid
COD.L-1). Even though these solids have not been wholly identified, nearly half of the solids may
consist of insoluble proteins (8.9±0.9 gCOD.L-1) assuming that all the nitrogen measured in the
TKN analysis accounts for proteins or protein fragments. Previous work by Y. Kim et al. (2008)
puts dry, crude protein content at approximately 0.8 g.L-1 or 1.6 gCOD.L-1 in thin stillage. Some
nitrogen will be present as lignin fragments. The lignin content of corn is about 2 to 4% and may
account for up to around 5 gCOD.L-1 in this thin stillage, considering that lignin may pass through
the EtOH fermentation step unreacted. We were not able to accurately quantify the nitrogenous
lignin fragments in this study. Other potential candidates for the remainder of the solids (‘Other
Solids’ in Figure 6) are phenolic fragments, which could include ferulic, humic and fulvic acids, and
lignocellulosic fragments. A one-point analysis of phenolics in thin stillage determined a
concentration of 1.24 g.L-1, which could account for 2.96 gCOD.L-1, if this fraction was entirely
made up of phenol. This data is not included in Figure 6A because no distinction could be made
between the soluble and solid phenolics. Analysis of the carboyhydrate oligomers in these
lignocellulosic compounds performed in literature shows that the main oligosaccharides present
are glucan and xylan (oligomers containing resp. glucose and xylose) while arabinan (arabinose
oligomer) is present in lower concentrations (Kim et al., 2008).
Soluble organics account for a total of 36.6±2.5 gCOD.L-1. A large part of this soluble organics
fraction has been aggregated in the ‘Reactive Fraction’. These are the organic compounds that are

26
easily consumed by fermenting organisms and converted to VFA. As Figure 6B shows, the main
part of this fraction is glycerol (9.8±2.4 gCOD.L-1) followed by the cellulosics fraction (12.3±0.7
gCOD.L-1). The sugar monomers present in this cellulosic fraction are mainly glucose, xylose and
arabinose (respectively 4.7±0.7 gCOD.L-1, 4.5±0.5 gCOD.L-1 and 3.1±0.4 gCOD.L-1). EtOH,
Lactate and a VFA-mixture consisting mainly of Ac complete the Reactive Fraction with 0.8±0.6
gCOD.L-1, 2.1±1.0 gCOD.L-1 and 0.3±0.2 gCOD.L-1 respectively. Soluble proteins account for
6.13±1.3 gCOD.L-1 of the soluble COD. The remainder of this sCOD (4.6 gCOD.L-1) is referred
to as ‘Other’, most likely consisting of fats, oils and biomass.
When comparing the results of the Reactive Fraction analysis with literature analysis of thin stillage,
the same compounds are found, but concentrations vary. Differences between production plants
in the way corn is treated for production of bio-EtOH as well as variations in the process of a
single bio-EtOH plant can contribute to variations in thin stillage composition. Kim et al. (2008)
obtained glucose, xylose and arabinose concentrations of respectively 1.0, 0.7 and 0.4 gCOD.L-1,
(i.e. lower than concentrations determined in this study). On the other hand, glycerol and especially
lactic acid concentrations were much higher, 17.5 g.L-1 and 17.9 g.L-1 respectively. Comparison of
other characteristics of the thin stillage used in this study with literature shows a wide variation in
thin stillage composition. A literature review of stillage by Wilkie et al. (2000) reports a corn thin
stillage pH of 3.6, whereas the pH in this study was 4.86±0.15 (see Table 4). That same review
mentions nitrogen concentrations up to 0.880 mgN.L-1, whereas the thin stillage used in this study
contains 1.50±0.25 gTKN.L-1, nearly twice as high while not all nitrogen species (e.g. nitrate, nitrite)
are accounted for with TKN. Total COD concentrations correspond rather well with Wilkie et al.
(2000), reporting COD concentrations between 59.4 and 64.5 gCOD.L-1 while the thin stillage used
here contained 53.9±8.0 gCOD.L-1. Other studies obtained higher concentrations, up to 131
gCOD.L-1 (Lee et al., 2011). TS in the thin stillage are lower than most values reported in literature.
While TS in this study are 4.37±0.26%, Lee et al. (2011) report values between 65.9 and 74.9 g.L-1,
Kim et al. (2008) obtain a value of 7.7% dry matter.
Electro-Fermentation In the fermentation process, ME can be applied to separate and recover the products obtained
during fermentation. An applied current across the electrochemical cell results in the extraction of
VFA by migration of the anionic dissociated form over the AEM. Not only are VFA extracted, but
H2O in the thin stillage is being reduced at the cathode resulting in production of H2 and OH-.
These products in turn may influence the fermentation process by changing the thermodynamic
balances of the reactions taking place.
Influence of EF on VFA-production The practical set-up used for the fermentation experiments performed with application of ME was
shown in Figure 5. As feeding was performed manually every two days, no feeding pump was
necessary. This reduced the complexity of the practical set-up (e.g. a fridge nearby was not
necessary for feed storage), although it resulted in a less continuous reactor as fresh substrate was
dosed in pulses. Experiments were performed in a temperature-controlled room, in this case at

27
34°C, which again resulted in a less complex set-up as no heating of the fermentation broth was
necessary (e.g. with a heating mantel requiring a warm water bath).
Figure 7. VFA-concentrations in the control experiment at pH 5.5
Figure 7 shows the VFA-concentration in the fermentation broth over the course of the control
experiment (i.e. without ME). After start-up over the first HRT, the VFA-profile reached a
relatively stable concentration very quickly. Especially the period from day 28 onwards displayed
very stable VFA-concentrations.
Figure 8. VFA-concentrations in experiment with electrolytic extraction at pH 5.5. VFA-concentrations are the sum
of the concentrations in catholyte (fermenter broth) and anolyte.
The figure above shows the VFA-profile in the case of EF. This is the sum of the VFA present
both in the fermentation broth and the anolyte. The focus of this experiment on the influence of
electrolysis on the fermentation as opposed to the optimisation of VFA-extraction is important to
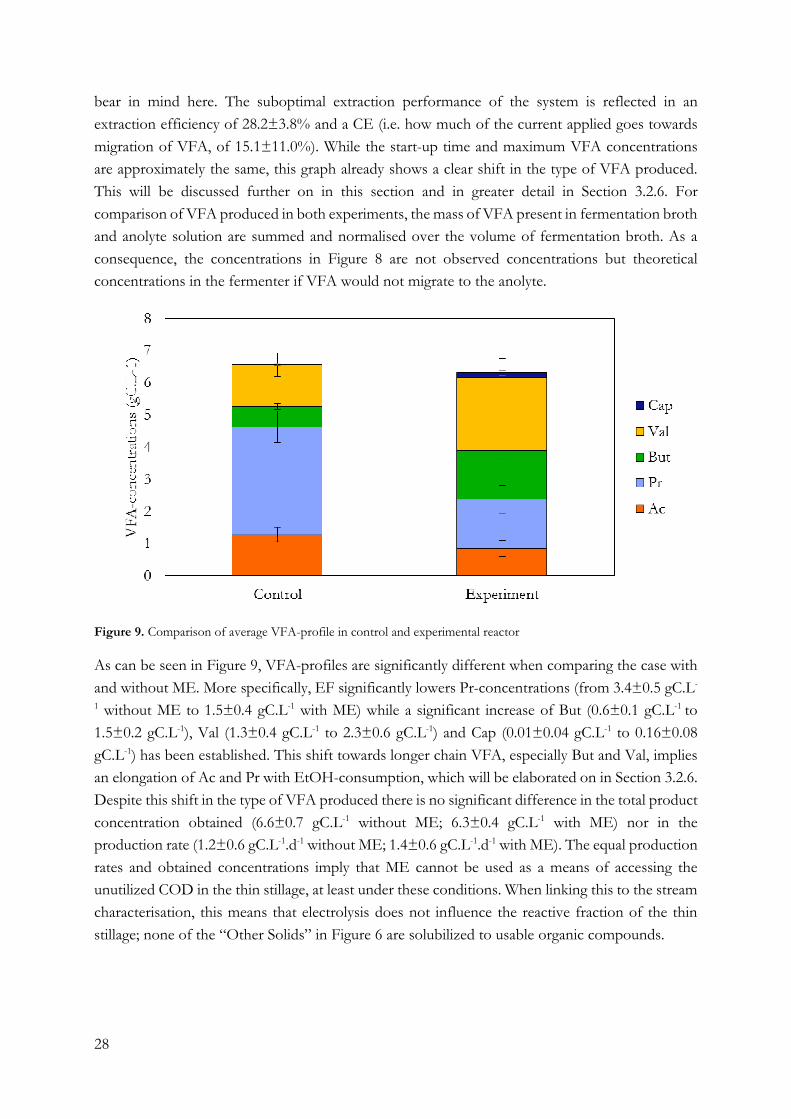
28
bear in mind here. The suboptimal extraction performance of the system is reflected in an
extraction efficiency of 28.2±3.8% and a CE (i.e. how much of the current applied goes towards
migration of VFA, of 15.1±11.0%). While the start-up time and maximum VFA concentrations
are approximately the same, this graph already shows a clear shift in the type of VFA produced.
This will be discussed further on in this section and in greater detail in Section 3.2.6. For
comparison of VFA produced in both experiments, the mass of VFA present in fermentation broth
and anolyte solution are summed and normalised over the volume of fermentation broth. As a
consequence, the concentrations in Figure 8 are not observed concentrations but theoretical
concentrations in the fermenter if VFA would not migrate to the anolyte.
Figure 9. Comparison of average VFA-profile in control and experimental reactor
As can be seen in Figure 9, VFA-profiles are significantly different when comparing the case with
and without ME. More specifically, EF significantly lowers Pr-concentrations (from 3.4±0.5 gC.L-
1 without ME to 1.5±0.4 gC.L-1 with ME) while a significant increase of But (0.6±0.1 gC.L-1 to
1.5±0.2 gC.L-1), Val (1.3±0.4 gC.L-1 to 2.3±0.6 gC.L-1) and Cap (0.01±0.04 gC.L-1 to 0.16±0.08
gC.L-1) has been established. This shift towards longer chain VFA, especially But and Val, implies
an elongation of Ac and Pr with EtOH-consumption, which will be elaborated on in Section 3.2.6.
Despite this shift in the type of VFA produced there is no significant difference in the total product
concentration obtained (6.6±0.7 gC.L-1 without ME; 6.3±0.4 gC.L-1 with ME) nor in the
production rate (1.2±0.6 gC.L-1.d-1 without ME; 1.4±0.6 gC.L-1.d-1 with ME). The equal production
rates and obtained concentrations imply that ME cannot be used as a means of accessing the
unutilized COD in the thin stillage, at least under these conditions. When linking this to the stream
characterisation, this means that electrolysis does not influence the reactive fraction of the thin
stillage; none of the “Other Solids” in Figure 6 are solubilized to usable organic compounds.

29
Solids decrease and ME
Figure 10. Solids behaviour in the control reactor and reactor with ME. Figure A shows TSS concentrations over time
in the reactors. Black lines indicate case without ME, red lines case with ME. Full lines correspond with feed, dashed
lines with effluent. Figure B shows average TSS-degradation rate in the control and experimental reactor (for both
periods with and without ME). The vertical line indicates stopping of electrolytic extraction to test reversibility of ME.
Even though solid organics were not made accessible by ME, for instance by increased hydrolysis
of solids at the cathode, it appears a decrease in solids content did take place when ME was applied.
This can be seen in Figure 10A. The average solids concentration in the reactor with ME (11.5±1.7
gTSS.L-1) was much lower than both the feed of the reactor (20.9±1.7 gTSS.L-1) and the effluent
of the reactor without ME (18.5±2.2 gTSS.L-1). This results in a higher average rate of solids
decrease in the reactor with ME (3.9±1.9 gTSS.L-1.d-1) compared to the case without ME (0.1±1.3
gTSS.L-1.d-1) as shown in Figure 10B. Neither VFA-production nor the COD-balance are affected
by this decrease in solids, so electrolysis does not appear to hydrolyse nor degrade solids. The
mechanism for this removal has not yet been explained but it seems likely that some form of
electro-coagulation is taking place.
Electro-coagulation is a 3 step process that shows many similarities to the conventional coagulation
process. In a first step an electrode is oxidised to produce a coagulant, usually a multivalent metal
ion such as Al3+ or Fe3+. This coagulant can destabilise the contaminant present in the water.
Contaminants treated by electro-coagulation usually have a negative charge, as is the case for
phosphates, suspended solids such as clay particles, etc. This negative charge also means a diffuse
double layer of positively charged counter ions is present around the contaminant. The multivalent
ions produced by the electrode oxidation can reduce the thickness of this double layer and
neutralise the charge of the contaminants. At this point contaminant particles or molecules are no
longer electrostatically repelled by one another and coagulation can take place under the influence
of the Van Der Waals attraction. Since the particles or contaminants have been neutralised, this
30
does not result in a build-up of charge allowing continued coagulation and eventually results in floc
formation. Any colloidal particles that still remain at this point can be trapped in the sludge blanket
formed by the coagulation. As this process can remove contaminants with little to no chemical
usage, its main application has been as a water treatment technology (Mollah et al., 2004). This
process can precipitate soluble contaminants through coagulation, while in EF the opposite appears
to take place (i.e. solubilisation of solids after destabilisation). Future research is necessary to
establish whether this reversal of the electro-coagulation process is possible and its detailed
mechanism causing the decrease in solids as well as the potential of using electro-coagulation to
stabilise the colloids in thin stillage. Further experiments into this phenomenon are outside the
bounds of this study.
After the 3 HRT of fermentation with ME, applied current was reduced to 0 A for a period of 2
HRT. The first being 6 days while the second was 12 days, cf. Section 2.2.3. This experiment was
performed to investigate whether the effect of ME on the solids decrease was reversible. The main
observation over this period was a rise in solids concentration as shown in Figure 10A, returning
to that of the control reactor. As shown in Figure 10B, the rate of solids increase was 0.4±1.1
gTSS.L-1.d-1, which is significantly higher than the 3.9±1.9 gTSS.L-1.d-1 decrease when ME was
applied and at the same time being insignificantly different from the degradation rate in the control
reactor (-0.1±1.3 gTSS.L-1.d-1). An increase in solids concentrations and solids degradation rates
similar to those found in a reactor without ME seems to imply that the effects of ME on the solids
decrease are reversible. Electro-coagulation can again be used to explain this reversibility, as this
would have no lasting effects after removing the current.
Considering the decrease of total suspended solids with ME, the extended HRT (12 days, cf.
Section 2.2.3) experiment was executed to observe if a decrease in solids would occur at a longer
HRT, implicating a hastening of some inherent solids hydrolysis by adding current. As mentioned
before, solids concentration actually increased over this period in the reactor. VFA-concentrations
also increased in this 12-day HRT period to 7.8±0.3 gC.L-1 as opposed to 6.6±0.8 gC.L-1, which is
in accordance with a study on the influence of extended HRT and VFA-production (Colmenarejo
et al., 2004). That same study also concluded that hydrolysis of solids increases at longer HRT, due
to a larger decrease in solids, which seems to contradict the increase in solids over the 12-day HRT
period observed here. These contradictory conclusions could be the result of using a new batch of
thin stillage during the 12 day HRT period, influencing the fermentation in the reactor.
Substitution of NaOH by Membrane Electrolysis The reduction of the fermentation broth in the electrochemical cell generates hydroxide ions which
can replace caustic dosing used for pH control in a conventional reactor. The control reactor at
pH 5.5 required an average of 25.0±17.1 mL NaOH.d-1 to maintain the pH, while the experimental
reactor required no NaOH dosing to maintain a pH of 5.5 when electrolytic extraction was applied.
pH would actually increase if a current of 100 mA was maintained for longer than approximately
24 hours so acidic anolyte from the previous period was used to control pH at a maximum of 5.7.
After 20 to 24 hours current was manually decreased from 100 mA to 10-20 mA to reduce anolyte
dosing. This is done because overdosing of anolyte solution implies an unwanted return of

31
extracted VFA to the fermentation broth, resulting in energy for extraction being wasted, as
continued extraction at high current requires both more energy and increased dosing of anolyte. In
a fully realised system, an electronic control system could be used to control current to maintain
pH at a desired setpoint, removing the necessity for dosing of anolyte.
This shows that NaOH-dosing can be substituted by electrolytic OH- production without any
significant change in total VFA production. The applied current could be coupled to the measured
pH in the reactor to obtain a more efficient pH-control, which in turn can result in a system that
does not require the dosing of anolytic acid.
Influence of HRT reduction Apparently, much of the fermentation took place in the first 24 hours after feeding due to the
observation that applied current needed to be reduced to avoid a pH-overshoot, as discussed in
the previous section. Therefore HRT was reduced to 3 days for a 3 × HRT experiment. A logical
consequence of this halved HRT is a doubling of the OLR into the reactor. The anolyte solution
did not follow the reduction to a 3-day HRT but VFA were accumulated in 600 mL of anolyte
solution to monitor the behaviour of extraction at increased VFA-concentrations in the anolyte.
Current was constantly maintained at 100 mA during this phase of the reactor operation. For
comparison with other experimental results (see Section 3.2.1), concentrations in the reactor were
calculated by summing the mass of VFA in the fermentation broth with the increase of mass in the
anolyte solution and dividing this by the reactor volume (1.2 L). As a consequence, concentrations
reported below are not actually observed concentrations, but concentrations that would be found
in the reactor without extraction of VFA.
Figure 11. VFA-profile in the catholyte over the 9 days of the 3-day HRT experiment.
Figure 11 shows the concentrations of all VFA over the course of the 3 HRT. During the first
HRT, VFA are built-up in the fermentation broth, while the following HRTs show a fairly constant
VFA-profile. From this graph it is already visible that much of the increase in VFA is due to an

32
increased Pr concentration. The total VFA-production rate increased to 2.7±1.0 gC.L-1.d-1, which
is nearly twice the production rate when ME was applied with an HRT of 6 days. This doubling of
the production rate when OLR doubles suggests that it is not the reaction rate which limits VFA-
production but OLR itself. Consequently, increasing OLR even further by decreasing HRT might
further increase the production rate.
Figure 12. Comparison of the VFA-profile with a 6-day and 3-day HRT when ME is applied.
When comparing the VFA-profile in the case for the 3-day HRT and 6-day HRT, as shown in
Figure 12, it becomes clear that But and Val decrease (23.8±3.4% to 8.9±0.6 % for But; 35.6±7.9%
to 20.9±1.5% for Val), while Pr, Cap and Hep increase significantly (24.5±7.5% to 39.0±0.3% for
Pr; 2.4±1.1% to 12.8±1.5% for Cap; 0% to 1.4±0.3% for Hep). These changes indicate a trend for
decreased elongation as the fraction of Ac and Pr increases significantly (38.1±11.3% to
55.9±3.0%). The elongation that does take place in the fermenter is continued to the end products
(Cap and Hep) much more at a 3-day HRT than it is at a 6-day HRT.
Figure 13. Accumulation of anions in the anolyte solution during the 3-day HRT experiment.
The membrane used for separation of the anolyte and catholyte is an AEM. As this is not selective
for anionic VFA only, other anionic species can also migrate from catholyte to fermenter. An anion
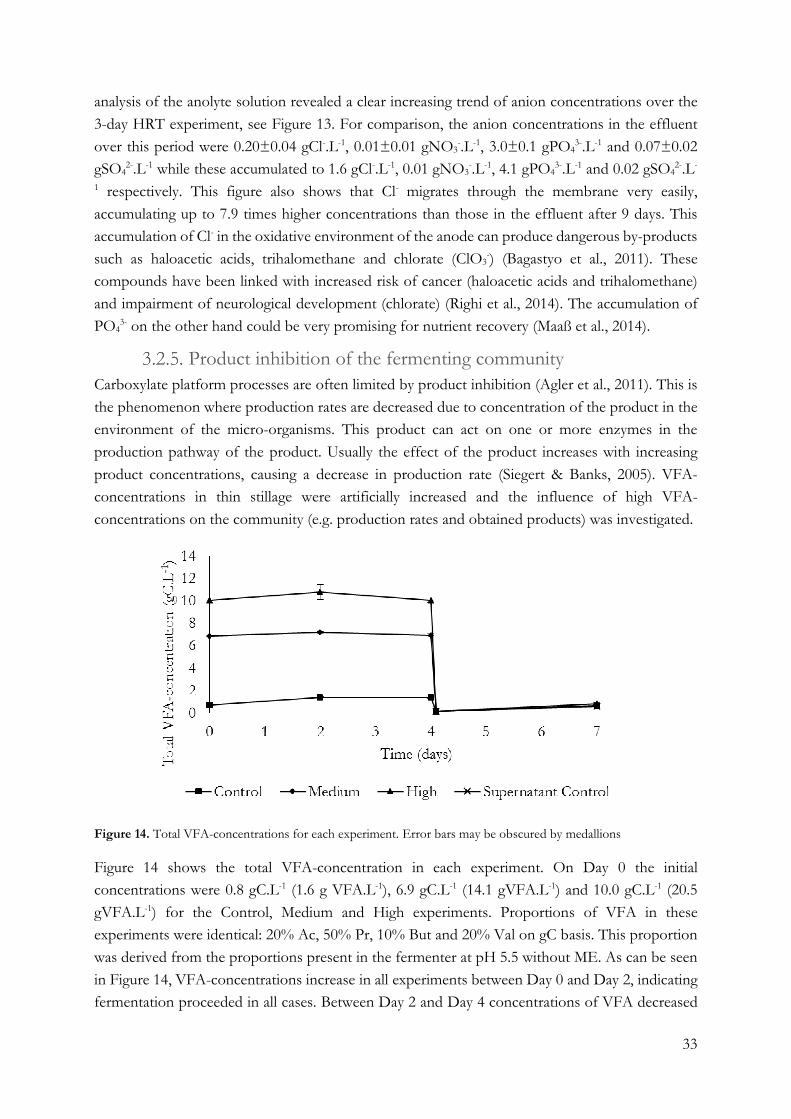
33
analysis of the anolyte solution revealed a clear increasing trend of anion concentrations over the
3-day HRT experiment, see Figure 13. For comparison, the anion concentrations in the effluent
over this period were 0.20±0.04 gCl-.L-1, 0.01±0.01 gNO3-.L-1, 3.0±0.1 gPO4
3-.L-1 and 0.07±0.02
gSO42-.L-1 while these accumulated to 1.6 gCl-.L-1, 0.01 gNO3
-.L-1, 4.1 gPO43-.L-1 and 0.02 gSO4
2-.L-
1 respectively. This figure also shows that Cl- migrates through the membrane very easily,
accumulating up to 7.9 times higher concentrations than those in the effluent after 9 days. This
accumulation of Cl- in the oxidative environment of the anode can produce dangerous by-products
such as haloacetic acids, trihalomethane and chlorate (ClO3-) (Bagastyo et al., 2011). These
compounds have been linked with increased risk of cancer (haloacetic acids and trihalomethane)
and impairment of neurological development (chlorate) (Righi et al., 2014). The accumulation of
PO43- on the other hand could be very promising for nutrient recovery (Maaß et al., 2014).
Product inhibition of the fermenting community Carboxylate platform processes are often limited by product inhibition (Agler et al., 2011). This is
the phenomenon where production rates are decreased due to concentration of the product in the
environment of the micro-organisms. This product can act on one or more enzymes in the
production pathway of the product. Usually the effect of the product increases with increasing
product concentrations, causing a decrease in production rate (Siegert & Banks, 2005). VFA-
concentrations in thin stillage were artificially increased and the influence of high VFA-
concentrations on the community (e.g. production rates and obtained products) was investigated.
Figure 14. Total VFA-concentrations for each experiment. Error bars may be obscured by medallions
Figure 14 shows the total VFA-concentration in each experiment. On Day 0 the initial
concentrations were 0.8 gC.L-1 (1.6 g VFA.L-1), 6.9 gC.L-1 (14.1 gVFA.L-1) and 10.0 gC.L-1 (20.5
gVFA.L-1) for the Control, Medium and High experiments. Proportions of VFA in these
experiments were identical: 20% Ac, 50% Pr, 10% But and 20% Val on gC basis. This proportion
was derived from the proportions present in the fermenter at pH 5.5 without ME. As can be seen
in Figure 14, VFA-concentrations increase in all experiments between Day 0 and Day 2, indicating
fermentation proceeded in all cases. Between Day 2 and Day 4 concentrations of VFA decreased

34
significantly for the Medium experiment (7.20±0.07 gC.L-1 to 6.93±0.13 gC.L-1) while no significant
change was noted in the Control experiment and the High experiment. On Day 4 all triplicates
were put together and centrifuged. The supernatant was removed and replaced with an equal
volume of supernatant from centrifugation of fresh thin stillage after which solids were
resuspended. These resuspended broths were split in triplicates and then fermented for 3 additional
days at 34°C. As a control experiment, a duplicate with thin stillage supernatant was also added to
the experiment. Due to a lack of samples after resuspension on Day 4, the assumption is made that
VFA-concentrations in the resuspended broths are equal to the VFA-concentration of the fresh
thin stillage supernatant. On Day 7 only the concentration in the High experiment is significantly
different from the concentration in the Supernatant Control (0.82±0.08 gC.L-1 for High; 0.64±0.04
gC.L-1 for Supernatant Control).
Figure 15. Total VFA-production rates for all experiments. Note that ‘Supernatant Control’ has only 1 datapoint (Day
7).
When studying the influence of product inhibition, the best comparison can be made by using
production rates as a measure for activity. Production rates are shown in Figure 15. On Day 2
production rates in the Medium experiment were significantly lower than in the control case
(0.16±0.03 gC.L-1.d-1 for Medium; 0.33±0.03 gC.L-1.d-1 for Control), while the High experiment
was not significantly different from either (0.38±0.33 gC.L-1.d-1). On Day 4 all production rates
were insignificantly different, although only the Medium case showed a significantly negative
production (-0.02±0.07 gC.L-1.d-1 for Control; -0.13±0.09 gC.L-1.d-1 for Medium; -0.37±0.39 gC.L-
1.d-1 for High). Similar to the total VFA-concentrations, only the production rate for the High case
was significantly higher on Day 7 than the control case (0.21±0.03 gC.L-1.d-1 for High;0.16±0.00
for Control).
Several causes might have led to this difference on Day 7. pH was not controlled in the batch tests
which means pH could decrease by acidogenic fermentation to a stable pH. Since VFA have a pKa
around 4.8 their buffering capacity is the largest between approximately pH 4 and pH 5.5 (see

35
Section 1.5.1). The same VFA-production results in a smaller pH-decrease when VFA-
concentrations are higher in the broth. As a result, pH on Day 4 was significantly higher in the
Medium and High experiments compared to the control case (Control: 4.01±0.01; Medium
4.83±0.00; High: 4.99±0.02). The higher pH in the High experiment might be the reason for the
slightly increased activity after centrifuging as the lower pH might be inhibitory for the acidogenic
fermenters. The increased production rate might also be a result of the assumption that the VFA-
concentration in the broth was equal to the VFA-concentration in the fresh thin stillage
supernatant. If the solids portion of the fermentation broth after centrifugation still contained some
VFA, concentrations might have been higher than in the thin stillage supernatant. This increased
concentration at the start would then result in an increased concentration at the end of the
experiment, resulting in an apparent higher production rate.
Biochemical pathway analysis Although no specific experiments were carried out to test the biochemical pathways catalysed
during this fermentation, the substrate (cf. stream characterisation) and the obtained products can
give some insight into the biochemical reactions in the fermenter with and without ME.
3.2.6.1. Speculation on biochemical pathways present
The three main substrates for fermentation present in the thin stillage (i.e. cellulosics, glycerol and
lactate) each have specific biochemical pathways for fermentation resulting in different products.
Figure 16. Simplified representation of the fermentation pathways leading from glycerol, glucose and lactate to Pr or
Ac (Barbirato et al., 1997)
The glycerol present in the fed thin stillage is most likely converted into Pr, as can be seen in Figure
16 (Barbirato et al., 1997). The pathway towards Pr production can also be used to ferment glucose
and lactate, both present in the broth, towards Pr. For reasons that will be elaborated on further
(Section 3.2.6.2) it seems likely that lactate is also fermented at least partly to Pr, while glucose
appears to result mainly in other products such as Ac and But.

36
Figure 17. Fermentation pathways starting from
glucose, resulting in a mix of glycerol, lactate, Pr,
EtOH (Temudo et al., 2007)
Figure 18. Fermentation pathway for the initial
conversion of xylose to pyruvate. After this conversion
the pathway proceeds as shown in Figure 17 (adapted
from Temudo et al., 2009)
Cellulosics fermentation depends on the type of sugar as can be seen in Figure 17Figure 18.
Anaerobic fermentation of glucose and xylose monomeric sugars takes place through pyruvate as
an intermediate. The reactions taking place to reach this pyruvate are dependent on the type of
monomer being processed. While glucose is converted into glyceraldehyde-3-phosphate and
subsequently to pyruvate by glycolysis (Temudo et al., 2007), xylose, which is a five carbon (C5)
sugar as opposed to the six carbon (C6) glucose, is first converted into xylulose-5-phosphate before
conversion into glyceraldehyde-3-phosphate. Because xylose is a C5-sugar, conventional glycolysis
through the Embden-Mayerhof-Parnas Pathway is not possible. Two alternative pathways can then
be applied, namely the Pentose Phosphate Pathway (PPP) or Phosphoketolase Pathway (PKP).
Both result in the conversion from xylulose-5-phosphate to glyceraldehyde-3-phosphate, which
can then be converted into pyruvate cf. regular glycolysis. According to Rodríguez et al. (2006)
fermentation of glucose predominantly yields Ac, But or EtOH depending on pH, H2-pressure and
substrate concentration. For instance, an increase in H2-pressure (e.g. by cathodic reduction of
H2O) results in an increased butyrate concentration. The other possible outcomes of the glucose
fermentation pathway such as glycerol, succinate, formate and lactate are usually present in lower
concentrations (Rodríguez et al., 2006; Temudo et al., 2007). Due to xylose fermentation through
different pathways (PPP or PKP), the resulting product profile contains more But and less EtOH
compared to glucose fermentation (Temudo et al., 2009).
The lactate present in the thin stillage can be converted into Ac and Pr (Seeliger et al., 2002;
Barbirato et al., 1997), while lactate can also be used to elongate Ac to butyrate in the presence of
H+ (Spirito et al., 2014). Lactate is not the conventional substrate used for chain elongation of VFA
as typically EtOH is used (Bornstein & Barker, 1948). This elongation results in transformation of
Ac to But and But to Cap or Pr to Val which can in turn be elongated to Hep. Multiple sources of
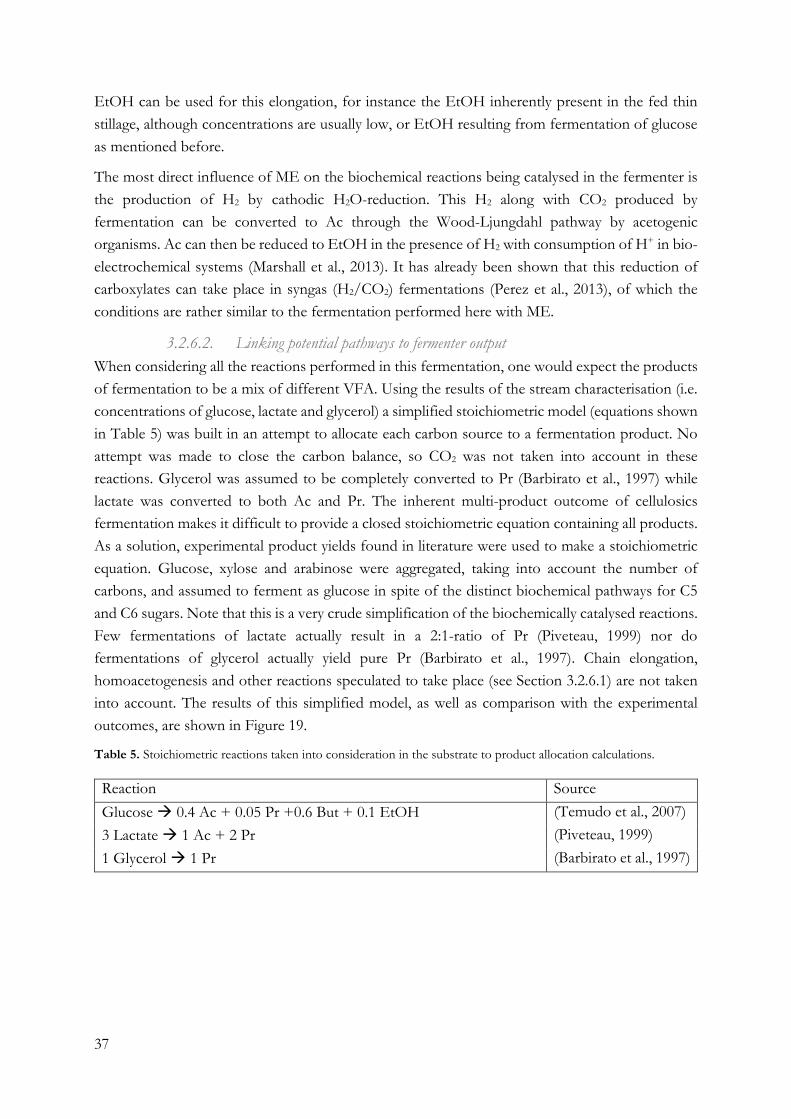
37
EtOH can be used for this elongation, for instance the EtOH inherently present in the fed thin
stillage, although concentrations are usually low, or EtOH resulting from fermentation of glucose
as mentioned before.
The most direct influence of ME on the biochemical reactions being catalysed in the fermenter is
the production of H2 by cathodic H2O-reduction. This H2 along with CO2 produced by
fermentation can be converted to Ac through the Wood-Ljungdahl pathway by acetogenic
organisms. Ac can then be reduced to EtOH in the presence of H2 with consumption of H+ in bio-
electrochemical systems (Marshall et al., 2013). It has already been shown that this reduction of
carboxylates can take place in syngas (H2/CO2) fermentations (Perez et al., 2013), of which the
conditions are rather similar to the fermentation performed here with ME.
3.2.6.2. Linking potential pathways to fermenter output
When considering all the reactions performed in this fermentation, one would expect the products
of fermentation to be a mix of different VFA. Using the results of the stream characterisation (i.e.
concentrations of glucose, lactate and glycerol) a simplified stoichiometric model (equations shown
in Table 5) was built in an attempt to allocate each carbon source to a fermentation product. No
attempt was made to close the carbon balance, so CO2 was not taken into account in these
reactions. Glycerol was assumed to be completely converted to Pr (Barbirato et al., 1997) while
lactate was converted to both Ac and Pr. The inherent multi-product outcome of cellulosics
fermentation makes it difficult to provide a closed stoichiometric equation containing all products.
As a solution, experimental product yields found in literature were used to make a stoichiometric
equation. Glucose, xylose and arabinose were aggregated, taking into account the number of
carbons, and assumed to ferment as glucose in spite of the distinct biochemical pathways for C5
and C6 sugars. Note that this is a very crude simplification of the biochemically catalysed reactions.
Few fermentations of lactate actually result in a 2:1-ratio of Pr (Piveteau, 1999) nor do
fermentations of glycerol actually yield pure Pr (Barbirato et al., 1997). Chain elongation,
homoacetogenesis and other reactions speculated to take place (see Section 3.2.6.1) are not taken
into account. The results of this simplified model, as well as comparison with the experimental
outcomes, are shown in Figure 19.
Table 5. Stoichiometric reactions taken into consideration in the substrate to product allocation calculations.
Reaction Source
Glucose 0.4 Ac + 0.05 Pr +0.6 But + 0.1 EtOH (Temudo et al., 2007)
3 Lactate 1 Ac + 2 Pr (Piveteau, 1999)
1 Glycerol 1 Pr (Barbirato et al., 1997)

38
Figure 19. Comparison of product profiles obtained in Control and Experiment reactors and the outcome of a
simplified stoichiometric reaction model based on stream characterisation of thin stillage.
The figure above shows that the stoichiometric model closely mimics the actual fermentation
process, despite the assumptions. The total concentration of the substrates and products according
to these conversion reactions is 6.9 gC.L-1 - which closely fits the 7.2±0.8 gC.L-1 and 6.9±0.4 gC.L-
1 of the control and electro-fermentation experiment respectively. Comparison between the model
and the experiments is made by studying concentrations of Ac-But-Cap and Pr-Val instead of
focusing on the specific obtained VFA, due to chain elongation not being integrated in the model.
Comparing these figures, a rather similar structure of the fermentation outcome is obtained. The
calculated concentrations of Ac-But-Cap are outside the uncertainty range of the control
experiment, although no uncertainty was calculated in the product allocation. The calculated
concentrations do fall in the range of the EF experiment (Ac-But-Cap: 2.6 gC.L-1 calculated;
1.9±0.3 gC.L-1 for Control; 2.5±0.3 gC.L-1 for Experiment). The same is true for Pr-Val
concentrations; calculated concentrations are outside the uncertainty range of the control
experiment but are inside the range of concentrations obtained during EF (Pr-Val: 3.8 gC.L-1
calculated; 4.7±0.5 gC.L-1 for Control; 3.8±0.4 gC.L-1 for Experiment). Further, the fermentation
of cellulosics does not appear to follow the stoichiometrics obtained from glucose fermentation in
literature, possibly due to the C5-sugars or the use of a non-synthetic medium for the fermentation
experiments, contrary to the experiments found in literature. Modeling of the fermentation was,
however, not the purpose of this research and the similarity obtained between a theoretical and
experimental fermentation are striking enough to conclude that these reactions might account for
at least some of the fermentative conversions.

39
Figure 20. Comparison of VFA-output from fermentation with and without ME
When ME is applied, a shift can be seen in the reactions occurring. The proportion of Pr drops
while Val increases, as can be seen in Figure 8 and Figure 20, indicating chain elongation of Pr to
Val. As mentioned in Section 0 these differences are significant, as are the increase in But and Cap
concentration.
Figure 21. Comparison of relative proportions of Ac, But and Cap compared to Pr and Val
Figure 21 shows total carbon in the form of Pr and Val has decreased by EF from 4.6±0.5 gC.L-1
to 3.8±0.4 gC.L-1. While this decrease is not significant, the increase of total carbon in the form of
Ac, But and Cap is, as this rises from 1.9±0.3 gC.L-1 to 2.5±0.3 gC.L-1. This is the result of a shift
in VFA production from Pr and Val to Ac, But and Cap. Because of the equal end concentrations,
the increase in Ac-But-Cap and decrease in Pr-Val match nearly completely, implying that the shift
could be the result of increased Pr-degradation by acetogenic processes to Ac, H2 and CO2. The
CO2 coming from this process could subsequently be used by homoacetogenic organisms to
produce Ac. Another explanation of this shift might be otherwise changed thermodynamic
equilibria due to increased H2-presence resulting in a shift from Pr to Ac, e.g. decreased conversion
of pyruvate to Pr and an increase towards Ac as shown in Figure 16.

40
Figure 22. Comparison of proportions of short VFA (Ac, Pr) and longer VFA (But, Val, Cap)
As mentioned before in this section, applying ME results in more longer-chain VFA. Figure 22
confirms this result once more showing a clear shift from predominantly short-chain VFA (defined
as Ac and Pr in this study) without ME to a profile dominated by longer-chain VFA (defined as
But, Val and Cap in this study) with ME. Concentrations of the longer-chain VFA approximately
double from 1.9±0.4 gC.L-1 to 3.9±0.9 gC.L-1, a result of the significant increase in But, Val and
Cap concentrations. This strongly suggests that ME provides EtOH in some way to the reactor.
The most likely mechanism is the reduction of Ac in the presence of H2 to EtOH (Marshall et al.,
2013) especially considering the theoretical H2-production of 0.31 L H2.L reactor-1.d-1. EtOH
produced in this way can cause a shift from Pr to Val, Ac to But and But to Cap by chain elongation.
It should be noted that although elongation of Ac and Pr to But and Val respectively are taking
place, the elongation of But to Cap is not taking place at the same rate resulting in rather low Cap
concentrations. A possibility is that all the EtOH produced by Ac-reduction and glucose
fermentation is already used in the elongation now taking place, although this is unlikely as there is
still 1.61±0.09 gC.L-1 EtOH left. Another explanation might be that the But concentrations do not
rise high enough for elongation to Cap to start up (Agler et al., 2014).
The shift from Ac to But has been attributed to EtOH earlier in this section, although it is unsure
whether this rise in But and decrease of Ac is actually due to chain elongation or if it is the result
of a changed thermodynamic situation related to the increased H2-pressure as predicted by
Rodríguez et al. (2006).
The result of Electro-Fermentation is then a more reduced VFA-output. The application of ME
provides reductive force for the fermentation by H2-production resulting from cathodic H2O-
reduction. This H2 can drive the reduction of CO2 and Ac to Ac and EtOH respectively, the latter
of which can reduce the short-chain VFA (Ac and Pr) to longer-chain VFA (But, Val, Cap), but a
deeper analysis of the community is required to confirm this.
Community Analysis While the results of the Illumina-analysis are still pending, some speculations can be made regarding
the composition of the community. We assume the thin stillage has a microbial community present
in the broth as it is a complex, non-sterile organic broth, the waste fraction of the biological
fermentation to EtOH. Distillation around the water-EtOH azeotrope (approx. 80°C) is used to
41
separate the EtOH from the beer. This elevated temperature should eliminate most heat-sensitive
organisms, such as yeast (Banat et al., 1998), present in the beer. Some organisms can form heat-
resistant endospores which can survive the distillation process. Typical examples of such species
closely related with anaerobic (fermentation) processes are species belonging to the Clostridia and
Bacilli classes.
The wide range of substrates and accompanying conversion reactions allows the growth of a wide
range of micro-organisms, which implies a diverse community. Hollister et al. (2012) analysed the
metagenome of a mixed culture fermenting lignocellulosic waste to VFA. This analysis confirmed
that mesophilic fermenting communities are very diverse. The communities consisted mostly of
several Clostridium- and Bacillus-species while the most important other groups were Bacteroidia, such
as Bacteroides sp., and �-Proteobacteria, such as Klebsiella pneumonia. The feed used in this fermentation
process was pre-treated sorghum, which is vastly different from the thin stillage. No stream
characterisation data were available from the pre-treated sorghum, which makes it hard to
extrapolate the results to thin stillage fermentation. The apparent presence of some major
biochemical pathways as described in Section 3.2.6 can be used to link these pathways to micro-
organisms present in the fermenting community.
Glycerol fermentation to propionate for instance can be performed by some Propionibacterium
species or Clostridium propionicum (Barbirato et al., 1997). Some Propionibacterium species, such as P.
acnes, are sensitive to increased temperatures as less than 0.1% of cells are viable after a heat
treatment of 20 minutes at 80°C (Lyte et al., 2009). Their presence in fed thin stillage will then most
likely be negligible and glycerol fermentation to Pr could be performed by C. propionicum.
The Wood-Ljungdahl pathway to produce Ac from H2 and CO2 can be performed by several genera
such as Acetobacterium or Sporomusa. Acetobacteria do not form endospores so it is again unlikely that
they will be present in the community. Sporomusa and Clostridium ljungdahlii on the other hand do
possess the capacity to perform the Wood-Ljungdahl pathway (Leang et al., 2013) and form heat-
resistant endospores (Yutin & Galperin, 2013). As a consequence these are the most likely
acetogens to be present in the community. Besides the Wood-Ljungdahl pathway, C. ljungdahlii also
possesses the capability of reducing carboxylates to their corresponding alcohols, as do C. ragsdalei,
C. coskatii and C. autoethanogenum (Perez et al., 2013). While the carboxylate reduction is not a major
outcome of the performed experiments, it is the most likely mechanism producing EtOH from Ac
when ME is applied. This is especially likely since the experiments conducted by Perez et al. (2013)
used syngas (H2/CO2) fermentation while the headspace of the thin stillage fermentation with ME
also consisted mainly of H2 and CO2.
Several species can perform the fermentation of lactate to Ac and Pr such as Propionicum freudenreichii
and Pelobacter propionicus although these species are not capable of forming endospores. Therefore,
members of the Clostridia class are once again most likely to be present in the community to perform
this fermentation, i.e. C. homopropionicum, C. neopropionicum and Veillonella parvula (Seeliger et al., 2002;
Yutin & Galperin, 2013). Elongation of Ac to But with Lac has been shown possible by Megasphaera
elsdenii which is also capable of forming spores and thus may be present in the thin stillage (Marshall
et al., 2013; Yutin & Galperin, 2013). The presence of lactate in the thin stillage might indicate the

42
presence of Lactobacillae before distillation. Due to their inability to form endospores (Madigan et
al., 2012), it appears unlikely these will still be active in thin stillage.
A last key species that is likely to be present is Clostridium kluyveri which is capable of performing
chain elongation of VFA with EtOH (Bornstein & Barker, 1948). It has been established that this
species is often present in mixed microbial communities when chain elongation of VFA is the focus
(Van Eerten-Jansen et al., 2013; Steinbusch et al., 2011; Agler et al., 2012). As it appears very likely
- based on the VFA-profile - that chain elongation is taking place in EF, it is expected that C.
kluyveri will be present in the fermenting community.
These experiments demonstrate that ME can influence the VFA-profile from the fermentation
process by providing reducing power to the fermentation broth. This influence is limited to a slight
elongation of the produced VFA, while there is no significant effect on the total VFA output of
the process. There is no significant improvement of the fermentation process due to ME, although
its application allows for separation and recovery of the products obtained through fermentation.
ME also has the capability of substituting the input of chemicals by electricity usage for the pH
control of thin stillage fermentation.
Methanogen control in a fermenting reactor
Fermenting reactor at pH 7 Fermentation at pH 7 should theoretically result in more efficient fermentation due to reduced
stress related to pH and VFA-toxicity. A major downside to fermentation at a high pH, however,
is the possibility of methanogen incursion, resulting in the loss of VFA to CH4.
Figure 23. VFA-profile over time in a fermenting reactor operated at pH 7
Figure 23 shows the VFA-output of the fermenter operated at pH 7 for just over 8 × HRT . Due
to some operational instability, linked with problems in pH control and feed, this reactor was less
stable than the reactor operated at pH 5.5. As a result, a pseudo steady-state was only reached for
a short time-frame between Day 6 and Day 15, for approximately 1.5 × HRT. As this is too short
to make statistical statements on the fermentation process, steady-state concentrations used further

43
on are calculated from the data from Day 6 to the end of the experiment. The operational instability
also caused a decreased methanogenic activity in the reactor. Examples can be found in literature
of fermentation processes at pH 7 resulting in higher CH4-production rates (Lindner et al., 2015)
or processes choosing a lower pH to avoid methanogenic activity (Agler et al., 2014). If acidogenic
fermentation did take place at pH 7, other methods were used to inhibit methanogens such as
thermal pre-treatment (Steinbusch et al., 2009) or addition of 2-bromoethanesulfonate (Chae et al.,
2010; Steinbusch et al., 2011). Apparently, it is not realistic to design a process aimed at VFA
production at a pH of 7 without some form of methanogen control. If a strategy can be developed
to effectively remove methanogens in case of an incursion, the process would have the benefits of
a fermentation process at pH 7 (i.e. decreased VFA toxicity and pH stress) without the disadvantage
of undesirable CH4-production.
pH shocking as a strategy to remedy methanogen incursions Due to the fact that CH4 was never detected in the reactor at pH 5.5 and the pH-sensitivity of
methanogens (Chen et al., 2008; Appels et al., 2008) a strategy was developed to control
methanogenic activity in a reactor operated at pH 7. By dropping the reactor to an acidic pH 5.5,
or “pH shocking,” the more sensitive methanogens can be eliminated while fermenters, being more
acid-tolerant, remain active.
3.3.2.1. pH-shock batch test
This concept was first tested in a batch experiment using effluent from a CH4-producing
mesophilic digester as explained in Section 2.5.2.
Figure 24. CH4-production in the batch experiments. Figure A shows CH4-production rate per mass of initial VS.
Figure B shows cumulative CH4-production per mass of initial VS over the course of the experiment. Dashed line
indicates start of pH-shock.

44
Figure 24A and Figure 24B respectively show the CH4-production rate and cumulative CH4-
production over time during the experiment. The pH shock was applied to the digester effluent on
Day 6 of the experiment as indicated by the dashed line. Despite the variation on the production
rate being rather large in Figure 24A, a clear distinction can be made between the case with pH-
shock and the one without pH-shock. Production rates of CH4 are much lower after pH-shock
(regardless of a one or two day shock) compared to the control case. In the control experiment the
methane production between Day 8 and Day 16 was 2.6±2.0 gCH4.gVS-1.d-1 whereas it was 0.4±0.7
gCH4.gVS-1.d-1 for a one day shock and 0.1±0.4 gCH4.gVS-1.d-1 for a two day shock; only the two-
day shock results in a significant difference compared to the control experiment.
The influence of the pH shock is more clear when the cumulative CH4-production is compared,
cf. Figure 24B. During and after the pH-shock nearly no CH4 is produced, while the cumulative
production of the control experiment continues to rise. This means that the failing of the
methanogenesis due to a pH shock is not caused by the rise in EC, as this was corrected for in the
control experiment. At the end of the experiment, digester effluent not receiving a pH-shock
produced 50.0±6.4 mL CH4 per initial g VS, while this was only 26.4±1.5 mL CH4.gVS-1 and
26.3±1.3 mL CH4.gVS-1 for a 1 and 2-day pH shock respectively and cumulative productions were
not significantly different before pH-shock (Control: 26.4±1.9 mL CH4.gVS-1; 1-day shock:
22.4±3.7 mL CH4.gVS-1; 2-day shock: 25.3±1.9 mL CH4.gVS-1). These numbers clearly show that
in the case of mesophilic digester effluent a 1-day pH shock is enough to inhibit the methanogenic
community.
Figure 25. Acidification of the fermentation broth after pH shock. Figure A shows evolution of pH over the course
of the experiment. Figure B shows VFA-concentrations over the course of the experiment. Dashed line indicates start
of pH shock.

45
Figure 25A shows the pH over the course of the experiment. As all experiments started from the
same broth and received the same amount of glycerol as a carbon source, there are no significant
differences up to the pH shock. Between Day 6 and Day 8 instantaneous pH changes occurred due
to addition of HCl or NaOH. The addition of NaCl to the control experiment increased pH slightly.
During the pH shock, pH increased slightly but significantly (from 5.50±0.04 to 5.68±0.12 for a
one-day shock; 5.45±0.06 to 5.68±0.10 for a two-day shock), while the pH in the control
experiments decreased from 7.09±0.02 to 6.35±0.24, possibly the result of increased salt
concentrations in the Control experiment as a control for the change in EC in the pH shock
experiments. After the shock, pH was increased to approximately 7 in the control and both pH-
shock experiments and digestion were continued at 34°C. At the end of the experiment (Day 16),
a clear decrease in pH was noted in the pH shock experiments (from 7.09±0.14 to 5.78±0.20 for
a one-day shock; 7.17±0.09 5.76±0.28 for a two-day shock) while pH in the control experiments
remained stable (6.97±0.13 to 7.13±0.20).
Figure 25B shows how VFA-production is influenced by the pH-shocks. During the pH shock,
which was accompanied with glycerol dosing, VFA-concentration did not significantly rise. For the
control experiment the concentration of VFA present did rise significantly upon increasing the
electrical conductivity (from 0.50±0.05 gC.L-1 to 1.44±0.33 gC.L-1), resulting in a significant
difference in VFA-concentrations in comparison to the two-day pH shock (0.84±0.22 gC.L-1 on
Day 8). An important note here is that even before the pH shock a statistically significant difference
in VFA-concentrations was established between the control case and the shock reactors (on Day
6 0.50±0.05 gC.L-1, 0.82±0.13 gC.L-1 and 0.74±0.14 gC.L-1 for the control, 1-day shock and 2-day
shock respectively). This indicates that a larger natural variability of the VFA-concentrations is
present than the one observed in the triplicate experiments.
Figure 26. Average VFA-profiles at the end of the batch test
The VFA-concentrations at the end of the experiments, shown in Figure 26, can explain what
happens in a digester after methanogenesis inhibition. Total concentrations at the end of the
experiment are significantly higher when a shock was applied (0.75±0.27 gC.L-1 for control;

46
1.69±0.35 for a one-day shock; 1.60±0.27 gC.L-1 for a two-day shock). The VFA-profile also
changes resulting in more Ac and more Higher VFA – these are mainly But and iVal. The build-
up of Ac is a result of the failing of acetoclastic methanogenesis, as this process would consume
any Ac present in the fermentation broth (Liu & Whitman, 2008). The build-up of But and iVal
are most likely the result of amino acid fermentation. Since glycerol was used as a carbon source
the pathways detailed in Section 3.2.6 would mainly produce Pr, with some Ac. Degradation of
dead micro-organisms (e.g. methanogens) would release proteins which could then be fermented
to VFA. The VFA produced after the shock (Ac, Pr, iBut, But, iVal and Val) are all potential
outcomes of the fermentation of proteins at pH 7 (Liu et al., 2012).
This batch test shows that a pH-shock can be used to inhibit methanogens in a digester while the
acidogenic fermentation appears to be unaffected by the pH-shock. The loss of methanogenic
activity, especially Ac-consuming acetoclastic methanogenesis, results in the accumulation of VFA
in the broth. This accumulation then results in the acidification of the digester, which in this case
prevented any possible recovery of the methanogenic community. These results are a first
indication of the possibility of using the pH-shock concept for methanogen control in a fermenter
with potentially minimal impact on the fermenting community.
3.3.2.2. Semi-continuous batch reactor experiments with pH shocks
The strategy developed in the previous sections to control methanogenesis was put to practice in
a semi-continuous batch reactor as described in Section 2.2.4
Figure 27. Production of CH4, H2 and CO2 and pH over time in the semi-continuous batch reactor employing pH
shocks to control methanogenic activity. Error bars on gas measurements per sampling point are obscured by
medallions.
Figure 27 shows the production rates of different gases as well as the pH in the fermenter. The
first 10 days the reactor was operated with a high OLR (5.9±2.2 g sCOD.L-1.d-1) and high current

47
(100 mA or 10 A.m-² of membrane). This resulted in initially high production rates of H2, a result
of electrolysis of H2O, and CO2, which is a by-product of the acetogenic fermentation. Despite
inoculation of thin stillage with effluent from a mesophilic digester producing CH4, no
methanogenic activity was detected. For this reason OLR was lowered, reducing VFA stress, from
day 10 onwards by dilution of fed thin stillage, resulting in an OLR of 3.1±1.7 g sCOD.L-1.d-1. This
lower OLR did not result in methanogenic activity, despite continued inoculation of the fed thin
stillage with mesophilic digester effluent. On Day 16 the applied current was lowered to 50 mA (5
A.m-²) because a continuous current of 100 mA increased pH too much resulting in overdosing of
acid (2M HCl), possibly causing stress. At this point methanogenic activity started up, after which
a first pH shock at pH 5.5 was applied between Day 19 and 21 by a combination of fermentative
acidification and acid dosing. After the shock pH returned to 7 by application of a high current
(100 mA). As can be seen in Figure 27 this resulted in effective inhibition of the methanogens
present in the fermenter as at least 2 days after the shock no CH4 was produced. The following 4
days headspace gas composition could not be analysed due to technical issues. On day 29 CH4 was
again detected after which a pH-shock was applied for 1 day in an attempt to find the shortest
necessary length of pH shock. Despite CH4 still being present in the headspace after 1 day at pH
5.5, pH was increased again by applying a current over the AEM. However, pH only increased to
6.1, which still resulted in methanogenic activity. For this reason a full two-day pH shock at pH 5.5
was applied in an attempt to remove methanogens completely. Even so the methanogenic
community remained active in the fermenter, immediately increasing in activity after pH was
elevated to 7. For this reason the pH during the shock was decreased to 5 to create harsher
conditions for methanogens. Despite two two-day shocks at pH 5, methanogenic activity was never
inhibited completely in the fermenter.
Figure 28. Conversion efficiency of fed soluble COD to CH4 and pH over time
The figure above shows the efficiency with which the fed soluble COD was converted to CH4 over
time, along with the pH in the reactor. A clear link can be seen with a pH of 7 and high conversion
efficiencies (e.g. on Day 19, 29 and 37). At a low pH on the other hand, conversion efficiencies are
usually lower (e.g. Day 30 to 35, 39 and 45). The highest conversion efficiency was reached on Day

48
29 with 36.1±0.3% of COD being converted to CH4 in 2 days. This means 0.14±0.0 gC.d-1 was
lost as CH4 on Day 29. Due to varying OLR over time, the actual highest CH4-production occurred
on Day 40, when 0.17±0.0 gC.d-1 was converted to methane.
Despite typically unsuitable conditions for methanogens (i.e. HRT lower than 8 days and periods
at decreased pH (Appels et al., 2008)) methanogenic activity continued in the fermenter. It is well
established that acetoclastic methanogens are sensitive to a decreased pH (Agler et al., 2014),
nonetheless, other methanogenesis pathways are possible. Hydrogenotrophic methanogens, using
H2 and CO2 to produce CH4, have been observed in H2-producing fermenters at a pH down to 4.5
(Kim et al., 2004). Considering the abundance of H2 in the fermenter due to cathodic H2O-
reduction the presence of hydrogenotrophic methanogens can be expected. Due to the coinciding
pH-increase and highest H2-production rates it is not possible to say whether the peaks in CH4-
production are due to the increase in pH or the increase in H2-pressure. The presence of
hydrogenotrophic methanogens does appear to be confirmed when looking at the gas production
on the last days of reactor operation in Figure 27. The expected H2 production due to electrolysis
is absent. This could however be due to production of CH4 with the available H2. Although the
first shock appears to have inhibited all methanogens, repeated shocks might create a more resistant
community (Chae et al., 2010), resulting in the presence of methanogens despite pH as low as 5.
Figure 29. VFA-profile over time in the reactor applying pH shocks for methanogenesis control
Figure 29 shows the composition of VFA present in the fermenter over time. An outlier on Day
39 is immediately apparent, possibly related to issues during feeding. For further calculations this
outlier was removed from the dataset. Due to the initial high OLR, high VFA-concentrations were
obtained in the first 10 days of operation. The profile corresponds closely to fermentation without
ME as there were some issues with electrolysis in this period. From Day 10 onwards OLR was
lowered. This resulted in a decrease in VFA-concentrations, while ME issues sustained, resulting
in a similar VFA-profile. From Day 19 onwards, when current was lowered, an average total VFA-
concentration of 2.7±0.6 gC.L-1 was obtained. VFA-concentrations on Day 41 were 1.9 gC.L-1,
which might be a result of the increased CH4-production, see Figure 27. When adding the carbon
in the form of CH4 to the total VFA-concentration, a total of 2.1 gC.L-1 is obtained, still significantly

49
lower than the average VFA-concentrations in the reactor. This indicates more than CH4-
production is causing the low VFA-concentration on Day 41.
Figure 30. Comparison of VFA-profiles in fermentation at a stable pH of 7 (see Section 3.3.1) and fermentation with
pH shocks as methanogen control strategy
The influence of fermentation with pH shocks is shown in Figure 30. Due to feed dilution in this
experiment, comparison of VFA-concentrations with the results discussed in Section 3.3.1 is
difficult; for this reason it might be better to compare the proportions of each of the VFA. This
comparison shows a significantly higher fraction of longer-chain VFA (Val, Cap, Hep) present in
the shock reactor (8.9±8.4% for pH 7 fermentation; 24.3±5.0% for pH-shock fermentation). Note
that no significant difference is obtained when purely longer-chain VFA, defined earlier as But,
Val, Cap and Hep, are taken into consideration (42.1±9.6% for pH 7 fermentation; 50.3±8.6% for
pH-shock fermentation). Although no control experiment was performed with ME at pH 7, this
apparent increase in elongation might be explained by the production of H2 by electrolysis, as
explained in Section 3.2.
Despite the initial promising results from the both batch test (Section 3.3.2.1) and the first shock
in the pH shock fermenter it appears that at low OLR it is possible for a methanogenic community
to establish itself in a fermenter operated at pH 7 with intermittent shocks at pH 5.5 and even 5.
While this means this strategy is, in this form, not capable of effectively controlling the
methanogenic community, it might be possible to use this technique in CH4-producing digesters
to obtain a more robust community. Robust methanogenic communities could be beneficial for
CH4-producing digesters treating a wide range of streams or for digesters treating streams prone to
shocks due to unstable OLR, pH, etc.
Influence of pH shocks on a fermenting community As established in the previous section, pH shocks have the possibility of controlling methanogenic
communities when these communities are not adapted to pH shocks. While the VFA output of
the semi-continuous batch reactor, as discussed in the previous section, does not appear to be
influenced by the pH shocks, the fermenting community might still be influenced by them. A batch

50
test, as described in Section 2.5.3, was performed to investigate the possible influence of a pH
shock when VFA-concentrations are high.
Batch test combining pH shock with high VFA-concentrations The influence of a pH shock on a fermenting community was investigated by applying a
combination of both high VFA-concentrations and low pH for 2 days (Day 0 to Day 2). This shock
period was followed by centrifugation and resuspension of the solids in fresh thin stillage
supernatant after which fermentation at 34°C was continued.
Figure 31. pH for each of the experiments over time along with the goal pH at each stage of the experiment.
Figure 31 shows that despite attempts to obtain a pH of 5.5 during the shock and 7 after the shock,
practical pH was lower due to corrections only being performed daily, and further on only every 3
days. During the shock-phase, pH of the experiments shocking with Ac and Pr was higher than
pH of the control experiment. This could be due to insignificantly decreased VFA-production
during the shock period (0.33±0.05 gC.L-1.d-1 for Control; 0.07±0.21 gC.L-1.d-1 for Ac-shock; -
0.12±0.32 gC.L-1.d-1 for Pr-shock) although the increased pH-buffering due to the high VFA-
concentrations could be at play as well. This buffering is largest between pH 4 and 5.5 due to the
pKa of Ac and Pr (see Section 1.5.1).

51
Figure 32. VFA-concentrations in each experiment over time. On day 3 broth was centrifuged, supernatant removed
and replaced by supernatant of fresh thin stillage. Some error bars are obscured by medallions.
Total VFA-concentrations over time in each of the experiments are shown in Figure 32. The
concentration of Ac and Pr at the start of the shock were 4.6 gC.L-1 and 5.6 gC.L-1 (or 11.5 g Ac.L-
1 and 11.6 g Pr.L-1) respectively. Figure 32 already indicates a clear influence on the VFA-production
as the communities that were shocked produce significantly higher VFA-concentrations by the end
of the experiment. On Day 11, total VFA-concentrations in the Supernatant Control (0.98±0.05
gC.L-1) were significantly lower than those in the control experiment (1.09±0.06 gC.L-1). When an
Ac-shock was applied, these concentrations nearly doubled to 1.87±0.03 gC.L-1, while the largest
increase was noted in the experiment applying a Pr-shock, reaching 5.73±0.34 gC.L-1.
Figure 33. VFA-profiles on Day 10 for each experiments. Error bars signify variation for that VFA.
Not only are the total VFA-concentrations higher in the case of a shocked community, the type of
VFA produced can also be changed by the shock. Figure 33 shows that neither the control cases
nor the Ac-shock produce Pr, while a community shocked with Pr does show ability of producing
Pr. It remains unclear what the exact mechanisms behind this shift in product output are, but a
possibility might be that a shocked community becomes more resistant to the VFA it is shocked
with. Another proof the fermentative reactions catalysed by the community are changed by the

52
shock is the presence of H2 in the headspace in the case of the Pr-shock, while none of the other
experiments showed presence of H2. Because gas production was not quantified it is impossible to
quantitatively investigate this fermentation shift.
Figure 34. Ac-production rates over time for the combined pH and VFA-shock. Shock applied from Day 0 to Day 2.
Not only is the community shocked with Pr the only community to produce Pr, it also produces
Ac at higher concentrations and rates than the control experiment and the experiment shocked
with Ac, as can be seen in Figure 34. Between Day 6 and Day 10 the average total production rate
in the Pr-shock experiment was 0.86±0.06 gC.L-1.d-1, significantly higher than the experiment
shocked with Ac (0.16±0.03 gC.L-1.d-1) and both control experiments (0.07±0.04 gC.L-1.d-1 for
‘Control’;0.05±0.01 gC.L-1.d-1 for ‘Supernatant Control’).
These experiments demonstrate that pH shock in combination with high VFA-concentrations can
influence the VFA-production by a fermenting community. An Ac-shock causes an increased Ac
production, while a Pr-shock was shown to stimulate both Ac and Pr-production.

53
pH Hysteresis Semi-continuous batch reactor To test the long-term effect of pH shocks on a fermenting community an experiment was
performed applying periodic pH changes. In this reactor the pH was shifted from a high pH (7) to
a low pH (5.5 in Phase 1, 5 in Phase 2) every HRT (6 days).
Figure 35. VFA-profile over time for pH Hysteresis fermenter
As can be seen in Figure 35 the VFA-profile, after some initial fluctuations, remained fairly constant
during the first phase of hysteresis (from pH 7 to 5.5 and back). This figure shows a fairly similar
VFA-profile to a fermenter operated at a stable pH of 5.5, producing predominantly Ac and Pr.

54
Figure 36. Average VFA-profile during steady-state conditions. Error bars indicate standard deviation on specified
VFA.
Figure 36 shows a comparison of the VFA-profiles at steady state for the control fermenters (pH
5.5 and pH 7) and both phases of hysteresis (see Section 2.2.2). Total VFA-concentrations are
insignificantly different in pH hysteresis compared to stable pH fermentation (6.6±0.7 gC.L-1 at
pH 5.5; 4.6±1.8 gC.L-1 at pH 7; 7.2±1.0 gC.L-1 for Phase 1; 5.2±1.9 gC.L-1 for Phase 2). The largest
difference between the VFA-profiles is the increased Ac-concentration in the first phase of
Hysteresis (2.0±0.4 gC.L-1) compared to fermentation at pH 5.5 (1.3±0.2 gC.L-1). No significant
difference with fermentation at pH 7 was obtained due to the large variation in this experiment
(1.2±0.5 gC.L-1).
Table 6. Average proportions of each VFA for different fermentation experiments
Ac (%) Pr (%) But (%) Val (%) Cap (%) Hep (%)
pH 5.5 19.3±1.6 51.3±4.8 9.4±1.3 19.9±5.3 0.1±0.4 0
pH 7 28.0±5.9 29.9±7.1 32.8±11.9 4.6±3.8 4.7±4.7 0
Hysteresis Phase I 26.8±4.2 46.5±7.3 13.5±3.3 10.2±2.9 1.8±2.3 1.1±1.8
Hysteresis Phase II 25.6±4.3 37.5±5.8 13.2±5.6 12.3±2.7 7.8±3.8 3.5±1.9
Due to the high variability of the VFA-concentrations it is difficult to compare the VFA profile of
the different experiments. The average proportions of different VFA in each experiment as shown
in Table 6 can provide a more suitable means of comparison in this case. This data shows that
there is no clear shift in ratios of the obtained products if the lower pH in hysteresis is lowered to
5. As there was no significant difference in total concentration either, no distinguishable effect of
increasing the pH range of hysteresis could be detected. The differences between fermentation at
pH 7 and 5.5 are quite stark. All VFA are significantly different except Cap. Ac and But are lower
at pH 5.5, while Pr and Val are higher. A similar influence of pH on fermentation (i.e. an increase

55
in Ac and decrease in Pr with increasing pH) was found in literature (Yu & Fang, 2002). When
comparing the obtained proportions of the different products for the first phase of hysteresis with
fermentation at stable pH we observe that the average proportions obtained with pH hysteresis are
somewhere between those obtained at pH 5.5 and 7 although not all differences are significant.
When comparing with pH 5.5, a significant increase in Ac and decrease in Val can be noted, while
comparing to pH 7 shows an increase in Pr and decrease in But.
Figure 37. Comparison of fractions of VFA-groups Ac-But-Cap and Pr-Val-Hep for the first phase of hysteresis and
both control fermentations
This apparent averaging of product profile when hysteresis is applied seems to be confirmed by
Figure 37. This figure, representing the same data as Figure 36, shows the summed fractions of Ac,
But and Cap (Ac-But-Cap) and Pr, Val and Hep (Pr-Val-Hep) in the broth. At pH 5.5 71.2±1.8%
of VFA are Pr, Val or Hep, while at pH 7 this is only 34.5±8.0%. When hysteresis is applied
57.8±5.8% of VFA are Pr, Val or Hep, approximately the average of the fractions present at pH 7
and pH 5.5. These results indicate that pH has a significant influence on the fermentation profile
and the main influence of pH hysteresis on fermentation is a product shift caused by changing pH.
Other effects related to the pH shifts (e.g. VFA toxicity, pH stress, etc.) do not appear to affect the
fermenting community or the obtained products.
With this idea in mind, it might be interesting to look at temporal variations of VFA-production in
the reactor applying a hysteresis regime, as Ac appears to be the predominant product of
fermentation at pH 7. As expected, average total VFA production rates are approximately the same
(1.2±0.5 gC.L-1 during pH 7-period; 1.2±0.3 gC.L-1 during pH 5.5-period). When looking at
production rates of other VFA, no significant differences could be established. Ac, having a
significantly higher concentration in the reactor applying hysteresis, has no significantly higher
production rates in a fermenter operating at pH 5.5 (0.23±0.14 gC.L-1) or pH 7 (0.17±0.23 gC.L-1)
compared to a hysteresis fermenter at these pH (0.41±0.17 gC.L-1 at pH 7; 0.21±0.12 gC.L-1 at pH
5.5). While the shifted product profile appears to indicate a shift in production rate, it is impossible
to make statements on this due to the insignificant differences.
Lastly, there is an apparent contradiction between these results and those of the batch test discussed
in Section 3.4.1. An important remark to be made here, is that batch tests are not fully

56
representative for long-term reactor experiments. A distinct difference that can be seen in this case
is the lower VFA-concentrations, implying leftover substrate (i.e. Reactive Fraction). Since
substrate is not yet limiting in the batch test, the influence of shifting pH might well be very
different than when substrate is limiting (e.g. in semi-continuous batch reactors with a 6-day HRT,
cf. Section 4.4.2.).

57
Discussion Thin Stillage as a biorefinery substrate
Thin Stillage at lab scale The experiments performed in this study all used thin stillage, a side-stream of EtOH-production
from corn. As this is a side-stream of an actual industrial process, the experiments performed here
showed that fermentation processes were not confined to streams created in lab environments but
could also be applied in real world streams. At the same time, the experiments established the
potential of ME for treatment and valorisation of thin stillage. The literature analysis of the
potential biochemical pathways in the thin stillage fermentation provided a theoretical basis for the
influence of ME on the fermentation process. We can only speculate on the influence of ME on
other industrially available substrates such as molasses, wastewaters from (agro)-industrial
processes, waste sludge from water treatment, etc., as these have inherently different properties
(e.g. pH, alkalinity, solids content, chemical composition, etc.).
Waste activated sludge for instance has a higher solids content, higher pH and much lower
sCOD/tCOD-ratio than thin stillage. Because of this, fermentation at short HRT (5 days) yielded
low concentrations of VFA (max. 0.21 gCOD.L-1), with some minor hydrolysis taking place in a
study performed by Ucisik & Henze (2008). This is similar to the conclusions obtained from this
study, namely the easier conversion of soluble COD compared to solid COD at short HRT. To
maximise VFA-potential a balance should be found with the hydrolysis-rate increase and the
increased methanogen performance at increased HRT (Colmenarejo et al., 2004; Appels et al.,
2008). Molasses is another stream that has been studied for production of VFA. tCOD can achieve
much higher concentrations than those obtained in thin stillage, up to 100 gCOD.L-1, and most of
this COD is soluble, implicating a high potential for VFA production at short HRT. Solids are
higher than for thin stillage, but a key difference between thin stillage and molasses is the much
higher conductivity of the latter (up to 10 times higher) (Jiménez et al., 2003). This is the result of
a much higher salt concentration and can influence anaerobic processes (Gueguim Kana et al.,
2013). Tying this comparison to the carboxylate platform barriers, it would seem likely waste
activated sludge would have issues with both ecology barrier (overcoming biologically limiting
production rates) and methanogen barrier, while molasses might have issues with the ecology
barrier and potentially separation barrier due to its high salt content, as high concentrations of K+
in molasses can affect digestion (Ryan & Johnson, 2001) while anions (e.g. Cl-) can migrate very
easily across an AEM resulting in a decrease of CE (See Section 3.2.4).
As the experiments performed here were always at lab scale, it is also impossible to make statements
on the influence of upscaling on the fermentation process.
Economics of the corn bio-ethanol process
4.1.2.1. Carboxylates production from thin stillage
The USA are one of the main producers of bio-EtOH with an estimated total of 54.1*109 L of
EtOH produced in 2014, of which 98% originated from corn (Renewable Fuels Association, 2015).

58
Taking into account that for a typical dry-grind process 6 to 7 L of thin stillage per L of EtOH is
produced (Arora et al., 2011) and the fact that 90% of corn EtOH is produced by means of this
process, this equates to a production of up to 334*109 L of thin stillage per year by the US alone.
This annual production of thin stillage corresponds with approximately 20*106 tonnes of total
COD or 5.8*106 tonnes of reactive fraction COD, representing an abundant source of organics
that could potentially be used for production of highly valuable chemicals.
If the entire reactive fraction (See Section 3.1) of this annual thin stillage production would be
converted to pure Ac, a total of 5.4*106 tonnes of Ac could be produced, corresponding with 45%
of the global Ac demand in 2013 (Le Berre et al., 2014). This could theoretically generate over 2.5
billion USD annually. For a hypothetical U.S. plant with a capacity of 100 million gallons per year
this could generate up to 19.2 million USD per year. Alco BioFuel has an annual production
capacity of 200*106 L of EtOH and produces of 130*106 tonnes of thin stillage per year, which is
rather low comparing with typical dry-grind corn EtOH plants (Arora et al., 2011). For this plant,
conversion of the reactive fraction in the thin stillage to VFA could produce 1 million USD worth
of Ac annually. It is important to take larger market mechanisms into account when considering
these processes. When a theoretical annual production of 45% of the global Ac-market can be
obtained by thin stillage fermentation, large-scale market mechanisms come into play making it
impossible to predict the reaction of the Ac market. At the same time it is important that there is
a market for the obtained product at the plant level. If a process costs too much to implement or
if no potential market for the product can be found it is economically nonsensical to invest in this
process.
Although Ac has a wide range of uses and a large market is available for the product, it remains
unattractive to produce Ac biologically due to the technological immaturity and higher production
cost compared to petrochemical Ac-production (Wagemann, 2014). If the entire reactive fraction
could be converted to Cap on the other hand, a total of 2.6*106 tonnes of Cap could be produced
in the US, generating a theoretical revenue of 13.2 billion USD. The hypothetical US plant could
produce 92.8 million USD worth of Cap, while the ALCO BioFuel plant could generate over 5
million USD per year with sales of Cap. This shows that shifting the production towards longer-
chain VFA can make the fermentation of thin stillage – and the carboxylate platform in general –
economically more interesting.
Approximately 2.6 million USD worth of VFA could be produced if ALCO BioFuel were to
implement a thin stillage fermentation process that produces the same VFA-profile as the
experiments performed in this study. When only the extracted fraction of the VFA is taken into
account this would decrease to 0.7 million USD. This scenario is obviously unrealistic, as the
experiments performed here were not focussed on the upscaling of the fermentation process, nor
on the optimisation of VFA-extraction. The VFA produced in these experiments are also worth
less due to the impurity of the VFA-mix as well as the presence of some contaminants in the
extraction broth such as proteins, haloacetic acids, etc.
This section has already given some economic data on the possibilities of using thin stillage as a
substrate for carboxylate production. It is however also interesting to look at the applications of

59
these products. Ac, for instance, is used in the production of vinyl acetate and acetic anhydride,
which are used in the production of polyvinyl acetate and cellulose acetate respectively. The first
of these is used to produce vinyl plastics while the latter can be used to produce photographic
films. Pr is often used for production of cellulose fibers, herbicides and perfumes; But is often used
in food, perfume and polymer industries (Jang et al., 2012). Val is often esterified producing valerate
esters, which can be used as fuel (Lange et al., 2010) while Cap can be used as an antimicrobial
agent (Skrivanova & Marounek, 2007) as well as an additive to perfumes, food, lubricants, etc.
(Cheon et al., 2014). As already mentioned with Val, all of these carboxylates can be used for
production of fine chemicals, provided the VFA can be separated. An often employed processing
step is esterification of carboxylates to esters (Andersen et al., 2014) which have their own uses,
for instance fuels and solvents (Agler et al., 2011). Other possibilities include production of
ketones, alcohols and alkanes from the obtained carboxylates.
4.1.2.2. DDGS as coproduct from the corn bio-ethanol process
As explained in Section 1.2, EtOH is not the only product obtained in the corn bio-EtOH process.
DDGS are obtained by combining the dried wet cake with the syrup obtained after evaporation of
water from thin stillage. This is then further dried and pelletized resulting in DDGS. The livestock
industry is one of the main end users of DDGS as animal feed for cattle, pigs, poultry and fish
(Renewable Fuels Association, 2015). An estimated total of 39.6*106 tonnes of DDGS were
produced in the US between September 1st 2013 and August 31st 2014 (Agricultural Marketing
Resource Center, 2015). Due to the increase in corn demand by the emergence of the bio-EtOH
industry, prices of corn have risen, making corn less attractive as fodder (Skinner et al., 2012). At
the same time DDGS can substitute corn and soy meal fractions in animal feed, due to its increased
protein content relative to corn as animal feed. The combination of these factors has allowed
DDGS to become increasingly important over the last decade to the livestock industry, especially
in North-America (Hoffman & Baker, 2011).
DDGS are of major economic importance as they are currently the main coproduct making the
bio-EtOH production from corn economically viable. According to an economical model for a
corn EtOH-plant producing 100 million gallons of EtOH per year by Hofstrand (2015), the total
revenue per gallon of EtOH was $1.92 in March 2015. $0.53 (27.6%) of this revenue was generated
by DDGS sales. EtOH prices in this same period were $1.39 per gallon, causing a net loss of $0.07
per gallon. Ceasing the sales of DDGS would exacerbate the economic situation; the hypothetical
plant in this model would only have been profitable for 30% of the time since January 2005,
demonstrating the necessity for DDGS-production in the current bio-EtOH plant.
If all thin stillage produced in the ALCO BioFuel plant were to be used solely for production of
VFA, a total 5.7*103 tonnes of solids would not end up in DDGS every year, a loss of approximately
3.5% when 1L of EtOH results in 0.8 kg of DDGS (Taheripour et al., 2010). This decreased DDGS
production represents just under 1 million USD of lost revenue. Depending on the targeted
product this loss could be made up for by production carboxylates. As mentioned before, a total
of 2.6 million USD worth of carboxylates could be obtained from thin stillage while 0.7 million
USD worth of carboxylates could be extracted with the current state of technology (i.e. lab-scale

60
equipment). It is however not necessarily true that fermentation of thin stillage would cause a loss
of 1 million USD in DDGS sales. As the experiments performed in this study showed (see Section
3.2.2), solids remain largely unaffected by fermentation if no ME was applied. If solids could be
recovered from the effluent of the fermenter, these could be returned to the DDGS-production to
reduce the loss. Because of the application of DDGS as animal feed it is important to keep track
of the influence of these processes on the composition of DDGS. As Kim et al. (2008) pointed
out, wet cake has a much higher protein content than DDGS due to the low protein content of the
thin stillage syrup that is added to the wet cake. As the stream characterisation of the thin stillage
showed, approximately half of the organic solids present in thin stillage are proteins. Fermentation
does not alter this, so if only the solids of the thin stillage are returned this might have a profound
influence on the composition of the resulting DDGS which would have implications for its use as
animal feed.
4.1.2.3. Diversification of coproducts for economic buffering
Figure 38. Process diagram showing conventional stillage treatment (full lines) and potential future treatment (dashed
lines) for coproduct diversification (adapted from Alco BioFuel, 2014)
The most interesting path for the future of thin stillage as a biorefinery substrate would be the use
of the soluble COD – specifically the Reactive Fraction - present for production of VFA, targeting
longer chain carboxylates (C5 and up), while the solids can be returned to DDGS production,
provided this does not alter feed composition in a negative way. The addition of EF, as shown in
Figure 38, provides an additional source of revenue for the bio-EtOH plant. This not only increases
their total revenue but can also act as an economic buffer for the bio-EtOH plant. Currently, the
corn EtOH-process is dependent on the market prices of corn, EtOH and DDGS. Due to its
agricultural nature the price of corn is volatile as it is dependent on factors such as weather and
extreme events (Wagemann, 2014). Meanwhile, EtOH-prices are dependent on the evolution of
oil prices over the long term, while in the shorter term policy changes can also influence EtOH-
prices (Merkusheva & Rapsomanikis, 2014). When production of other fine chemicals could be
added to the corn bio-EtOH process, impacts of volatile corn prices as well as price changes in
EtOH could be mitigated due to the additional source of revenue. The possibility of producing a

61
wide range of products, depending on the necessary equipment and possibilities of steering
carboxylates production, could further increase the economic resilience of the process. In this way,
production of VFAs from thin stillage can be used to further diversify the product range obtained
from the corn bio-EtOH process, increasing profitability and economic resilience.
Zero-chemical input control The price of NaOH is entirely dependent on the Cl2-demand and supply, as both are produced
simultaneously in the chloralkali process, but this does not mean NaOH has no environmental
impact. A Life Cycle Analysis (LCA) of NaOH-production, allocating emissions to Cl2 and NaOH
on a mass basis, obtained a total greenhouse gas emission (both by electricity and fuel) of 1.915 kg
CO2-eq per kg NaOH (Turner & Collins, 2013). In the fermenter operating at pH 5.5 without ME,
discussed in Section 0, this would result in an emission of 4.3±2.9 gCO2-eq per day. For
comparison, gaseous emissions from the control reactor were on average 0.22±0.14 g CO2-eq per
day. This shows that CO2 from chemicals are not negligible in the carbon footprint of the system
and substitution of NaOH could alleviate some of the environmental impact of the fermenters. As
it has been shown NaOH-dosing could be substituted by applying ME, it is relevant to check
whether using electricity to control pH is actually beneficial for the environment. The power
necessary for the electrochemical caustic production also has its impact on the environment. An
average of 0.21±0.20 W was necessary for this caustic production. With a CO2 emission of 730
gCO2-eq.kWh-1 from a conventional blend of electricity sources (Granta Design, 2014) this would
result in an emission of 3.4±3.2 gCO2-eq.d-1. The wide variation in this emission is most likely the
result of the variation in applied current and accompanying power necessity. Although it appears
on a very basic level substitution of NaOH-dosing by ME might reduce CO2 emissions, differences
between the two cases being insignificant, this was not a complete LCA and it is premature to make
a definitive conclusion on this aspect of the experiments. For example, a complete LCA would
have to incorporate the impact of pumps for NaOH-dosing and recirculation, mixing devices,
heating equipment as well as the impact of the reactor vessel, electrochemical cell, etc., which is
outside the scope of this study, but would be an interesting exercise for localised electrochemical
production of caustic.
The use of renewable energy sources, such as solar energy, could further decrease this carbon
footprint. Assuming an average power output by a photovoltaic (PV) panel of 115 kWh.m-2.yr-1
(Volcke, 2014) a PV panel surface of 12.7 m² would be required per m³ of reactor, assuming an
equal volumetric electricity demand. With a carbon footprint of 29.2 gCO2-eq.kWh-1 (Asdrubali et
al., 2015) the use of PV electricity could further reduce the electric carbon footprint to 0.15±0.14
gCO2-eq.d-1. The use of off-peak electricity (i.e. the surplus generated by centralized plants during
periods with low electricity usage) could be beneficial in the reactor set-up described. Planning
periods of high applied current during these periods would reduce both cost of electricity and
impact on electricity requirements during periods with high electricity demands.
Other disadvantages are associated with the use of NaOH besides its carbon footprint. Because
NaOH is usually produced in a 50% solution (European Commission, 2001) it is very corrosive.
This corrosiveness entails worker safety issues as well as issues regarding equipment maintenance,

62
equipment degradation, NaOH-storage, etc. Although these issues can be circumvented, they are
another reason why substitution of NaOH by electrochemical caustic production is an interesting
solution also being researched for other applications (Pikaar et al., 2011)
Potential and future development of electrochemical
systems for extraction Substitution of NaOH-dosing by electrochemical reduction of H2O has its consequences. When
this system is applied in larger reactors, larger currents will be necessary to produce the necessary
OH- to prevent acidification of the fermentation broth as well as to extract the produced VFA. To
obtain an efficient electrolysis system, key parameters are the surface area of the cathode (Rader &
Logan, 2010), the stability of the anode (Hu et al., 2014) and the membrane area (Yee et al., 2012).
In the set-up used in this study, a steel wire mesh cathode was used in a two-chamber
electrochemical cell. This material has a specific surface area between 3900 and 6800 m².m-3 (Zhang
et al., 2011), while other materials such as cathode felt can achieve specific surface areas of up to
22700 m².m-³. As pH-control was achieved, OH- production is apparently sufficiently efficient in
this application as. The electrolytic oxidation of H2O requires a stable anode, usually achieved by
using precious metals, as was the case in this study. These materials are scarce and expensive, so
their usage should be limited. Efforts have been made to find substitutes for the commonly used
Ir-MMO anodes requiring fewer scarce materials (Hu et al., 2014). Reduction of the anode area per
cell could also be useful in reducing the requirement of precious metals. Lastly, membranes are
often expensive parts of an electrochemical cell, stimulating research on more cost-effective
materials with high efficiencies for ion exchange (Yee et al., 2012). Decreasing the cost of the
electrochemical cell can also be obtained by maximisation of the membrane surface area to volume
ratio of the cell.
When discussing the size and configuration of an electrochemical cell, the design with the highest
achievable membrane area to volume ratio is likely to be a cylindrical electrochemical cell. This type
of electrochemical cell would place the anode centrally, surrounded by the membrane which in
turn is surrounded by the cathode. This type of construction could result in a 3.17-fold increase in
the membrane surface area to volume ratio of the cell while reducing the anode area, assuming
total volume and height of the cylindrical and flat-plate electrochemical cell are equal. Other
advantages of using cylindrical devices are the reduced pumping costs for recirculation of the
fermentation broth through the electrochemical cell, since cylindrical devices can be submerged in
the broth, and an – in principle - easier implementation of multiple extraction devices in one
reactor, although this has not yet been researched.
A comparison could be made with submerged membrane bioreactors (MBR). While an MBR uses
a pressure drop as driving force to obtain a clarified effluent, an electrochemical cell uses current
over the membrane as a driving force, causing migration of specific species as opposed to removing
water containing solutes to obtain a clarified product stream. MBR are well-known in literature and
have been used both aerobically and anaerobically (Ylitervo et al., 2013). No MBR have been
reported in literature for VFA-production, so it is difficult to compare performance of an MBR
63
and ME for extraction. Assuming a thin stillage fermentation broth containing 10 gAc.L-1, ME can
extract up to 1.05 kg Ac.m-².d-1 (Andersen et al., 2014). An MBR allowing free migration of Ac
through the membrane could obtain a flux of 1.03 kg Ac.m-2.d-1 at an average permeate flux of 4.3
l.m-2.h-1, a value obtained in a pilot plant anaerobically treating corn thin stillage (Dereli et al., 2012).
The similarity between the two, despite their fundamental differences, shows their potential.
MBR are typically applied in two configurations: submerged and external-loop. In the first water
permeates from the outside inwards in a device submerged in the reactor, while in the latter, water
permeates either through a flat membrane or from the inside outwards through a cilindrical
membrane in devices placed in a recirculation loop outside the reactor. An often encountered issues
with submerged MBR is fouling of the membranes, especially at high concentrations of solids,
which is usually countered by purging gas along the membrane (Ylitervo et al., 2013). This fouling
could also be an issue when using submerged electrochemical devices. In external-loop MBR
fouling is also an issue - usually countered by applying high flow velocities (Ylitervo et al., 2013) -
but fouling of the membrane was outside the scope of this study. Fouling of membrane and
electrode, as well as the lifetime of these components are expected to be critical for this application.
The decrease in solids that was observed as a result of applying ME will also have an impact on
fouling of the cell and its components.
For the application of ME on a larger scale it will be crucial to study the application of new anode
and membrane materials on the extraction and the cost-effectiveness of the system as well as the
consequences of using cylindrical extraction devices for ME. Once a cylindrical ME system has
been developed, the possibility of using multiple extraction devices in one reactor can be of great
interest. Applied current per extraction device could be reduced while simultaneously increasing
membrane surface area and decreasing anode area per volume of reactor.
ME and Carboxylate Platform Barriers The experiments performed in this study aimed to tackle all three carboxylate platform barriers
defined by Agler et al. (2011). These three barriers are the separation, ecology and methanogen
barrier. The first of these is the necessity for the development of technology able to separate and
recover the carboxylates produced in carboxylate platform processes. The ecology barrier is the
issue of steering and controlling a microbial community towards the production of a target product
and overcoming biologically limiting production rates and product inhibition. The last barrier is
the methanogen barrier, which pertains to the problem of methanogenesis converting multi-carbon
VFA to CH4. While this conversion is desirable in classic anaerobic digestion it is undesirable for
the carboxylate platform as its main goal is the production of industrial precursor chemicals, for
which multi-carbon compounds are more attractive.
Separation Barrier The principle motivation of ME is separation and recovery of anionic VFA (Andersen et al., 2014).
28.1±3.8% of the produced VFA could be extracted by ME in the experiments performed, despite
the experimental focus on the influence of ME on fermentation and not optimisation of VFA-
extraction. This demonstrates that the VFA produced can be separated from the fermentation

64
broth using ME after which further downstream processing to other chemicals such as volatile
esters (Andersen et al., 2014) is possible. ME cannot selectively extract target VFA which results
in a mixture of VFA in the anolyte solution. As a consequence downstream processing would also
require development of a system for VFA separation or target an aggregate product where a mix
of chemicals with different chain lengths is allowable. An example of such a product could be fuels,
where alkenes of varying chain lengths could be used. These products could be obtained by
reduction of carboxylates to alcohols with H2 and subsequent dehydrogenation. At least part of the
required H2 could be obtained from the headspace gas of the fermenter. In the experiment with
ME described in Section 3.2 the theoretical molar H2-production rate was approximately half of
the carboxylate production rate, while reduction of carboxylates with H2 requires 2 moles of H2
per mole of carboxylate (Holtzapple & Granda, 2009). For this processing pathway, another source
of H2 (e.g. electrolysis of H2O) would be necessary to complete the reduction.
Ecology Barrier H2-production by ME stimulates chain elongation and in that way can steer community towards a
larger abundance of chain elongating organisms such as C. kluyveri (See Section 3.2.6). Production
of EtOH by reduction of Ac is crucial for this stimulation, although this reaction could only be
implied from the obtained VFA-profile and could not thoroughly be demonstrated.
With regards to biologically limited production rates and product inhibition, several experiments
performed in this study point towards the substrate as the limiting factor for production of VFA
from thin stillage. Stream characterisation indicated that the reactive fraction is used for most of
the VFA-production in thin stillage fermentation at short HRT (6 days). As stoichiometric
equations obtained from literature could match the actual product profile rather closely, assuming
complete conversion of the reactive fraction, the main limitation appears to be the availability of
readily biodegradable COD present in thin stillage.
Limitation by the substrate was confirmed by both an increase and a decrease in HRT. An increase
in HRT did not result in a doubling of the VFA-concentrations, which would be expected if
production rates remained the same and substrate was not limited. The argument may be made
that this could be the result of product inhibition due to high concentrations. However, halving
the HRT from 6 to 3 days, implying a doubling of the OLR, resulted in a doubled production rate.
This can be explained by all of the reactive fraction being consumed within 24 hours by the
fermenting community, again suggesting limitation of substrate as opposed to product inhibition
causing production limitation. A final demonstration of the substrate being limiting as opposed to
product inhibition causing limitation of VFA production is the experiment on product inhibition
in thin stillage fermentation (see Section 3.2.5). The VFA production rate in this experiment was
not affected by an increase in VFA-concentration even if these were higher than the steady-state
concentrations obtained in a fermenter at pH 5.5 without ME. To mimic conditions in the reactor,
the proportions of VFA added in this batch test were similar to the proportions of the VFA
produced by the reactor. As the production rate was not influenced it is clear that the products of
fermentation do not affect the fermentation taking place in this community. This, again, leads to
65
the conclusion that, when thin stillage and its inherent community are used for fermentation,
abundance of the substrate determines the production of VFA.
Methanogen Barrier To retain as much carbon as possible in the form of carboxylates it is crucial to inhibit
methanogenesis in a VFA-producing fermenter. An attempt was made in this study to control CH4-
production by means of pH shocks. Initial experimental results proved promising, but it eventually
became clear that despite the application of 2-day shocks at pH 5, well below the established pH-
range for methanogenesis (Chen et al., 2008; Appels et al., 2008), VFA were still converted to CH4.
Not only did these shocks not work, acidogenic fermentation was insufficient to reach a pH of 5
in the fermenter, meaning that acid (anolyte acid or 2M HCl) had to be used. This was a step back
in the attempt to control the fermentation process without input of chemicals. As explained in
Section 3.3.2.2, the most likely explanation for CH4-production was hydrogenotrophic
methanogens surviving the pH shocks, possibly becoming more tolerant to pH shocks (Chae et al.,
2010). While this might be a negative outcome when VFA-production is the main goal, this strategy
increasing tolerance to pH might be useful when CH4 is the target product and H2 is abundantly
present in the headspace.
Returning to the inhibition of methanogenesis, it could very well be that the low OLR and low
VFA-concentrations obtained in the fermenter described in Section 3.3.2.2 were the key parameters
allowing presence of methanogens as CH4-production was only initiated after OLR was lowered.
In literature 2-bromoethanesulfonate is often used to prevent CH4-production through
methanogenesis as this selectively inhibits methanogens (Steinbusch et al., 2011; Zinder et al.,
1984). This is not realistic in full-scale processes due to the high cost of 2-bromoethanesulfonate.
At a concentration of 10 g.L-1 for inhibition (Steinbusch et al., 2011) and a cost of up to 0.946
USD.g-1 (Sigma Aldrich, 2015) this would cost 9.46 USD per L of reactor. For comparison, the
total VFA produced during electro-fermentation at pH 5.5 in this study represents a value of
approximately 0.024 USD per L of reactor.

66

67
Conclusion In this thesis the properties and potential of thin stillage as a substrate for biorefinery processes,
focusing on the production of VFA, were explored. The novel ME technology was applied to study
the influence of electrolytic extraction on the fermentation process, a process dubbed electro-
fermentation. We can conclude from the performed experiments that due to the inherent
community present in thin stillage, a result of its origins in the corn bio-EtOH process,
fermentation of part of the organics (i.e. the reactive fraction) in the thin stillage to VFA can take
place very quickly with complete conversion of this fraction in as little as 24 hours.
ME can help overcome at least two of the three barriers defined by Agler et al. (2011) as being
limiting to the breakthrough of the carboxylate platform as a mainstream platform for chemicals
production from biomass. ME was designed as a technique to overcome the separation barrier as
its main purpose is the separation of the produced VFA from the fermenting thin stillage to a clean
stream available for downstream processing of chemicals. The experiments performed in this thesis
were not meant to optimise the extraction of the VFA from the fermentation broth, yet the
technique was able to extract VFA produced by fermentation. Optimisation of the extraction, i.e.
by using batches of anolyte solutions as opposed to the semi-continuous system used here, could
yield even higher extraction efficiencies and product concentrations.
A key focus of the experiments applying ME in a fermenting reactor was the influence of the
cathodic reduction of water on the fermentative reactions taking place. It was shown that this
reduction results in a product profile containing more long-chain VFA (i.e. But, Val, Cap) than is
the case without ME. Although no community analysis results were available at the time of writing,
it appears realistic from literature analysis that the increased presence of H2 in the headspace of the
reactor allows reduction of Ac to EtOH, a key substrate for chain elongation. This would imply an
increase in the abundance of chain elongating organisms (e.g. Clostridium kluyveri), suggesting ME
can alter the composition of the fermenting community. This ties into a second barrier defined by
Agler et al. (2011), the ecology barrier. Product inhibition, also relating to the ecology barrier, has
little influence on the fermentation of thin stillage and biological production rates can be very high.
The fastest conversion rates obtained may have been limited by the daily feeding of thin stillage
showing biological limitations appear insignificant for thin stillage fermentation.
Although a main goal of this thesis was to obtain zero chemical input control over the entire
fermentation process, methanogenic activity could not effectively be controlled using ME. This
conversion of multi-carbon VFA to the single carbon CH4 is undesirable in light of the carboxylate
platform. The goal here is to produce industrial precursor chemicals, and while the more reduced
state of CH4 may be energetically more attractive, it is less favourable for production of chemicals.
pH shocks, although an attractive strategy for inhibition of acetoclastic methanogens, are
unsuitable for methanogenic control in electro-fermentation as the increased H2-pressure may be
beneficial for hydrogenotrophic methanogens. As these are more resilient to low pH, pH shocks
are unsuitable as a strategy for inhibition of these organisms. Consequently this study could not yet
overcome the methanogen barrier, the third barrier described by Agler et al. (2011).

68

69
Sustainability The technology used in a process can have a large influence on the sustainability of the overall
process. A large part of this thesis focussed on increasing the sustainability of carboxylate platform
processes by reducing the chemicals demand for control of the process. Nonetheless a total of 6.8
L 2M NaOH, 2.5 L 1M H2SO4 and 0.4 L 2M HCl was used for pH control over the course of 9
months of experiments. Much of this was used on experiments that ultimately failed to produce
relevant data for the thesis, due to experimental issues, irrelevance of the experiments, etc. The
carbon footprint of the NaOH used in the experiments amounts to 1.04 kg CO2-eq. Since the use
of ME could cut the carbon footprint of pH-control (NaOH vs. electricity requirement) with 20%,
this thesis has provided a step forward in reducing the chemicals usage and associated carbon
footprint for future experiments.
Over the course of 9 months of lab work, a total of 712 VFA-analyses were performed. VFA-
analyses require 2 mL of diethyl ether for extraction of VFA per sample, which means a total of
approximately 1.4 L of diethyl ether was used over the course of the performed experiments. This
is a very volatile solvent, implying emissions of volatile organic compounds to the atmosphere.
Reducing the number of times the diethyl ether bottle is opened could reduce these volatile
emissions. By using a pumping system to pump diethyl ether as opposed to opening the bottle to
take ether with a pipette, these emissions could be further reduced. An added advantage of this
system would be more accurate dosing of ether, although care should be taken to use materials that
do not react with diethyl ether, avoiding both equipment damage and diethyl ether contamination.

70

71
Future research possibilities Several interesting research possibilities can be based on the result of this thesis. First of all,
research on the potential of increasing OLR for methanogen inhibition could help overcome the
methanogen barrier and unlock thin stillage’s potential for carboxylate production.
Since ME is necessary for valorisation, all its influences should be investigated. This includes the
apparent Ac-reduction producing EtOH, stimulating chain elongation but also the mechanism
behind the solids decrease should be elucidated. As explained in Section 3.2.2, a process similar to
electro-coagulation could be responsible for this solids decrease, although this remains unclear.
Once (electro)-fermentation of thin stillage is well understood, optimisation of the process - both
production of VFA and their extraction - is a next step in future research. Optimisation of the
production of VFA would involve studying the lowest possible HRT for stable VFA-production
and complete conversion of the reactive fraction. Extraction of the products could be optimised
by intermittent extraction of VFA. Intermittent extraction entails a period with no or low applied
current to allow VFA-production - and corresponding increase in VFA-concentrations - followed
by a period with increased current for extraction, which should be more efficient at these higher
concentrations. In theory, one extraction device could be used for multiple reactors with this
system. On the other hand, ME could also be coupled to an electronic pH-control system which
could increase current when pH drops too low due to acidogenic fermentation. Study on the
behaviour of membranes in environments with high VFA-concentrations and low pH is also
necessary to allow product concentrations adequate for downstream processing. Besides
membrane behaviour, materials research into membranes selectively extracting VFA could also be
beneficial to increase extraction efficiencies.
Further on, studies on upscaling, using dedicated experimental reactors, will be necessary for this
process to be implemented in industrial settings. Not only the reactor, but also ME - more
specifically the configuration and operation of the extraction device(s) - will need to be optimised
for this purpose. For further optimisation, the fermentation and extraction processes could be
modelled mathematically, in much greater detail than the stoichiometric model presented here. This
model could be used to perform virtual experiments, allowing cost-effective identification of
optimal operating conditions (e.g. pH, HRT) as well as identification of bottlenecks in the process.

72
73
References
Agler, M.T., Spirito, C.M., Usack, J.G., Werner, J.J. & Angenent, L.T., 2012. Chain elongation with reactor microbiomes: upgrading dilute ethanol to medium-chain carboxylates. Energy & Environmental Science, 5(8), 8189–8192.
Agler, M.T., Spirito, C.M., Usack, J.G., Werner, J.J. & Angenent, L.T., 2014. Development of a highly specific and productive process for n-caproic acid production: applying lessons from methanogenic microbiomes. Water Science & Technology, 69(1), 62–68.
Agler, M.T., Wrenn, B., Zinder, S. & Angenent, L., 2011. Waste to bioproduct conversion with undefined mixed cultures: the carboxylate platform. Trends in biotechnology, 29(2), 70–78.
Agricultural Marketing Resource Center, 2015. Estimated U.S. Dried Distillers Grains with Solubles (DDGS) Production & Use. , 1–5. Available at: http://www.extension.iastate.edu/agdm/crops/outlook/cornbalancesheet.pdf (Accessed May 7, 2015).
Alco BioFuel, 2014. Bio-Ethanol Production. Available at: http://www.alcobiofuel.com/index.php?node_id=6 (Accessed October 29, 2014).
Andersen, S.J., Hennebel, T., Gildemyn, S., Coma, M., Desloover, J., Berton, J., Tsukamoto, J., Stevens, C. & Rabaey, K., 2014. Electrolytic Membrane Extraction Enables Production of Fine Chemicals from Biorefinery Sidestreams. Environmental Science & Technology, 48(12), 7135–7142.
Angenent, L.T., Karim, K., Al-dahhan, M.H., Wrenn, B.A. & Domíguez-Espinosa, R., 2004. Production of bioenergy and biochemicals from industrial and agricultural wastewater. Trends in biotechnology, 22(9), 477–485.
APHA, 2005. Standard Methods for the Examination of Water and Wastewater, Washington, D.C., U.S.A.: American Public Health Association.
Appels, L., Baeyens, J., Degrève, J. & Dewil, R., 2008. Principles and potential of the anaerobic digestion of waste-activated sludge. Progress in Energy and Combustion Science, 34(6), 755–781.
Arora, A., Seth, A., Dien, B.S., Belyea, R.L., Singh, V., Tumbleson, M.E. & Rausch, K.D., 2011. Microfiltration of thin stillage: Process simulation and economic analyses. Biomass and Bioenergy, 35(1), 113–120.
Asdrubali, F., Baldinelli, G., D’Alessandro, F. & Scrucca, F., 2015. Life cycle assessment of electricity production from renewable energies: Review and results harmonization. Renewable and Sustainable Energy Reviews, 42, 1113–1122.
Bagastyo, A.Y., Radjenovic, J., Mu, Y., Rozendal, R.A., Batstone, D.J. & Rabaey, K., 2011. Electrochemical oxidation of reverse osmosis concentrate on mixed metal oxide (MMO) titanium coated electrodes. Water research, 45(16), 4951–4959.

74
Banat, I., Nigam, P. & Singh, D., 1998. Review: Ethanol production at elevated temperatures and alcohol concentrations: Part I–Yeasts in general. World Journal of Microbiology & Biotechnology, 14(6), 809–821.
Barbirato, F., Chedaille, D. & Bories, A., 1997. Propionic acid fermentation from glycerol: comparison with conventional substrates. Applied Microbiology and Biotechnology, 47(4), 441–446.
Batstone, D. & Keller, J., 2002. The IWA Anaerobic Digestion Model No 1 (ADM 1). Water Science & Technology, 45(10), 65–73.
Bechthold, I. & Bretz, K., 2008. Succinic acid: a new platform chemical for biobased polymers from renewable resources. Chemical Engineering & Technology, 31(5), 647–654.
Le Berre, C., Serp, P., Kalck, P. & Torrence, G.P., 2014. Acetic Acid. Ullmann’s Encyclopedia of Industrial Chemistry, 1–34.
Bornstein, B.T. & Barker, H.A., 1948. The energy metabolism of Clostridium kluyveri and the synthesis of fatty acids. Journal of Biological Chemistry, 172, 659–669.
Chae, K.-J., Choi, M.-J., Kim, K.-Y., Ajayi, F.F., Park, W., Kim, C.-W. & Kim, I.S., 2010. Methanogenesis control by employing various environmental stress conditions in two-chambered microbial fuel cells. Bioresource technology, 101(14), 5350–5357.
Chen, Y., Cheng, J.J. & Creamer, K.S., 2008. Inhibition of anaerobic digestion process: A review. Bioresource Technology, 99(10), 4044–64.
Cheon, Y., Kim, J.-S., Park, J.-B., Heo, P., Lim, J.H., Jung, G.Y., Seo, J.-H., Park, J.H., Koo, H.M., Cho, K.M., Park, J.-B., Ha, S.-J. & Kweon, D.-H., 2014. A biosynthetic pathway for hexanoic acid production in Kluyveromyces marxianus. Journal of Biotechnology, 182-183, 30–36.
Colmenarejo, M.., Sánchez, E., Bustos, A., Garcı ́a, G. & Borja, R., 2004. A pilot-scale study of total volatile fatty acids production by anaerobic fermentation of sewage in fixed-bed and suspended biomass reactors. Process Biochemistry, 39(10), 1257–1267.
Dereli, R.K., Urban, D.R., Heffernan, B., Jordan, J.A., Ewing, J., Rosenberger, G.T. & Dunaev, T.I., 2012. Performance evaluation of a pilot-scale anaerobic membrane bioreactor (AnMBR) treating ethanol thin stillage. Environmental Technology, 33(13), 1511–1516.
Van Eerten-Jansen, M.C.A.A., Ter Heijne, A., Grootscholten, T.I.M., Steinbusch, K.J.J., Sleutels, T.H.J. a., Hamelers, H.V.M. & Buisman, C.J.N., 2013. Bioelectrochemical Production of Caproate and Caprylate from Acetate by Mixed Cultures. ACS Sustainable Chemistry & Engineering, 1(5), 513–518.
European Commission, 2001. Integrated Pollution Prevention and Control Reference Document on Best Available Techniques in the Chlor-Alkali Manufacturing Industry,
Fernando, S., Adhikari, S., Chandrapal, C. & Murali, N., 2006. Biorefineries: Current Status, Challenges, and Future Direction. Energy & Fuels, 20(4), 1727–1737.

75
Ghatak, H.R., 2011. Biorefineries from the perspective of sustainability: Feedstocks, products, and processes. Renewable and Sustainable Energy Reviews, 15(8), 4042–4052.
Granda, C.B., Holtzapple, M.T., Luce, G., Searcy, K. & Mamrosh, D.L., 2009. Carboxylate platform: the MixAlco process part 2: process economics. Applied Biochemistry and BIotechnology, 156(1-3), 537–554.
Granta Design, 2014. CES EduPack Software. Available at: http://www.grantadesign.com/education/edupack/index.htm (Accessed May 8, 2015).
Gueguim Kana, E.B., Schmidt, S. & Azanfack Kenfack, R.H., 2013. A web-enabled software for real-time biogas fermentation monitoring – Assessment of dark fermentations for correlations between medium conductivity and biohydrogen evolution. International Journal of Hydrogen Energy, 38(25), 10235–10244.
Harris, I., Henry, D.P. & Frost, A., 2001. The effect of volatile fatty acids in acidified fermented piggery effluent on shiga-toxigenic and non-toxic resident strains of Escherichia coli. Letters in Applied Microbiology, 33(6), 415–419.
Hoffman, L.A. & Baker, A., 2011. Estimating the Substitution of Distillers’ Grains for Corn and Soybean Meal in the U.S. Feed Complex,
Hofstrand, D., 2015. Ethanol Profitability. Iowa State University, Extension and Outreach, Ag Decision Maker. Available at: www.extension.iastate.edu/agdm/energy/xls/d1-10ethanolprofitability.xlsx (Accessed May 7, 2015).
Hollister, E.B., Forrest, A.K., Wilkinson, H.H., Ebbole, D.J., Tringe, S.G., Malfatti, S. a, Holtzapple, M.T. & Gentry, T.J., 2012. Mesophilic and thermophilic conditions select for unique but highly parallel microbial communities to perform carboxylate platform biomass conversion. PloS ONE, 7(6), 1–11.
Holtzapple, M.T. & Granda, C.B., 2009. Carboxylate platform: the MixAlco process part 1: comparison of three biomass conversion platforms. Applied biochemistry and biotechnology, 156(1-3), 525–536.
Hu, W., Zhong, H., Liang, W. & Chen, S., 2014. Ir-Surface enriched porous Ir-Co oxide hierarchical architecture for high performance water oxidation in acidic media. ACS applied Materials & Interfaces, 6(15), 12729–12736.
Inbicon, 2014. Biomass Refinery. Available at: http://www.inbicon.com/en/biomass-refinery (Accessed October 28, 2014).
Jang, Y.-S., Kim, B., Shin, J.H., Choi, Y.J., Choi, S., Song, C.W., Lee, J., Park, H.G. & Lee, S.Y., 2012. Bio-based production of C2-C6 platform chemicals. Biotechnology and Bioengineering, 109(10), 2437–59.
Jencks, W.P. & Regenstein, J., Ionisation Constants of Acids and Bases. In Handbook of Biochemistry and Molecular Biology. CRC Press, 305–351.
Jiménez, A.M., Borja, R. & Martı́n, A., 2003. Aerobic–anaerobic biodegradation of beet molasses alcoholic fermentation wastewater. Process Biochemistry, 38(9), 1275–1284.

76
Kamm, B. & Kamm, M., 2004. Principles of biorefineries. Applied Microbiology and Biotechnology, 64(2), 137–145.
Kim, I.S., Hwang, M., Jang, N., Hyun, S. & Lee, S., 2004. Effect of low pH on the activity of hydrogen utilizing methanogen in bio-hydrogen process. International Journal of Hydrogen Energy, 29(11), 1133–1140.
Kim, Y., Mosier, N.S., Hendrickson, R., Ezeji, T., Blaschek, H., Dien, B., Cotta, M., Dale, B. & Ladisch, M.R., 2008. Composition of corn dry-grind ethanol by-products: DDGS, wet cake, and thin stillage. Bioresource Technology, 99(12), 5165–76.
Lange, J.-P., Price, R., Ayoub, P.M., Louis, J., Petrus, L., Clarke, L. & Gosselink, H., 2010. Valeric biofuels: a platform of cellulosic transportation fuels. Angewandte Chemie International Edition in English, 49(26), 4479–4483.
Larsen, J., Haven, M.Ø. & Thirup, L., 2012. Inbicon makes lignocellulosic ethanol a commercial reality. Biomass and Bioenergy, 46, 36–45.
Larsen, J., Østergaard Petersen, M., Thirup, L., Wen Li, H. & Krogh Iversen, F., 2008. The IBUS Process – Lignocellulosic Bioethanol Close to a Commercial Reality. Chemical Engineering & Technology, 31(5), 765–772.
Larsson, M., Truong, X.-B., Björn, A., Ejlertsson, J., Bastviken, D., Svensson, B.H. & Karlsson, A., 2015. Anaerobic digestion of alkaline bleaching wastewater from a kraft pulp and paper mill using UASB technique. Environmental Technology, 36(12), 1489–1498.
Leang, C., Ueki, T., Nevin, K.P. & Lovley, D.R., 2013. A genetic system for Clostridium ljungdahlii: a chassis for autotrophic production of biocommodities and a model homoacetogen. Applied and Environmental Microbiology, 79(4), 1102–1109.
Lee, P.-H., Bae, J., Kim, J. & Chen, W.-H., 2011. Mesophilic anaerobic digestion of corn thin stillage: a technical and energetic assessment of the corn-to-ethanol industry integrated with anaerobic digestion. Journal of Chemical Technology & Biotechnology, 86(12), 1514–1520.
Lee, W.S., Chua, A.S.M., Yeoh, H.K. & Ngoh, G.C., 2014. A review of the production and applications of waste-derived volatile fatty acids. Chemical Engineering Journal, 235, 83–99.
Lindner, J., Zielonka, S., Oechsner, H. & Lemmer, A., 2015. Effect of different pH-values on process parameters in two-phase anaerobic digestion of high-solid substrates. Environmental Technology, 36(2), 198–207.
Liu, H., Wang, J., Liu, X., Fu, B., Chen, J. & Yu, H.-Q., 2012. Acidogenic fermentation of proteinaceous sewage sludge: Effect of pH. Water research, 46(3), 799–807.
Liu, Y. & Whitman, W.B., 2008. Metabolic, phylogenetic, and ecological diversity of the methanogenic archaea. Annals of the New York Academy of Sciences, 1125, 171–189.
Lyte, P., Sur, R., Nigam, A. & Southall, M.D., 2009. Heat-killed Propionibacterium acnes is capable of inducing inflammatory responses in skin. Experimental Dermatology, 18(12), 1070–1072.

77
Maaß, O., Grundmann, P. & von Bock und Polach, C., 2014. Added-value from innovative value chains by establishing nutrient cycles via struvite. Resources, Conservation and Recycling, 87, 126–136.
Madigan, M., Martinko, J., Stahl, D. & Clark, D., 2012. Brock Biology of Microorganisms, 13th edn, International Microbiology.
Marshall, C.W., LaBelle, E. V & May, H.D., 2013. Production of fuels and chemicals from waste by microbiomes. Current Opinion in Biotechnology, 24(3), 391–397.
Merkusheva, N. & Rapsomanikis, G., 2014. Nonlinear cointegration in the food-ethanol-oil system: Evidence from smooth threshold vector error correction models. ESA Working Paper No. 14-01, Rome, FAO.
Mollah, M.Y. a, Morkovsky, P., Gomes, J. a G., Kesmez, M., Parga, J. & Cocke, D.L., 2004. Fundamentals, present and future perspectives of electrocoagulation. Journal of Hazardous Materials, 114(1-3), 199–210.
Morimitsu, M., Murakami, C., Kawaguchi, K., Otogawa, R. & Matsunaga, M., 2004. Stability of Iridium Oxide-Tantalum Oxide Coated Titanium Electrodes for Oxygen Evolution in Alkaline Solutions. Journal of New Materials for Electrochemical Systems, 7, 323–327.
Naik, S.N., Goud, V. V., Rout, P.K. & Dalai, A.K., 2010. Production of first and second generation biofuels: A comprehensive review. Renewable and Sustainable Energy Reviews, 14(2), 578–597.
NREL, 2009. What Is a Biorefinery. Available at: http://www.nrel.gov/biomass/biorefinery.html (Accessed October 12, 2014).
Palmqvist, E. & Hahn-Hägerdal, B., 2000. Fermentation of lignocellulosic hydrolysates. II: inhibitors and mechanisms of inhibition. Bioresource Technology, 74(1), 25–33.
Perez, J.M., Richter, H., Loftus, S.E. & Angenent, L.T., 2013. Biocatalytic reduction of short-chain carboxylic acids into their corresponding alcohols with syngas fermentation. Biotechnology and Bioengineering, 110(4), 1066–1077.
Pikaar, I., Rozendal, R.A., Yuan, Z. & Rabaey, K., 2011. Electrochemical caustic generation from sewage. Electrochemistry Communications, 13(11), 1202–1204.
Piveteau, P., 1999. Metabolism of lactate and sugars by dairy propionibacteria : A review. Le Lait, 79(1), 23–41.
Pratt, S., Liew, D., Batstone, D.J., Werker, A.G., Morgan-Sagastume, F. & Lant, P.A., 2012. Inhibition by fatty acids during fermentation of pre-treated waste activated sludge. Journal of Biotechnology, 159(1-2), 38–43.
Rader, G.K. & Logan, B.E., 2010. Multi-electrode continuous flow microbial electrolysis cell for biogas production from acetate. International Journal of Hydrogen Energy, 35(17), 8848–8854.
Redwood, M.D., Orozco, R.L., Majewski, A.J. & Macaskie, L.E., 2012. Electro-extractive fermentation for efficient biohydrogen production. Bioresource Technology, 107, 166–174.

78
Renewable Fuels Association, 2015. Pocket Guide to Ethanol 2015. , 1–18. Available at: http://ethanolrfa.3cdn.net/23d732bf7dea55d299_3wm6b6wwl.pdf (Accessed May 7, 2015).
Ricke, S., 2003. Perspectives on the use of organic acids and short chain fatty acids as antimicrobials. Poultry Science, 82(4), 632–639.
Righi, E., Fantuzzi, G., Predieri, G. & Aggazzotti, G., 2014. Bromate, chlorite, chlorate, haloacetic acids, and trihalomethanes occurrence in indoor swimming pool waters in Italy. Microchemical Journal, 113, 23–29.
Rodríguez, J., Kleerebezem, R., Lema, J.M. & Van Loosdrecht, M.C.M., 2006. Modeling product formation in anaerobic mixed culture fermentations. Biotechnology and Bioengineering, 93(3), 592–606.
Roos, A. & Boron, W.F., 1981. Intracellular pH. Physiological Reviews, 61(2), 296–434.
Royce, L. a, Liu, P., Stebbins, M.J., Hanson, B.C. & Jarboe, L.R., 2013. The damaging effects of short chain fatty acids on Escherichia coli membranes. Applied Microbiology and Biotechnology, 97(18), 8317–8327.
Ryan, D. & Johnson, R., 2001. Dialysis and ultrafiltration of molasses for fermentation enhancement. Separation and Purification Technology, 22-23, 239–245.
Sánchez, E., Borja, R., Travieso, L., Martín, A. & Colmenarejo, M.F., 2005. Effect of organic loading rate on the stability, operational parameters and performance of a secondary upflow anaerobic sludge bed reactor treating piggery waste. Bioresource technology, 96(3), 335–344.
Sanders, J., Scott, E., Weusthuis, R. & Mooibroek, H., 2007. Bio-refinery as the bio-inspired process to bulk chemicals. Macromolecular Bioscience, 7(2), 105–117.
Seeliger, S., Janssen, P.H. & Schink, B., 2002. Energetics and kinetics of lactate fermentation to acetate and propionate via methylmalonyl-CoA or acrylyl-CoA. FEMS Microbiology Letters, 211(1), 65–70.
Siegert, I. & Banks, C., 2005. The effect of volatile fatty acid additions on the anaerobic digestion of cellulose and glucose in batch reactors. Process Biochemistry, 40(11), 3412–3418.
Sigma Aldrich, 2015. Sodium 2-bromoethanesulfonate 98%. Available at: http://www.sigmaaldrich.com/catalog/product/aldrich/137502?lang=en®ion=US (Accessed May 21, 2015).
Singhania, R.R., Patel, A.K., Christophe, G., Fontanille, P. & Larroche, C., 2013. Biological upgrading of volatile fatty acids, key intermediates for the valorization of biowaste through dark anaerobic fermentation. Bioresource Technology, 145, 166–174.
Skinner, S., Weersink, A. & DeLange, C.F., 2012. Impact of Dried Distillers Grains with Solubles (DDGS) on Ration and Fertilizer Costs of Swine Farmers. Canadian Journal of Agricultural Economics, 60(3), 335–356.

79
Skrivanova, E. & Marounek, M., 2007. Influence of pH on Antimicrobial Activity of Organic Acids against Rabbit Enteropathogenic Strain of Escherichia coli *. Folia Microbiologica, 52(1), 70–72.
Sluiter, A., Hames, B., Ruiz, R., Scarlata, C., Sluiter, J. & Templeton, D., 2006. Determination of Sugars , Byproducts , and Degradation Products in Liquid Fraction Process Samples Laboratory Analytical Procedure ( LAP ),
Spirito, C.M., Richter, H., Rabaey, K., Stams, A.J.M. & Angenent, L.T., 2014. Chain elongation in anaerobic reactor microbiomes to recover resources from waste. Current Opinion in Biotechnology, 27, 115–122.
Steinbusch, K.J.J., Arvaniti, E., Hamelers, H.V.M. & Buisman, C.J.N., 2009. Selective inhibition of methanogenesis to enhance ethanol and n-butyrate production through acetate reduction in mixed culture fermentation. Bioresource Technology, 100(13), 3261–3267.
Steinbusch, K.J.J., Hamelers, H.V.M., Plugge, C.M. & Buisman, C.J.N., 2011. Biological formation of caproate and caprylate from acetate: fuel and chemical production from low grade biomass. Energy & Environmental Science, 4(1), 216–224.
Taheripour, F., Hertel, T.W., Tyner, W.E., Beckman, J.F. & Birur, D.K., 2010. Biofuels and their by-products: Global economic and environmental implications. Biomass and Bioenergy, 34(3), 278–289.
Taherzadeh, M.J. & Karimi, K., 2008. Pretreatment of lignocellulosic wastes to improve ethanol and biogas production: a review. International journal of Molecular Sciences, 9(9), 1621–1651.
Temudo, M.F., Kleerebezem, R. & van Loosdrecht, M., 2007. Influence of the pH on (open) mixed culture fermentation of glucose: a chemostat study. Biotechnology and Bioengineering, 98(1), 69–79.
Temudo, M.F., Mato, T., Kleerebezem, R. & Van Loosdrecht, M.C.M., 2009. Xylose anaerobic conversion by open-mixed cultures. Applied Microbiology and Biotechnology, 82(2), 231–239.
Thrash, J.C. & Coates, J.D., 2008. Review : Direct and Indirect Electrical Stimulation of Microbial Metabolism. Environmental Science and Technology, 42(11), 3921–3931.
Turner, L.K. & Collins, F.G., 2013. Carbon dioxide equivalent (CO2-e) emissions: A comparison between geopolymer and OPC cement concrete. Construction and Building Materials, 43, 125–130.
Ucisik, A.S. & Henze, M., 2008. Biological hydrolysis and acidification of sludge under anaerobic conditions: the effect of sludge type and origin on the production and composition of volatile fatty acids. Water Research, 42(14), 3729–3738.
Volcke, E., 2014. Course Environmental Constructions 2014-2015.
Wagemann, K., 2014. Herstellung von Grundchemikalien auf Basis nachwachsender Rohstoffe als Alternative zur Petrochemie? Chemie Ingenieur Technik, 86(12), 2115–2134.

80
Ward, A.J., Hobbs, P.J., Holliman, P.J. & Jones, D.L., 2008. Optimisation of the anaerobic digestion of agricultural resources. Bioresource Technology, 99(17), 7928–7940.
Wilkie, A.C., Riedesel, K.J. & Owens, J.M., 2000. Stillage characterization and anaerobic treatment of ethanol stillage from conventional and cellulosic feedstocks. Biomass and Bioenergy, 19(2), 63–102.
Yan, J., Lo, K. & Pinder, K., 1993. Instability Caused By High-Strenght of Cheese Whey In A UASB-Reactor. Biotechnology and Bioengineering, 41(7), 700–706.
Yee, R.S.L., Rozendal, R. a., Zhang, K. & Ladewig, B.P., 2012. Cost effective cation exchange membranes: A review. Chemical Engineering Research and Design, 90(7), 950–959.
Ylitervo, P., Akinbomi, J. & Taherzadeh, M.J., 2013. Membrane bioreactors’ potential for ethanol and biogas production: a review. Environmental Technology, 34(13-14), 1711–1723.
Yu, H.-Q. & Fang, H.H.P., 2002. Acidogenesis of dairy wastewater at various pH levels. Water Science & Technology, 45(10), 201–206.
Yutin, N. & Galperin, M.Y., 2013. A genomic update on clostridial phylogeny: Gram-negative spore formers and other misplaced clostridia. Environmental Microbiology, 15(10), 2631–2641.
Zhang, F., Merrill, M.D., Tokash, J.C., Saito, T., Cheng, S., Hickner, M. a. & Logan, B.E., 2011. Mesh optimization for microbial fuel cell cathodes constructed around stainless steel mesh current collectors. Journal of Power Sources, 196(3), 1097–1102.
Zhang, Y., Merrill, M.D. & Logan, B.E., 2010. The use and optimization of stainless steel mesh cathodes in microbial electrolysis cells. International Journal of Hydrogen Energy, 35(21), 12020–12028.
Zinder, S., Anguish, T. & Cardwell, S.C., 1984. Selective inhibition by 2-bromoethanesulfonate of methanogenesis from acetate in a thermophilic anaerobic digestor. Applied and Environmental Microbiology, 47(6), 1343–1345.