Embed Size (px)
Citation preview
Military Technical College
Kobry Elkobbah, Cairo, Egypt
April 19-21,2016
8th International Conference on Mathematics and Engineering
Physics (ICMEP-8)
1
PH-4 Solar Power Tower Systems and Their Potential Use
in Egypt M. A. Mustafa (*), S. Abdelhady (**), A. Wetedy (***)
* PhD student, Dept. of Mech. Power, MTC, Cairo, Egypt. Mail: [email protected] ** Professor Dr. Eng, Dept. of Renewable energy, Faculty of energy Engineering, Aswan University, *** Dr. Eng., Dept. of Mech. Power, MTC, Cairo, Egypt. Abstract The aim of this Paper is to carry out an analytical and experimental study of a solar power tower plant in the Egyptian environment in order to study the technical and economic feasibility of this kind of power generation. In this way, a parametric study of such plant is carried out in a comparative way with an already existing commercial power plant, PS 10 in Spain, to investigate performance of such kind of plants in the Egyptian environment. The site of Aswan has been chosen to simulate the proposed plant. However, a site in Helwan is used to carry out the experimental work that verifies the selected solar data in Egypt. As a conclusion from the analytic parametric study, the energy-exergy analysis, the experimental work; it is found that it is very feasible, technically and economically, to use solar power tower plant as the most suitable CSP technology in Egypt. The found analytical and experimental results in this thesis can be used as a guide and a reference for planning a solar tower power plant to be installed in Egypt in future. This includes the site selection, design parameters and procedures, heliostat field distribution, tower height, the components to be locally manufactured, required performance, the suitable output power and the levelized energy cost. Keywords; Solar Power Tower Systems, Solar Energy Potential in Egypt, Concentrated Solar Power, Solar Energy 1. Introduction
The world resident’s increasing leads to high energy consumption. As a result, rapid depletion of conventional energy resources occurs [1]. The demand growing on energy resources is much higher than the population growth [2]. The world main energy resources depend on 80% from fossil fuel resource [3]. The global demand of electric energy is estimated to be doubled in the next 10–15 years [1]. Conventional energy resources in Egypt will be unable to satisfy demand by 2020 [4]. The challenge for world and each country in the next few years is to find other energy resources [5]. For all above mentioned reasons, the use of renewable sources, especially solar energy, as
Military Technical College
Kobry Elkobbah, Cairo, Egypt
April 19-21,2016
8th International Conference on Mathematics and Engineering
Physics (ICMEP-8)
2
an electricity generation alternative system is a must to keep the fossil fuel resources for the important industrial applications of coming generation.
Solar energy is a reliable and valuable resource of energy which depends on the sun activity. The sun is the main source of life, so, if the energy resource depend on the sun, the life activities will be kept safe. Egypt has a high solar irradiance due to its location in the solar belt [4].
The renewable energy including Solar Power plants represent 20 % of the total power to be installed in the framework of the Egypt plan of electricity generation by 2020 [6]. The Egyptian governmental solar plan is to install 100 MW CSP by 2017 [7]. An electricity generation project which consists of installing up 4000 MW of power generating capacity from solar energy sources between 2013 and 2016 using Photovoltaic (PV) power plants is executed. The PV technology has many drawbacks like peak power production, storage cost, low efficiency with high ambient temperature and high solar Irradiance, high losses due to wiring cables. The PV drawbacks lead to high levelized energy cost. The other concentrated solar technologies incorporate three essential and different designs, the parabolic trough, the Dish Stirling System and the power tower system.
This paper gives a description of an imaginary Solar Power Tower System (SPTS) in Aswan - Egypt in a comparative way with the world first commercial SPTS which exists in Spain (PS10). the study include the solar field, innovated solar field suited for Egypt, energy and exergy analysis, experimental test for the parameters affecting the performance of the SPTS and a feasibility of such system in Egypt.
2. Solar Power Tower Systems
A power tower system converts sunshine into clean electricity for the world’s electricity grids. The technology utilizes many large, sun-tracking mirrors (heliostats) to focus sunlight on a receiver at the top of a tower. A heat transfer fluid heated in the receiver is used to generate steam, which, in turn, is used in a conventional turbine-generator to produce electricity. Early power towers (such as the Solar One plant) utilized steam as the heat transfer fluid. The current European designs use air as heat transfer medium because of its high temperature and its good availability. There are Individual commercial plants sized to produce from 10 to 400 MW of electricity. Table.1 Illustrate the current SPTS all over the world.
The power cycles commonly used in SPTS are the Rankin and brayton cycles. Both can accommodate the high temperature generated in the solar receiver. Storage issues are of practical concern when the fluid is molten salt because of its high freeze temperature (range of melting temperature is from 250o to 650o C). So, during extended outages, the system must be drained
Military Technical College
Kobry Elkobbah, Cairo, Egypt
April 19-21,2016
8th International Conference on Mathematics and Engineering
Physics (ICMEP-8)
3
into a storage tank to avoid solidification of salt and complicating the plants restart [9].
Table.1 World existing SPT plants all over the world [8] Project Country Power
(MWe) Heat Transfer
fluid Storage media
Beginning operation
SSPS Spain 0.5 Liquid Sodium Sodium 1981
ERUELIOS Italy 1 Steam Nitrate Salt/Water 1981
SUNSHINE Japan 1 Steam Nitrate Salt/Water 1981
Solar One United States 10 Steam Oil/Rock 1982
CESA-1 Spain 1 Steam Nitrate Salt 1982
MSEE/Cat B United States 1 Nitrate Salt Nitrate Salt 1983
THEMIS France 2.5 Hitec Salt Hitec Salt 1984 SPP-5 Russia 5 Steam Water/Steam 1986 TSA Spain 1 Air Ceramic 1993
Solar II United States 10 Nitrate Salt Nitrate Salt 1996
Consolar Israel 0.5 Pressurized Air Fossil Hybrid 2001 PS10 Spain 10 Steam Water/Steam 2007
Solar Tres Spain 15 Molten Salt Molten Salt 2007
Sierra United States 5 Molten salt Molten salt 2009
Jülich Germany 1.5 Molten salt Molten salt 2008 Greenway Turkey 5 Molten salt Molten salt 2013
PS20 Spain 20 Steam Water/Steam 2013
Ivanpah Solar United States 392 Molten Salt Molten Salt Under
construction
3. PS10 Solar Power Tower Description
Due to the positive experiences using the TSA and SSPS System, a 10MW solar tower power plant PS10 (Planta Solar 10) began to design and constructed in the Southwest of Spain in 2004 and has been operated since 2007. Different from other Spanish systems, PS10 employs a tube saturated steam receiver which consists of four tube panels with the size of 5.36 x 12.0m and nominal heats steam at 45 bars at 250oC. The receiver is situated on a tower of approximately 115 m high. The heliostat field of PS10 consists of 624 faceted glass/metal heliostats with the type of Sanlúcar 120. Each heliostat has a mirror surface of 120m².
Military Technical College
Kobry Elkobbah, Cairo, Egypt
April 19-21,2016
8th International Conference on Mathematics and Engineering
Physics (ICMEP-8)
4
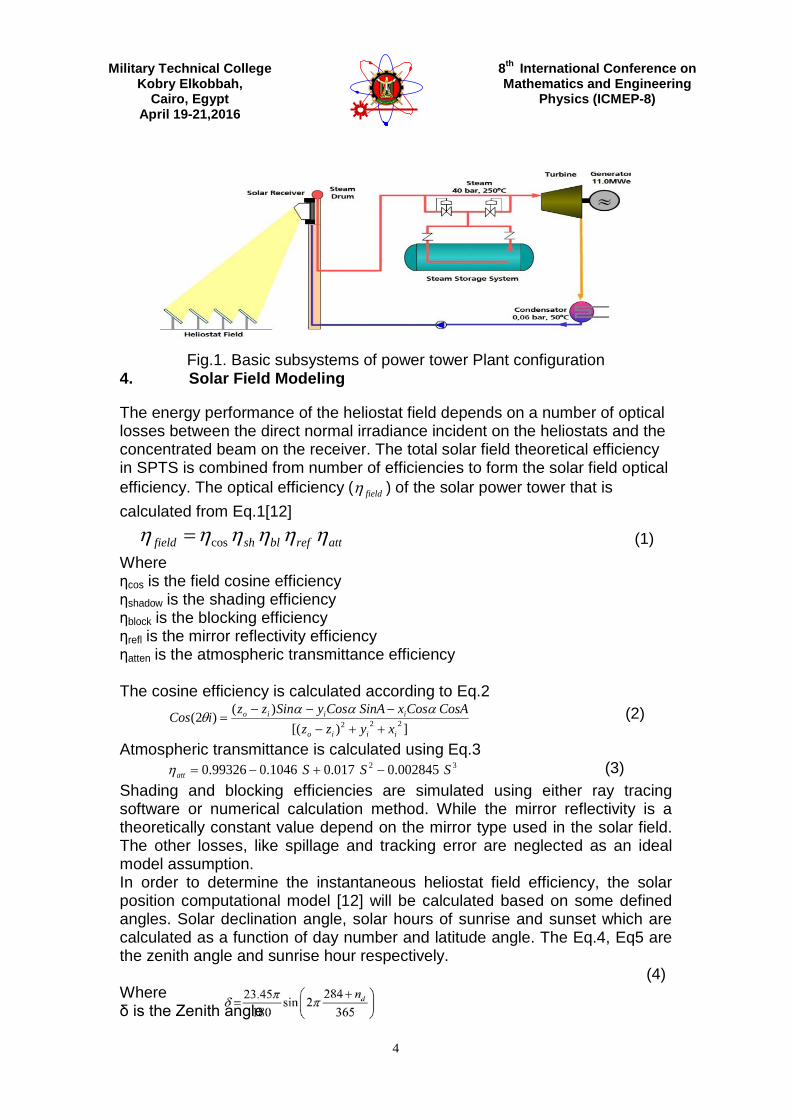
Fig.1. Basic subsystems of power tower Plant configuration
4. Solar Field Modeling
The energy performance of the heliostat field depends on a number of optical losses between the direct normal irradiance incident on the heliostats and the concentrated beam on the receiver. The total solar field theoretical efficiency in SPTS is combined from number of efficiencies to form the solar field optical efficiency. The optical efficiency ( fieldη ) of the solar power tower that is calculated from Eq.1[12]
attrefblshfield ηηηηηη cos= (1) Where ηcos is the field cosine efficiency ηshadow is the shading efficiency ηblock is the blocking efficiency ηrefl is the mirror reflectivity efficiency ηatten is the atmospheric transmittance efficiency The cosine efficiency is calculated according to Eq.2
])[()()2( 222
iiio
iiio
xyzzCosACosxSinACosySinzziCos
++−−−−
=αααθ
(2)
Atmospheric transmittance is calculated using Eq.3 32 002845.0017.01046.099326.0 SSSatt −+−=η (3)
Shading and blocking efficiencies are simulated using either ray tracing software or numerical calculation method. While the mirror reflectivity is a theoretically constant value depend on the mirror type used in the solar field. The other losses, like spillage and tracking error are neglected as an ideal model assumption. In order to determine the instantaneous heliostat field efficiency, the solar position computational model [12] will be calculated based on some defined angles. Solar declination angle, solar hours of sunrise and sunset which are calculated as a function of day number and latitude angle. The Eq.4, Eq5 are the zenith angle and sunrise hour respectively. (4) Where δ is the Zenith angle
Military Technical College
Kobry Elkobbah, Cairo, Egypt
April 19-21,2016
8th International Conference on Mathematics and Engineering
Physics (ICMEP-8)
5
nd is the day number of the year
(5) Where ω is the Sunrise and Sunset hours Ф is the Latitude position of the proposed location The sun position relative to a specific location on the ground is described by two angles, the solar altitude and azimuth [14] which is expressed by eq.6 and Eq.7. (6) Where α is the Altitude angle (7) Where A is the Azimuth angle The Direct Normal Irradiance (DNI) is used as power input parameter to SPT in order to calculate the output power. The calculation of the annual DNI based on the hourly performance using clear sky conditions according to BIRD model [13]. 5. Energy and Exergy Modeling
In the power generation system, exergy analysis has proven to be a powerful tool in thermodynamic analyses of the system. Energy and Exergy analysis are employed to conduct the energetic analysis and performance evaluation of the SPTS and its components. The SPT system can be classified into three subsystems:
1- Heliostat field subsystem 2- Receiver subsystem 3- Steam generation subsystem (SGS) and power cycle subsystem.
The energy and exergy model is adopted from the model presented by [14-16] from Eq.8 to Eq.23. The solar field efficiency is calculated from solar field analysis. The energy balance for the receiver is calculated by
totlossrecabsrecrec QQQ .. += (8) The mass flow rate for molten salt by using following equation
)( .... imsomsmsmsabsrec TTCpmQ −= (9) The receiver subsystem energy efficiency is defined as
rec
absrecrec Q
Q .=η (10)
The total heat loss from the receiver is calculated by conrecrefrecemrecconvrectotlossrec QQQQQ ..... +++= (11)
The receiver surface temperature is given by
msi
o
tube
o
msi
o
surrec
recsurrec T
dd
kd
hdd
AQT ++= )ln
2(
.. (12)
Military Technical College
Kobry Elkobbah, Cairo, Egypt
April 19-21,2016
8th International Conference on Mathematics and Engineering
Physics (ICMEP-8)
6
The Receiver Emissive Heat Loss is defined as surrecasurrecavgemrec ATTQ .
44.. )( −= σε (13)
The Receiver forced Convection Losses is calculated by surrecasurrecinsifcairfcconvrec ATThQ ...... )( −= (14)
The natural convection heat loss is given by surrecasurrecinsincairncconvrec ATThQ ...... )( −= (15)
The receiver convection loss is calculated from ncconvrecfcconvrecconvrec QQQ ..... += (16)
The receiver reflective Heat Loss is defined as surrecrrecrefrec RFQQ .. = (17)
The receiver conduction Heat Loss is calculated by
surrecwinsusurrecinsu
insusurrecawinsuoairconrec ATTkATThQ ....... )()( −=−=
δ (18)
The exergy efficiency of the receiver subsystem is defined as reciabsrecreciex ψψη /.=− (19)
The energetic efficiency of power block is defined as
Supplypower Input poweroutput Desired
=−Pbenη (20)
The exergy or second law efficiency is defined as
inputExergyoutputExergy
efficiencythermalreversiblepossibleMaxefficiencythermalActual
pbex ==− )(η
(21)
The total efficiency is calculated for the SPT system by pbenrecienhentotalen −−−− = ηηηη (22)
pbexreciexhextotalex −−−− = ηηηη (23)
6. Experimental Modeling
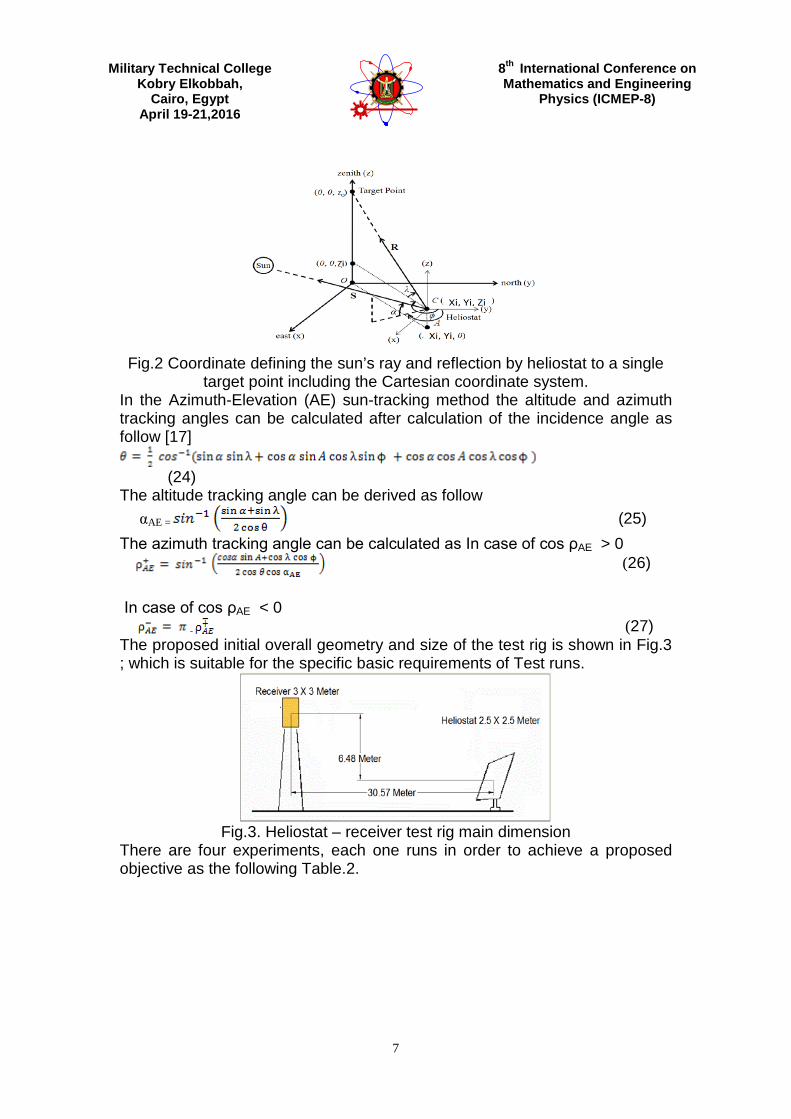
In order to design and evaluate a new solar power tower plant, a series of field experiments has to be designed and carried out for the solar field location according to a pre- specified plan. The proposed experimentation includes the DNI, Solar angles tracking verification and cleaning index measurements. The sun angles equations (azimuth and altitude) are mentioned before in Eq.6, Eq.7. The Cartesian coordinate defining the relation between sun angles, heliostat location and target (receiver) location for the purpose of tracking are illustrated in Fig.2.
Military Technical College
Kobry Elkobbah, Cairo, Egypt
April 19-21,2016
8th International Conference on Mathematics and Engineering
Physics (ICMEP-8)
7
Fig.2 Coordinate defining the sun’s ray and reflection by heliostat to a single
target point including the Cartesian coordinate system. In the Azimuth-Elevation (AE) sun-tracking method the altitude and azimuth tracking angles can be calculated after calculation of the incidence angle as follow [17]
(24) The altitude tracking angle can be derived as follow
αAE = (25)
The azimuth tracking angle can be calculated as In case of cos ρAE > 0 (26)
In case of cos ρAE < 0
- (27) The proposed initial overall geometry and size of the test rig is shown in Fig.3 ; which is suitable for the specific basic requirements of Test runs.
Fig.3. Heliostat – receiver test rig main dimension
There are four experiments, each one runs in order to achieve a proposed objective as the following Table.2.
Military Technical College
Kobry Elkobbah, Cairo, Egypt
April 19-21,2016
8th International Conference on Mathematics and Engineering
Physics (ICMEP-8)
8
Table.2. Experimental definition and objectives No Experiment Definition and Objective
1 DNI Measurement Measure the actual DNI and compare it with the calculated one in bird model. The error between measured and calculated DNI will affect the quantity of solar irradiance delivered to the receiver as input
power. 2 Position tracking angles Measure the Position tracking angles for certain times
of the day and for the proposed test rig parameters. The deviation from mean average value of error is
calculated to validate the theoretical model. 3 cleaning index Measure the Reflection of the mirror within a period of
time without cleaning and compare it with the reflectivity of clean mirror. The decrease in reflectivity will affect
the solar plant output and the operating cost.
7. Results and Discussion
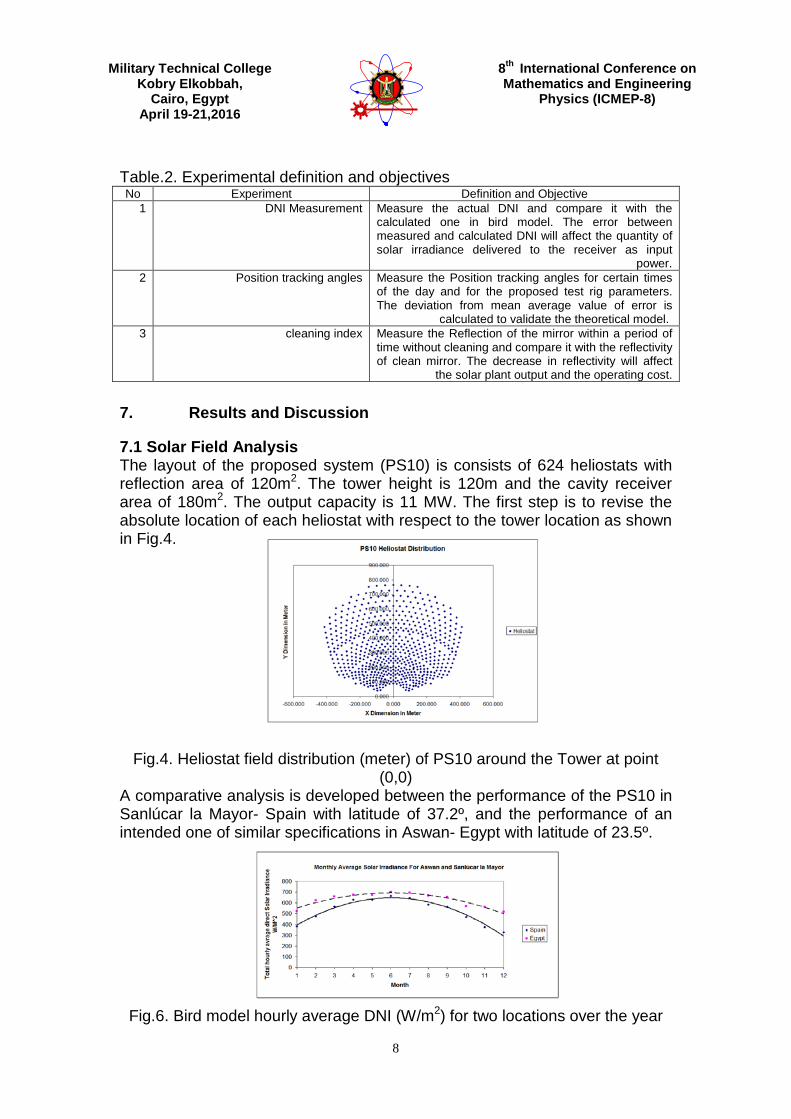
7.1 Solar Field Analysis The layout of the proposed system (PS10) is consists of 624 heliostats with reflection area of 120m2. The tower height is 120m and the cavity receiver area of 180m2. The output capacity is 11 MW. The first step is to revise the absolute location of each heliostat with respect to the tower location as shown in Fig.4.
Fig.4. Heliostat field distribution (meter) of PS10 around the Tower at point (0,0)
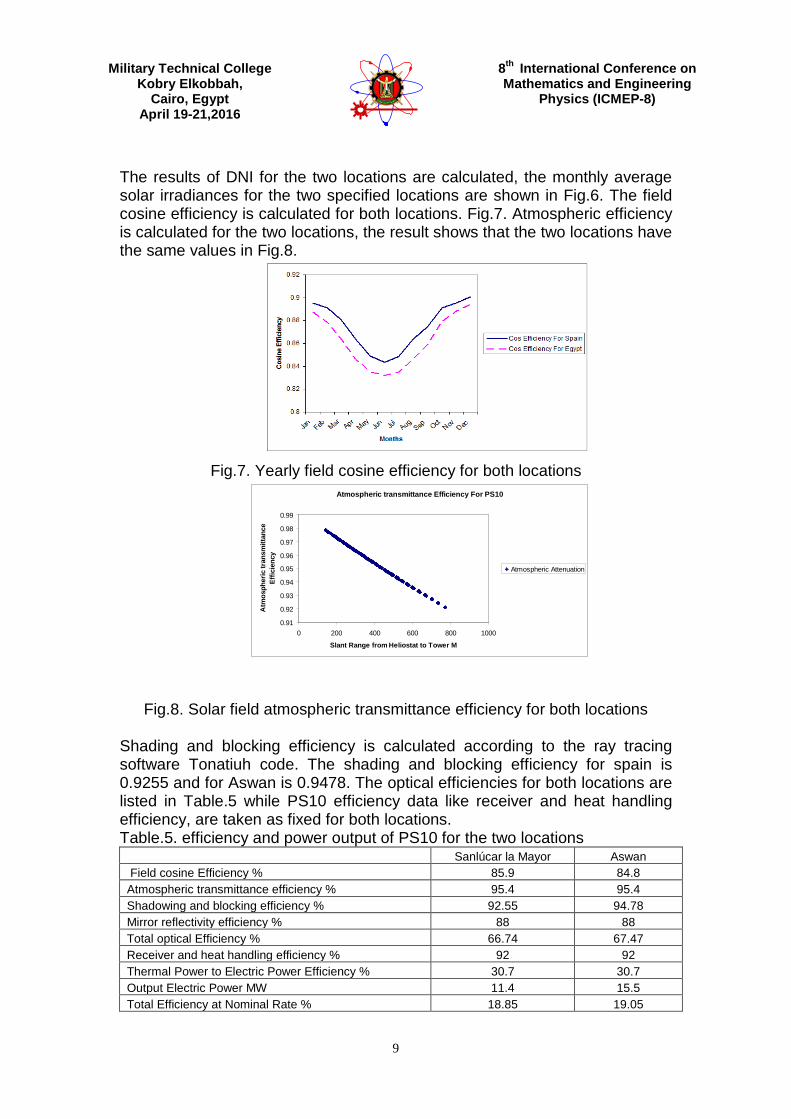
A comparative analysis is developed between the performance of the PS10 in Sanlúcar la Mayor- Spain with latitude of 37.2º, and the performance of an intended one of similar specifications in Aswan- Egypt with latitude of 23.5º.
Fig.6. Bird model hourly average DNI (W/m2) for two locations over the year
Military Technical College
Kobry Elkobbah, Cairo, Egypt
April 19-21,2016
8th International Conference on Mathematics and Engineering
Physics (ICMEP-8)
9
Atmospheric transmittance Efficiency For PS10
0.91
0.92
0.93
0.94
0.95
0.96
0.97
0.98
0.99
0 200 400 600 800 1000
Slant Range from Heliostat to Tower M
Atm
osph
eric
tran
smitt
ance
Ef
ficie
ncy
Atmospheric Attenuation
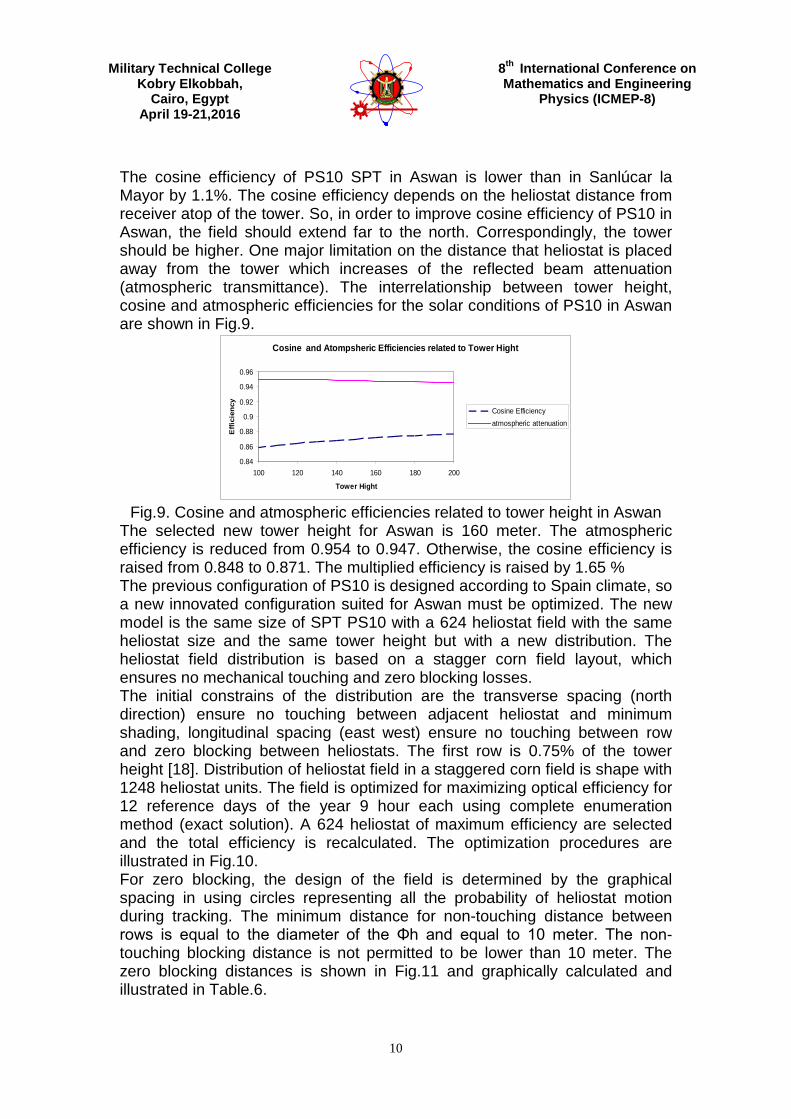
The results of DNI for the two locations are calculated, the monthly average solar irradiances for the two specified locations are shown in Fig.6. The field cosine efficiency is calculated for both locations. Fig.7. Atmospheric efficiency is calculated for the two locations, the result shows that the two locations have the same values in Fig.8.
Fig.7. Yearly field cosine efficiency for both locations
Fig.8. Solar field atmospheric transmittance efficiency for both locations
Shading and blocking efficiency is calculated according to the ray tracing software Tonatiuh code. The shading and blocking efficiency for spain is 0.9255 and for Aswan is 0.9478. The optical efficiencies for both locations are listed in Table.5 while PS10 efficiency data like receiver and heat handling efficiency, are taken as fixed for both locations. Table.5. efficiency and power output of PS10 for the two locations
Sanlúcar la Mayor Aswan Field cosine Efficiency % 85.9 84.8 Atmospheric transmittance efficiency % 95.4 95.4 Shadowing and blocking efficiency % 92.55 94.78 Mirror reflectivity efficiency % 88 88 Total optical Efficiency % 66.74 67.47 Receiver and heat handling efficiency % 92 92 Thermal Power to Electric Power Efficiency % 30.7 30.7 Output Electric Power MW 11.4 15.5 Total Efficiency at Nominal Rate % 18.85 19.05
Military Technical College
Kobry Elkobbah, Cairo, Egypt
April 19-21,2016
8th International Conference on Mathematics and Engineering
Physics (ICMEP-8)
10
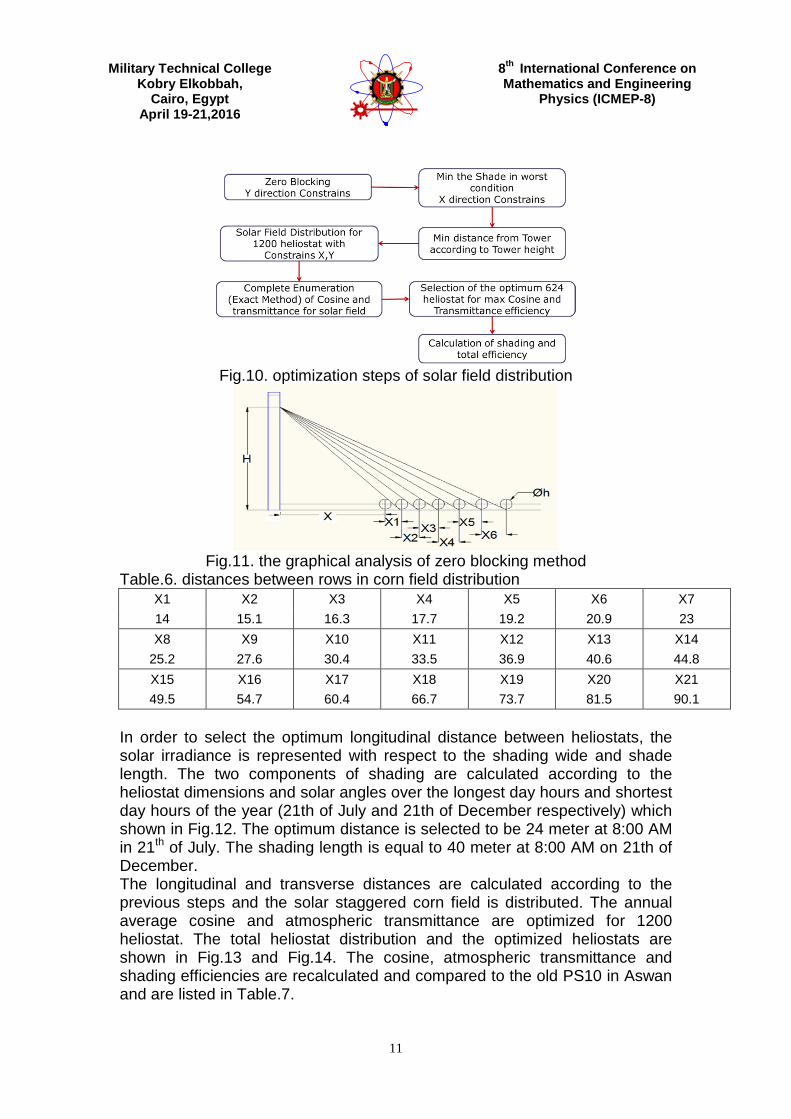
The cosine efficiency of PS10 SPT in Aswan is lower than in Sanlúcar la Mayor by 1.1%. The cosine efficiency depends on the heliostat distance from receiver atop of the tower. So, in order to improve cosine efficiency of PS10 in Aswan, the field should extend far to the north. Correspondingly, the tower should be higher. One major limitation on the distance that heliostat is placed away from the tower which increases of the reflected beam attenuation (atmospheric transmittance). The interrelationship between tower height, cosine and atmospheric efficiencies for the solar conditions of PS10 in Aswan are shown in Fig.9.
Cosine and Atompsheric Efficiencies related to Tower Hight
0.84
0.86
0.88
0.9
0.92
0.94
0.96
100 120 140 160 180 200
Tower Hight
Effi
cien
cy
Cosine Efficiencyatmospheric attenuation
Fig.9. Cosine and atmospheric efficiencies related to tower height in Aswan
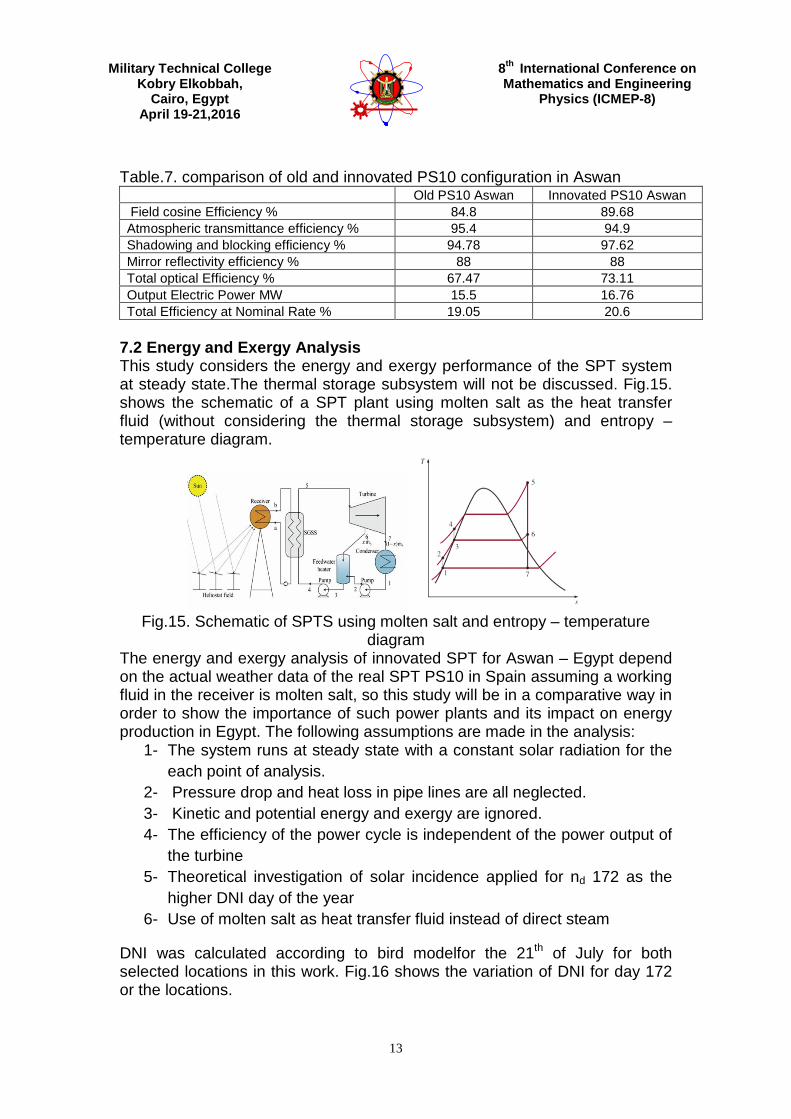
The selected new tower height for Aswan is 160 meter. The atmospheric efficiency is reduced from 0.954 to 0.947. Otherwise, the cosine efficiency is raised from 0.848 to 0.871. The multiplied efficiency is raised by 1.65 % The previous configuration of PS10 is designed according to Spain climate, so a new innovated configuration suited for Aswan must be optimized. The new model is the same size of SPT PS10 with a 624 heliostat field with the same heliostat size and the same tower height but with a new distribution. The heliostat field distribution is based on a stagger corn field layout, which ensures no mechanical touching and zero blocking losses. The initial constrains of the distribution are the transverse spacing (north direction) ensure no touching between adjacent heliostat and minimum shading, longitudinal spacing (east west) ensure no touching between row and zero blocking between heliostats. The first row is 0.75% of the tower height [18]. Distribution of heliostat field in a staggered corn field is shape with 1248 heliostat units. The field is optimized for maximizing optical efficiency for 12 reference days of the year 9 hour each using complete enumeration method (exact solution). A 624 heliostat of maximum efficiency are selected and the total efficiency is recalculated. The optimization procedures are illustrated in Fig.10. For zero blocking, the design of the field is determined by the graphical spacing in using circles representing all the probability of heliostat motion during tracking. The minimum distance for non-touching distance between rows is equal to the diameter of the Φh and equal to 10 meter. The non-touching blocking distance is not permitted to be lower than 10 meter. The zero blocking distances is shown in Fig.11 and graphically calculated and illustrated in Table.6.
Military Technical College
Kobry Elkobbah, Cairo, Egypt
April 19-21,2016
8th International Conference on Mathematics and Engineering
Physics (ICMEP-8)
11
Fig.10. optimization steps of solar field distribution
Fig.11. the graphical analysis of zero blocking method
Table.6. distances between rows in corn field distribution X1 X2 X3 X4 X5 X6 X7 14 15.1 16.3 17.7 19.2 20.9 23 X8 X9 X10 X11 X12 X13 X14
25.2 27.6 30.4 33.5 36.9 40.6 44.8 X15 X16 X17 X18 X19 X20 X21 49.5 54.7 60.4 66.7 73.7 81.5 90.1
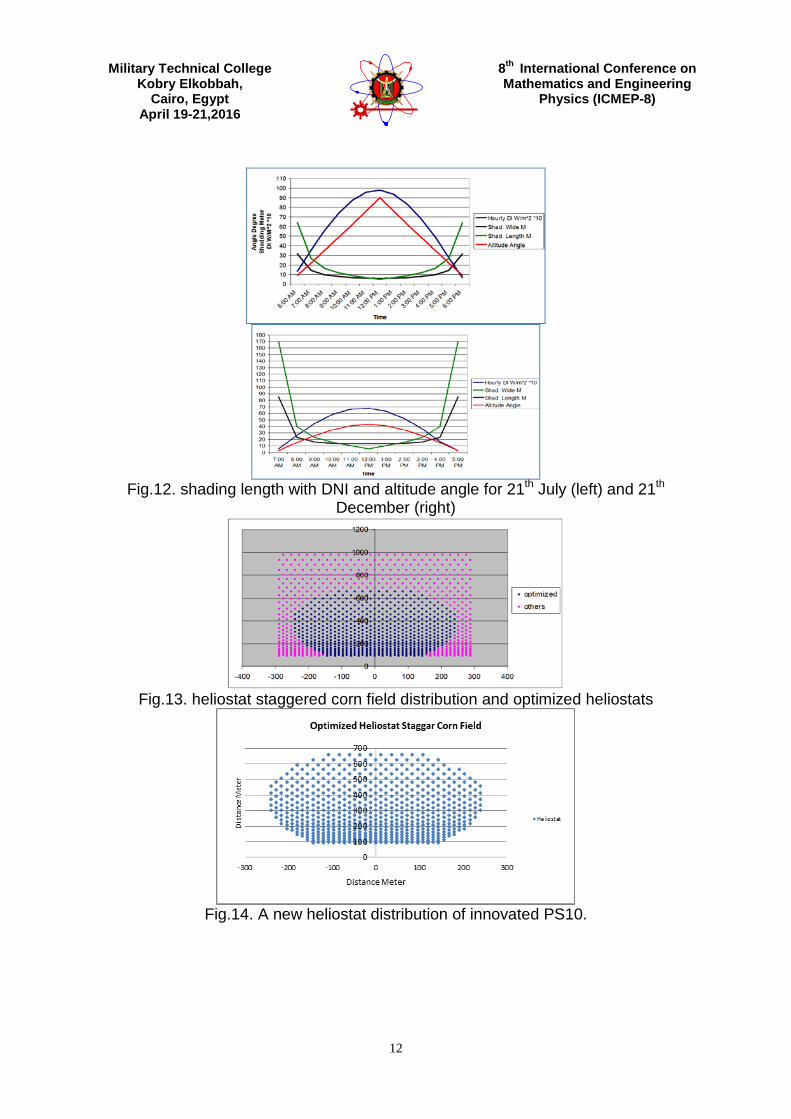
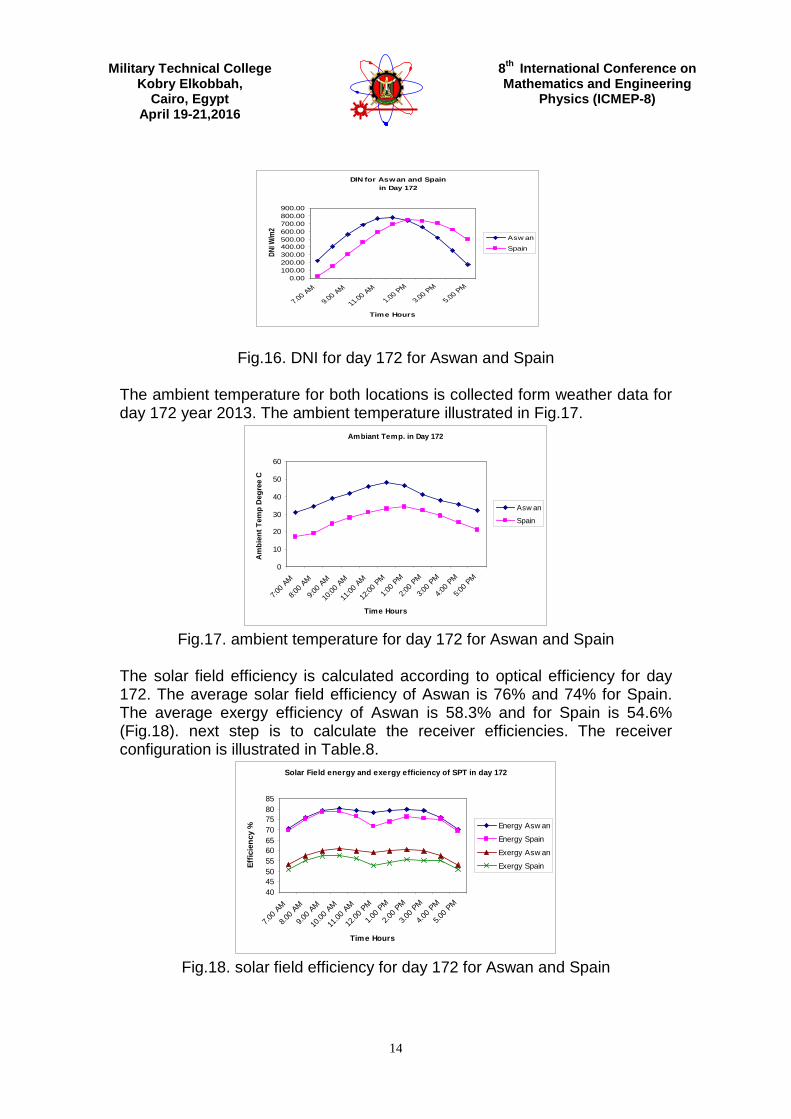
In order to select the optimum longitudinal distance between heliostats, the solar irradiance is represented with respect to the shading wide and shade length. The two components of shading are calculated according to the heliostat dimensions and solar angles over the longest day hours and shortest day hours of the year (21th of July and 21th of December respectively) which shown in Fig.12. The optimum distance is selected to be 24 meter at 8:00 AM in 21th of July. The shading length is equal to 40 meter at 8:00 AM on 21th of December. The longitudinal and transverse distances are calculated according to the previous steps and the solar staggered corn field is distributed. The annual average cosine and atmospheric transmittance are optimized for 1200 heliostat. The total heliostat distribution and the optimized heliostats are shown in Fig.13 and Fig.14. The cosine, atmospheric transmittance and shading efficiencies are recalculated and compared to the old PS10 in Aswan and are listed in Table.7.
Military Technical College
Kobry Elkobbah, Cairo, Egypt
April 19-21,2016
8th International Conference on Mathematics and Engineering
Physics (ICMEP-8)
12
Fig.12. shading length with DNI and altitude angle for 21th July (left) and 21th
December (right)
Fig.13. heliostat staggered corn field distribution and optimized heliostats
Fig.14. A new heliostat distribution of innovated PS10.
Military Technical College
Kobry Elkobbah, Cairo, Egypt
April 19-21,2016
8th International Conference on Mathematics and Engineering
Physics (ICMEP-8)
13
Table.7. comparison of old and innovated PS10 configuration in Aswan Old PS10 Aswan Innovated PS10 Aswan
Field cosine Efficiency % 84.8 89.68 Atmospheric transmittance efficiency % 95.4 94.9 Shadowing and blocking efficiency % 94.78 97.62 Mirror reflectivity efficiency % 88 88 Total optical Efficiency % 67.47 73.11 Output Electric Power MW 15.5 16.76 Total Efficiency at Nominal Rate % 19.05 20.6
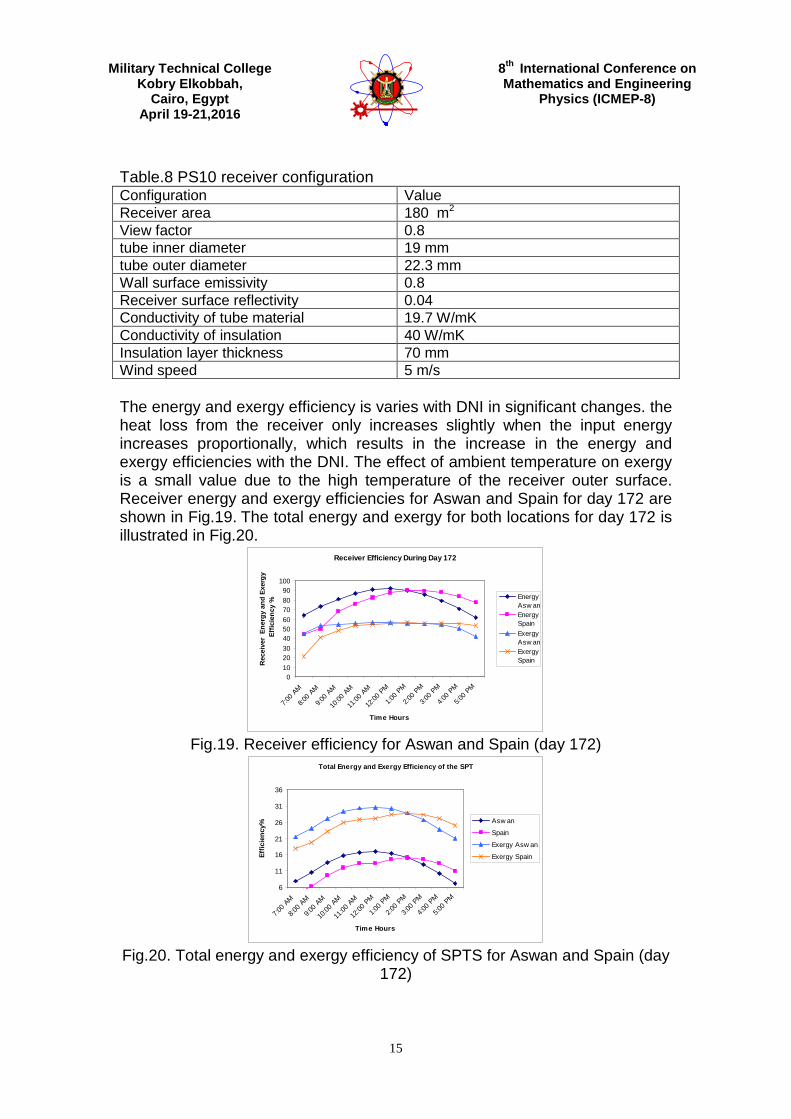
7.2 Energy and Exergy Analysis This study considers the energy and exergy performance of the SPT system at steady state.The thermal storage subsystem will not be discussed. Fig.15. shows the schematic of a SPT plant using molten salt as the heat transfer fluid (without considering the thermal storage subsystem) and entropy – temperature diagram.
Fig.15. Schematic of SPTS using molten salt and entropy – temperature
diagram The energy and exergy analysis of innovated SPT for Aswan – Egypt depend on the actual weather data of the real SPT PS10 in Spain assuming a working fluid in the receiver is molten salt, so this study will be in a comparative way in order to show the importance of such power plants and its impact on energy production in Egypt. The following assumptions are made in the analysis:
1- The system runs at steady state with a constant solar radiation for the each point of analysis.
2- Pressure drop and heat loss in pipe lines are all neglected. 3- Kinetic and potential energy and exergy are ignored. 4- The efficiency of the power cycle is independent of the power output of
the turbine 5- Theoretical investigation of solar incidence applied for nd 172 as the
higher DNI day of the year 6- Use of molten salt as heat transfer fluid instead of direct steam
DNI was calculated according to bird modelfor the 21th of July for both selected locations in this work. Fig.16 shows the variation of DNI for day 172 or the locations.
Military Technical College
Kobry Elkobbah, Cairo, Egypt
April 19-21,2016
8th International Conference on Mathematics and Engineering
Physics (ICMEP-8)
14
DIN for Aswan and Spain in Day 172
0.00100.00200.00300.00400.00500.00600.00700.00800.00900.00
7.00 AM
9.00 AM
11.00 AM1.00 PM
3.00 PM
5.00 PM
Time Hours
DNI W
/m2
Asw an
Spain
Fig.16. DNI for day 172 for Aswan and Spain The ambient temperature for both locations is collected form weather data for day 172 year 2013. The ambient temperature illustrated in Fig.17.
Ambiant Temp. in Day 172
0
10
20
30
40
50
60
7:00 A
M
8:00 A
M
9:00 A
M
10:00
AM
11:00
AM
12:00
PM
1:00 P
M
2:00 P
M
3:00 P
M
4:00 P
M
5:00 P
M
Time Hours
Am
bien
t Tem
p D
egre
e C
Asw an
Spain
Fig.17. ambient temperature for day 172 for Aswan and Spain
The solar field efficiency is calculated according to optical efficiency for day 172. The average solar field efficiency of Aswan is 76% and 74% for Spain. The average exergy efficiency of Aswan is 58.3% and for Spain is 54.6% (Fig.18). next step is to calculate the receiver efficiencies. The receiver configuration is illustrated in Table.8.
Solar Field energy and exergy efficiency of SPT in day 172
40455055606570758085
7.00 A
M
8.00 A
M
9.00 A
M
10.00
AM
11.00
AM
12.00
PM
1.00 P
M
2.00 P
M
3.00 P
M
4.00 P
M
5.00 P
M
Time Hours
Effic
ienc
y % Energy Asw an
Energy Spain
Exergy Asw an
Exergy Spain
Fig.18. solar field efficiency for day 172 for Aswan and Spain
Military Technical College
Kobry Elkobbah, Cairo, Egypt
April 19-21,2016
8th International Conference on Mathematics and Engineering
Physics (ICMEP-8)
15
Table.8 PS10 receiver configuration Configuration Value Receiver area 180 m2 View factor 0.8 tube inner diameter 19 mm tube outer diameter 22.3 mm Wall surface emissivity 0.8 Receiver surface reflectivity 0.04 Conductivity of tube material 19.7 W/mK Conductivity of insulation 40 W/mK Insulation layer thickness 70 mm Wind speed 5 m/s The energy and exergy efficiency is varies with DNI in significant changes. the heat loss from the receiver only increases slightly when the input energy increases proportionally, which results in the increase in the energy and exergy efficiencies with the DNI. The effect of ambient temperature on exergy is a small value due to the high temperature of the receiver outer surface. Receiver energy and exergy efficiencies for Aswan and Spain for day 172 are shown in Fig.19. The total energy and exergy for both locations for day 172 is illustrated in Fig.20.
Receiver Efficiency During Day 172
0102030405060708090
100
7:00 A
M
8:00 A
M
9:00 A
M
10:00
AM
11:00
AM
12:00
PM
1:00 P
M
2:00 P
M
3:00 P
M
4:00 P
M
5:00 P
M
Time Hours
Rec
eive
r En
ergy
and
Exe
rgy
Ef
ficie
ncy
% EnergyAsw anEnergySpainExergyAsw anExergySpain
Fig.19. Receiver efficiency for Aswan and Spain (day 172)
Total Energy and Exergy Efficiency of the SPT
6
11
16
21
26
31
36
7:00 A
M
8:00 A
M
9:00 A
M
10:00
AM
11:00
AM
12:00
PM
1:00 P
M
2:00 P
M
3:00 P
M
4:00 P
M
5:00 P
M
Time Hours
Effic
ienc
y%
Asw an
Spain
Exergy Asw an
Exergy Spain
Fig.20. Total energy and exergy efficiency of SPTS for Aswan and Spain (day
172)
Military Technical College
Kobry Elkobbah, Cairo, Egypt
April 19-21,2016
8th International Conference on Mathematics and Engineering
Physics (ICMEP-8)
16
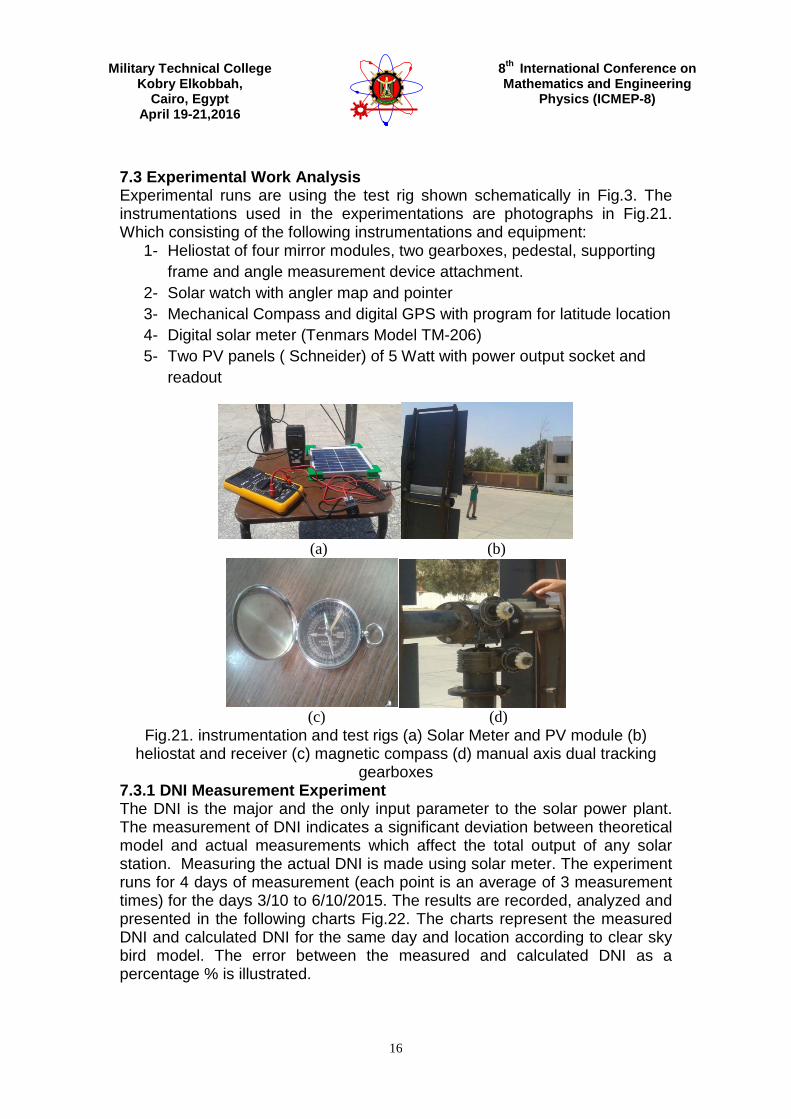
7.3 Experimental Work Analysis Experimental runs are using the test rig shown schematically in Fig.3. The instrumentations used in the experimentations are photographs in Fig.21. Which consisting of the following instrumentations and equipment:
1- Heliostat of four mirror modules, two gearboxes, pedestal, supporting frame and angle measurement device attachment.
2- Solar watch with angler map and pointer 3- Mechanical Compass and digital GPS with program for latitude location 4- Digital solar meter (Tenmars Model TM-206) 5- Two PV panels ( Schneider) of 5 Watt with power output socket and
readout
(a) (b)
(c) (d)
Fig.21. instrumentation and test rigs (a) Solar Meter and PV module (b) heliostat and receiver (c) magnetic compass (d) manual axis dual tracking
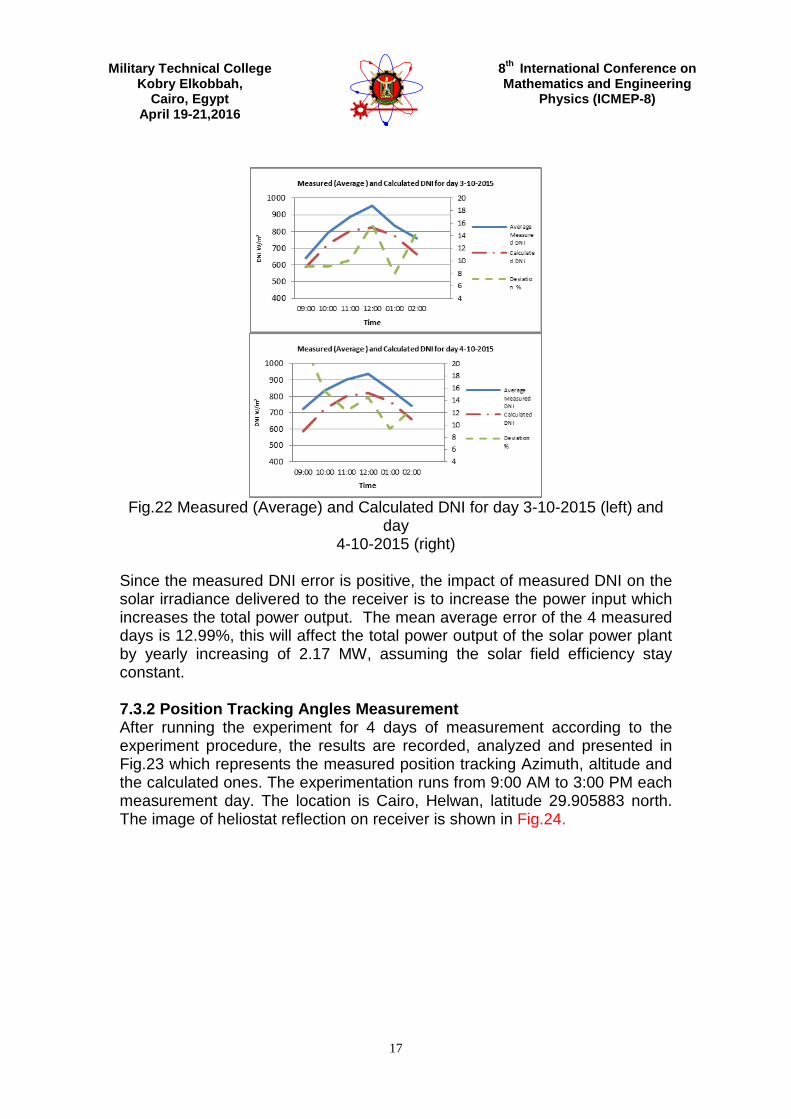
gearboxes 7.3.1 DNI Measurement Experiment The DNI is the major and the only input parameter to the solar power plant. The measurement of DNI indicates a significant deviation between theoretical model and actual measurements which affect the total output of any solar station. Measuring the actual DNI is made using solar meter. The experiment runs for 4 days of measurement (each point is an average of 3 measurement times) for the days 3/10 to 6/10/2015. The results are recorded, analyzed and presented in the following charts Fig.22. The charts represent the measured DNI and calculated DNI for the same day and location according to clear sky bird model. The error between the measured and calculated DNI as a percentage % is illustrated.
Military Technical College
Kobry Elkobbah, Cairo, Egypt
April 19-21,2016
8th International Conference on Mathematics and Engineering
Physics (ICMEP-8)
17
Fig.22 Measured (Average) and Calculated DNI for day 3-10-2015 (left) and
day 4-10-2015 (right)
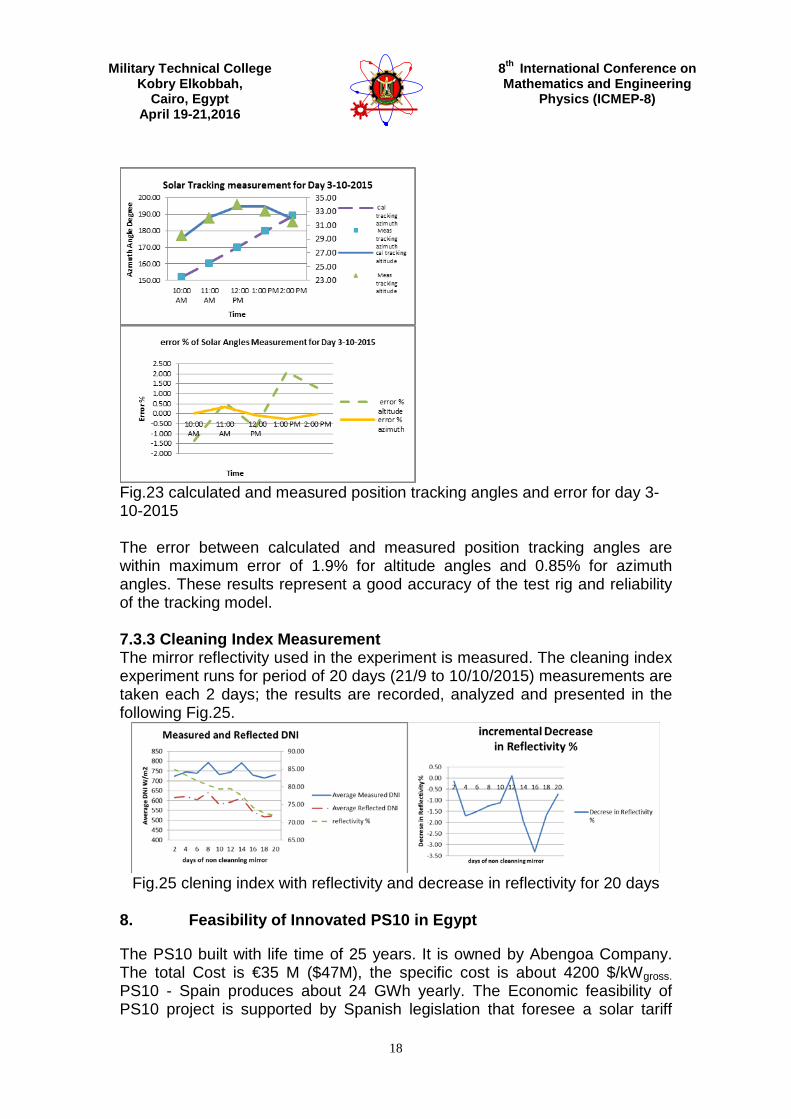
Since the measured DNI error is positive, the impact of measured DNI on the solar irradiance delivered to the receiver is to increase the power input which increases the total power output. The mean average error of the 4 measured days is 12.99%, this will affect the total power output of the solar power plant by yearly increasing of 2.17 MW, assuming the solar field efficiency stay constant. 7.3.2 Position Tracking Angles Measurement After running the experiment for 4 days of measurement according to the experiment procedure, the results are recorded, analyzed and presented in Fig.23 which represents the measured position tracking Azimuth, altitude and the calculated ones. The experimentation runs from 9:00 AM to 3:00 PM each measurement day. The location is Cairo, Helwan, latitude 29.905883 north. The image of heliostat reflection on receiver is shown in Fig.24.
Military Technical College
Kobry Elkobbah, Cairo, Egypt
April 19-21,2016
8th International Conference on Mathematics and Engineering
Physics (ICMEP-8)
18
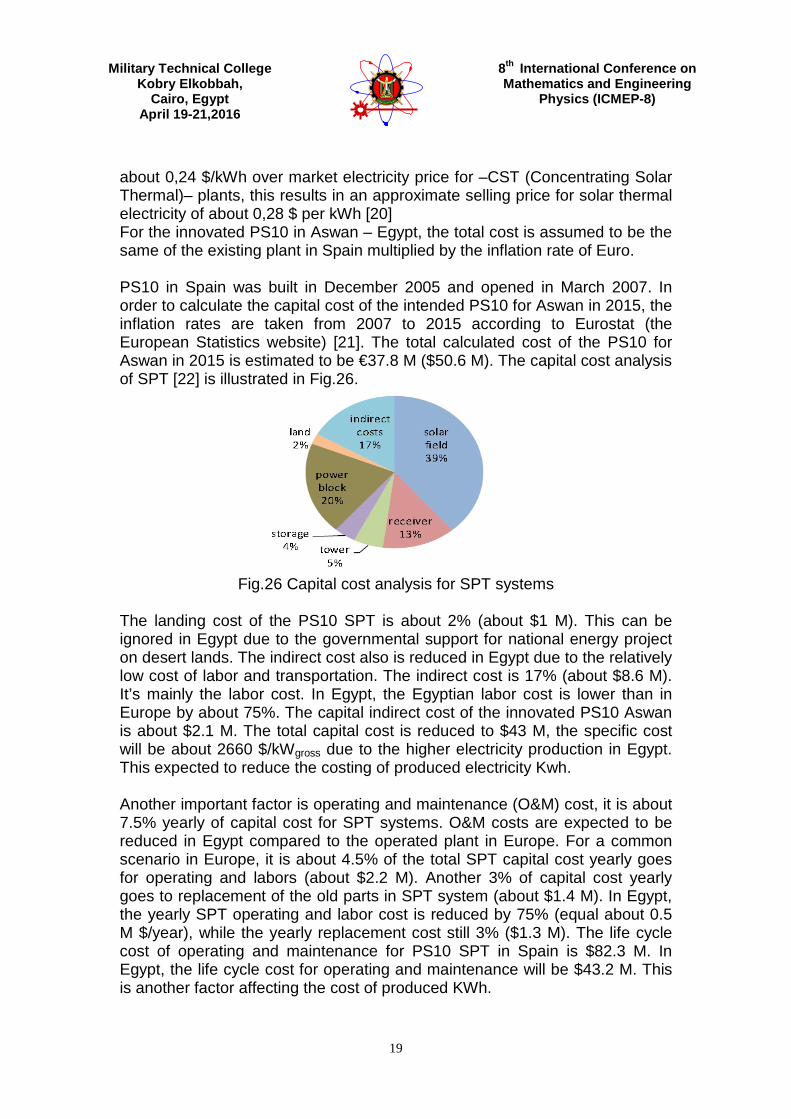
Fig.23 calculated and measured position tracking angles and error for day 3-10-2015 The error between calculated and measured position tracking angles are within maximum error of 1.9% for altitude angles and 0.85% for azimuth angles. These results represent a good accuracy of the test rig and reliability of the tracking model. 7.3.3 Cleaning Index Measurement The mirror reflectivity used in the experiment is measured. The cleaning index experiment runs for period of 20 days (21/9 to 10/10/2015) measurements are taken each 2 days; the results are recorded, analyzed and presented in the following Fig.25.
Fig.25 clening index with reflectivity and decrease in reflectivity for 20 days
8. Feasibility of Innovated PS10 in Egypt
The PS10 built with life time of 25 years. It is owned by Abengoa Company. The total Cost is €35 M ($47M), the specific cost is about 4200 $/kWgross. PS10 - Spain produces about 24 GWh yearly. The Economic feasibility of PS10 project is supported by Spanish legislation that foresee a solar tariff
Military Technical College
Kobry Elkobbah, Cairo, Egypt
April 19-21,2016
8th International Conference on Mathematics and Engineering
Physics (ICMEP-8)
19
about 0,24 $/kWh over market electricity price for –CST (Concentrating Solar Thermal)– plants, this results in an approximate selling price for solar thermal electricity of about 0,28 $ per kWh [20] For the innovated PS10 in Aswan – Egypt, the total cost is assumed to be the same of the existing plant in Spain multiplied by the inflation rate of Euro.
PS10 in Spain was built in December 2005 and opened in March 2007. In order to calculate the capital cost of the intended PS10 for Aswan in 2015, the inflation rates are taken from 2007 to 2015 according to Eurostat (the European Statistics website) [21]. The total calculated cost of the PS10 for Aswan in 2015 is estimated to be €37.8 M ($50.6 M). The capital cost analysis of SPT [22] is illustrated in Fig.26.
Fig.26 Capital cost analysis for SPT systems
The landing cost of the PS10 SPT is about 2% (about $1 M). This can be ignored in Egypt due to the governmental support for national energy project on desert lands. The indirect cost also is reduced in Egypt due to the relatively low cost of labor and transportation. The indirect cost is 17% (about $8.6 M). It’s mainly the labor cost. In Egypt, the Egyptian labor cost is lower than in Europe by about 75%. The capital indirect cost of the innovated PS10 Aswan is about $2.1 M. The total capital cost is reduced to $43 M, the specific cost will be about 2660 $/kWgross due to the higher electricity production in Egypt. This expected to reduce the costing of produced electricity Kwh. Another important factor is operating and maintenance (O&M) cost, it is about 7.5% yearly of capital cost for SPT systems. O&M costs are expected to be reduced in Egypt compared to the operated plant in Europe. For a common scenario in Europe, it is about 4.5% of the total SPT capital cost yearly goes for operating and labors (about $2.2 M). Another 3% of capital cost yearly goes to replacement of the old parts in SPT system (about $1.4 M). In Egypt, the yearly SPT operating and labor cost is reduced by 75% (equal about 0.5 M $/year), while the yearly replacement cost still 3% ($1.3 M). The life cycle cost of operating and maintenance for PS10 SPT in Spain is $82.3 M. In Egypt, the life cycle cost for operating and maintenance will be $43.2 M. This is another factor affecting the cost of produced KWh.
Military Technical College
Kobry Elkobbah, Cairo, Egypt
April 19-21,2016
8th International Conference on Mathematics and Engineering
Physics (ICMEP-8)
20
Life Cycle Cost of PS10 in Spain and Egypt
020406080
100120140160
0 2nd 4th 6th 8th 10th 12th 14th 16th 18th 20th 22nd 24th
Year
Co
st
in M
illio
n $
PS10-spain
PS10-Egypt
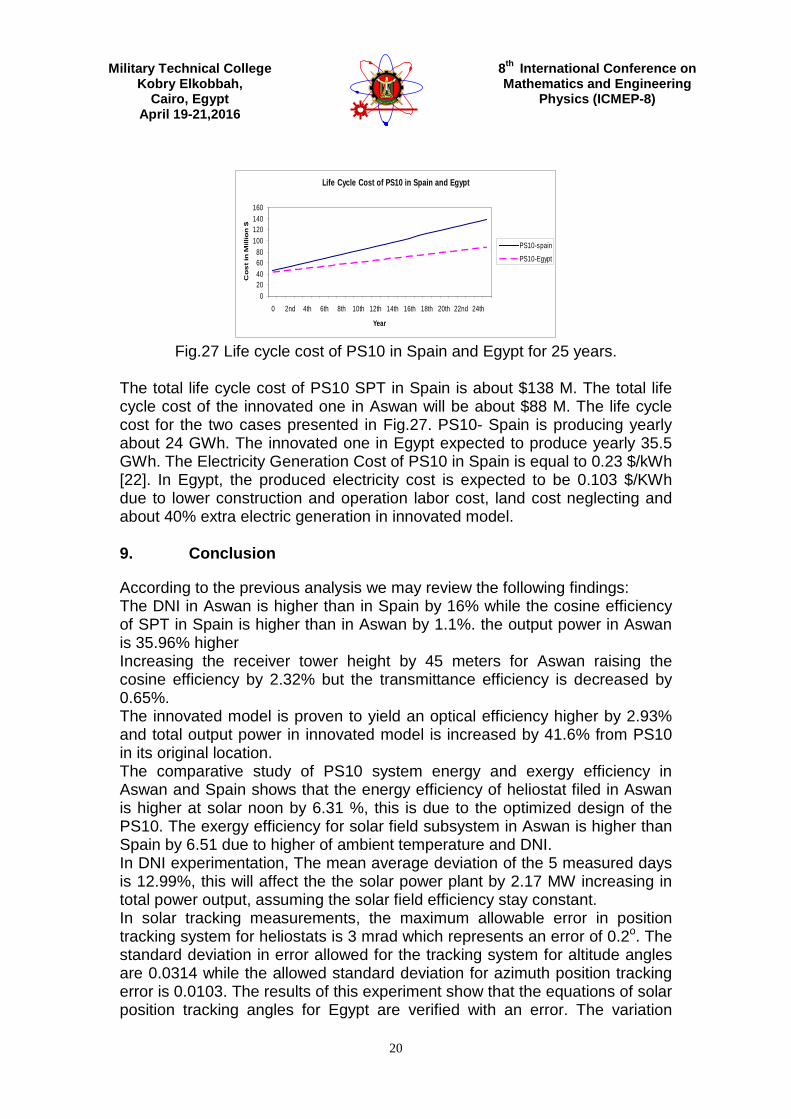
Fig.27 Life cycle cost of PS10 in Spain and Egypt for 25 years.
The total life cycle cost of PS10 SPT in Spain is about $138 M. The total life cycle cost of the innovated one in Aswan will be about $88 M. The life cycle cost for the two cases presented in Fig.27. PS10- Spain is producing yearly about 24 GWh. The innovated one in Egypt expected to produce yearly 35.5 GWh. The Electricity Generation Cost of PS10 in Spain is equal to 0.23 $/kWh [22]. In Egypt, the produced electricity cost is expected to be 0.103 $/KWh due to lower construction and operation labor cost, land cost neglecting and about 40% extra electric generation in innovated model. 9. Conclusion
According to the previous analysis we may review the following findings: The DNI in Aswan is higher than in Spain by 16% while the cosine efficiency of SPT in Spain is higher than in Aswan by 1.1%. the output power in Aswan is 35.96% higher Increasing the receiver tower height by 45 meters for Aswan raising the cosine efficiency by 2.32% but the transmittance efficiency is decreased by 0.65%. The innovated model is proven to yield an optical efficiency higher by 2.93% and total output power in innovated model is increased by 41.6% from PS10 in its original location. The comparative study of PS10 system energy and exergy efficiency in Aswan and Spain shows that the energy efficiency of heliostat filed in Aswan is higher at solar noon by 6.31 %, this is due to the optimized design of the PS10. The exergy efficiency for solar field subsystem in Aswan is higher than Spain by 6.51 due to higher of ambient temperature and DNI. In DNI experimentation, The mean average deviation of the 5 measured days is 12.99%, this will affect the the solar power plant by 2.17 MW increasing in total power output, assuming the solar field efficiency stay constant. In solar tracking measurements, the maximum allowable error in position tracking system for heliostats is 3 mrad which represents an error of 0.2o. The standard deviation in error allowed for the tracking system for altitude angles are 0.0314 while the allowed standard deviation for azimuth position tracking error is 0.0103. The results of this experiment show that the equations of solar position tracking angles for Egypt are verified with an error. The variation
Military Technical College
Kobry Elkobbah, Cairo, Egypt
April 19-21,2016
8th International Conference on Mathematics and Engineering
Physics (ICMEP-8)
21
between standard deviation for measurement and the allowable one refers to the poor accuracy of test rig used but prove that the tracking model reliable to be used. The mirror used in cleaning index experiment with reflectivity of 84%. The cleaning index decreases the reflectivity from 84 % to 71% which decrease the solar field optical efficiency from 69.87% to 58.98%. The total efficiency of power plant is decreased by 3.9% and the net power output is decrease by 3.2 MW. The cleaning period is supposed to be every 10 days (3 times / month) which will affect the total efficiency of power plant by (-0.9%) and the power output by (– 0.76) MW Finally, the feasibility study shows that the specific cost of energy of the innovated SPT in Aswan is lower by 36.66% than the PS10 in Spain, while the cost of energy production of the intended SPT in Aswan is 55.2% less than in PS10 in Spain .
10. References
[1] Markovic et al, The white book of the electric power industry of Serbia, Belgrade, PE Electric Power Industry of Serbia, 2011.
[2] Hasan et al, A review on energy scenario and sustainable energy in Indonesia, Renewable and Sustainable Energy Reviews, 16(4):2316–28, 2012.
[3] Ummadisingu A and Soni MS, Concentrating solar power technology potential and policy in India, Renewable and Sustainable Energy Reviews, 15(9):5169–75, 2011.
[4] Rawya Mostafa, Feasibility of Concentrated Solar Power under Egyptian Conditions, Master Thesis, Cairo University in Egypt, February 2011.
[5] Parajuli R, Looking into the Danish energy system: lesson to be learned by other communities, Renewable and Sustainable Energy Reviews, 16(4):2191–9, 2012.
[6] Electricity report and plan available at http://www.moee.gov.eg/test_new/PDFReports/REP2013-2014.pdf
[7] Projects available at http://www.moee.gov.eg/english_new/projects.aspx [8] Lukas Feierabend, Thermal Model Development and Simulation of Cavity-
Type Solar Central Receiver Systems, University Of Wisconsin – Madison, 2009
[9] Thomas Bauer et al, Overview Of Molten Salt Storage Systems And Material Development For Solar Thermal Power Plants, Institute of Technical Thermodynamics, German Aerospace Center (DLR)
[10] FINAL TECHNICAL PROGRESS REPORT, 10 MW Solar Thermal Power Plant for Southern Spain, CONTRACT No : NNE5-1999-356
[11] Planta Solar 10 specification official website available at http://www.nrel.gov/csp/solarpaces/project_detail.cfm/projectID=38
[12] William B. Stine and Michael Geyer, Power from the sun handbook, available at <http://www.powerfromthesun.net/book.html>
Military Technical College
Kobry Elkobbah, Cairo, Egypt
April 19-21,2016
8th International Conference on Mathematics and Engineering
Physics (ICMEP-8)
22
[13] Richard E. Bird and Roland L. Hulstorm, A simplified clear sky model for direct and diffuse insolation on horizontal surface, solar energy research institute, 1981.
[14] T.A.H et al, energy and exergy analysis and optimization study of an integrated solar heliostat field system for hydrogen production, international journal of hydrogen energy, 37-28704-18712, 2012.
[15] Mahmood Jamel et al, Performance Evaluation of Molten Salt Cavity Tubular Solar Central Receiver for Future Integration with Existing Power Plants in Iraq, Australian Journal of Basic and Applied Sciences, 7(8): 399-410, ISSN 1991-8178, 2013
[16] Chao Xu et al, Energy and exergy analysis of solar power tower plants, Applied Thermal Engineering, 31-3904e3913, 2011.
[17] Tan ming hui, Design and optimization of heliostat field using spinning-elevation sun tracking method based on computational analysis, master thesis, universiti tunku abdul rahman july, 2011
[18] Alexis Band, Zavoico Nexant, Solar power tower design handbook, San Francisco, CA 94104, SAND2001-2100
[19] Tan ming hui, Design and optimization of heliostat field using spinning-elevation sun tracking method based on computational analysis, master thesis, universiti tunku abdul rahman july 2011
[20] Final Technical progress report available at
<http://ec.europa.eu/energy/renewables/solar_electricity/doc/2006_ps10.pdf>
[20] EuroStat Website available from http://epp.eurostat.ec.europa.eu/portal/page/portal/eurostat/home
[21] Wen Zhang, Concentrating Solar Power - Cost Analysis, University Stuttgart, Institut für Energiewirtschaft und Rationelle Energieanwendung