Embed Size (px)
Citation preview

Table of Contents
UNITED STATESSECURITIES AND EXCHANGE COMMISSION
Washington, D.C. 20549
FORM 10-Q
☒ QUARTERLY REPORT PURSUANT TO SECTION 13 OR 15(d) OF THE SECURITIES EXCHANGE ACT OF 1934
For the quarterly period ended March 31, 2018
OR ☐ TRANSITION REPORT PURSUANT TO SECTION 13 OR 15(d) OF THE SECURITIES EXCHANGE ACT OF 1934
For the transition period from to
Commission file number 001-37971
PGT Innovations, Inc.
1070 Technology DriveNorth Venice, FL 34275
Registrant’s telephone number: 941-480-1600
State of Incorporation IRS Employer Identification No.Delaware 20-0634715
Indicate by check mark whether the registrant (1) has filed all reports required to be filed by Section 13 or 15(d) of the Securities Exchange Act of 1934 during thepreceding 12 months (or for such shorter period that the registrant was required to file such reports), and (2) has been subject to such filing requirements for thepast 90 days. Yes ☒ No ☐
Indicate by check mark whether the registrant has submitted electronically and posted on its corporate Web site, if any, every Interactive Data File required to besubmitted and posted pursuant to Rule 405 of Regulation S-T (§232.405 of this chapter) during the preceding 12 months (or for such shorter period that theregistrant was required to submit and post such files). Yes ☒ No ☐*
Indicate by check mark whether the registrant is a large accelerated filer, an accelerated filer, a non-accelerated filer, a smaller reporting company, or an emerginggrowth company. Large accelerated filer ☐ Accelerated filer ☒
Non-accelerated filer ☐ (Do not check if a smaller reporting company) Smaller reporting company ☐
Emerging growth company ☐
If an emerging growth company, indicate by check mark if the registrant has elected not to use the extended transition period for complying with any new orrevised financial accounting standards provided pursuant to Section13(a) of the Exchange Act. Yes ☐ No ☐
Indicate by check mark whether the registrant is a shell company (as defined in Rule 12b-2 of the Exchange Act). Yes ☐ No ☒
Common Stock, $0.01 par value, outstanding was 49,976,644 shares, as of May 1, 2018.

Table of Contents
PGT INNOVATIONS, INC.TABLE OF CONTENTS
Form 10-Q for the Three Months Ended March 31, 2018 Page Number Part I. Financial Information
Item 1. Condensed Consolidated Financial Statements (unaudited): Condensed Consolidated Statements of Comprehensive Income 3 Condensed Consolidated Balance Sheets 4 Condensed Consolidated Statements of Cash Flows 5 Notes to Condensed Consolidated Financial Statements 6
Item 2. Management’s Discussion and Analysis of Financial Condition and Results of Operations 20 Item 3. Quantitative and Qualitative Disclosures About Market Risk 29 Item 4. Controls and Procedures 29
Part II. Other Information Item 1. Legal Proceedings 30 Item 1A. Risk Factors 30 Item 2. Unregistered Sales of Equity Securities and Use of Proceeds 30 Item 3. Defaults Upon Senior Securities 30 Item 4. Mine Safety Disclosure 30 Item 5. Other Information 30 Item 6. Exhibits 31
2

Table of Contents
PART I — FINANCIAL INFORMATION
ITEM 1. CONDENSED CONSOLIDATED FINANCIAL STATEMENTS (UNAUDITED)
PGT INNOVATIONS, INC.CONDENSED CONSOLIDATED STATEMENTS OF COMPREHENSIVE INCOME
(in thousands, except per share amounts) Three Months Ended March 31, April 1, 2018 2017 (unaudited) Net sales $140,253 $112,721 Cost of sales 95,480 80,982
Gross profit 44,773 31,739 Selling, general and administrative expenses 28,657 22,785
Income from operations 16,116 8,954 Interest expense, net 4,043 4,910 Debt extinguishment costs 3,079 —
Income before income taxes 8,994 4,044 Income tax expense 1,654 1,045
Net income $ 7,340 $ 2,999
Net income per common share: Basic $ 0.15 $ 0.06
Diluted $ 0.14 $ 0.06
Weighted average shares outstanding: Basic 49,858 49,263
Diluted 51,998 51,628
Comprehensive income $ 7,278 $ 2,999
The accompanying notes are an integral part of these condensed consolidated financial statements.
3

Table of Contents
PGT INNOVATIONS, INC.CONDENSED CONSOLIDATED BALANCE SHEETS
(in thousands, except per share amounts)(unaudited)
March 31,2018
December 30,2017
ASSETS Current assets:
Cash and cash equivalents $ 34,048 $ 34,029 Accounts receivable, net 66,434 60,308 Inventories 35,506 37,816 Contract assets, net 9,210 — Prepaid expenses 3,551 2,490 Other current assets 11,025 9,873
Total current assets 159,774 144,516 Property, plant and equipment, net 88,193 84,133 Trade name and other intangible assets, net 113,384 115,043 Goodwill 108,060 108,060 Other assets, net 1,363 1,367
Total assets $470,774 $ 453,119
LIABILITIES AND SHAREHOLDERS’ EQUITY Current liabilities:
Accounts payable and accrued liabilities $ 39,610 $ 41,085 Current portion of long-term debt 299 294
Total current liabilities 39,909 41,379 Long-term debt, less current portion 214,609 212,679 Deferred income taxes 23,398 22,772 Other liabilities 8,317 964
Total liabilities 286,233 277,794
Shareholders’ equity: Preferred stock; par value $.01 per share; 10,000 shares authorized; none outstanding — — Common stock; par value $.01 per share; 200,000 shares authorized; 52,639 and 52,486 shares issued and 49,976 and
49,805 shares outstanding at March 31, 2018 and December 30, 2017, respectively 526 525 Additional paid-in-capital 252,329 252,275 Accumulated other comprehensive loss (62) — Accumulated deficit (55,493) (64,716)
Shareholders’ equity 197,300 188,084 Less: Treasury stock at cost (12,759) (12,759)
Total shareholders’ equity 184,541 175,325
Total liabilities and shareholders’ equity $470,774 $ 453,119
The accompanying notes are an integral part of these condensed consolidated financial statements.
4

Table of Contents
PGT INNOVATIONS, INC.CONDENSED CONSOLIDATED STATEMENTS OF CASH FLOWS
(in thousands) Three Months Ended March 31, April 1, 2018 2017 (unaudited) Cash flows from operating activities:
Net income $ 7,340 $ 2,999 Adjustments to reconcile net income to net cash provided by operating activities:
Depreciation 2,961 3,024 Amortization 1,659 1,573 Provision for allowance for doubtful accounts 416 18 Stock-based compensation 514 458 Amortization of deferred financing costs and debt discount 615 691 Debt extinguishment costs 3,079 — Gain on disposal of assets (10) (8) Change in operating assets and liabilities:
Accounts receivable (7,921) (6,194) Inventories (3,332) (3,356) Contract assets, net, prepaid expenses, other current and other assets (1,034) (179) Accounts payable, accrued and other liabilities 4,591 3,688
Net cash provided by operating activities 8,878 2,714
Cash flows from investing activities: Purchases of property, plant and equipment (6,644) (3,117) Proceeds from disposals of assets 10 8
Net cash used in investing activities (6,634) (3,109)
Cash flows from financing activities: Payments of long-term debt (72) — Payments of financing costs (1,687) — Taxes paid relating to shares withheld on employee equity awards (637) (181) Proceeds from exercise of stock options 173 284 Proceeds from issuance of common stock under employee stock purchase plan 5 9 Other (7) (8)
Net cash (used in) provided by financing activities (2,225) 104
Net increase (decrease) in cash and cash equivalents 19 (291) Cash and cash equivalents at beginning of period 34,029 39,210
Cash and cash equivalents at end of period $ 34,048 $38,919
The accompanying notes are an integral part of these condensed consolidated financial statements.
5

Table of Contents
PGT INNOVATIONS, INC.NOTES TO CONDENSED CONSOLIDATED FINANCIAL STATEMENTS
(unaudited)
NOTE 1. BASIS OF PRESENTATION
The accompanying unaudited condensed consolidated financial statements include the accounts of PGT Innovations, Inc. and its wholly-owned subsidiary, PGTIndustries, Inc., and its wholly-owned subsidiaries CGI Window and Holdings, Inc. (“CGI”), which includes its wholly-owned subsidiary, CGI Commercial, Inc.(“CGIC”), and WinDoor, Incorporated (collectively, the “Company”), after elimination of intercompany accounts and transactions.
These condensed consolidated financial statements have been prepared in accordance with the instructions to Form 10-Q and do not include all the information andfootnotes required by United States Generally Accepted Accounting Principles (“GAAP”) for complete financial statements. In the opinion of management, alladjustments (consisting only of normal recurring adjustments) considered necessary for a fair presentation have been included. Operating results for the interimperiod is not necessarily indicative of the results that may be expected for the remainder of the current year or for any future periods. Each of the Company’s fiscalquarters ended March 31, 2018, and April 1, 2017, consisted of 13 weeks.
The condensed consolidated balance sheet as of December 30, 2017, is derived from the audited consolidated financial statements, but does not include alldisclosures required by GAAP. The condensed consolidated balance sheet as of December 30, 2017, and the unaudited condensed consolidated financial statementsas of and for the period ended March 31, 2018, should be read in conjunction with the more detailed audited consolidated financial statements for the year endedDecember 30, 2017, included in the Company’s most recent Annual Report on Form 10-K. Except for the adoption of the guidance relating to revenue fromcontracts with customers discussed below, the accounting policies used in the preparation of these unaudited condensed consolidated financial statements areconsistent with the accounting policies described in the Notes to Consolidated Financial Statements included in the Company’s Annual Report on Form 10-K.
Recently Adopted Accounting Pronouncements
In August 2017, the FASB issued ASU 2017-12, “Derivatives and Hedging (Topic 815): Targeted Improvements to Accounting for Hedging Activities.” Theamendments under ASU 2017-12 refine and expand hedge accounting requirements for both financial (e.g., interest rate) and commodity risks. Its provisions createmore transparency around how economic results are presented, both on the face of the financial statements and in the footnotes. It also makes certain targetedimprovements to simplify the application of hedge accounting guidance. ASU 2017-12 was effective for us in the first quarter of 2019, but we elected to early-adopt this guidance effective on December 31, 2017, the first day of our 2018 fiscal year. During the three months ended March 31, 2018, we entered into severalaluminum forwards contracts which we have designated as cash flow hedges and are accounting for as derivative financial instruments to which we are applyingthe provisions of ASU 2017-12. For additional information, see Note 12.
In February 2017, the FASB issued ASU 2017-05, “Other Income - Gain and Losses from the Derecognition of Nonfinancial Assets.” ASU 2017-05 clarifies thescope of Subtopic 610-20, Other Income - Gains and Losses from the Derecognition of Nonfinancial Assets and adds guidance for partial sales of nonfinancialassets. Subtopic 610-20, which was issued in May 2014 as a part of ASU 2014-09, provides guidance for recognizing gains and losses from the transfer ofnonfinancial assets in contracts with non-customers. We adopted this update effective on December 31, 2017, the first day of our 2018 fiscal year. The adoption ofthis guidance had no impact on our financial position, results of operations or cash flows.
In January 2017, the FASB issued ASU 2017-01, “Business Combinations (Topic 805) – Clarifying the Definition of a Business.” ASU 2017-01 affects allcompanies and other reporting organizations that must determine whether they have acquired or sold a business. The definition of a business affects many areas ofaccounting including acquisitions, disposals, goodwill, and consolidation. The amendments are intended to help companies and other organizations evaluatewhether transactions should be accounted for as acquisitions (or disposals) of assets or businesses. ASU 2017-01 provides a more robust framework to use indetermining when a set of assets and activities is a business. It also provides more consistency in applying the guidance, reduces the costs of application, and makesthe definition of a business more operable. We adopted this update effective on December 31, 2017, the first day of our 2018 fiscal year. The adoption of thisguidance had no impact on our financial position, results of operations or cash flows.
6

Table of Contents
In August 2016, the FASB issued ASU 2016-15, “Statement of Cash Flows (Topic 230): Classification of Certain Cash Receipts and Cash Payments (a consensusof the Emerging Issues Task Force).” ASU 2016-15 reduces diversity in practice in how certain transactions are classified in the statement of cash flows. Weadopted this update effective on December 31, 2017, the first day of our 2018 fiscal year. The adoption of this guidance had no impact on our statement of cashflows.
Recently Issued Accounting Pronouncements
In addition to the following discussion of the status of our adoption of ASU 2016-02, “Leases (Topic 842), see Note 3 to the consolidated financial statementsincluded in our most recent Annual Report on Form 10-K for the year ended December 30, 2017, as filed with the Securities and Exchange Commission onMarch 14, 2018.
In February 2016, the Financial Accounting Standards Board (FASB) issued Accounting Standards Update (ASU) No. 2016-02, “Leases (Topic 842)”. Thisguidance supersedes the existing guidance for lease accounting, Leases (Topic 840). ASU 2016-02 requires lessees to recognize leases on their balance sheets, andleaves lessor accounting largely unchanged. The amendments in this ASU are effective for fiscal years beginning after December 15, 2018 and interim periodswithin those fiscal years. Early application is permitted for all entities. ASU 2016-02 requires a modified retrospective approach for all leases existing at, or enteredinto after, the date of initial application, with an option to elect to use certain transition relief. The Company is currently evaluating the impact of this new standardon its consolidated financial statements.
Adoption of ASU 2014-09, “Revenue from Contracts with Customers”
We adopted the new revenue recognition standard on December 31, 2017 (the first day of our 2018 fiscal year) using the modified retrospective adoptionmethodology, whereby the cumulative impact of all prior periods is recorded in retained earnings or other impacted balance sheet line items upon adoption. Underthe modified retrospective adoption method, we elected to retroactively adjust, inclusive of all previous modifications, only those contracts that were consideredopen at the date of initial application. Refer to Note 2, “Revenue Recognition and Contracts with Customers” for further information along with our new accountingpolicies.
Upon adoption, we recognized a net decrease to the fiscal year 2018 opening balance of accumulated deficit of $1.9 million related to sales in excess of billings of$8.7 million, that would have been recognized as earned over time in our prior year ended December 30, 2017. The details of the adjustment to accumulated deficitupon adoption on December 31, 2017 (the first day or our 2018 fiscal year), as well as the effects on the consolidated balance sheet as of December 30, 2017, as ifASU 2014-09 had been adopted in our 2017 fiscal year are as follows:
Cumulative Effect Description of Effects on Line ItemNet sales $ 8,704 Additional contract asset salesCost of sales (5,642) Cost of contract asset salesSG&A expenses (532) Accruals for selling costsIncome tax expense (647) Estimated income tax effects
Net income $ 1,883 Additional net income
As Reported New Adjusted December 30, Revenue December 31, 2017 Standard 2017 Description of Effects on Line ItemInventories $ 37,816 $ (5,642) $ 32,174 Inventory classified as cost of salesOther current assets (1) 9,873 8,176 18,049 Contract asset on additional salesAccounts payable and accrued liabilities (1) 41,085 4 41,089 Accruals for selling costsDeferred income taxes 22,772 647 23,419 Estimated income tax effectsAccumulated deficit (64,716) 1,883 (62,833) Additional net income
(1) - Adjustments to this line item are net of related contract liability of $528 thousand, previously classified as customer deposits.
7
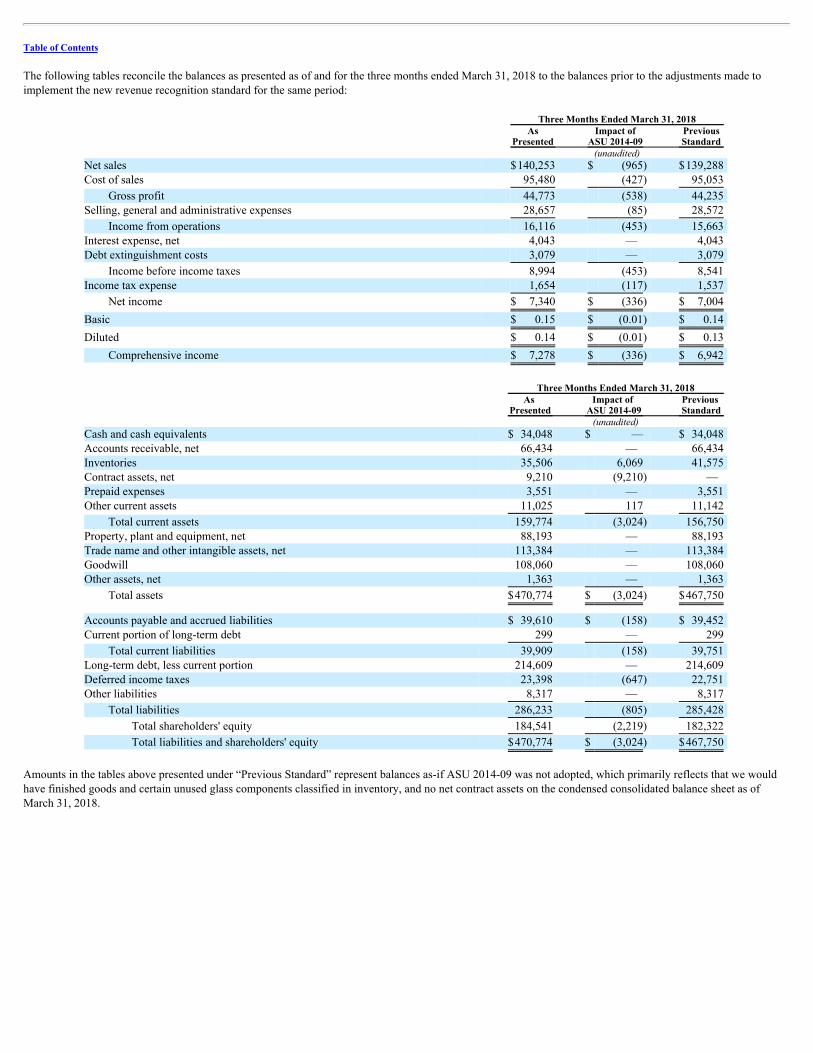
Table of Contents
The following tables reconcile the balances as presented as of and for the three months ended March 31, 2018 to the balances prior to the adjustments made toimplement the new revenue recognition standard for the same period:
Three Months Ended March 31, 2018 As Impact of Previous Presented ASU 2014-09 Standard (unaudited) Net sales $140,253 $ (965) $139,288 Cost of sales 95,480 (427) 95,053
Gross profit 44,773 (538) 44,235 Selling, general and administrative expenses 28,657 (85) 28,572
Income from operations 16,116 (453) 15,663 Interest expense, net 4,043 — 4,043 Debt extinguishment costs 3,079 — 3,079
Income before income taxes 8,994 (453) 8,541 Income tax expense 1,654 (117) 1,537
Net income $ 7,340 $ (336) $ 7,004
Basic $ 0.15 $ (0.01) $ 0.14
Diluted $ 0.14 $ (0.01) $ 0.13
Comprehensive income $ 7,278 $ (336) $ 6,942
Three Months Ended March 31, 2018
As
Presented Impact of
ASU 2014-09 Previous Standard
(unaudited) Cash and cash equivalents $ 34,048 $ — $ 34,048 Accounts receivable, net 66,434 — 66,434 Inventories 35,506 6,069 41,575 Contract assets, net 9,210 (9,210) — Prepaid expenses 3,551 — 3,551 Other current assets 11,025 117 11,142
Total current assets 159,774 (3,024) 156,750 Property, plant and equipment, net 88,193 — 88,193 Trade name and other intangible assets, net 113,384 — 113,384 Goodwill 108,060 — 108,060 Other assets, net 1,363 — 1,363
Total assets $470,774 $ (3,024) $467,750
Accounts payable and accrued liabilities $ 39,610 $ (158) $ 39,452 Current portion of long-term debt 299 — 299
Total current liabilities 39,909 (158) 39,751 Long-term debt, less current portion 214,609 — 214,609 Deferred income taxes 23,398 (647) 22,751 Other liabilities 8,317 — 8,317
Total liabilities 286,233 (805) 285,428
Total shareholders' equity 184,541 (2,219) 182,322
Total liabilities and shareholders' equity $470,774 $ (3,024) $467,750
Amounts in the tables above presented under “Previous Standard” represent balances as-if ASU 2014-09 was not adopted, which primarily reflects that we wouldhave finished goods and certain unused glass components classified in inventory, and no net contract assets on the condensed consolidated balance sheet as ofMarch 31, 2018.

NOTE 2. REVENUE RECOGNITION AND CONTRACTS WITH CUSTOMERS
New Revenue Recognition Accounting Policy
The Company is a manufacturer of fully-customized windows and doors, and manufactures products based on design specifications, measurements, colors,finishes, framing materials, glass-types, and other options selected by the customer at the point in time an order is received from the customer. The Company’sassessment is that all its finished goods and certain unused glass components have no alternative use, and that control of these products and components passes tothe customer upon completion of the manufacturing of each or all of the products in an order, and upon our receipt of certain glass components from our supplier,but before delivery of the products to the customer or input of certain glass components to the manufacturing process. Additionally, the Company has anenforceable right to payment at the time an order is received and accepted at the agreed-upon sales prices contained in our agreements with our customers for allmanufacturing efforts expended by the Company on behalf of its customers. Based on these factors, the Company recognizes revenue upon completion of themanufacturing process, and for certain unused glass components on hand, at the end of a reporting period.
Revenue on products for which the manufacturing process has been completed is based on the per-unit agreed-upon sales prices contained in our agreements withour customers, applied to each completed unit of unshipped finished product on hand at the end of the reporting period. Revenue on unused glass components onhand at the end of a reporting period is based on an allocation of the agreed-upon per-unit sales price contained in our agreements to which each glass componenton hand relates, based on an estimate of the percentage of which the cost of the glass component is of the estimated total cost of the finished product.
Disaggregation of Revenue from Contracts with Customers
The following table provides information about our revenue differentiated based on product category (dollars in millions):
Three Months Ended March 31, 2018 Sales % of sales Product category:
Impact-resistant windows and door products $ 120.5 85.9% Non-Impact window and door products 19.8 14.1%
Total net sales $ 140.3 100.0%
8

Table of Contents
Contract Balances
Contract assets represent sales recognized in excess of billings related to finished goods not yet shipped and certain unused glass components not yet placed into theproduction process, control of which is deemed to have passed to the customer and which are deemed to have no alternative use, but for which the Company has anenforceable right to payment. Contract liabilities are customer deposits on orders related to contract assets.
The following table provides information about contract asset and liability balances as of March 31, 2018, and as of December 31, 2017, the first day of our 2018fiscal year and the date of our adoption of ASU 2014-09 (in thousands):
Contract Contract Contract Assets, Assets Liabilities Net At March 31, 2018 $ 9,669 $ (459) $ 9,210 At December 31, 2017 8,704 (528) 8,176
Net increase $ 965 $ 69 $ 1,034
Contract assets, net, of 9.2 million is classified within other current assets in the accompanying condensed consolidated balance sheet as of March 31, 2018.Because we used the modified-retrospective method of adopting ASU 2014-09, the accompanying condensed consolidated balance sheet as of December 30, 2017was not revised.
Policies Regarding Shipping and Handling Costs and Commissions on Contract Assets
The Company has made a policy election to continue to recognize shipping and handling costs as a fulfillment activity. Treating shipping and handling as afulfillment activity requires estimated shipping and handling costs for undelivered products and certain glass components on which we have recognized revenueand created a contract asset, to be accrued to match this cost with the recognized revenue. This policy is unchanged from the Company’s policy for recognizingshipping and handling costs prior to the adoption of the new revenue guidance.
The newly adopted revenue guidance provides for a practical expedient which permits expensing of costs to obtain a contract when the expected amortizationperiod is one year or less, which typically results in expensing commissions paid to employees. We continue to expense sales commissions paid to employees assales are recognized, including sales from the creation of contract assets, as the expected amortization period is less than one year.
NOTE 3. WARRANTY
Most of our manufactured products are sold with warranties. Warranty periods, which vary by product components, generally range from 1 to 10 years; however,the warranty period for a limited number of specifically identified components in certain applications is a lifetime. The majority of the products sold havewarranties on components which range from 1 to 3 years. The reserve for warranties is based on management’s assessment of the cost per service call and thenumber of service calls expected to be incurred to satisfy warranty obligations on the current net sales.
9

Table of Contents
During the three months ended March 31, 2018, we recorded warranty expense at a rate of approximately 1.69% of sales, which decreased from the rate in the firstquarter of 2017 of 2.70%. We believe the decrease in warranty expense as a percentage of sales was the result of our workforce becoming more seasoned throughexperience and training, as well as a change in our warranty profile on PGT-branded door glass components produced by Cardinal as part of the SA on which theyprovide the warranty coverage.
The following table summarizes: current period charges, adjustments to previous estimates, if necessary, as well as settlements, which represent actual costsincurred during the period for the three months ended March 31, 2018, and April 1, 2017. The reserve is determined through specific identification and assessingCompany history. Expected future obligations are discounted to a current value using a risk-free rate for obligations with similar maturities. Beginning Charged End of Accrued Warranty of Period to Expense Adjustments Settlements Period (in thousands) Three months ended March 31, 2018 $ 5,386 $ 2,366 $ (110) $ (2,319) $5,323 Three months ended April 1, 2017 $ 5,569 $ 3,043 $ 89 $ (3,087) $5,614
NOTE 4. INVENTORIES
Inventories consist principally of raw materials purchased for the manufacture of our products. We have limited finished goods inventory since all products arecustom, made-to-order and usually ship upon completion. Finished goods inventory, prior to the adoption of ASU 2014-09, and work-in-progress costs includedirect materials, direct labor, and overhead. All inventories are stated at the lower of cost (first-in, first-out method) or net realizable value. Inventories consisted ofthe following:
March 31, December 30, 2018 2017 (in thousands) Raw materials $ 32,808 $ 30,139 Work-in-progress 2,698 2,506 Finished goods — 5,171
$ 35,506 $ 37,816
NOTE 5. STOCK BASED-COMPENSATION
Exercises
For the three months ended March 31, 2018, there were 86,549 options exercised at a weighted average exercise price of $2.00 per share.
Issuance
On March 2, 2018, we granted 139,182 restricted stock awards to certain executives and non-executive employees of the Company. The restrictions on these stockawards lapse over time based solely on continued service. However, the quantity of restricted shares granted on half of these shares, or 69,591 shares, is fixed,whereas the quantity granted on the remaining half, or 69,591 shares, is subject to Company-specific performance criteria. The restricted stock awards have a fairvalue on date of grant of $18.40 per share based on the closing New York Stock Exchange market price of the common stock on the day prior to the day the awardswere granted. Those restricted shares whose quantity is fixed vest in equal amounts over a three-year period on the first, second and third anniversary dates of thegrant. Those restricted shares whose quantity is subject to Company performance criteria vest in equal amounts on the second and third anniversary dates of thegrant.
The performance criteria, as defined in the share awards, provides for a graded awarding of shares based on the percentage by which the Company meets earningsbefore interest and taxes, as defined, in our 2018 business plan. The performance percentages, ranging from less than 80% to greater than 120%, provide for theawarding of shares ranging from no shares to 150% of the original number of shares.
10
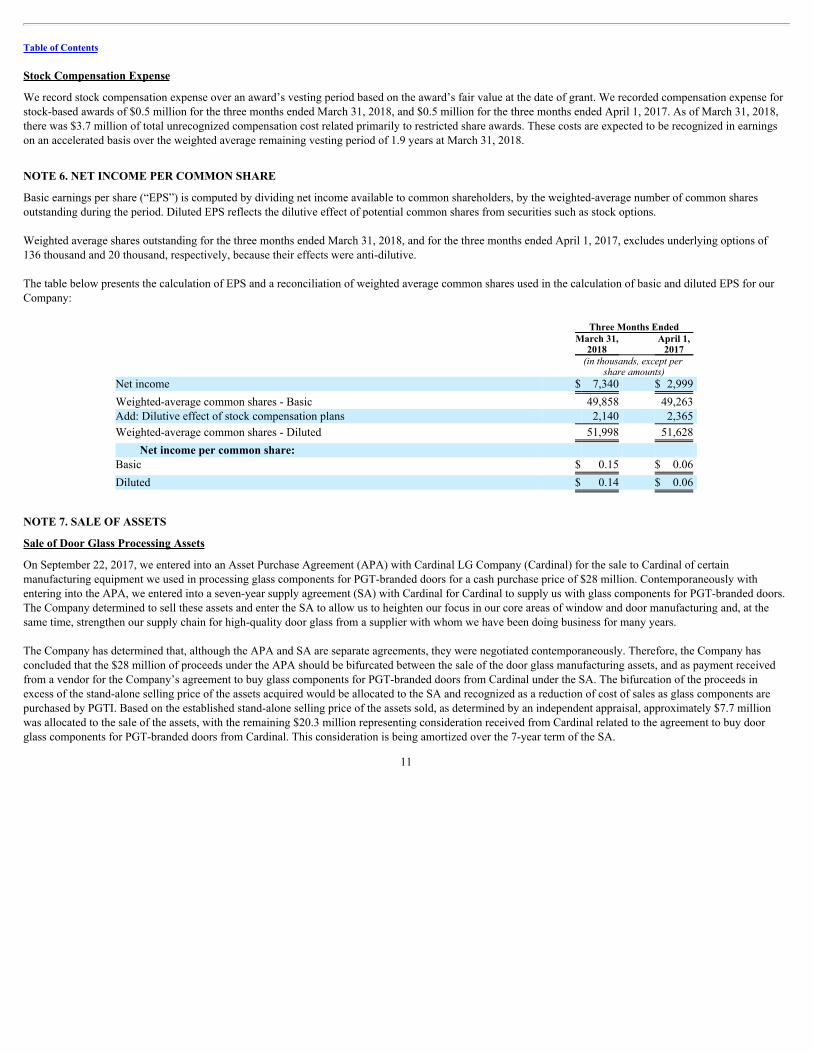
Table of Contents
Stock Compensation Expense
We record stock compensation expense over an award’s vesting period based on the award’s fair value at the date of grant. We recorded compensation expense forstock-based awards of $0.5 million for the three months ended March 31, 2018, and $0.5 million for the three months ended April 1, 2017. As of March 31, 2018,there was $3.7 million of total unrecognized compensation cost related primarily to restricted share awards. These costs are expected to be recognized in earningson an accelerated basis over the weighted average remaining vesting period of 1.9 years at March 31, 2018.
NOTE 6. NET INCOME PER COMMON SHARE
Basic earnings per share (“EPS”) is computed by dividing net income available to common shareholders, by the weighted-average number of common sharesoutstanding during the period. Diluted EPS reflects the dilutive effect of potential common shares from securities such as stock options.
Weighted average shares outstanding for the three months ended March 31, 2018, and for the three months ended April 1, 2017, excludes underlying options of136 thousand and 20 thousand, respectively, because their effects were anti-dilutive.
The table below presents the calculation of EPS and a reconciliation of weighted average common shares used in the calculation of basic and diluted EPS for ourCompany:
Three Months Ended March 31, April 1, 2018 2017
(in thousands, except per
share amounts) Net income $ 7,340 $ 2,999
Weighted-average common shares - Basic 49,858 49,263 Add: Dilutive effect of stock compensation plans 2,140 2,365
Weighted-average common shares - Diluted 51,998 51,628
Net income per common share: Basic $ 0.15 $ 0.06
Diluted $ 0.14 $ 0.06
NOTE 7. SALE OF ASSETS
Sale of Door Glass Processing Assets
On September 22, 2017, we entered into an Asset Purchase Agreement (APA) with Cardinal LG Company (Cardinal) for the sale to Cardinal of certainmanufacturing equipment we used in processing glass components for PGT-branded doors for a cash purchase price of $28 million. Contemporaneously withentering into the APA, we entered into a seven-year supply agreement (SA) with Cardinal for Cardinal to supply us with glass components for PGT-branded doors.The Company determined to sell these assets and enter the SA to allow us to heighten our focus in our core areas of window and door manufacturing and, at thesame time, strengthen our supply chain for high-quality door glass from a supplier with whom we have been doing business for many years.
The Company has determined that, although the APA and SA are separate agreements, they were negotiated contemporaneously. Therefore, the Company hasconcluded that the $28 million of proceeds under the APA should be bifurcated between the sale of the door glass manufacturing assets, and as payment receivedfrom a vendor for the Company’s agreement to buy glass components for PGT-branded doors from Cardinal under the SA. The bifurcation of the proceeds inexcess of the stand-alone selling price of the assets acquired would be allocated to the SA and recognized as a reduction of cost of sales as glass components arepurchased by PGTI. Based on the established stand-alone selling price of the assets sold, as determined by an independent appraisal, approximately $7.7 millionwas allocated to the sale of the assets, with the remaining $20.3 million representing consideration received from Cardinal related to the agreement to buy doorglass components for PGT-branded doors from Cardinal. This consideration is being amortized over the 7-year term of the SA.
11

Table of Contents
At the time we ceased using these assets in production, at which time they became available for immediate sale, their net book value was $4.7 million, and theywere reclassified from property, plant and equipment, to assets held for sale within other current assets.
The APA provided for the transfer of the assets from the Company to Cardinal in two phases, with the first date in 2017, and the second date in 2018, on dateswhich the Company and Cardinal agree to use. Under the APA, the cash purchase price of $28 million was to be paid by Cardinal to the Company in three separatepayments of $3 million on or about the time of the first transfer of the assets to Cardinal, $10 million on or about January 15, 2018, and $15 million at or about thetime of the second transfer of assets to Cardinal.
Cardinal paid us $3.0 million in cash on November 1, 2017, and paid us $10.0 million in cash on January 16, 2018, pursuant to the APA. On December 15, 2017,machinery and equipment classified as assets held for sale with net book value of $1.5 million, and fair value of $1.9 million was transferred to Cardinal and theirequipment rigger, and we recognized a gain on disposal for the difference. The remaining machinery and equipment to be transferred to Cardinal in 2018, whichhas a net book value of $3.2 million and fair value of $5.8 million, is classified within other current assets in the accompanying condensed consolidated balancesheets at March 31, 2018, and December 30, 2017.
The SA provides that the Company will purchase, and Cardinal will supply, all the Company’s requirements for certain glass components used in PGT-brandeddoors through the end of 2024. The terms of the manufacture by Cardinal and purchase by the Company of such glass components as to purchase orders, forecastsof purchases, pricing, invoicing, delivery and payment terms and other terms, are all as described in the SA. Early in the fourth quarter of 2017, we beganpurchasing and receiving glass components from Cardinal under the SA. At that time, we began amortizing the advance consideration received from Cardinalinitially allocated to the SA and continued to amortize such advance consideration during the three months ended March 31, 2018, recognizing $701 thousand ofsuch gain amortization, classified as a reduction to cost of sales in the accompanying condensed consolidated statement of comprehensive income for the threemonths ended March 31, 2018.
NOTE 8. GOODWILL, TRADE NAMES, AND OTHER INTANGIBLE ASSETS
Goodwill, trade names, and other intangible assets, net, are as follows:
Initial March 31, December 30, Useful Life 2018 2017 (in years) (in thousands) Goodwill $108,060 $ 108,060 indefinite
Trade names and other intangible assets: Trade names $ 75,841 $ 75,841 indefinite
Customer relationships 106,647 106,647 3-10 Developed technology 3,000 3,000 9-10 Non-compete agreement 1,668 1,668 2-5 Software license 590 590 2 Less: Accumulated amortization (74,362) (72,703)
Subtotal 37,543 39,202
Other intangible assets, net $113,384 $ 115,043
12
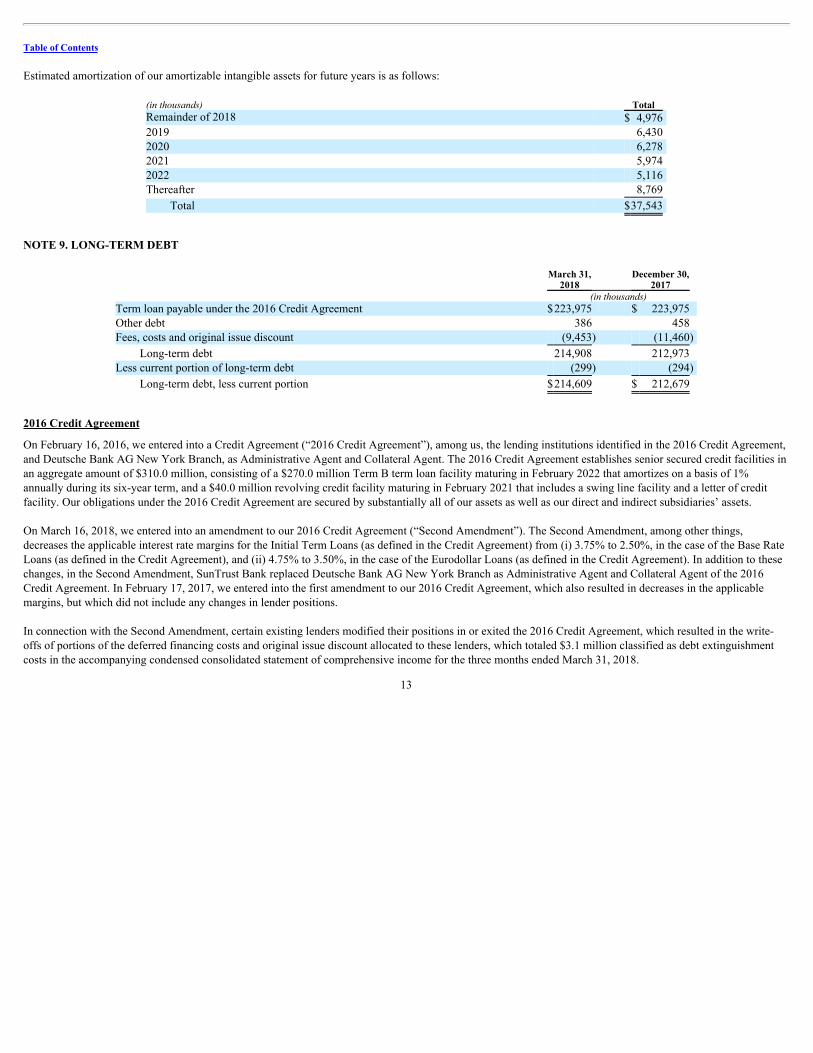
Table of Contents
Estimated amortization of our amortizable intangible assets for future years is as follows:
(in thousands) Total Remainder of 2018 $ 4,976 2019 6,430 2020 6,278 2021 5,974 2022 5,116 Thereafter 8,769
Total $37,543
NOTE 9. LONG-TERM DEBT
March 31, December 30, 2018 2017 (in thousands) Term loan payable under the 2016 Credit Agreement $223,975 $ 223,975 Other debt 386 458 Fees, costs and original issue discount (9,453) (11,460)
Long-term debt 214,908 212,973 Less current portion of long-term debt (299) (294)
Long-term debt, less current portion $214,609 $ 212,679
2016 Credit Agreement
On February 16, 2016, we entered into a Credit Agreement (“2016 Credit Agreement”), among us, the lending institutions identified in the 2016 Credit Agreement,and Deutsche Bank AG New York Branch, as Administrative Agent and Collateral Agent. The 2016 Credit Agreement establishes senior secured credit facilities inan aggregate amount of $310.0 million, consisting of a $270.0 million Term B term loan facility maturing in February 2022 that amortizes on a basis of 1%annually during its six-year term, and a $40.0 million revolving credit facility maturing in February 2021 that includes a swing line facility and a letter of creditfacility. Our obligations under the 2016 Credit Agreement are secured by substantially all of our assets as well as our direct and indirect subsidiaries’ assets.
On March 16, 2018, we entered into an amendment to our 2016 Credit Agreement (“Second Amendment”). The Second Amendment, among other things,decreases the applicable interest rate margins for the Initial Term Loans (as defined in the Credit Agreement) from (i) 3.75% to 2.50%, in the case of the Base RateLoans (as defined in the Credit Agreement), and (ii) 4.75% to 3.50%, in the case of the Eurodollar Loans (as defined in the Credit Agreement). In addition to thesechanges, in the Second Amendment, SunTrust Bank replaced Deutsche Bank AG New York Branch as Administrative Agent and Collateral Agent of the 2016Credit Agreement. In February 17, 2017, we entered into the first amendment to our 2016 Credit Agreement, which also resulted in decreases in the applicablemargins, but which did not include any changes in lender positions.
In connection with the Second Amendment, certain existing lenders modified their positions in or exited the 2016 Credit Agreement, which resulted in the write-offs of portions of the deferred financing costs and original issue discount allocated to these lenders, which totaled $3.1 million classified as debt extinguishmentcosts in the accompanying condensed consolidated statement of comprehensive income for the three months ended March 31, 2018.
13

Table of Contents
Effective on February 17, 2017, we repriced and amended our 2016 Credit Agreement for the first time. As there were no changes in lender positions, this actiondid not result in any modifications or extinguishments of debt. Therefore, there was no charge for debt extinguishment costs in the three months ended April 1,2017.
Interest on all loans under the 2016 Credit Agreement is payable either quarterly or at the expiration of any LIBOR interest period applicable thereto. Prior toamending the 2016 Credit Agreement on March 16, 2018, as described above, borrowings under the term loans and the revolving credit facility accrued interest at arate equal to, at our option, LIBOR (with a floor of 100 basis points in respect of the term loan), or a base rate (with a floor of 200 basis points in respect of theterm loan) plus an applicable margin. The applicable margin was 475 basis points in the case of LIBOR and 375 basis points in the case of the base rate. Theweighted average all-in interest rate for borrowings under the term-loan portion of the 2016 Credit agreement was 5.41% as of March 31, 2018, and was 5.75% atDecember 30, 2017.
We also pay quarterly fees on the unused portion of the revolving credit facility equal to 50 basis points per annum as well as a quarterly letter of credit fee at 575basis points per annum plus a 12.5 basis point facing fee per annum on the face amount of any outstanding letters of credit. As of March 31, 2018, there were $2.5million of letters of credit outstanding and $37.5 million available under the revolver. The letters of credit outstanding at March 31, 2018, include a total of $1.4million of letters of credit issued by Deutsche Bank, or issued to Deutsche Bank by SunTrust Bank as a back-stop, that are expected to be released once alloutstanding letters of credit issued by Deutsche Bank during its time as lead-lender have been returned.
The 2016 Credit Agreement contains a springing financial covenant, if we draw in excess of twenty percent (20%) of the revolving facility, which requires us tomaintain a maximum total net leverage ratio (based on the ratio of total debt for borrowed money to trailing EBITDA, each as defined in the 2016 CreditAgreement). That covenant will be tested quarterly based on the last four fiscal quarters and is set at levels as described in the 2016 Credit Agreement. As ofMarch 31, 2018, no such test is required as we have not exceeded 20% of our revolving capacity. We believe that our total net leverage ratio during the first quarterof 2018 was in compliance with the 2016 Credit Agreement, and that we are in compliance with all covenants.
The 2016 Credit Agreement also contains a number of affirmative and restrictive covenants, including limitations on the incurrence of additional debt, liens onproperty, acquisitions and investments, loans and guarantees, mergers, consolidations, liquidations and dissolutions, asset sales, dividends and other payments inrespect of our capital stock, prepayments of certain debt and transactions with affiliates. The 2016 Credit Agreement also contains customary events of default.Upon the occurrence of an event of default, the amounts outstanding under the 2016 Credit Agreement may be accelerated and may become immediately due andpayable. As of March 31, 2018, we were in compliance with all affirmative and restrictive covenants.
In connection with entering into the 2016 Credit Agreement, on February 16, 2016, we terminated our prior credit agreement, dated as of September 22, 2014,among PGT Industries, Inc., as the borrower, the Company, as guarantor, the lenders from time to time party thereto and Deutsche Bank, as administrative agentand collateral agent (“2014 Credit Agreement”). Along with cash on hand, proceeds from the term loan facility under the 2016 Credit Agreement were used torepay amounts outstanding under the 2014 Credit Agreement, acquire WinDoor, and pay certain fees and expenses.
As of March 31, 2018, the face value of debt outstanding under the 2016 Credit Agreement was $224.0 million, and accrued interest was $0.1 million.
The activity relating to third-party fees and costs, lender fees and discount for the three months ended March 31, 2018, are as follows. All debt-related fees, costsand original issue discount are classified as a reduction of the carrying value of long-term debt:
(in thousands) Total At beginning of year $11,460
Amortization expense through March 16, 2018 (520)
At time of refinancing 10,940 Add: Second amendment refinancing costs 1,687 Less: Debt extinguishment costs (3,079) Less: Amortization expense after refinancing (95)
At end of period $ 9,453
14

Table of Contents
Estimated amortization expense relating to third-party fees and costs, lender fees and discount for the years indicated as of March 31, 2018, is as follows:
(in thousands) Total Remainder of 2018 $1,698 2019 2,382 2020 2,579 2021 2,480 2022 314
Total $9,453
As a result of voluntary prepayments totaling $44.0 million we made since the inception of the 2016 Credit Agreement on February 16, 2016, we have no futurescheduled repayments until the maturity of the facility on February 21, 2022. The contractual future maturities of long-term debt outstanding, including thefinancing arrangement described as other debt, as of March 31, 2018, are as follows (at face value):
(in thousands) Remainder of 2018 $ 222 2019 164 2020 — 2021 — 2022 223,975
Total $ 224,361
Other Debt
In July 2017, we entered into a two-year financing arrangement for the purchase of an enterprise-wide software license relating to office productivity software. Thisfinancing arrangement requires 24 monthly payments of $26 thousand each. We estimated the value of this financing arrangement to be $590 thousand, using animputed annual interest rate of 6.00%, which approximates our borrowing rate under the 2016 Credit Agreement, a Level 3 input. At March 31, 2018, there was$386 thousand outstanding under this financing arrangement.
NOTE 10. COMMITMENTS AND CONTINGENCIES
Litigation
Our Company is a party to various legal proceedings in the ordinary course of business. Although the ultimate disposition of those proceedings cannot be predictedwith certainty, management believes the outcome of any claim that is pending or threatened, either individually or in the aggregate, will not have a materiallyadverse effect on our operations, financial position or cash flows.
NOTE 11. INCOME TAXES
Income tax expense was $1.7 million for the three months ended March 31, 2018, compared with $1.0 million for the three months ended April 1, 2017. Oureffective tax rate for the three months ended March 31, 2018, was 18.4%, and was 25.8% for the three months ended April 1, 2017.
Income tax expense in the three months ended March 31, 2018, and April 1, 2017, includes excess tax benefits relating to exercises of stock options and lapses ofrestrictions on stock awards, treated as a discrete item of income tax, totaling $613 thousand and $388 thousand, respectively. Excluding this discrete item ofincome tax expense, the effective tax rates for the three months ended March 31, 2018, and April 1, 2017, would have been 25.2% and 35.4%, respectively.
15

Table of Contents
In 2017, the effective tax rate, excluding the effect of the discrete item discussed above, was lower than our then combined statutory federal and state tax rate of38.8% primarily as the result of the estimated impact of the section 199 domestic manufacturing deduction. As a result of the Tax Cuts and Jobs Act, enactedeffective on December 22, 2017, the section 199 domestic manufacturing deduction was repealed. As such, our effective tax rate approximates our currentcombined statutory federal and state rate of 25.6%.
At March 31, 2018, a federal income tax receivable of $1.5 million was classified within other current assets, and an accrued state income tax payable of $0.6million was classified within accrued liabilities in the accompanying condensed consolidated balance sheet. At December 30, 2017, accrued federal and stateincome taxes payable of $6.5 million was classified within accrued liabilities in the accompanying condensed consolidated balance sheet. The Internal RevenueService provided tax relief relating to taxpayers in certain designated areas of Florida impacted by Hurricane Irma, which included all counties in Florida in whichwe operate. As a result, the deadline for remitting our required 2017 third quarter estimated payment for corporate income taxes, as well as the deadline for filingour 2016 fiscal year corporate income tax return, was extended to January 31, 2018. Therefore, in January 2018, we made an estimated Federal income tax paymentof $9.0 million relating to the extended fourth quarter of 2017 estimated payment. During the three months ended April 1, 2017, we did not make any payments ofestimated federal or state income taxes, nor did we receive any refunds of federal or state income taxes.
NOTE 12. FAIR VALUE
Fair value is defined as the price that would be received to sell an asset or paid to transfer a liability in an orderly transaction between market participants. A three-tier fair value hierarchy is used to prioritize the inputs used in measuring fair value. The hierarchy gives the highest priority to unadjusted quoted market prices inactive markets for identical assets or liabilities and the lowest priority to unobservable inputs. A financial instrument’s level within the fair value hierarchy is basedon the lowest level of any input that is significant to the fair value measurement. The three levels of the fair value hierarchy are as follows:
Level 1 Unadjusted quoted prices in active markets that are accessible at the measurement date for identical, unrestricted assets or liabilities.
Level 2 Inputs other than quoted prices included in Level 1 that are observable for the asset or liability, either directly or indirectly.
Level 3 Prices or valuations that require inputs that are both significant to the fair value measurement and unobservable.
The accounting guidance concerning fair value allows us to elect to measure financial instruments at fair value and report the changes in fair value throughearnings. This election can only be made at certain specified dates and is irrevocable once made. We do not have a policy regarding specific assets or liabilities toelect to measure at fair value, but rather we make the election on an instrument-by-instrument basis as they are acquired or incurred.
During the three months ended March 31, 2018, or April 1, 2017, we did not make any transfers between Level 2 and Level 3 financial assets. We conduct reviewson a quarterly basis to verify pricing, assess liquidity, and determine if significant inputs have changed that would impact the fair value hierarchy disclosure.
Fair Value of Financial Instruments
Our financial instruments include cash, accounts and notes receivable, and accounts payable, and accrued liabilities whose carrying amounts approximate their fairvalues due to their short-term nature. Our financial instruments also include long-term debt. The fair value of our long-term debt is based on debt with similar termsand characteristics and was approximately $226.8 million as of March 31, 2018, compared to a principal outstanding value of $224.0 million, and $227.3 million asof December 30, 2017, compared to a principal outstanding value of $224.0 million. Fair values were determined based on observed trading prices of our debtbetween domestic financial institutions.
16

Table of Contents
Items Measured at Fair Value on a Recurring Basis
The following are measured in the consolidated financial statements at fair value on a recurring basis and are categorized in the table below based upon the lowestlevel of significant input to the valuation:
Fair Value Measurements Assets (Liabilities) Quoted Significant Prices in Other Significant Active Observable Unobservable March 31, Markets Inputs Inputs 2018 (Level 1) (Level 2) (Level 3) Description Aluminum forward contracts $ (83) $ — $ (83) $ —
$ (83) $ — $ (83) $ —
The following is a description of the methods and assumptions used to estimate the fair values of the Company’s assets and liabilities measured at fair value on arecurring basis, as well as the basis for classifying these assets and liabilities as Level 2.
Aluminum forward contracts identical to those held by us trade on the London Metal Exchange (“LME”). The LME provides a transparent forum and is the world’slargest center for the trading of futures contracts for non-ferrous metals. The prices are used by the metals industry worldwide as the basis for contracts for themovement of physical material throughout the production cycle. Based on this high degree of volume and liquidity in the LME, we believe the valuation price atany measurement date for contracts with identical terms as to prompt date, trade date and trade price as those we hold at any time represents a contract’s exit priceto be used for purposes of determining fair value.
NOTE 13. DERIVATIVES
Aluminum Contracts
We enter into aluminum forward contracts to hedge the fluctuations in the purchase price of aluminum extrusion we use in production. Our contracts are designatedas cash flow hedges since they are highly effective in offsetting changes in the cash flows attributable to forecasted purchases of aluminum.
Guidance under the Financial Instruments topic of the Codification requires us to record our hedge contracts at fair value and consider our credit risk for contractsin a liability position, and our counter-party’s credit risk for contracts in an asset position, in determining fair value. We assess our counter-party’s risk of non-performance when measuring the fair value of financial instruments in an asset position by evaluating their financial position, including cash on hand, as well astheir credit ratings. We assess our risk of non-performance when measuring the fair value of our financial instruments in a liability position by evaluating our creditratings, our current liquidity including cash on hand and availability under our revolving credit facility as compared to the maturities of the financial liabilities.
At March 31, 2018, the fair value of our aluminum forward contracts was in a net liability position of $83 thousand. We had three outstanding forward contracts forthe purchase of 4.5 million pounds of aluminum through February 2019, at an average price of $0.94 per pound, which excludes the Midwest premium, withmaturity dates of between three months and eleven months. We assessed the risk of non-performance of the Company to these contracts and recorded a de minimisadjustment to fair value as of March 31, 2018.
We assess the effectiveness of our aluminum forward contracts by comparing the change in the fair value of the forward contract to the change in the expected cashto be paid for the hedged item. The effective portion of the gain or loss on our aluminum forward contracts is reported as a component of accumulated othercomprehensive loss and is reclassified into earnings in the same line item in the income statement as the hedged item in the same period or periods during whichthe transaction affects earnings. The amount of losses recognized in the “accumulated other comprehensive loss” line item in the accompanying condensedconsolidated balance sheet as of March 31, 2018, that we expect will be reclassified to earnings within the next twelve months, will be immaterial.
17
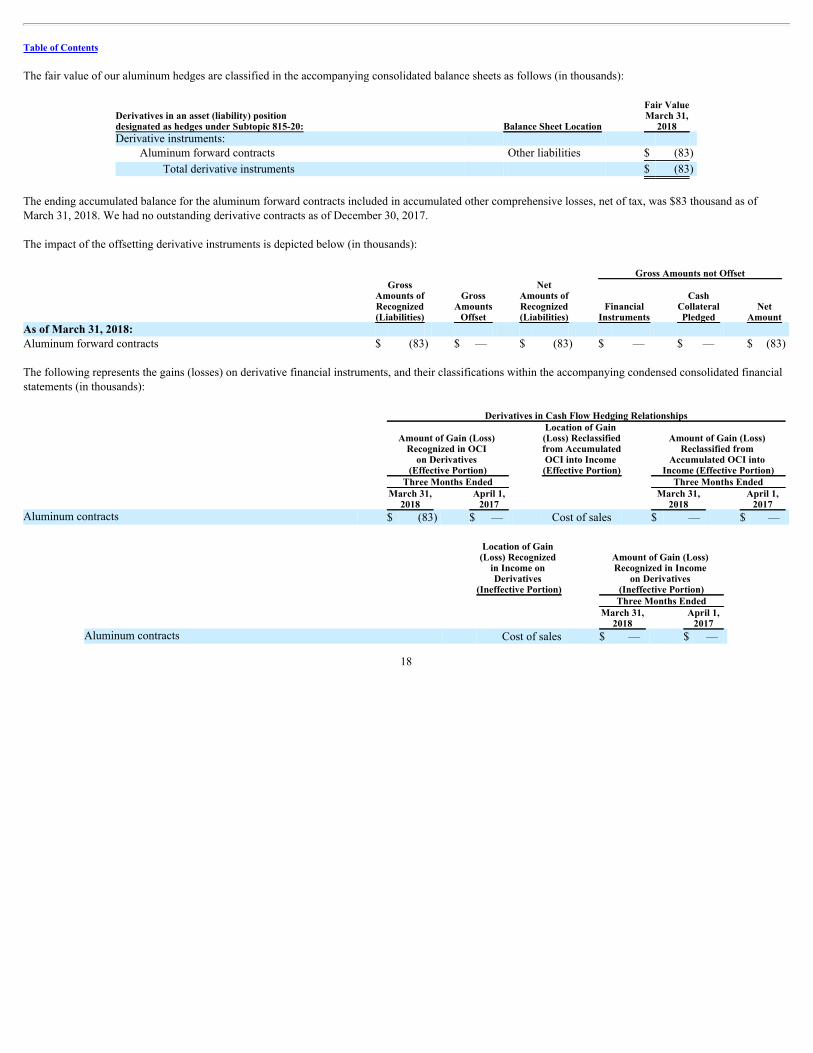
Table of Contents
The fair value of our aluminum hedges are classified in the accompanying consolidated balance sheets as follows (in thousands):
Fair Value Derivatives in an asset (liability) position March 31, designated as hedges under Subtopic 815-20: Balance Sheet Location 2018 Derivative instruments:
Aluminum forward contracts Other liabilities $ (83)
Total derivative instruments $ (83)
The ending accumulated balance for the aluminum forward contracts included in accumulated other comprehensive losses, net of tax, was $83 thousand as ofMarch 31, 2018. We had no outstanding derivative contracts as of December 30, 2017.
The impact of the offsetting derivative instruments is depicted below (in thousands): Gross Amounts not Offset Gross Net Amounts of Gross Amounts of Cash Recognized Amounts Recognized Financial Collateral Net (Liabilities) Offset (Liabilities) Instruments Pledged Amount As of March 31, 2018: Aluminum forward contracts $ (83) $ — $ (83) $ — $ — $ (83)
The following represents the gains (losses) on derivative financial instruments, and their classifications within the accompanying condensed consolidated financialstatements (in thousands): Derivatives in Cash Flow Hedging Relationships
Amount of Gain (Loss) Recognized in OCI
on Derivatives (Effective Portion)
Location of Gain (Loss) Reclassifiedfrom AccumulatedOCI into Income (Effective Portion)
Amount of Gain (Loss) Reclassified from
Accumulated OCI into Income (Effective Portion)
Three Months Ended Three Months Ended March 31, April 1, March 31, April 1, 2018 2017 2018 2017 Aluminum contracts $ (83) $ — Cost of sales $ — $ —
Location of Gain (Loss) Recognized
in Income on Derivatives
(Ineffective Portion)
Amount of Gain (Loss) Recognized in Income
on Derivatives (Ineffective Portion)
Three Months Ended March 31, April 1, 2018 2017 Aluminum contracts Cost of sales $ — $ —
18

Table of Contents
NOTE 14. ACCUMULATED OTHER COMPREHENSIVE LOSS
The following table shows the components of accumulated other comprehensive loss for the three months ended March 31, 2018:
Aluminum Three months ended March 31, 2018 Forward (in thousands) Contracts Balance at December 30, 2017 $ —
Other comprehensive loss (83) Tax effect 21
Net current-period other comprehensive loss (62)
Balance at March 31, 2018 $ (62)
19

Table of Contents
ITEM 2. MANAGEMENT’S DISCUSSION AND ANALYSIS OF FINANCIAL CONDITION AND RESULTS OF OPERATIONS
The following discussion of our financial condition and results of operations should be read in conjunction with the Management’s Discussion and Analysis ofFinancial Condition and Results of Operations and the consolidated financial statements and notes thereto for the year ended December 30, 2017, included in ourmost recent Annual Report on Form 10-K as filed with the Securities and Exchange Commission on March 14, 2018. All amounts herein are unaudited.
Special Note Regarding Forward-Looking Statements
Except for historical information contained herein, the matters set forth in this Quarterly Report on Form 10-Q are forward-looking statements. These statementsare based on management’s current expectations and plans, which involve risks and uncertainties. Such forward-looking statements generally can be identified bythe use of forward-looking terminology such as “may,” “will,” “believe,” “expect,” “forecast,” “guidance,” “intend,” “could,” “project,” “estimate,” “anticipate,”“should,” and similar terminology. You are cautioned not to place undue reliance on these forward-looking statements, which speak only as of the filing date of thisQuarterly Report and which involve risks and uncertainties that may cause our actual results to differ materially from those set forth in the forward-lookingstatements. Those risks and uncertainties that could cause actual results to differ materially from those described in our forward-looking statements include, but arenot limited to:
• Changes in new home starts and home remodeling trends, especially in the state of Florida, where the substantial portion of our sales are generated
• The economy in the U.S. generally or in Florida, where the substantial portion of our sales are generated
• Raw material prices, especially for aluminum, glass and vinyl, including, without limitation, price increases due to the implementation of tariffs and othertrade-related restrictions
• our dependence on a limited number of suppliers for certain of our key materials
• Transportation costs
• Our level of indebtedness
• Dependence on our impact-resistant product lines
• Integration of acquisition(s), including our acquisition of WinDoor, Inc.
• Product liability and warranty claims made against us
• Federal, and state and local regulations, including changes to state and local building codes
• Dependence on our limited number of manufacturing facilities
• the continuing post-storm impact of Hurricane Irma on our customers and markets, demand for our products, and our financial and operational performancerelated thereto
• risks associated with our information technology systems, including cybersecurity-related risks, such as unauthorized intrusions into our systems by“hackers” and theft of data and information from our systems, and,
• The risks and uncertainties discussed under Item 1A, “Risk Factors,” in the Company’s Annual Report on Form 10-K for the year ended December 30, 2017.
Any forward-looking statements made by us or on our behalf speak only as of the date they are made and, except as may be required by law, we do not undertakeany obligation to update any forward-looking statement to reflect the impact of subsequent events or circumstances.
20

Table of Contents
EXECUTIVE OVERVIEW
Sales and Operations
We recorded sales of $140.3 million, up 24.4% compared to the first quarter of 2017. Our first quarter of 2018 saw strong top-line sales growth which we believewas driven by our continued investment in advertising and marketing, which leveraged the heightened awareness of the benefits of our impact-resistant productsresulting from an active 2017 hurricane season. The increase in sales of $27.6 million in the first quarter of 2018 compared to the first quarter of 2017 was drivenby our ability to gain share in the repair and remodeling market sector. Of our sales in the first quarter of 2018, 63% were into the repair and remodeling sector.Repair and remodeling sales increased 32% in the first quarter of 2018, compared to the same period last year.
Homeowners are preparing for what experts are forecasting to be another active hurricane season in 2018, and, we believe they are selecting our products at anincreasing rate for their impact protection needs, and to comply with Florida’s building codes, which are the most stringent building codes for wind-borneprotection in the country.
Our strong top-line results contributed to our solid operating performance in the first quarter of 2018 due to our increased ability to leverage fixed costs, whichresulted in improved margins, as compared to last year’s first quarter. This leverage, combined with manufacturing and operating efficiencies we achieveddelivered a nearly 4 percentage-point increase in gross margin in this year’s first quarter compared to last year. However, the inflationary headwinds weexperienced in the second half of last year were still a factor during the first quarter of 2018, especially higher costs for aluminum. We acted to offset theunfavorable impact of higher costs, including announcing a price increase during the first quarter, the benefits of which we began to see in March 2018.
Aluminum prices have increased recently on sanction-driven global supply concerns, rising to levels in early April 2018 not seen since the record levels of 2011,before retreating somewhat through the end of the month. Including the Midwest premium, aluminum is now approximately $1.29 per pound. As of today, we arecovered for approximately 60 percent of our estimated needs for the remainder of 2018, at an average delivered price of $1.10 per pound.
We delivered a 122% increase in income before taxes, and net income per diluted share of $0.14, compared to $0.06 per diluted share in the same period last year.We are pleased with these metrics, which confirm our ability to profitably leverage our growth.
During the first quarter of 2018, we amended our credit facility, which resulted in a 125 basis-point reduction in our interest rate margin, which we estimate shouldreduce our cash debt service costs by an aggregate of nearly $2.8 million over the next twelve months. We accomplished this refinancing at minimal cost to thecompany and recorded a non-cash charge of $3.1 million for the write-off of deferred financing costs. Including last year’s refinancing, we have lowered ourinterest margin by a total of 225 basis points in little more than one year, a reflection we believe of our strong financial position and ability to generate cash.
Looking to the balance of 2018, we remain confident in our core market of Florida and continue to expect to finish within the previous guidance range forconsolidated sales of $550 million to $575 million for our 2018 fiscal year.
21

Table of Contents
Performance Summary
The following table presents financial data derived from our unaudited condensed consolidated statements of comprehensive income as a percentage of total netsales for the periods indicated (in thousands, except percentages):
Three Months Ended March 31, April 1, 2018 2017 (unaudited) Net sales $140,253 100.0% $112,721 100.0% Cost of sales 95,480 68.1% 80,982 71.8%
Gross profit 44,773 31.9% 31,739 28.2% Selling, general and administrative expenses 28,657 20.4% 22,785 20.2%
Income from operations 16,116 11.5% 8,954 7.9% Interest expense, net 4,043 2.9% 4,910 4.4% Debt extinguishment costs 3,079 2.2% — 0.0%
Income before income taxes 8,994 6.4% 4,044 3.6% Income tax expense 1,654 1.2% 1,045 0.9%
Net income $ 7,340 5.2% $ 2,999 2.7%
RESULTS OF OPERATIONS FOR THE THREE MONTHS ENDED MARCH 31, 2018 AND APRIL 1, 2017
The following table represents total sales by product category for the three months ended March 31, 2018, and April 1, 2017 (in millions): Three Months Ended March 31, 2018 April 1, 2017 Sales % of sales Sales % of sales % change Product category:
Impact-resistant windows and door products $120.5 85.9% $ 94.4 83.7% 27.5% Non-Impact window and door products 19.8 14.1% 18.3 16.3% 8.3%
Total net sales $140.3 100.0% $112.7 100.0% 24.4%
Total net sales during the first quarter of 2018 were $140.3 million, an increase of $27.6 million, or 24.4%, from $112.7 million in total net sales for the firstquarter of 2017.
Net sales of impact-resistant window and door products were $120.5 million for the first quarter of 2018, an increase of $26.1 million, or 27.5%, from $94.4million in net sales for the first quarter of 2017. Included in sales of our impact-resistant window and door products were $81.1 million of aluminum impact sales,an increase of $14.9 million, or 22.4%, and $39.4 million of vinyl impact sales, an increase of $11.2 million, or 39.6%.
Net sales of non-impact window and door products were $19.8 million for the first quarter of 2018, an increase of $1.5 million, or 8.3%.
Gross profit and gross margin
Gross profit was $44.8 million in the first quarter of 2018, an increase of $13.1 million, or 41.1%, from $31.7 million in the first quarter of 2017. The gross marginpercentage was 31.9% in the first quarter of 2018, compared to 28.2% in the prior year first quarter, an increase of 3.7%. Adjusting for costs in the first quarter of2018 relating to machinery and equipment relocations totaling $0.4 million, and costs in the first quarter of 2017 relating to the start-up of our Thermal PlasticSpacer system line totaling $0.5 million, our adjusted gross margin was 32.2% for the first quarter of 2018, and was 28.6% for the
22

Table of Contents
first quarter of 2017. Improvements in the first quarter of 2018, compared to last year’s first quarter, relating to price increases, which benefitted gross margin by1.8%, higher contribution margins on the increased sales volume, which benefitted gross margin by 1.2%, a change in mix towards a higher portion of repair andremodeling sales, which benefitted gross margin by 1.1%, and in scrap rates and efficiencies, which benefitted gross margin by 1.0% during the first quarter of2018, were partially offset by higher aluminum prices compared to last year’s first quarter, which decreased gross margin by 1.1%, and by inflationary effects onlabor costs, which decreased gross margin by 0.7%. There were other improvements, which benefitted gross margin by 0.3%.
Selling, general and administrative expenses
Selling, general and administrative expenses were $28.7 million in the first quarter of 2018, an increase of $5.9 million, or 25.8%, from $22.8 million in the firstquarter of 2017. As a percentage of sales, these costs were 20.4%, an increase of 0.2%, from 20.2% from the first quarter of 2017. Selling, general andadministrative expenses increased in the first quarter of 2018, compared to the first quarter of last year, due to higher selling and distribution costs of approximately$2.0 million relating to the increase in sales, due to higher personnel-related costs of approximately $1.8 million primarily relating to higher incentivecompensation reflecting the improved performance in the first quarter of 2018 compared to last year, with the remainder primarily relating to our increasedadvertising and marketing initiatives.
We record warranty costs as a selling expense within selling, general and administrative expenses. During the three months ended March 31, 2018, we recordedwarranty expense at a rate of 1.69% of sales, which decreased when compared to the rate in the first quarter of 2017 of 2.70%. We believe the decrease in warrantyexpense as a percentage of sales was the result of our workforce becoming more seasoned through experience and training, as well as a change in our warrantyprofile on PGT-branded door glass components produced by Cardinal as part of the SA on which they provide the warranty coverage.
Interest expense, net
Interest expense was $4.0 million in the first quarter of 2018, a decrease of $0.9 million, or 17.7%, from $4.9 million in the first quarter of 2017. Interest expensedecreased due to a decrease in the average level of outstanding debt during the first quarter of 2018, compared to the first quarter of 2017, as the result of a total of$40 million in voluntary prepayments made during 2017.
The lower level of debt was partially offset by a higher weighted-average interest rate during the first quarter of 2018 compared to last year as a result of increasesin LIBOR during 2017.
Debt extinguishment costs
Debt extinguishment costs were $3.1 million in the first quarter of 2018. These costs related to the write-off of deferred financing costs and debt discount inconnection with second amendment of the 2016 Credit Agreement effective on March 16, 2018, which resulted in certain existing lenders reducing their positionsin or exiting the facility. This resulted in the write-offs of portions of the deferred financing costs and original issue discount allocated to these lenders.
Effective on February 17, 2017, we repriced and amended our 2016 Credit Agreement for the first time. As there were no changes in lender positions, this actiondid not result in any modifications or extinguishments of debt. Therefore, there was no charge for debt extinguishment costs in the three months ended April 1,2017.
Income tax expense
Our income tax expense was $1.7 million for the first quarter of 2018, compared with $1.0 million for the first quarter of 2017. Our effective tax rate for the threemonths ended March 31, 2018, was 18.4%, and was 25.8% for the three months ended April 1, 2017.
Income tax expense in the three months ended March 31, 2018, and April 1, 2017, includes excess tax benefits relating to exercises of stock options and lapses ofrestrictions on stock awards, treated as a discrete item of income tax, totaling $613 thousand and $388 thousand, respectively. Excluding these discrete items ofincome tax expense, the effective tax rates for the three months ended March 31, 2018, and April 1, 2017, would have been 25.2% and 35.4%, respectively.
In 2017, the effective tax rate, excluding the effect of the discrete item discussed above, was lower than our then combined statutory federal and state tax rate of38.8% primarily as the result of the estimated impact of the section 199 domestic manufacturing deduction. As a result of the Tax Cuts and Jobs Act, enactedeffective on December 22, 2017, the section 199 domestic manufacturing deduction was repealed. As such, our effective tax rate approximates our currentcombined statutory federal and state rate of 25.6%.
23

Table of Contents
LIQUIDITY AND CAPITAL RESOURCES
Our principal source of liquidity is cash flow generated by operations and supplemented by borrowings under our credit facilities. We expect that this cashgenerating capability will provide us with financial flexibility in meeting operating and investing needs. Our primary capital requirements are to fund workingcapital needs, meet required debt service payments on our credit facilities and fund capital expenditures.
Consolidated Cash Flows
Operating activities. Cash provided by operating activities during the first three months of 2018 was $8.9 million, compared to cash provided of $2.7 million in thefirst three months of 2017. The increase in cash provided by operating activities for the first three months of 2018, as compared to the first three months of 2017, of$6.2 million, was due to the factors set forth in the table below, but primarily driven by million in cash proceeds received on January 16, 2018 from Cardinalrelating to the terms of the APA and SA.
Direct cash flows from operations for the first three months of 2018 and 2017 are as follows:
Direct Operating
Cash Flows Three Months Ended March 31, April 1, (in millions) 2018 2017 Collections from customers $ 136.3 $110.8 Other collections of cash 1.6 1.2 Disbursements to vendors (86.7) (72.6) Personnel related disbursements (39.1) (31.7) Income taxes paid, net (9.0) — Debt service payments (4.3) (5.0) Cash proceeds received under Cardinal APA and SA 10.0 — Other cash activity, net 0.1 —
Cash from operations $ 8.9 $ 2.7
Days sales outstanding (DSO), which we calculate as accounts receivable divided by quarterly average daily sales, was 39 days at March 31, 2018, compared to 37days at April 1, 2017. DSOs were affected by certain larger customer projects for CGI and WinDoor, which have longer payment terms.
Inventory on hand as of March 31, 2018, was $35.5 million, compared to $37.8 million at December 30, 2017, a decrease of $2.3 million. The decrease in inventoryincludes a decrease of $5.2 million relating to the adoption of ASU 2014-09, which resulted in our recognizing revenue and, therefore, cost of sales, on inventorythat was previously considered to be finished goods. The remaining increase in inventory was due to our increase in sales for which we are carrying a higher levelof raw materials.
We monitor and evaluate raw material inventory levels based on the need for each discrete item to fulfill short-term requirements calculated from current orderpatterns and to provide appropriate safety stock. Because all of our products are made-to-order, we have only a small amount of work-in-process inventory. As aresult of these factors, our inventories are not excessive, and we believe the value of such inventories will be realized through sales.
Investing activities. Cash used in investing activities was $6.6 million for the first three months of 2018, compared to cash used in investing activities of $3.1million for the first three months of 2017. There was an increase in cash used in investing activities due to an increase in capital expenditures of $3.5 million, whichwent from $3.1 million in the first three months of 2017, to $6.6 million in the first three months of 2018. Proceeds from sales of assets in the first quarters of 2018and 2017 were insignificant.
24

Table of Contents
Financing activities. Cash used in financing activities was $2.2 million in the first three months of 2018, compared to cash provided by financing activities of $0.1million in the first three months of 2017, an increase in cash used of $2.3 million. We made repayments of long-term debt of $0.1 million in the first three monthsof 2018. There were no repayments of long-term debt in the first three months of 2017.
There were payments of financing costs of $1.7 million related to the Second Amendment. Taxes paid relating to common stock withheld from employees tosatisfy tax withholding obligations in connection with the vesting of restricted stock awards were $0.6 million in the first three months of 2018, versus $0.2 millionin the first three months of 2017, an increase in cash used of $0.4 million. Proceeds from the exercises of stock options were $0.2 million in the first three monthsof 2018, compared to $0.3 million in the first three months of 2017, a decrease in cash provided of $0.1 million.
At March 31, 2018, a federal income tax receivable of $1.5 million was classified within other current assets, and an accrued state income tax payable of $0.6million was classified within accrued liabilities in the accompanying condensed consolidated balance sheet. At December 30, 2017, accrued federal and stateincome taxes payable of $6.5 million was classified within accrued liabilities in the accompanying condensed consolidated balance sheet. The Internal RevenueService provided tax relief relating to taxpayers in certain designated areas of Florida impacted by Hurricane Irma, which included all counties in Florida in whichwe operate. As a result, the deadline for remitting our required 2017 third quarter estimated payment for corporate income taxes, as well as the deadline for filingour 2016 fiscal year corporate income tax return, was extended to January 31, 2018. Therefore, in January 2018, we made an estimated Federal income tax paymentof $9.0 million relating to the extended fourth quarter of 2017 estimated payment, and in April 2018, we made a $1.6 million estimated state tax payment toFlorida. During the three months ended April 1, 2017, we did not make any payments of estimated federal or state income taxes, nor did we receive any refunds offederal or state income taxes.
Capital Resources and Debt Covenant. On February 16, 2016, we entered into the 2016 Credit Agreement, among us, the lending institutions identified in the 2016Credit Agreement, and Deutsche Bank AG New York Branch, as Administrative Agent and Collateral Agent. The 2016 Credit Agreement establishes new seniorsecured credit facilities in an aggregate amount of $310.0 million, consisting of a $270.0 million Term B term loan facility maturing in February 2022 thatamortizes on a basis of 1% annually during its six-year term, and a $40.0 million revolving credit facility maturing in February 2021 that includes a swing linefacility and a letter of credit facility. Our obligations under the 2016 Credit Agreement are secured by substantially all of our assets as well as our direct andindirect subsidiaries’ assets.
On March 16, 2018, we entered into an amendment of our 2016 Credit Agreement. The Second Amendment, among other things, decreases the applicable interestrate margins for the Initial Term Loans (as defined in the Credit Agreement) from (i) 3.75% to 2.50%, in the case of the Base Rate Loans (as defined in the CreditAgreement), and (ii) 4.75% to 3.50%, in the case of the Eurodollar Loans (as defined in the Credit Agreement). In addition to these changes, in the SecondAmendment, SunTrust Bank replaced Deutsche Bank AG New York Branch as Administrative Agent and Collateral Agent of the 2016 Credit Agreement. InFebruary 17, 2017, we entered into the first amendment to our 2016 Credit Agreement, which also resulted in decreases in the applicable margins, but which didnot include any changes in lender positions.
In connection with the Second Amendment, certain existing lenders modified their positions in or exited the 2016 Credit Agreement, which resulted in the write-offs of portions of the deferred financing costs and original issue discount allocated to these lenders, which totaled $3.1 million classified as debt extinguishmentcosts in the accompanying condensed consolidated statement of comprehensive income for the three months ended March 31, 2018.
Effective on February 17, 2017, we repriced and amended our 2016 Credit Agreement for the first time. As there were no changes in lender positions, this actiondid not result in any modifications or extinguishments of debt. Therefore, there was no charge for debt extinguishment costs in the three months ended April 1,2017.
Interest on all loans under the 2016 Credit Agreement is payable either quarterly or at the expiration of any LIBOR interest period applicable thereto. Prior toamending the 2016 Credit Agreement on March 16, 2018, as described above, borrowings under the term loans and the revolving credit facility accrued interest at arate equal to, at our option, LIBOR (with a floor of 100 basis points in respect of the term loan), or a base rate (with a floor of 200 basis points in respect of theterm loan) plus an applicable margin. The applicable margin was 475 basis points in the case of LIBOR and 375 basis points in the case of the base rate. Theweighted average all-in interest rate for borrowings under the term-loan portion of the 2016 Credit agreement was 5.41% as of March 31, 2018, and was 5.75% atDecember 30, 2017.
25
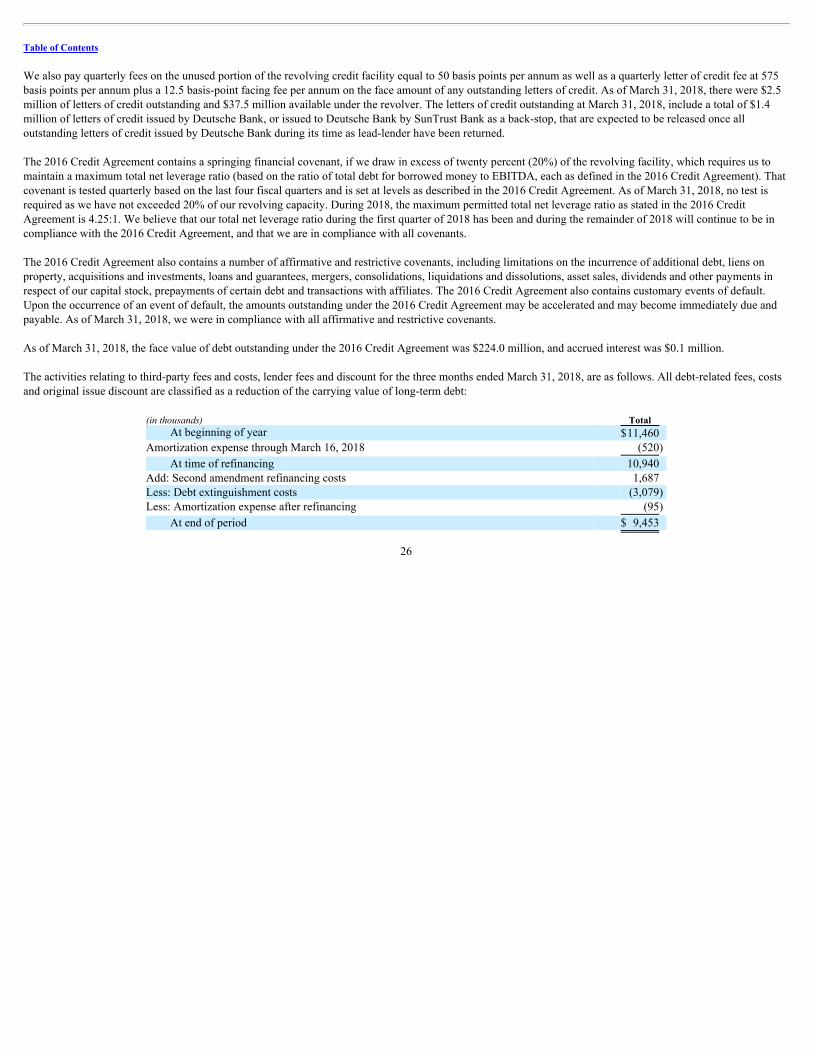
Table of Contents
We also pay quarterly fees on the unused portion of the revolving credit facility equal to 50 basis points per annum as well as a quarterly letter of credit fee at 575basis points per annum plus a 12.5 basis-point facing fee per annum on the face amount of any outstanding letters of credit. As of March 31, 2018, there were $2.5million of letters of credit outstanding and $37.5 million available under the revolver. The letters of credit outstanding at March 31, 2018, include a total of $1.4million of letters of credit issued by Deutsche Bank, or issued to Deutsche Bank by SunTrust Bank as a back-stop, that are expected to be released once alloutstanding letters of credit issued by Deutsche Bank during its time as lead-lender have been returned.
The 2016 Credit Agreement contains a springing financial covenant, if we draw in excess of twenty percent (20%) of the revolving facility, which requires us tomaintain a maximum total net leverage ratio (based on the ratio of total debt for borrowed money to EBITDA, each as defined in the 2016 Credit Agreement). Thatcovenant is tested quarterly based on the last four fiscal quarters and is set at levels as described in the 2016 Credit Agreement. As of March 31, 2018, no test isrequired as we have not exceeded 20% of our revolving capacity. During 2018, the maximum permitted total net leverage ratio as stated in the 2016 CreditAgreement is 4.25:1. We believe that our total net leverage ratio during the first quarter of 2018 has been and during the remainder of 2018 will continue to be incompliance with the 2016 Credit Agreement, and that we are in compliance with all covenants.
The 2016 Credit Agreement also contains a number of affirmative and restrictive covenants, including limitations on the incurrence of additional debt, liens onproperty, acquisitions and investments, loans and guarantees, mergers, consolidations, liquidations and dissolutions, asset sales, dividends and other payments inrespect of our capital stock, prepayments of certain debt and transactions with affiliates. The 2016 Credit Agreement also contains customary events of default.Upon the occurrence of an event of default, the amounts outstanding under the 2016 Credit Agreement may be accelerated and may become immediately due andpayable. As of March 31, 2018, we were in compliance with all affirmative and restrictive covenants.
As of March 31, 2018, the face value of debt outstanding under the 2016 Credit Agreement was $224.0 million, and accrued interest was $0.1 million.
The activities relating to third-party fees and costs, lender fees and discount for the three months ended March 31, 2018, are as follows. All debt-related fees, costsand original issue discount are classified as a reduction of the carrying value of long-term debt:
(in thousands) Total At beginning of year $11,460
Amortization expense through March 16, 2018 (520)
At time of refinancing 10,940 Add: Second amendment refinancing costs 1,687 Less: Debt extinguishment costs (3,079) Less: Amortization expense after refinancing (95)
At end of period $ 9,453
26

Table of Contents
Estimated amortization expense relating to third-party fees and costs, lender fees and discount for the years indicated as of March 31, 2018, is as follows:
(in thousands) Total Remainder of 2018 $1,698 2019 2,382 2020 2,579 2021 2,480 2022 314
Total $9,453
As a result of voluntary prepayments totaling $44.0 million we made since the inception of the 2016 Credit Agreement on February 16, 2016, we have no futurescheduled repayments until the maturity of the facility on February 21, 2022. The contractual future maturities of long-term debt outstanding, including thefinancing arrangement described as other debt, as of March 31, 2018, are as follows (at face value):
(in thousands) Remainder of 2018 $ 222 2019 164 2020 — 2021 — 2022 223,975
Total $ 224,361
Capital Expenditures. Capital expenditures vary depending on prevailing business factors, including current and anticipated market conditions. For the first threemonths of 2018, capital expenditures were $6.6 million, compared to $3.1 million for the first three months of 2017. In 2018, we expect to spend approximately$18 to $20 million on capital expenditures, primarily including machinery and equipment, and distribution equipment such as tractors and trailers.
Sale of Door Glass Processing Assets. On September 22, 2017, we entered into an Asset Purchase Agreement (APA) with Cardinal LG Company (Cardinal) for thesale to Cardinal of certain manufacturing equipment we used in processing glass components for PGT-branded doors for a cash purchase price of $28 million.Contemporaneously with entering into the APA, we entered into a seven-year supply agreement (SA) with Cardinal for Cardinal to supply us with glasscomponents for PGT-branded doors. The Company determined to sell these assets and enter the SA to allow us to heighten our focus in our core areas of windowand door manufacturing and, at the same time, strengthen our supply chain for high-quality door glass from a supplier with whom we have been doing business formany years.
The Company has determined that, although the APA and SA are separate agreements, they were negotiated contemporaneously. Therefore, the Company hasconcluded that the $28 million of proceeds under the APA should be bifurcated between the sale of the door glass manufacturing assets, and as payment receivedfrom a vendor for the Company’s agreement to buy glass components for PGT-branded doors from Cardinal under the SA. The bifurcation of the proceeds inexcess of the stand-alone selling price of the assets acquired would be allocated to the SA and recognized as a reduction of cost of sales as glass components arepurchased by PGTI. Based on the established stand-alone selling price of the assets sold, as determined by an independent appraisal, approximately $7.7 millionwas allocated to the sale of the assets, with the remaining $20.3 million representing consideration received from Cardinal related to the agreement to buy doorglass components for PGT-branded doors from Cardinal. This consideration is being amortized to income over the 7-year term of the SA.
At the time we ceased using these assets in production, at which time they became available for immediate sale, their net book value was $4.7 million, and theywere reclassified from property, plant and equipment, to assets held for sale within other current assets.
The APA provided for the transfer of the assets from the Company to Cardinal in two phases, with the first date in 2017, and the second date in 2018, on dateswhich the Company and Cardinal agree to use. Under the APA, the cash purchase price of $28 million was to be paid by Cardinal to the Company in three separatepayments of $3 million on or about the time of the first transfer of the assets to Cardinal, $10 million on or about January 15, 2018, and $15 million at or about thetime of the second transfer of assets to Cardinal.
27

Table of Contents
Cardinal paid us $3.0 million in cash on November 1, 2017, and paid us $10.0 million in cash on January 16, 2018, pursuant to the APA. On December 15, 2017,machinery and equipment classified as assets held for sale with net book value of $1.5 million, and fair value of $1.9 million was transferred to Cardinal and theirequipment rigger, and we recognized a gain on disposal for the difference. The remaining machinery and equipment to be transferred to Cardinal in 2018, whichhas a net book value of $3.2 million and fair value of $5.8 million, is classified within other current assets in the accompanying condensed consolidated balancesheets at March 31, 2018, and December 30, 2017.
The SA provides that the Company will purchase, and Cardinal will supply, all the Company’s requirements for certain glass components used in PGT-brandeddoors through the end of 2024. The terms of the manufacture by Cardinal and purchase by the Company of such glass components as to purchase orders, forecastsof purchases, pricing, invoicing, delivery and payment terms and other terms, are all as described in the SA. Early in the fourth quarter of 2017, we beganpurchasing and receiving glass components from Cardinal under the SA. At that time, we began amortizing the advance consideration received from Cardinalvendor initially allocated to the SA and continued to amortize such advance consideration during the three months ended March 31, 2018, recognizing $701thousand of such gain amortization, classified as a reduction to cost of sales in the accompanying condensed consolidated statement of comprehensive income forthe three months ended March 31, 2018.
Contractual Obligations
There have been no significant changes to the “Disclosures of Contractual Obligations and Commercial Commitments” table in Part II, Item 7, “Management’sDiscussion and Analysis of Financial Condition and Results of Operations” of our Annual Report on Form 10-K for the year ended December 30, 2017.
Significant Accounting Policies and Critical Accounting Estimates
Our consolidated financial statements are prepared in accordance with U.S. Generally Accepted Accounting Principles (GAAP). Significant accounting policies arethose that are both important to the accurate portrayal of a Company’s financial condition and results, and those that require subjective or complex judgments, oftenas a result of the need to make estimates about the effect of matters that are inherently uncertain. We make estimates and assumptions that affect the amountsreported in our condensed consolidated financial statements and accompanying notes. Certain estimates are particularly sensitive due to their significance to thecondensed consolidated financial statements and the possibility that future events may be significantly different from our expectations.
We identified our significant accounting policies in our Form 10-K annual report for the year ended December 30, 2017. Except for the adoption of the guidancerelating to revenue recognition pursuant to ASU 2014-09 discussed below, there have been no changes to our critical accounting policies during the first threemonths of 2018.
Recently Issued Accounting Pronouncements
In addition to the following discussion of the status of our adoption of ASU 2016-02, “Leases (Topic 842), see Note 3 to the consolidated financial statementsincluded in our most recent Annual Report on Form 10-K for the year ended December 30, 2017, as filed with the Securities and Exchange Commission onMarch 14, 2018.
In February 2016, the Financial Accounting Standards Board (FASB) issued Accounting Standards Update (ASU) No. 2016-02, “Leases (Topic 842)”. Thisguidance supersedes the existing guidance for lease accounting, Leases (Topic 840). ASU 2016-02 requires lessees to recognize leases on their balance sheets, andleaves lessor accounting largely unchanged. The amendments in this ASU are effective for fiscal years beginning after December 15, 2018 and interim periodswithin those fiscal years. Early application is permitted for all entities. ASU 2016-02 requires a modified retrospective approach for all leases existing at, or enteredinto after, the date of initial application, with an option to elect to use certain transition relief. The Company is currently evaluating the impact of this new standardon its consolidated financial statements.
28

Table of Contents
ITEM 3. QUANTITATIVE AND QUALITATIVE DISCLOSURES ABOUT MARKET RISK
We utilize derivative financial instruments to hedge price movements in aluminum materials used in our manufacturing process. We entered into aluminumhedging instruments that settle at various times through December 2019. Combined with our forward-buy contracts for aluminum, which are not derivativefinancial instruments, but which provide us with protection from increases in aluminum prices, we are covered for approximately 60% of our anticipated needsthrough December 2019 at an average price of $1.10 per pound.
Regarding aluminum hedging instruments the purchase of aluminum, as of March 31, 2018, a 10% decrease in the price of aluminum per pound would decrease thefair value of our forward contracts of aluminum by an estimated $1.2 million. This calculation utilizes our actual commitment of 11.7 million pounds undercontract (to be settled throughout December 2019) and the market price of aluminum as of May 7, 2018. All calculations include estimates for the Midwestpremium.
We experience changes in interest expense when market interest rates change. Changes in our debt could also increase these risks. Based on debt outstanding as ofthe date of filing of this Quarterly Report on Form 10-Q, of $224.0 million, a 100 basis-point increase in interest rate would result in approximately $2.2 million ofadditional interest costs annually.
ITEM 4. CONTROLS AND PROCEDURES
Evaluation of Disclosure Controls and Procedures. Disclosure controls and procedures are controls and other procedures that are designed to ensure thatinformation required to be disclosed in the Company’s reports filed or submitted under the Exchange Act, is recorded, processed, summarized, and reported withinthe time periods specified in the Securities and Exchange Commission’s rules and forms.
A control system, however, no matter how well conceived and operated, can at best provide reasonable, not absolute, assurance that the objectives of the controlsystem are met. Additionally, a control system reflects the fact that there are resource constraints, and the benefits of controls must be considered relative to costs.Because of the inherent limitations in all control systems, no evaluation of controls can provide absolute assurance that all control issues and instances of error orfraud, if any, within our Company have been detected, and due to these inherent limitations, misstatements due to error or fraud may occur and not be detected.
Our chief executive officer and chief financial officer, with the assistance of management, evaluated the design, operation and effectiveness of our disclosurecontrols and procedures (as defined in Rules 13a-15(e) and 15d-15(e) under the Exchange Act) as of the end of the period covered by this report (“EvaluationDate”). Based on that evaluation, our chief executive officer and chief financial officer concluded that, as of the Evaluation Date, our disclosure controls andprocedures were effective for the purposes of ensuring that information required to be disclosed in our reports filed under the Exchange Act is recorded, processed,summarized, and reported within the time periods specified in the Securities and Exchange Commission’s rules and forms, and that such information isaccumulated and communicated to management, including our chief executive officer and chief financial officer, as appropriate to allow timely decisions regardingrequired disclosure.
Changes in Internal Control over Financial Reporting.
Except as discussed below, during the period covered by this report, there have been no changes in our internal control over financial reporting identified inconnection with the evaluation described above that have materially affected, or are reasonably likely to materially affect, our internal control over financialreporting.
During the three months ended March 31, 2018, we implemented changes to our processes in response to the adoption of ASU No. 2014-09 “Revenue fromContracts with Customers (Topic 606)” that became effective December 31, 2017 (the first day of our 2018 fiscal year). While the adoption of ASU 2014-09 didnot have a significant impact on our financial position as of December 31, 2017 (the effective date of our adoption and the first day of our 2018 fiscal year), or onour results of operations or our cash flows for the three months ended March 31, 2018, it resulted in process changes in our internal control over financial reportingrelating to the addition of a method for calculating the value of sales assigned to finished but undelivered product, and for certain unused glass components onhand, at the end of a reporting period. The operating effectiveness of these changes will be evaluated in subsequent periods during 2018.
29

Table of Contents
PART II — OTHER INFORMATION
ITEM 1. LEGAL PROCEEDINGS
We are involved in various claims and lawsuits incidental to the conduct of our business in the ordinary course. We carry insurance coverage in such amounts inexcess of our self-insured retention as we believe to be reasonable under the circumstances and that may or may not cover any or all of our liabilities with respect toclaims and lawsuits. We do not believe that the ultimate resolution of the matters pending or threatened against us at this time will have a material adverse impacton our financial position or results of operations.
Although our business and facilities are subject to federal, state, and local environmental regulation, environmental regulation does not have a material impact onour operations. We believe that our facilities are in material compliance with such laws and regulations. As owners and lessees of real property, we can be heldliable for the investigation or remediation of contamination on such properties, in some circumstances without regard to whether we knew of or were responsiblefor such contamination. Our current expenditures with respect to environmental investigation and remediation at our facilities are minimal, although no assurancecan be provided that more significant remediation may not be required in the future as a result of spills or releases of petroleum products or hazardous substances,or the discovery of previously unknown environmental conditions.
ITEM 1A. RISK FACTORS
In addition to the other information set forth in this report, you should carefully consider the factors discussed in Part 1, “Item 1A. Risk Factors” of our Form 10-Kannual report for the year ended December 30, 2017, which could materially affect our business, financial condition, or future results.
Additional risk and uncertainties not currently known to us or that we currently deem to be immaterial, may also materially adversely affect our business, financialcondition, and/or operating results.
ITEM 2. UNREGISTERED SALES OF EQUITY SECURITIES AND USE OF PROCEEDS
Unregistered Sales of Equity Securities and Use of Proceeds
None during the quarter.
Issuer Purchases of Equity
None during the quarter.
ITEM 3. DEFAULTS UPON SENIOR SECURITIES
None.
ITEM 4. MINE SAFETY DISCLOSURE
Not applicable.
ITEM 5. OTHER INFORMATION
None.
30

Table of Contents
ITEM 6. EXHIBITS 10.1
Second Amendment to Credit Agreement, dated March 16, 2018 by and among PGT Innovations, Inc., a Delaware corporation, the other CreditParties (as defined in the Credit Agreement) party hereto, the Lenders party hereto, SunTrust Bank, as Administrative Agent, Collateral Agent,Swing Line Lender and an LC Issuer and Deutsche Bank AG New York Branch, as resigning Administrative Agent, resigning Collateral Agent,resigning Swing Line Lender and a resigning LC Issuer (incorporated by reference to Exhibit 10.1 of the Registrant’s Current Report on Form 8-K, filed with the SEC on March 20, 2018).
31.1* Certification of Chief Executive Officer pursuant to Section 302 of the Sarbanes-Oxley Act of 2002
31.2* Certification of Chief Financial Officer pursuant to Section 302 of the Sarbanes-Oxley Act of 2002
32.1**
Certification of Chief Executive Officer pursuant to 18 U.S.C. Section 1350, as adopted pursuant to Section 906 of the Sarbanes-Oxley Act of2002
32.2** Certification of Chief Financial Officer pursuant to 18 U.S.C. Section 1350, as adopted pursuant to Section 906 of the Sarbanes-Oxley Act of 2002
101.INS* XBRL Instance Document
101.SCH* XBRL Taxonomy Extension Schema
101.CAL* XBRL Taxonomy Extension Calculation Linkbase
101.DEF* XBRL Taxonomy Definition Linkbase
101.LAB* XBRL Taxonomy Extension Label Linkbase
101.PRE* XBRL Taxonomy Extension Presentation Linkbase * Filed herewith.** Furnished herewith.
31

Table of Contents
SIGNATURE
Pursuant to the requirements of the Securities Exchange Act of 1934, the Registrant has duly caused this report to be signed on its behalf by the undersignedthereunto duly authorized.
PGT INNOVATIONS, INC. (Registrant)
Date: May 8, 2018 /s/ Brad West Brad West Chief Financial Officer and Senior Vice President
32

Exhibit 31.1
Certification of Chief Executive OfficerPursuant to Section 302 of the Sarbanes-Oxley Act of 2002
I, Jeffrey T. Jackson, certify that:
1. I have reviewed this report on Form 10-Q for the quarter ended March 31, 2018, of PGT Innovations, Inc.;
2. Based on my knowledge, this report does not contain any untrue statement of a material fact or omit to state a material fact necessary to make thestatements made, in light of the circumstances under which such statements were made, not misleading with respect to the period covered by this report;
3. Based on my knowledge, the financial statements, and other financial information included in this report, fairly present in all material respects thefinancial condition, results of operations and cash flows of the registrant as of, and for, the periods presented in this report;
4. The registrant’s other certifying officer(s) and I are responsible for establishing and maintaining disclosure controls and procedures (as defined inExchange Act Rules 13a-15(e) and 15d-15(e)) and internal control over financial reporting (as defined by Exchange Act Rules 13a-15(f) and 15d-15(f)) for theregistrant and have:
(a) Designed such disclosure controls and procedures, or caused such disclosure controls and procedures to be designed under our supervision, toensure that material information relating to the registrant, including its consolidated subsidiaries, is made known to us by others within those entities,particularly during the period in which this report is being prepared;
(b) Designed such internal control over financial reporting, or caused such internal control over financial reporting to be designed under oursupervision, to provide reasonable assurance regarding the reliability of financial reporting and the preparation of financial statements for external purposesin accordance with generally accepted accounting principles;
(c) Evaluated the effectiveness of the registrant’s disclosure controls and procedures and presented in this report our conclusions about theeffectiveness of the disclosure controls and procedures, as of the end of the period covered by this report based on such evaluation; and
(d) Disclosed in this report any change in the registrant’s internal control over financial reporting that occurred during the registrant’s most recentfiscal quarter (the registrant’s fourth fiscal quarter in the case of an annual report) that has materially affected, or is reasonably likely to materially affect, theregistrant’s internal control over financial reporting.
5. The registrant’s other certifying officer(s) and I have disclosed, based on our most recent evaluation of internal control over financial reporting, to theregistrant’s auditors and the audit committee of the registrant’s board of directors (or persons performing the equivalent functions):
(a) All significant deficiencies and material weaknesses in the design or operation of internal control over financial reporting which are reasonablylikely to adversely affect the registrant’s ability to record, process, summarize and report financial information; and
(b) Any fraud, whether or not material, that involves management or other employees who have a significant role in the registrant’s internal controlover financial reporting.
/s/ Jeffrey T. JacksonJeffrey T. JacksonChief Executive Officer and President
Date: May 8, 2018

Exhibit 31.2
Certification of Chief Financial OfficerPursuant to Section 302 of the Sarbanes-Oxley Act of 2002
I, Brad West, certify that:
1. I have reviewed this report on Form 10-Q for the quarter ended March 31, 2018, of PGT Innovations, Inc.;
2. Based on my knowledge, this report does not contain any untrue statement of a material fact or omit to state a material fact necessary to make thestatements made, in light of the circumstances under which such statements were made, not misleading with respect to the period covered by this report;
3. Based on my knowledge, the financial statements, and other financial information included in this report, fairly present in all material respects thefinancial condition, results of operations and cash flows of the registrant as of, and for, the periods presented in this report;
4. The registrant’s other certifying officer(s) and I are responsible for establishing and maintaining disclosure controls and procedures (as defined inExchange Act Rules 13a-15(e) and 15d-15(e)) and internal control over financial reporting (as defined by Exchange Act Rules 13a-15(f) and 15d-15(f)) for theregistrant and have:
(a) Designed such disclosure controls and procedures, or caused such disclosure controls and procedures to be designed under our supervision, toensure that material information relating to the registrant, including its consolidated subsidiaries, is made known to us by others within those entities,particularly during the period in which this report is being prepared;
(b) Designed such internal control over financial reporting, or caused such internal control over financial reporting to be designed under oursupervision, to provide reasonable assurance regarding the reliability of financial reporting and the preparation of financial statements for external purposesin accordance with generally accepted accounting principles;
(c) Evaluated the effectiveness of the registrant’s disclosure controls and procedures and presented in this report our conclusions about theeffectiveness of the disclosure controls and procedures, as of the end of the period covered by this report based on such evaluation; and
(d) Disclosed in this report any change in the registrant’s internal control over financial reporting that occurred during the registrant’s most recentfiscal quarter (the registrant’s fourth fiscal quarter in the case of an annual report) that has materially affected, or is reasonably likely to materially affect, theregistrant’s internal control over financial reporting.
5. The registrant’s other certifying officer(s) and I have disclosed, based on our most recent evaluation of internal control over financial reporting, to theregistrant’s auditors and the audit committee of the registrant’s board of directors (or persons performing the equivalent functions):
(a) All significant deficiencies and material weaknesses in the design or operation of internal control over financial reporting which are reasonablylikely to adversely affect the registrant’s ability to record, process, summarize and report financial information; and
(b) Any fraud, whether or not material, that involves management or other employees who have a significant role in the registrant’s internal controlover financial reporting.
/s/ Brad WestBrad WestChief Financial Officer and Senior Vice President
Date: May 8, 2018

Exhibit 32.1
Certification of CEO Pursuant to 18 U.S.C. Section 1350(Adopted Pursuant to Section 906 of the Sarbanes-Oxley Act of 2002)
In connection with the quarterly report on Form 10-Q of PGT Innovations, Inc. (the “Company”) for the quarterly period ended March 31, 2018, as filed with theSecurities and Exchange Commission on the date hereof (the “Report”), I, Jeffrey T. Jackson, as Chief Executive Officer and President of the Company, certify,pursuant to 18 U.S.C. Section 1350, as adopted pursuant to Section 906 of the Sarbanes-Oxley Act of 2002, that, to my knowledge:
(1) The Report fully complies with the requirements of Section 13(a) or Section 15(d) of the Securities Exchange Act of 1934; and
(2) The information contained in the Report fairly presents, in all material respects, the financial condition and results of operations of the Company.
/s/ Jeffrey T. JacksonJeffrey T. JacksonChief Executive Officer and President
Date: May 8, 2018
A signed original of this written statement required by Section 906 has been provided to PGT Innovations, Inc. and will be retained by PGT Innovations, Inc. andfurnished to the Securities and Exchange Commission or its staff upon request.

Exhibit 32.2
Certification of CFO Pursuant to 18 U.S.C. Section 1350(Adopted Pursuant to Section 906 of the Sarbanes-Oxley Act of 2002)
In connection with the quarterly report on Form 10-Q of PGT Innovations, Inc. (the “Company”) for the quarterly period ended March 31, 2018, as filed with theSecurities and Exchange Commission on the date hereof (the “Report”), I, Brad West, as Chief Financial Officer and Senior Vice President of the Company,certify, pursuant to 18 U.S.C. Section 1350, as adopted pursuant to Section 906 of the Sarbanes-Oxley Act of 2002, that, to my knowledge:
(1) The Report fully complies with the requirements of Section 13(a) or Section 15(d) of the Securities Exchange Act of 1934; and
(2) The information contained in the Report fairly presents, in all material respects, the financial condition and results of operations of the Company.
/s/ Brad WestBrad WestChief Financial Officer and Senior Vice President
Date: May 8, 2018
A signed original of this written statement required by Section 906 has been provided to PGT Innovations, Inc. and will be retained by PGT Innovations, Inc. andfurnished to the Securities and Exchange Commission or its staff upon request.