Embed Size (px)
Citation preview
1 R E L I A B I L I T Y • A F F O R D A B I L I T Y • E N V I R O N M E N T A L S T E W A R D S H I P 1 R E L I A B I L I T Y • A F F O R D A B I L I T Y • E N V I R O N M E N T A L S T E W A R D S H I P
O U C E V P R O G R E S S U P D A T E Get Ready Central Florida Stakeholder Meeting
January 27, 2012
Jennifer Szaro Manager, Renewables
2 R E L I A B I L I T Y • A F F O R D A B I L I T Y • E N V I R O N M E N T A L S T E W A R D S H I P
2011 2012 2013 2014 2015 2016 2017 2018 2019
2010 - 2011Near Term PlanningInitial EV Vehicle IntroductionsTransformer Mgmt. ApproachCustomer Outreach ApproachChargepoint GrantNissan Fleet PartnershipProject Get ReadyData Collection and Analysis
Oct 10Smart Car Release
Dec 11Chevy Volt Release
Sep 11Nissan LEAF Release
2015 - 2019Long-Term PlanningWidespread EV AdoptionGeneration PlanningTOU or Real-Time PricingFull Scale Customer Demand ResponseFeeder/Substation Upgrades
2012 - 2014Mid-Term PlanningEV Releases by Every Major ManufacturerPilot Customer OfferingsMeter Data IntegrationAutomated Demand Response PilotsPotential Transformer Upgrades
Jul 12
Ford Focus Release
20177,500 EVs
20154,000 EVs
Nov 12End of ChargePoint Grant
201913,000 EVs
3 R E L I A B I L I T Y • A F F O R D A B I L I T Y • E N V I R O N M E N T A L S T E W A R D S H I P
Lots of hand-raisers, but order fulfillment is slow ◦ Ranked third nationally in customer
interest by JD Power ◦ Expecting 300 vehicles this year ◦ Eight known Volt customers delivered
(could be more) ◦ A few dozen LEAF owners ◦ A few conversion vehicles ◦ Trying to identify better tracking
mechanisms
4 R E L I A B I L I T Y • A F F O R D A B I L I T Y • E N V I R O N M E N T A L S T E W A R D S H I P
-
2,000
4,000
6,000
8,000
10,000
12,000
14,000
16,000
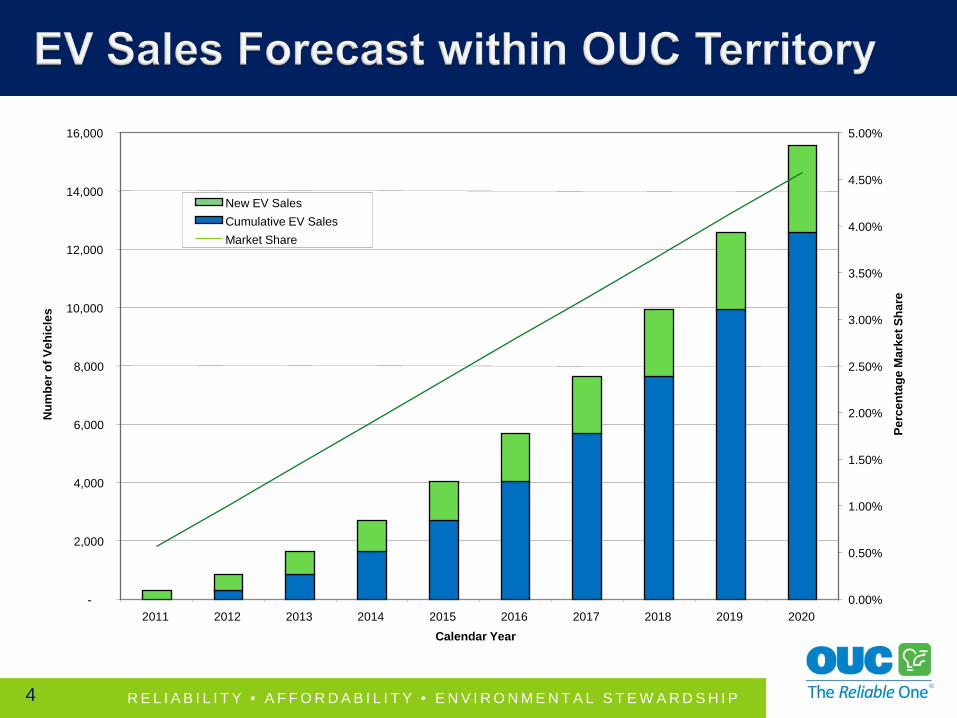
2011 2012 2013 2014 2015 2016 2017 2018 2019 2020 Calendar Year
Num
ber o
f Veh
icle
s
0.00%
0.50%
1.00%
1.50%
2.00%
2.50%
3.00%
3.50%
4.00%
4.50%
5.00%
Perc
enta
ge M
arke
t Sha
re
New EV Sales Cumulative EV Sales Market Share
5 R E L I A B I L I T Y • A F F O R D A B I L I T Y • E N V I R O N M E N T A L S T E W A R D S H I P
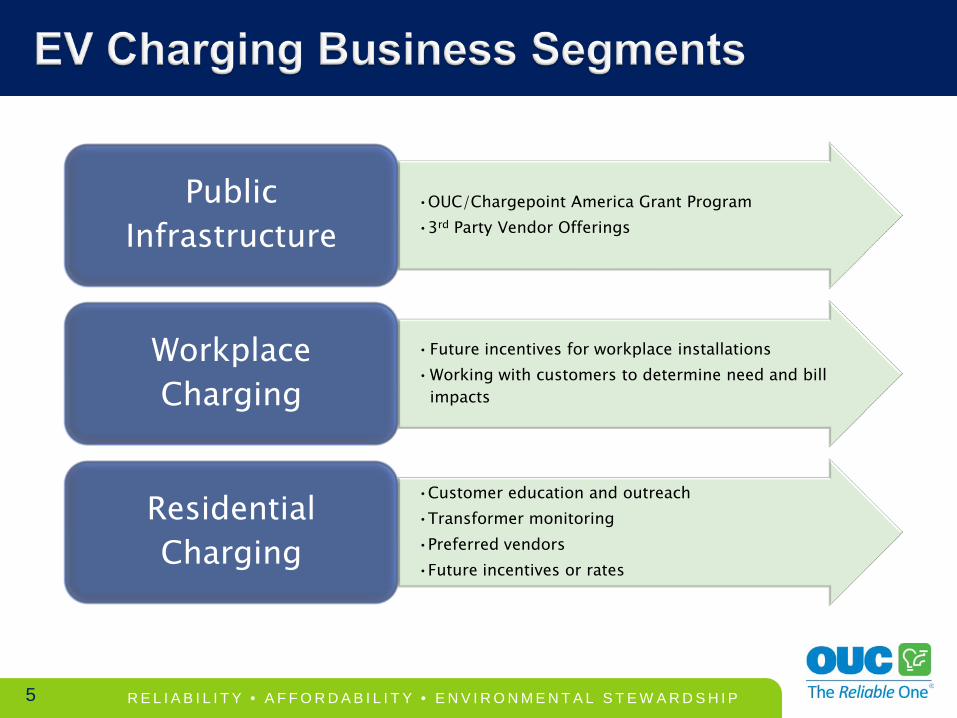
•OUC/Chargepoint America Grant Program •3rd Party Vendor Offerings
Public Infrastructure
•Future incentives for workplace installations •Working with customers to determine need and bill
impacts
Workplace Charging
•Customer education and outreach •Transformer monitoring •Preferred vendors •Future incentives or rates
Residential Charging
6 R E L I A B I L I T Y • A F F O R D A B I L I T Y • E N V I R O N M E N T A L S T E W A R D S H I P
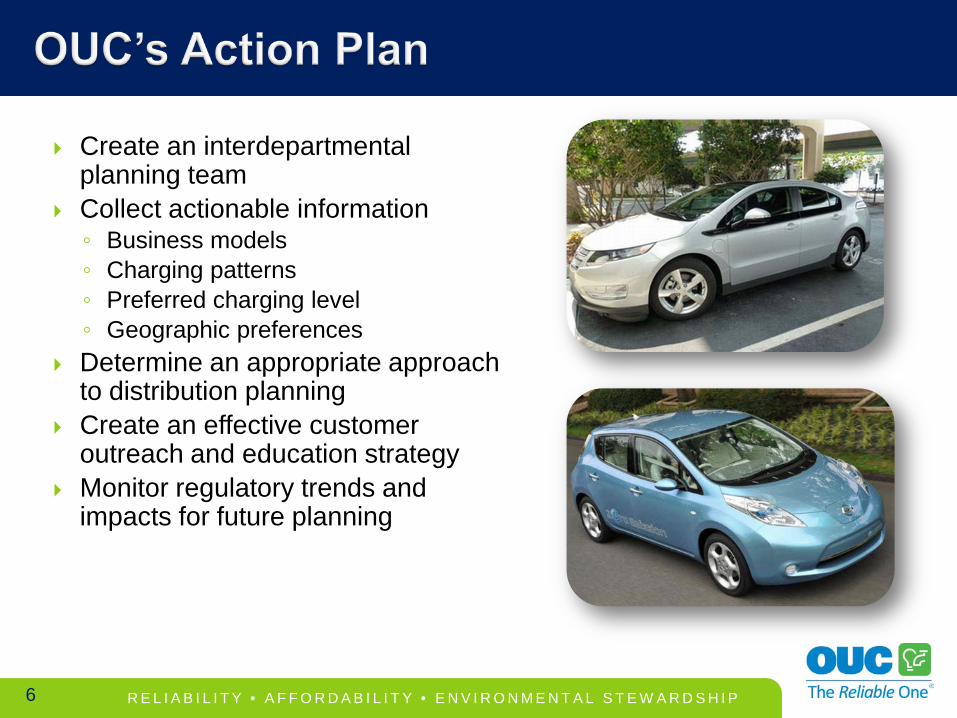
Create an interdepartmental planning team
Collect actionable information ◦ Business models ◦ Charging patterns ◦ Preferred charging level ◦ Geographic preferences
Determine an appropriate approach to distribution planning
Create an effective customer outreach and education strategy
Monitor regulatory trends and impacts for future planning
7 R E L I A B I L I T Y • A F F O R D A B I L I T Y • E N V I R O N M E N T A L S T E W A R D S H I P
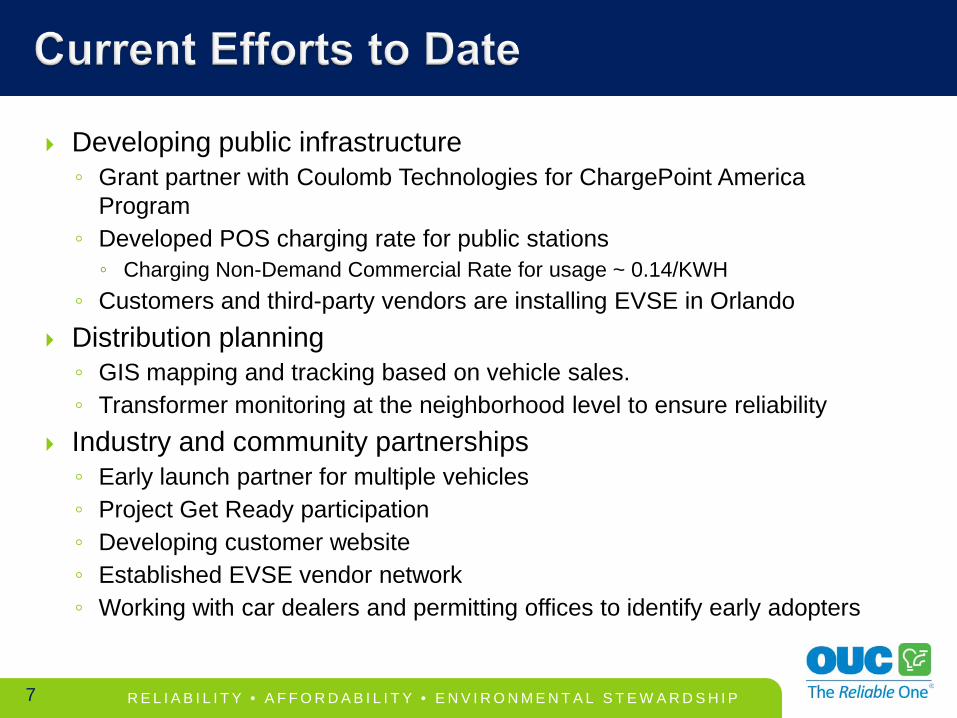
Developing public infrastructure ◦ Grant partner with Coulomb Technologies for ChargePoint America
Program ◦ Developed POS charging rate for public stations ◦ Charging Non-Demand Commercial Rate for usage ~ 0.14/KWH
◦ Customers and third-party vendors are installing EVSE in Orlando Distribution planning ◦ GIS mapping and tracking based on vehicle sales. ◦ Transformer monitoring at the neighborhood level to ensure reliability
Industry and community partnerships ◦ Early launch partner for multiple vehicles ◦ Project Get Ready participation ◦ Developing customer website ◦ Established EVSE vendor network ◦ Working with car dealers and permitting offices to identify early adopters
8 R E L I A B I L I T Y • A F F O R D A B I L I T Y • E N V I R O N M E N T A L S T E W A R D S H I P
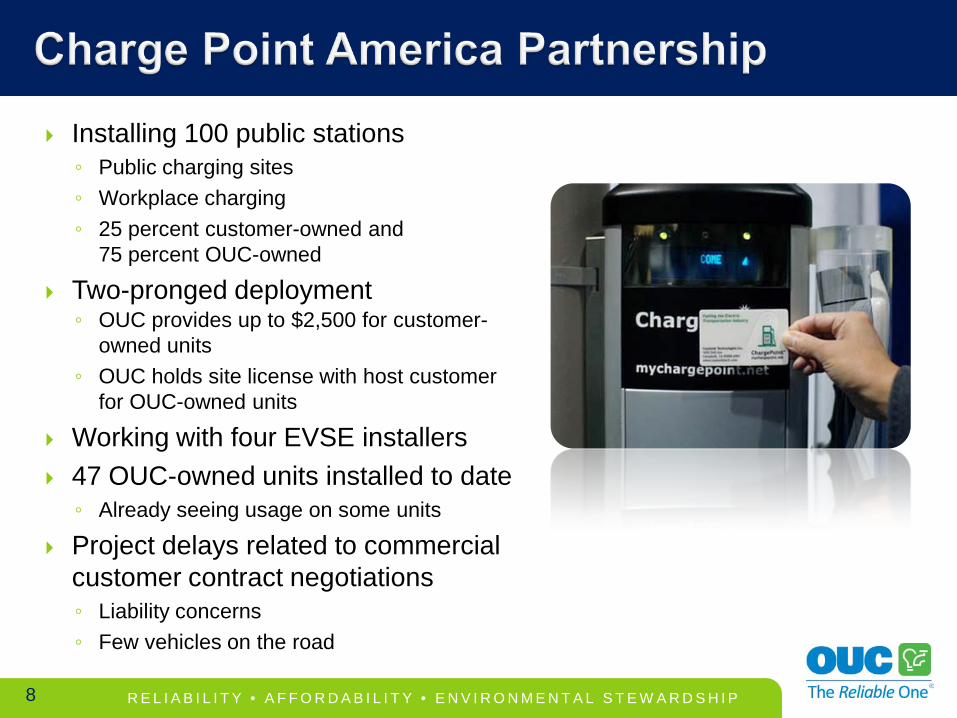
Installing 100 public stations ◦ Public charging sites ◦ Workplace charging ◦ 25 percent customer-owned and
75 percent OUC-owned
Two-pronged deployment ◦ OUC provides up to $2,500 for customer-
owned units ◦ OUC holds site license with host customer
for OUC-owned units
Working with four EVSE installers 47 OUC-owned units installed to date ◦ Already seeing usage on some units
Project delays related to commercial customer contract negotiations ◦ Liability concerns ◦ Few vehicles on the road
9 R E L I A B I L I T Y • A F F O R D A B I L I T Y • E N V I R O N M E N T A L S T E W A R D S H I P
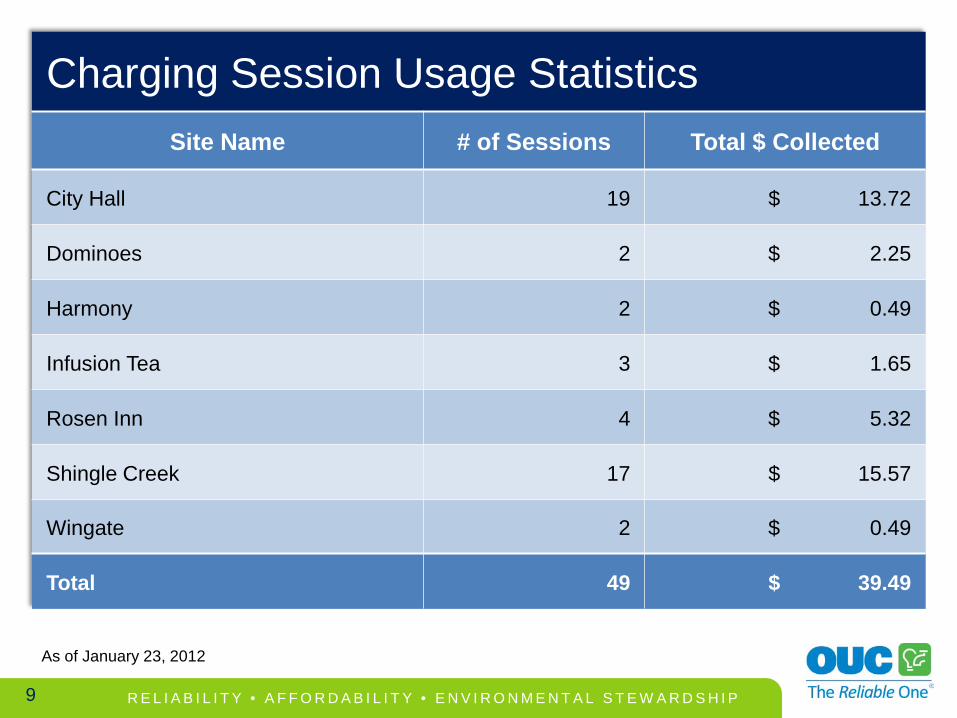
Charging Session Usage Statistics Site Name # of Sessions Total $ Collected
City Hall 19 $ 13.72
Dominoes 2 $ 2.25
Harmony 2 $ 0.49
Infusion Tea 3 $ 1.65
Rosen Inn 4 $ 5.32
Shingle Creek 17 $ 15.57
Wingate 2 $ 0.49
Total 49 $ 39.49
As of January 23, 2012
10 R E L I A B I L I T Y • A F F O R D A B I L I T Y • E N V I R O N M E N T A L S T E W A R D S H I P
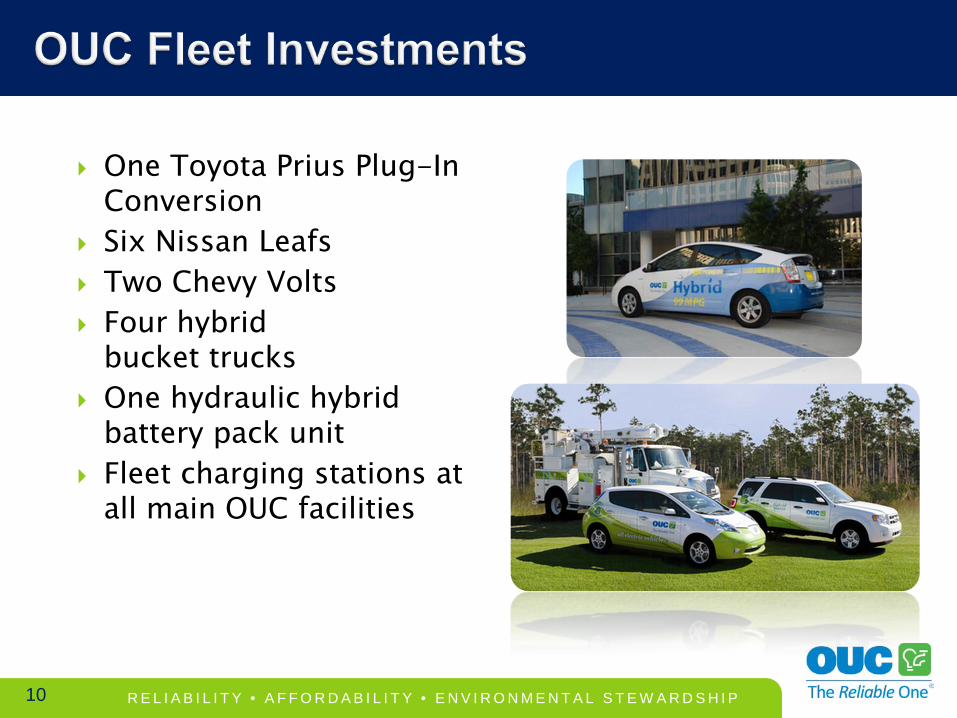
One Toyota Prius Plug-In Conversion
Six Nissan Leafs Two Chevy Volts Four hybrid
bucket trucks One hydraulic hybrid
battery pack unit Fleet charging stations at
all main OUC facilities
11 R E L I A B I L I T Y • A F F O R D A B I L I T Y • E N V I R O N M E N T A L S T E W A R D S H I P
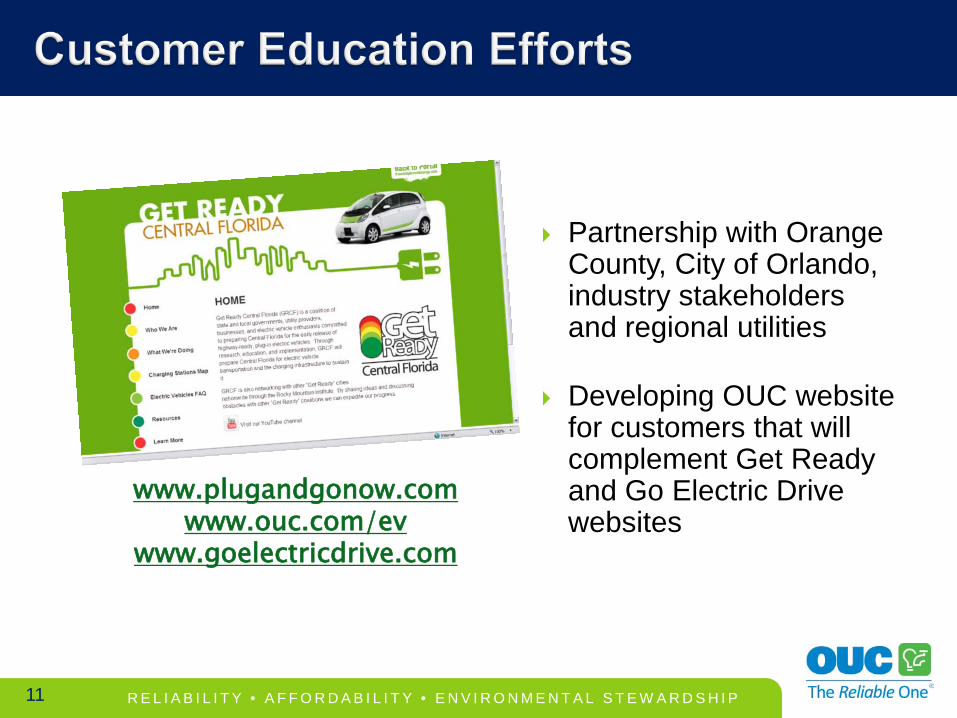
Partnership with Orange County, City of Orlando, industry stakeholders and regional utilities
Developing OUC website for customers that will complement Get Ready and Go Electric Drive websites
www.plugandgonow.com www.ouc.com/ev
www.goelectricdrive.com

12 R E L I A B I L I T Y • A F F O R D A B I L I T Y • E N V I R O N M E N T A L S T E W A R D S H I P